Zip Codes with the Highest Percentage of Population Employed in Installation, Maintenance & Repair in Ormond Beach, FL
RELATED REPORTS & OPTIONS
Installation, Maintenance & Repair
Ormond Beach
Compare Zip Codes
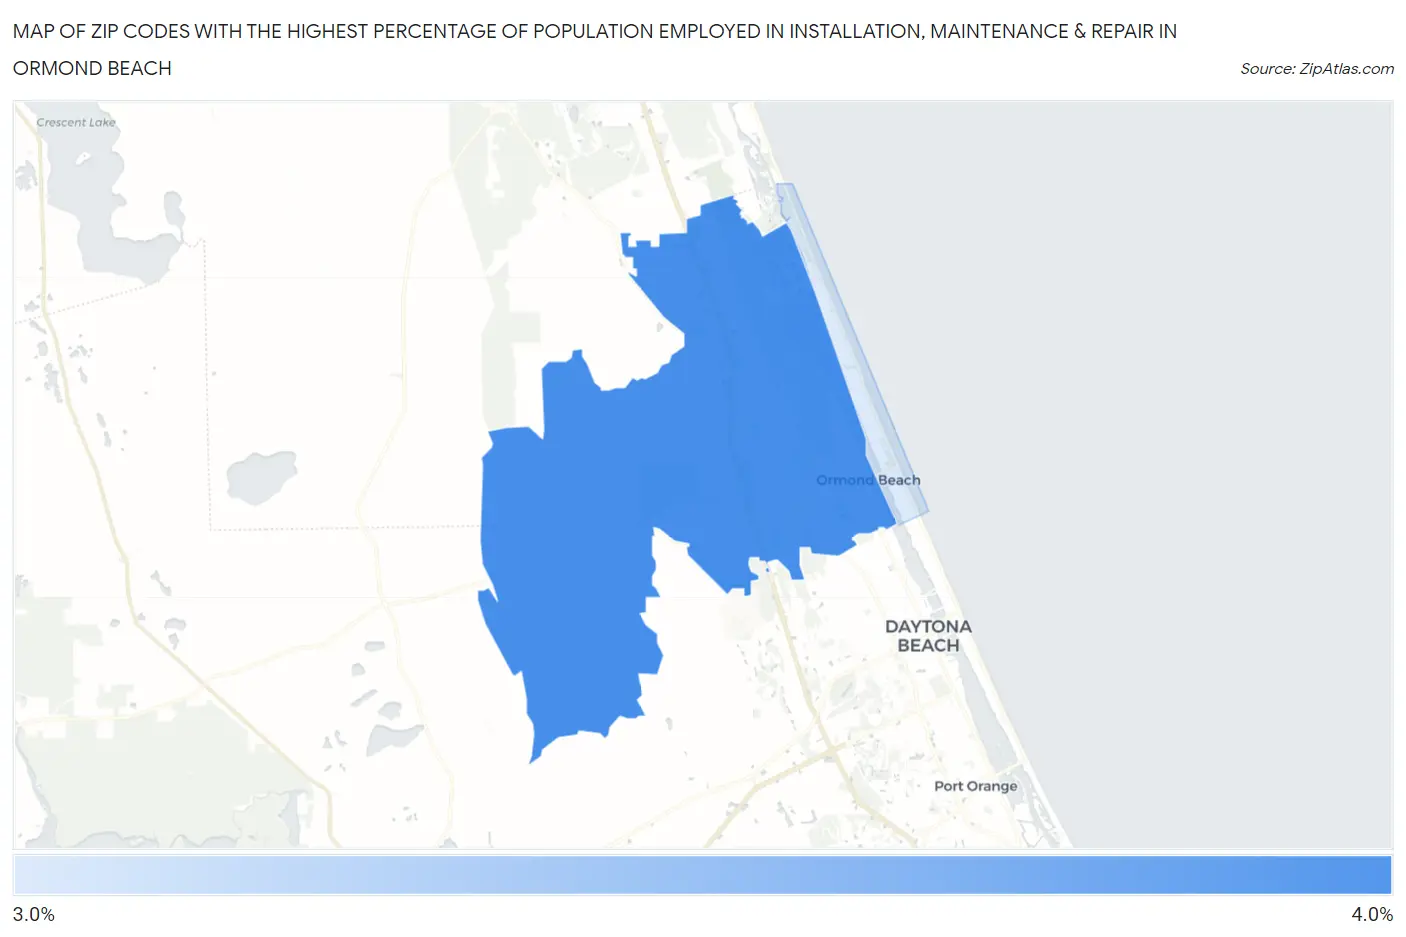
Map of Zip Codes with the Highest Percentage of Population Employed in Installation, Maintenance & Repair in Ormond Beach
3.3%
3.8%
Zip Codes with the Highest Percentage of Population Employed in Installation, Maintenance & Repair in Ormond Beach, FL
| Zip Code | % Employed | vs State | vs National | |
| 1. | 32174 | 3.8% | 3.3%(+0.549)#341 | 3.1%(+0.767)#13,092 |
| 2. | 32176 | 3.3% | 3.3%(-0.011)#466 | 3.1%(+0.207)#15,686 |
1
Common Questions
What are the Top Zip Codes with the Highest Percentage of Population Employed in Installation, Maintenance & Repair in Ormond Beach, FL?
Top Zip Codes with the Highest Percentage of Population Employed in Installation, Maintenance & Repair in Ormond Beach, FL are:
What zip code has the Highest Percentage of Population Employed in Installation, Maintenance & Repair in Ormond Beach, FL?
32174 has the Highest Percentage of Population Employed in Installation, Maintenance & Repair in Ormond Beach, FL with 3.8%.
What is the Percentage of Population Employed in Installation, Maintenance & Repair in Ormond Beach, FL?
Percentage of Population Employed in Installation, Maintenance & Repair in Ormond Beach is 2.6%.
What is the Percentage of Population Employed in Installation, Maintenance & Repair in Florida?
Percentage of Population Employed in Installation, Maintenance & Repair in Florida is 3.3%.
What is the Percentage of Population Employed in Installation, Maintenance & Repair in the United States?
Percentage of Population Employed in Installation, Maintenance & Repair in the United States is 3.1%.