Zip Codes with the Highest Percentage of Population Employed in Architecture & Engineering in Ormond Beach, FL
RELATED REPORTS & OPTIONS
Architecture & Engineering
Ormond Beach
Compare Zip Codes
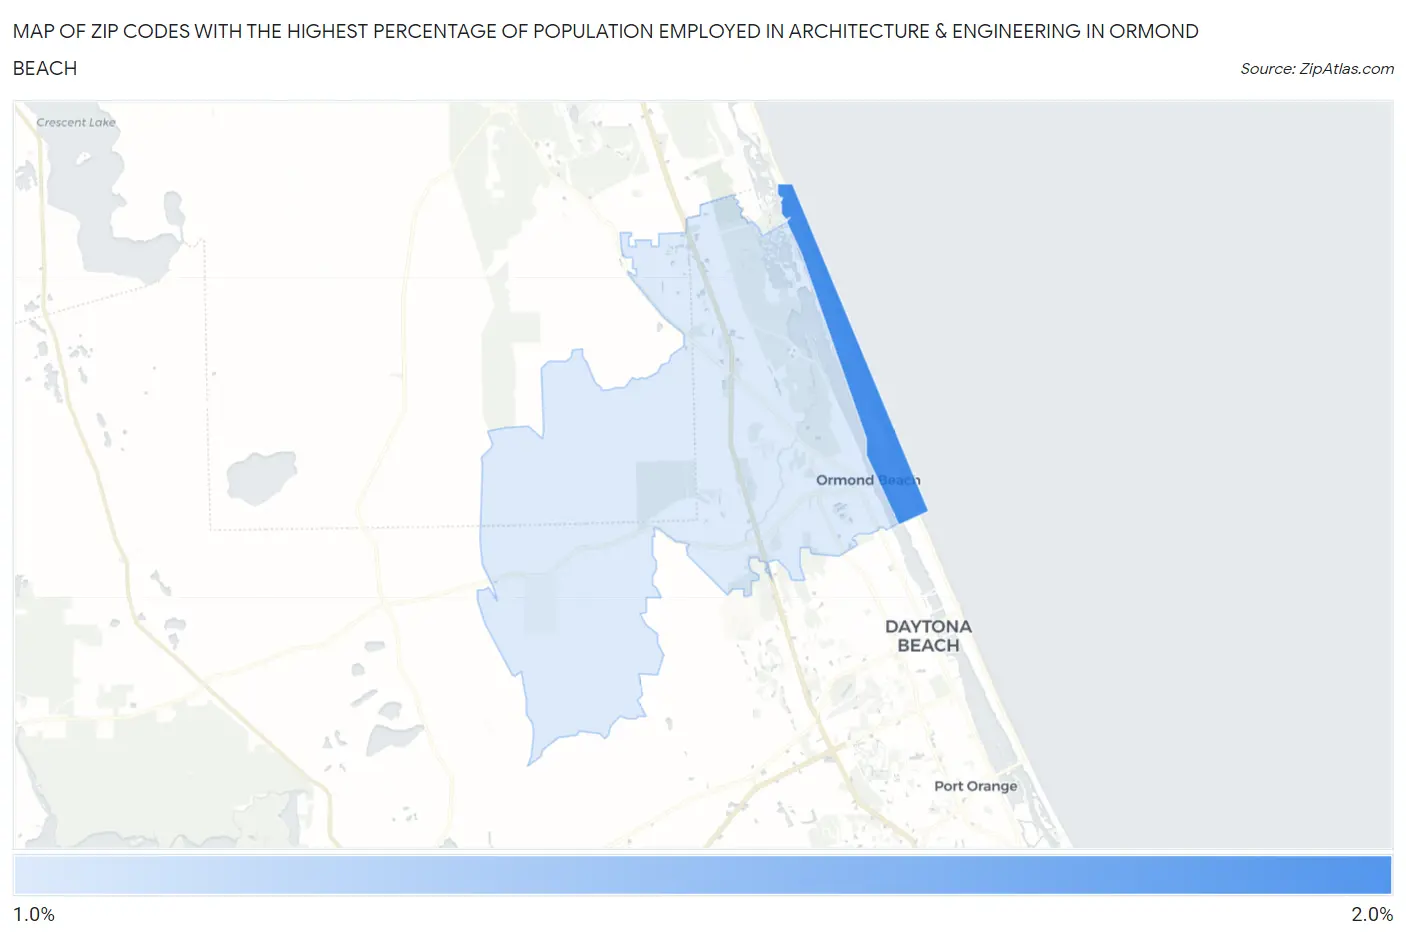
Map of Zip Codes with the Highest Percentage of Population Employed in Architecture & Engineering in Ormond Beach
1.1%
1.8%
Zip Codes with the Highest Percentage of Population Employed in Architecture & Engineering in Ormond Beach, FL
| Zip Code | % Employed | vs State | vs National | |
| 1. | 32176 | 1.8% | 1.6%(+0.166)#287 | 2.1%(-0.385)#11,045 |
| 2. | 32174 | 1.1% | 1.6%(-0.455)#530 | 2.1%(-1.00)#15,526 |
1
Common Questions
What are the Top Zip Codes with the Highest Percentage of Population Employed in Architecture & Engineering in Ormond Beach, FL?
Top Zip Codes with the Highest Percentage of Population Employed in Architecture & Engineering in Ormond Beach, FL are:
What zip code has the Highest Percentage of Population Employed in Architecture & Engineering in Ormond Beach, FL?
32176 has the Highest Percentage of Population Employed in Architecture & Engineering in Ormond Beach, FL with 1.8%.
What is the Percentage of Population Employed in Architecture & Engineering in Ormond Beach, FL?
Percentage of Population Employed in Architecture & Engineering in Ormond Beach is 0.89%.
What is the Percentage of Population Employed in Architecture & Engineering in Florida?
Percentage of Population Employed in Architecture & Engineering in Florida is 1.6%.
What is the Percentage of Population Employed in Architecture & Engineering in the United States?
Percentage of Population Employed in Architecture & Engineering in the United States is 2.1%.