Zip Codes with the Highest Percentage of Population Employed in Legal Services & Support in Guaynabo, PR
RELATED REPORTS & OPTIONS
Legal Services & Support
Guaynabo
Compare Zip Codes
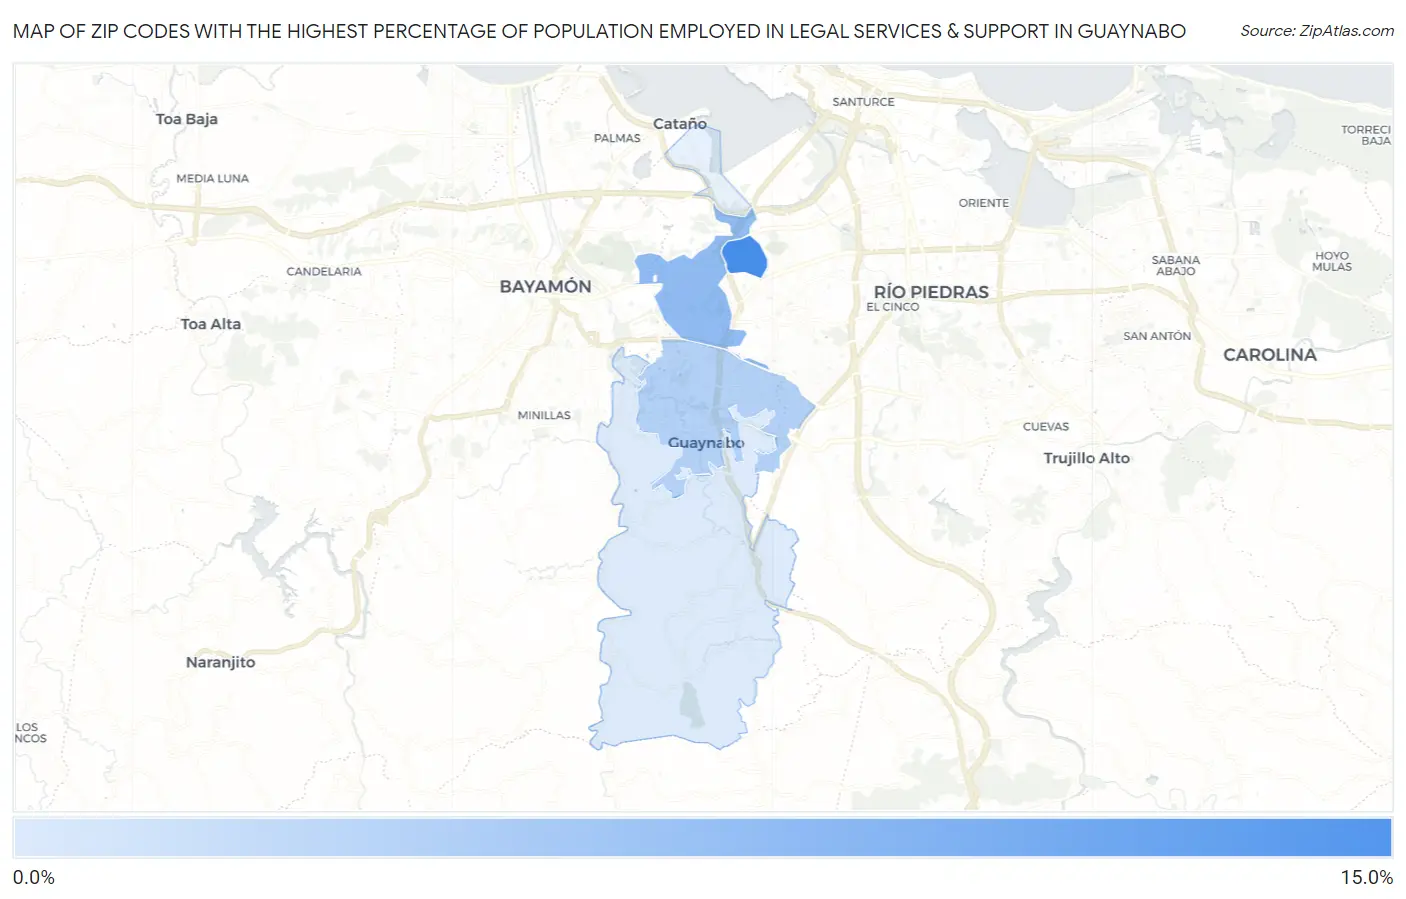
Map of Zip Codes with the Highest Percentage of Population Employed in Legal Services & Support in Guaynabo
0.54%
14.2%
Zip Codes with the Highest Percentage of Population Employed in Legal Services & Support in Guaynabo, PR
| Zip Code | % Employed | vs State | vs National | |
| 1. | 00968 | 14.2% | 1.0%(+13.2)#2 | 1.2%(+13.0)#90 |
| 2. | 00966 | 7.3% | 1.0%(+6.31)#6 | 1.2%(+6.12)#313 |
| 3. | 00969 | 4.1% | 1.0%(+3.06)#9 | 1.2%(+2.88)#1,098 |
| 4. | 00971 | 0.54% | 1.0%(-0.456)#60 | 1.2%(-0.639)#12,111 |
1
Common Questions
What are the Top 3 Zip Codes with the Highest Percentage of Population Employed in Legal Services & Support in Guaynabo, PR?
Top 3 Zip Codes with the Highest Percentage of Population Employed in Legal Services & Support in Guaynabo, PR are:
What zip code has the Highest Percentage of Population Employed in Legal Services & Support in Guaynabo, PR?
00968 has the Highest Percentage of Population Employed in Legal Services & Support in Guaynabo, PR with 14.2%.
What is the Percentage of Population Employed in Legal Services & Support in Guaynabo, PR?
Percentage of Population Employed in Legal Services & Support in Guaynabo is 4.6%.
What is the Percentage of Population Employed in Legal Services & Support in Puerto Rico?
Percentage of Population Employed in Legal Services & Support in Puerto Rico is 1.0%.
What is the Percentage of Population Employed in Legal Services & Support in the United States?
Percentage of Population Employed in Legal Services & Support in the United States is 1.2%.