Zip Codes with the Highest Percentage of Local Government Employees in Guaynabo, PR
RELATED REPORTS & OPTIONS
Local Government Employees
Guaynabo
Compare Zip Codes
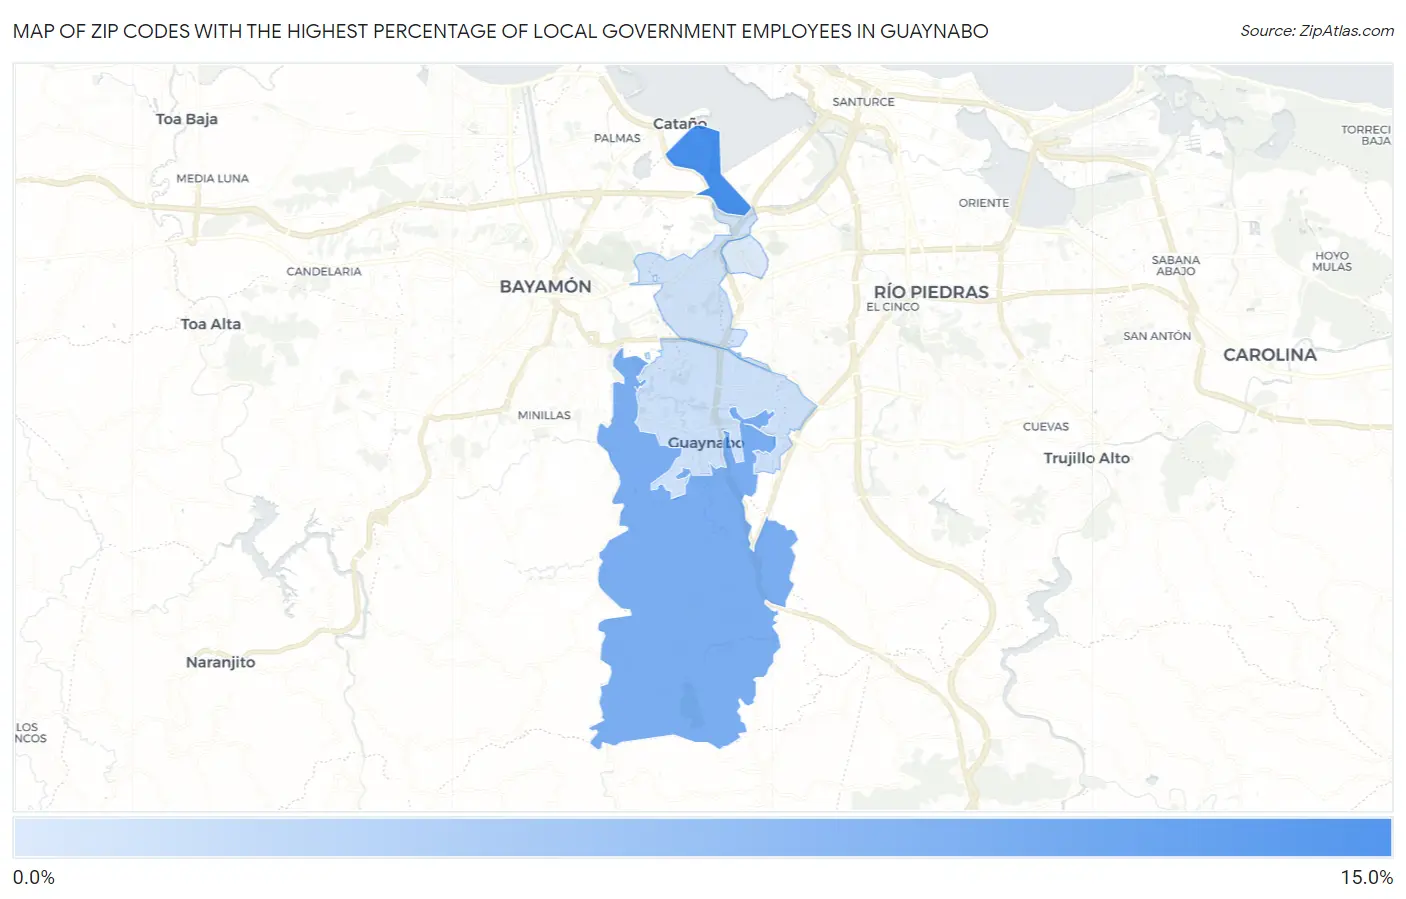
Map of Zip Codes with the Highest Percentage of Local Government Employees in Guaynabo
2.9%
12.2%
Zip Codes with the Highest Percentage of Local Government Employees in Guaynabo, PR
| Zip Code | % Local Government Employees | vs State | vs National | |
| 1. | 00965 | 12.2% | 5.6%(+6.61)#7 | 7.2%(+4.95)#5,090 |
| 2. | 00971 | 8.9% | 5.6%(+3.30)#20 | 7.2%(+1.64)#10,874 |
| 3. | 00969 | 3.8% | 5.6%(-1.76)#100 | 7.2%(-3.43)#26,132 |
| 4. | 00966 | 3.7% | 5.6%(-1.92)#103 | 7.2%(-3.58)#26,435 |
| 5. | 00968 | 2.9% | 5.6%(-2.71)#115 | 7.2%(-4.37)#27,752 |
1
Common Questions
What are the Top 3 Zip Codes with the Highest Percentage of Local Government Employees in Guaynabo, PR?
Top 3 Zip Codes with the Highest Percentage of Local Government Employees in Guaynabo, PR are:
What zip code has the Highest Percentage of Local Government Employees in Guaynabo, PR?
00965 has the Highest Percentage of Local Government Employees in Guaynabo, PR with 12.2%.
What is the Percentage of Local Government Employees in Guaynabo, PR?
Percentage of Local Government Employees in Guaynabo is 4.7%.
What is the Percentage of Local Government Employees in Puerto Rico?
Percentage of Local Government Employees in Puerto Rico is 5.6%.
What is the Percentage of Local Government Employees in the United States?
Percentage of Local Government Employees in the United States is 7.2%.