Zip Codes with the Highest Percentage of Population Employed in Office & Administration in Hillsboro, OR
RELATED REPORTS & OPTIONS
Office & Administration
Hillsboro
Compare Zip Codes
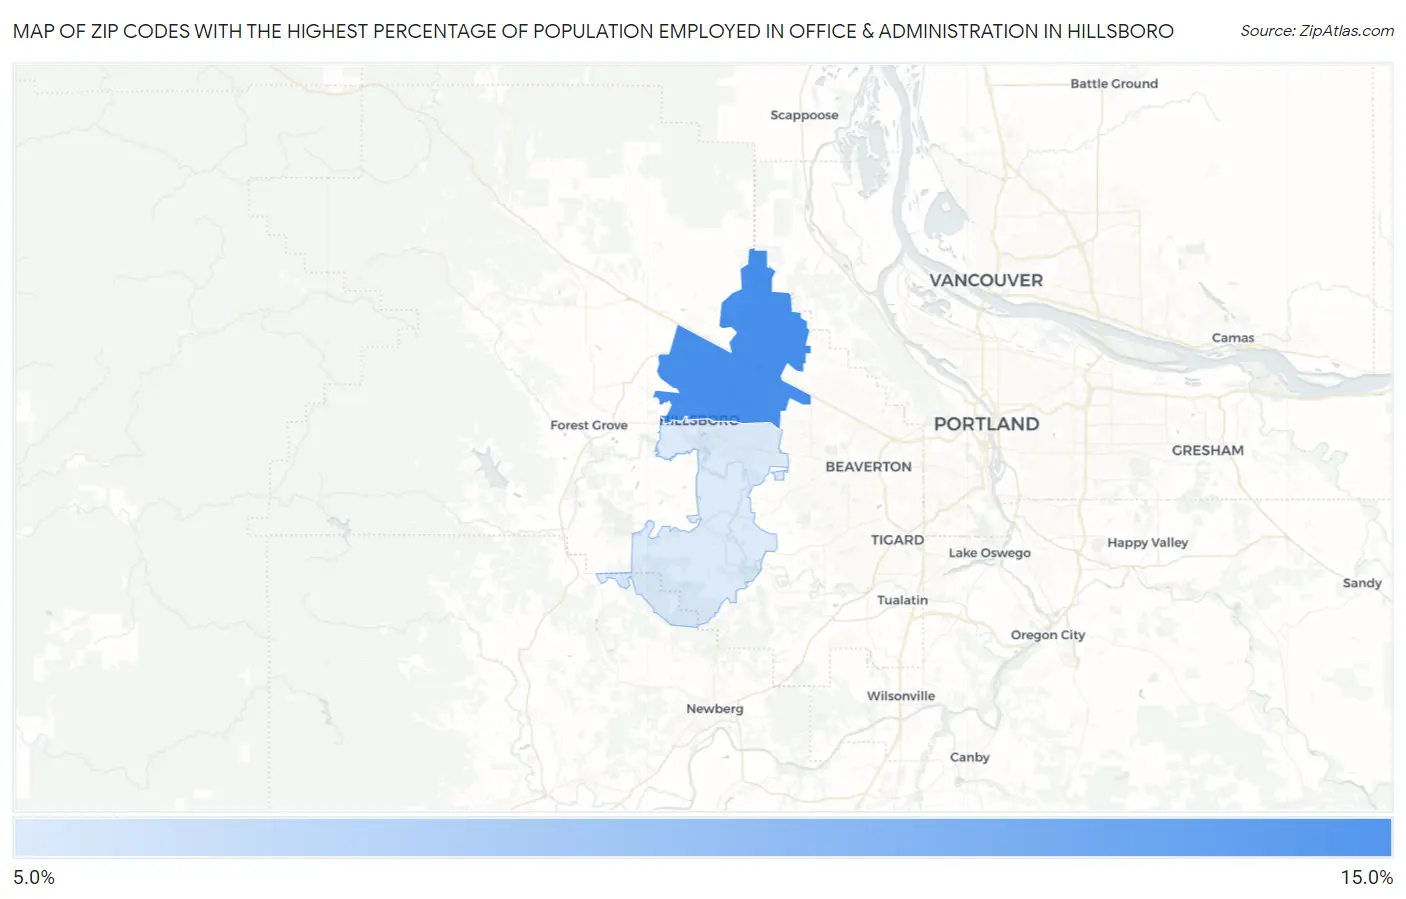
Map of Zip Codes with the Highest Percentage of Population Employed in Office & Administration in Hillsboro
9.1%
10.8%
Zip Codes with the Highest Percentage of Population Employed in Office & Administration in Hillsboro, OR
| Zip Code | % Employed | vs State | vs National | |
| 1. | 97124 | 10.8% | 10.7%(+0.051)#179 | 10.9%(-0.073)#14,557 |
| 2. | 97123 | 9.1% | 10.7%(-1.67)#249 | 10.9%(-1.79)#20,079 |
1
Common Questions
What are the Top Zip Codes with the Highest Percentage of Population Employed in Office & Administration in Hillsboro, OR?
Top Zip Codes with the Highest Percentage of Population Employed in Office & Administration in Hillsboro, OR are:
What zip code has the Highest Percentage of Population Employed in Office & Administration in Hillsboro, OR?
97124 has the Highest Percentage of Population Employed in Office & Administration in Hillsboro, OR with 10.8%.
What is the Percentage of Population Employed in Office & Administration in Hillsboro, OR?
Percentage of Population Employed in Office & Administration in Hillsboro is 10.2%.
What is the Percentage of Population Employed in Office & Administration in Oregon?
Percentage of Population Employed in Office & Administration in Oregon is 10.7%.
What is the Percentage of Population Employed in Office & Administration in the United States?
Percentage of Population Employed in Office & Administration in the United States is 10.9%.