Zip Codes with the Highest Percentage of Population Employed in Farming, Fishing & Forestry in Lorain, OH
RELATED REPORTS & OPTIONS
Farming, Fishing & Forestry
Lorain
Compare Zip Codes
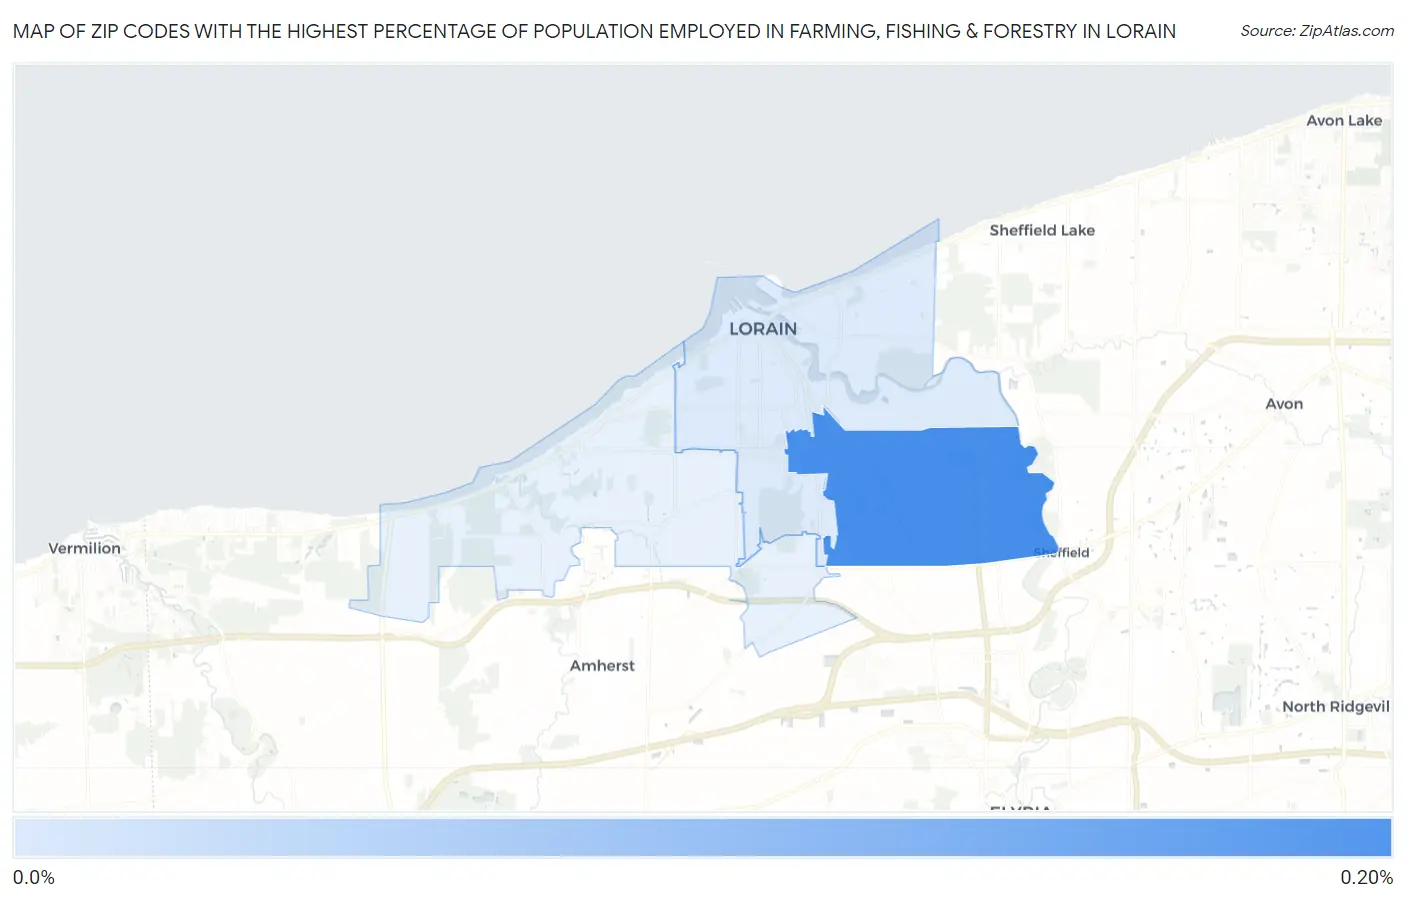
Map of Zip Codes with the Highest Percentage of Population Employed in Farming, Fishing & Forestry in Lorain
0.038%
0.16%
Zip Codes with the Highest Percentage of Population Employed in Farming, Fishing & Forestry in Lorain, OH
| Zip Code | % Employed | vs State | vs National | |
| 1. | 44055 | 0.16% | 0.29%(-0.130)#451 | 0.61%(-0.447)#16,771 |
| 2. | 44052 | 0.038% | 0.29%(-0.251)#557 | 0.61%(-0.568)#18,845 |
1
Common Questions
What are the Top Zip Codes with the Highest Percentage of Population Employed in Farming, Fishing & Forestry in Lorain, OH?
Top Zip Codes with the Highest Percentage of Population Employed in Farming, Fishing & Forestry in Lorain, OH are:
What zip code has the Highest Percentage of Population Employed in Farming, Fishing & Forestry in Lorain, OH?
44055 has the Highest Percentage of Population Employed in Farming, Fishing & Forestry in Lorain, OH with 0.16%.
What is the Percentage of Population Employed in Farming, Fishing & Forestry in Lorain, OH?
Percentage of Population Employed in Farming, Fishing & Forestry in Lorain is 0.063%.
What is the Percentage of Population Employed in Farming, Fishing & Forestry in Ohio?
Percentage of Population Employed in Farming, Fishing & Forestry in Ohio is 0.29%.
What is the Percentage of Population Employed in Farming, Fishing & Forestry in the United States?
Percentage of Population Employed in Farming, Fishing & Forestry in the United States is 0.61%.