Zip Codes with the Highest Percentage of Population with a Degree in Visual and Performing Arts in Kinston, NC
RELATED REPORTS & OPTIONS
Visual and Performing Arts
Kinston
Compare Zip Codes
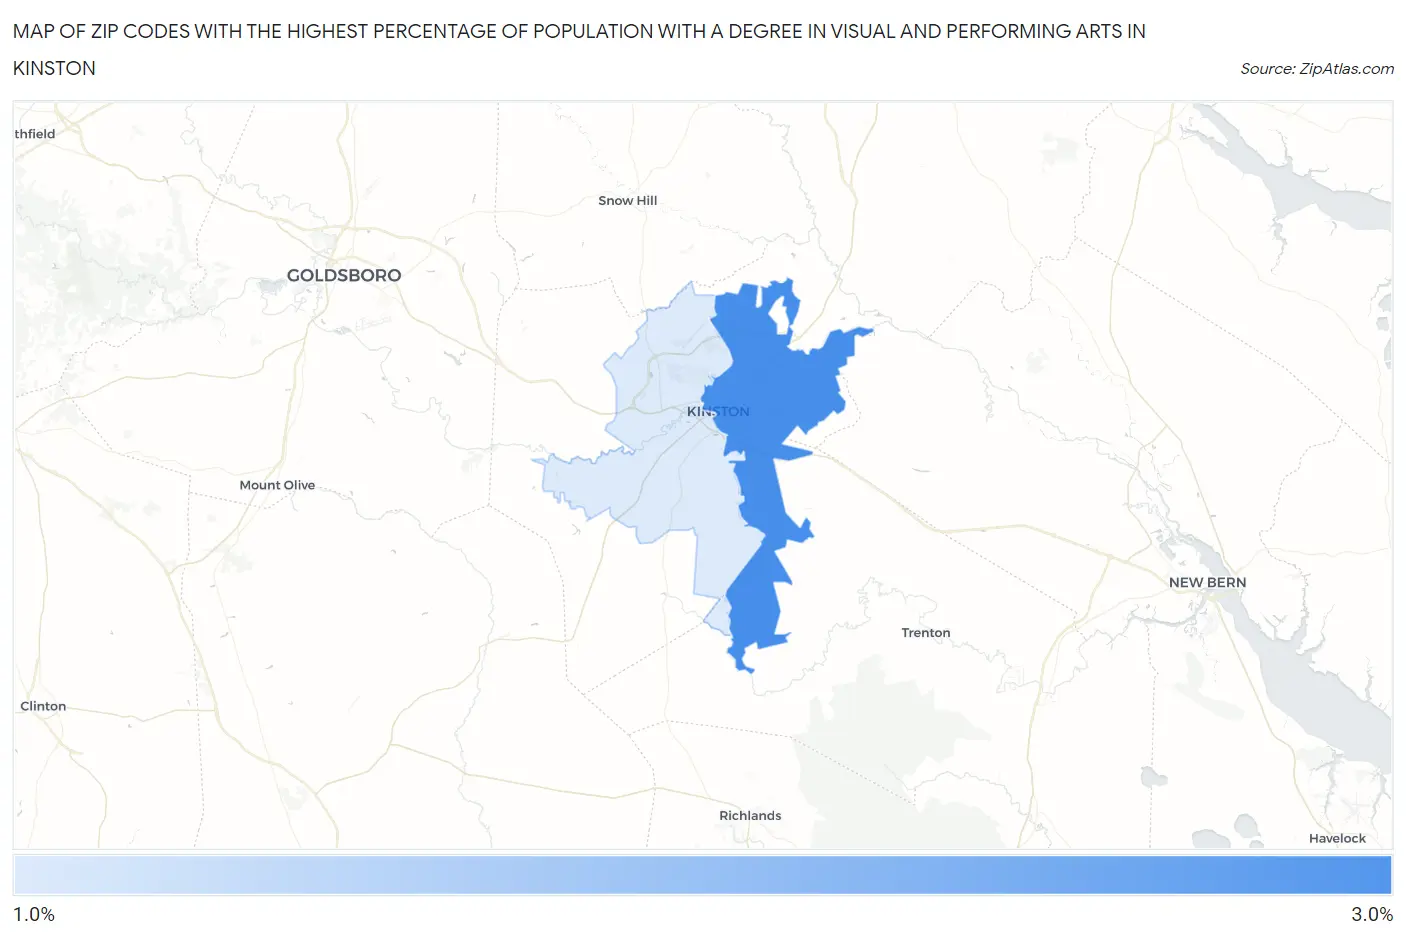
Map of Zip Codes with the Highest Percentage of Population with a Degree in Visual and Performing Arts in Kinston
1.7%
2.8%
Zip Codes with the Highest Percentage of Population with a Degree in Visual and Performing Arts in Kinston, NC
| Zip Code | % Graduates | vs State | vs National | |
| 1. | 28501 | 2.8% | 3.6%(-0.807)#347 | 4.3%(-1.44)#13,446 |
| 2. | 28504 | 1.7% | 3.6%(-1.91)#463 | 4.3%(-2.55)#17,470 |
1
Common Questions
What are the Top Zip Codes with the Highest Percentage of Population with a Degree in Visual and Performing Arts in Kinston, NC?
Top Zip Codes with the Highest Percentage of Population with a Degree in Visual and Performing Arts in Kinston, NC are:
What zip code has the Highest Percentage of Population with a Degree in Visual and Performing Arts in Kinston, NC?
28501 has the Highest Percentage of Population with a Degree in Visual and Performing Arts in Kinston, NC with 2.8%.
What is the Percentage of Population with a Degree in Visual and Performing Arts in Kinston, NC?
Percentage of Population with a Degree in Visual and Performing Arts in Kinston is 3.2%.
What is the Percentage of Population with a Degree in Visual and Performing Arts in North Carolina?
Percentage of Population with a Degree in Visual and Performing Arts in North Carolina is 3.6%.
What is the Percentage of Population with a Degree in Visual and Performing Arts in the United States?
Percentage of Population with a Degree in Visual and Performing Arts in the United States is 4.3%.