Zip Codes with the Highest Percentage of Population with a Degree in Visual and Performing Arts in Lexington, NC
RELATED REPORTS & OPTIONS
Visual and Performing Arts
Lexington
Compare Zip Codes
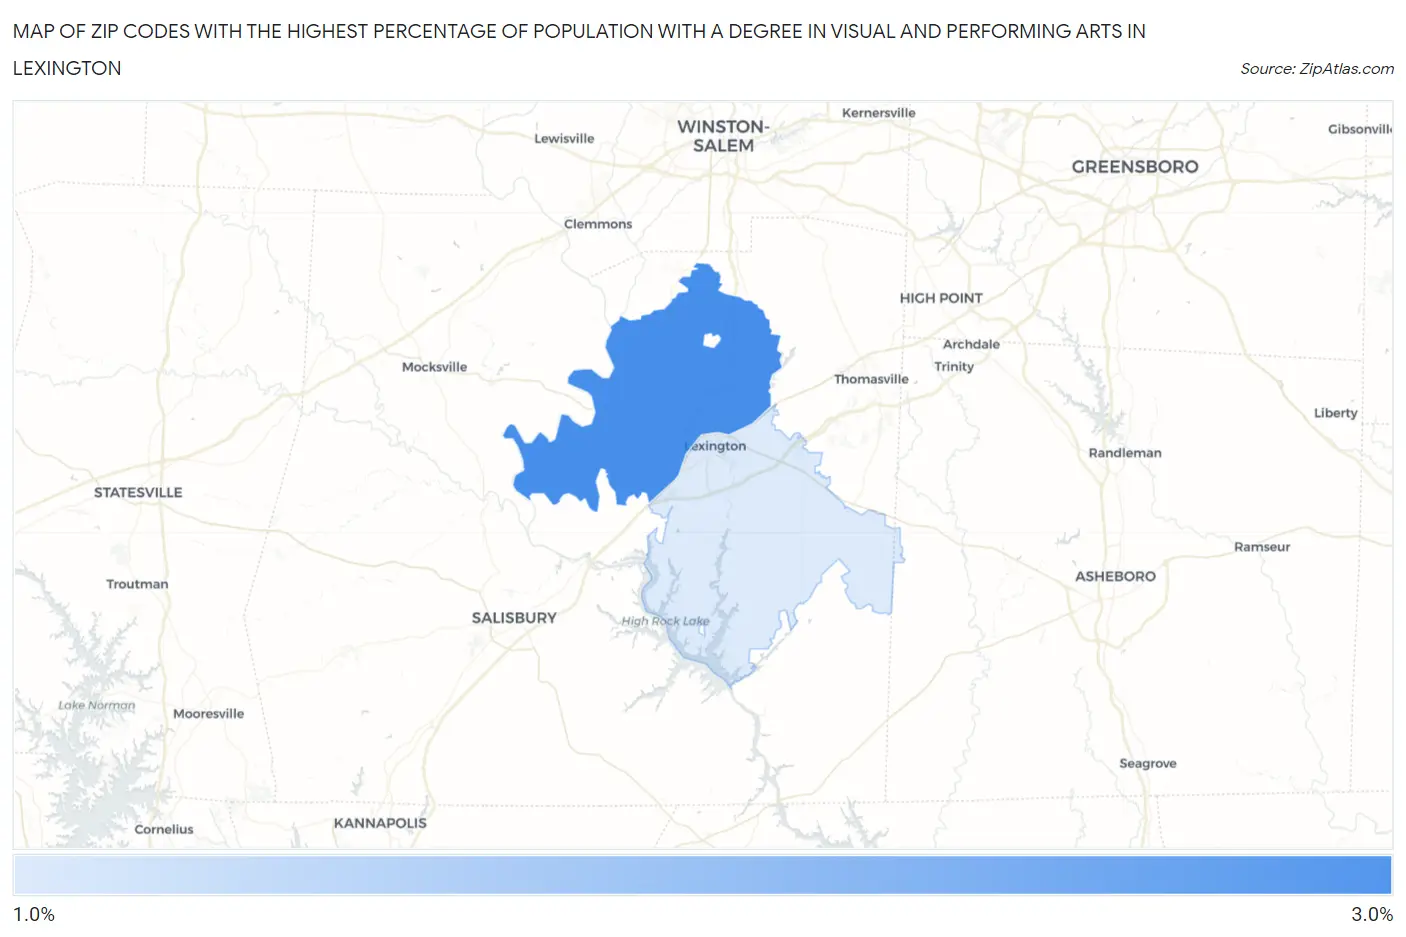
Map of Zip Codes with the Highest Percentage of Population with a Degree in Visual and Performing Arts in Lexington
2.0%
2.5%
Zip Codes with the Highest Percentage of Population with a Degree in Visual and Performing Arts in Lexington, NC
| Zip Code | % Graduates | vs State | vs National | |
| 1. | 27295 | 2.5% | 3.6%(-1.07)#378 | 4.3%(-1.70)#14,446 |
| 2. | 27292 | 2.0% | 3.6%(-1.63)#425 | 4.3%(-2.26)#16,488 |
1
Common Questions
What are the Top Zip Codes with the Highest Percentage of Population with a Degree in Visual and Performing Arts in Lexington, NC?
Top Zip Codes with the Highest Percentage of Population with a Degree in Visual and Performing Arts in Lexington, NC are:
What zip code has the Highest Percentage of Population with a Degree in Visual and Performing Arts in Lexington, NC?
27295 has the Highest Percentage of Population with a Degree in Visual and Performing Arts in Lexington, NC with 2.5%.
What is the Percentage of Population with a Degree in Visual and Performing Arts in Lexington, NC?
Percentage of Population with a Degree in Visual and Performing Arts in Lexington is 2.9%.
What is the Percentage of Population with a Degree in Visual and Performing Arts in North Carolina?
Percentage of Population with a Degree in Visual and Performing Arts in North Carolina is 3.6%.
What is the Percentage of Population with a Degree in Visual and Performing Arts in the United States?
Percentage of Population with a Degree in Visual and Performing Arts in the United States is 4.3%.