Zip Codes with the Highest Percentage of Population with a Degree in Visual and Performing Arts in Gastonia, NC
RELATED REPORTS & OPTIONS
Visual and Performing Arts
Gastonia
Compare Zip Codes
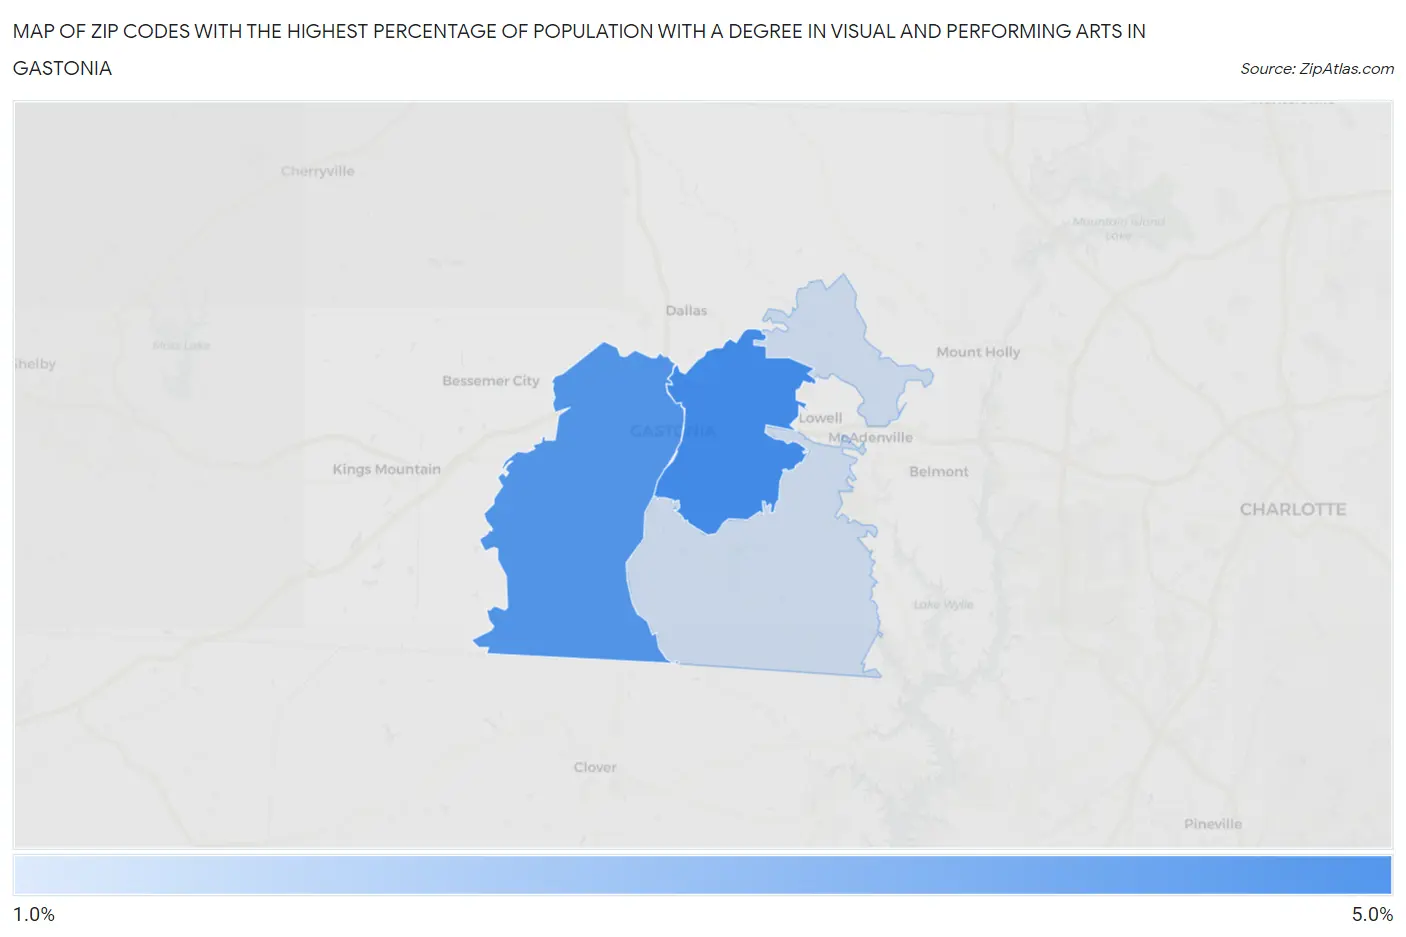
Map of Zip Codes with the Highest Percentage of Population with a Degree in Visual and Performing Arts in Gastonia
1.6%
4.2%
Zip Codes with the Highest Percentage of Population with a Degree in Visual and Performing Arts in Gastonia, NC
| Zip Code | % Graduates | vs State | vs National | |
| 1. | 28054 | 4.2% | 3.6%(+0.608)#210 | 4.3%(-0.025)#8,545 |
| 2. | 28052 | 3.9% | 3.6%(+0.319)#234 | 4.3%(-0.315)#9,454 |
| 3. | 28056 | 1.6% | 3.6%(-2.06)#481 | 4.3%(-2.70)#17,988 |
1
Common Questions
What are the Top Zip Codes with the Highest Percentage of Population with a Degree in Visual and Performing Arts in Gastonia, NC?
Top Zip Codes with the Highest Percentage of Population with a Degree in Visual and Performing Arts in Gastonia, NC are:
What zip code has the Highest Percentage of Population with a Degree in Visual and Performing Arts in Gastonia, NC?
28054 has the Highest Percentage of Population with a Degree in Visual and Performing Arts in Gastonia, NC with 4.2%.
What is the Percentage of Population with a Degree in Visual and Performing Arts in Gastonia, NC?
Percentage of Population with a Degree in Visual and Performing Arts in Gastonia is 3.2%.
What is the Percentage of Population with a Degree in Visual and Performing Arts in North Carolina?
Percentage of Population with a Degree in Visual and Performing Arts in North Carolina is 3.6%.
What is the Percentage of Population with a Degree in Visual and Performing Arts in the United States?
Percentage of Population with a Degree in Visual and Performing Arts in the United States is 4.3%.