Washington County, ME Map & Demographics
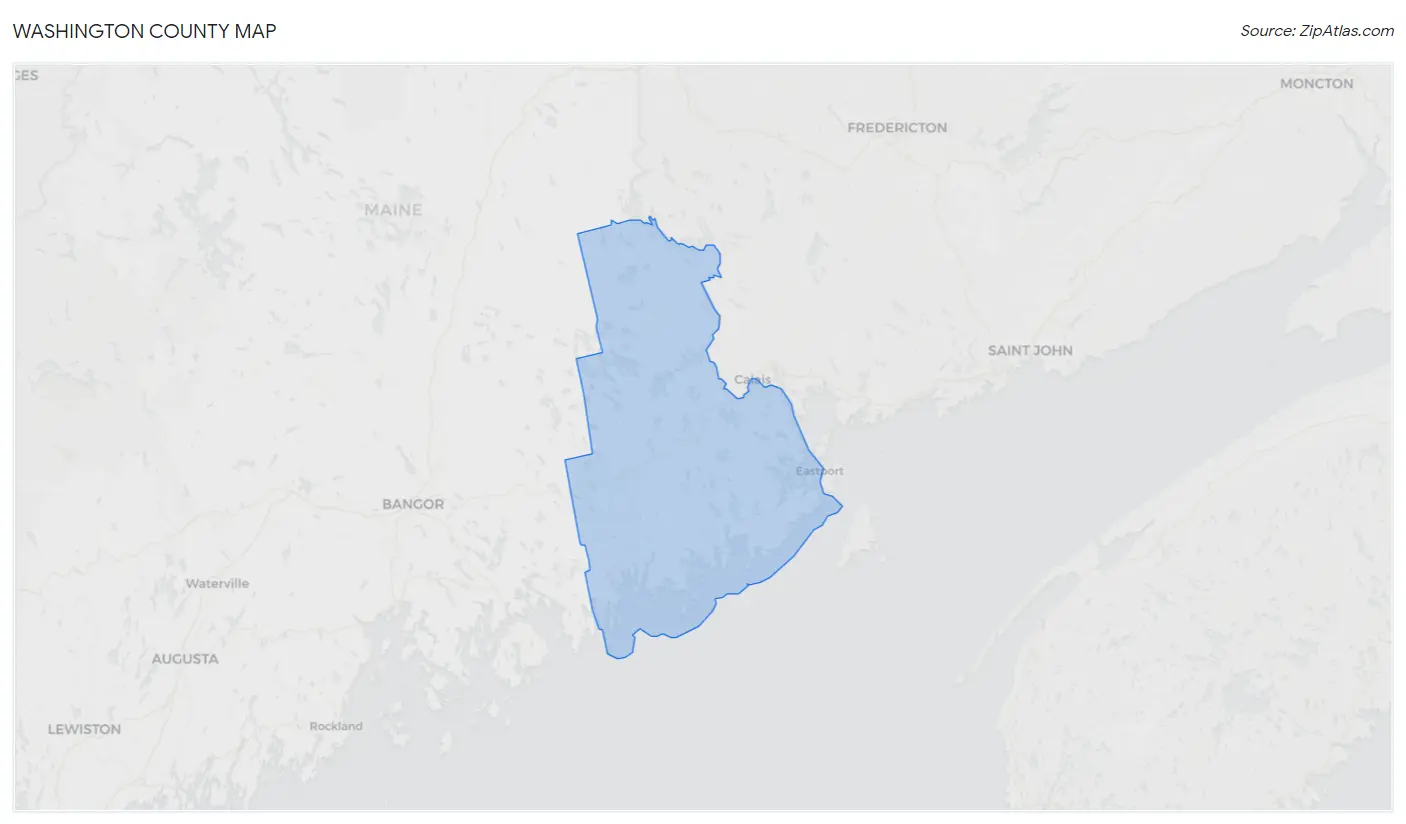
Washington County Map
Washington County Overview
$30,731
PER CAPITA INCOME
$68,207
AVG FAMILY INCOME
$51,669
AVG HOUSEHOLD INCOME
26.4%
WAGE / INCOME GAP [ % ]
73.6¢/ $1
WAGE / INCOME GAP [ $ ]
$9,905
FAMILY INCOME DEFICIT
0.46
INEQUALITY / GINI INDEX
31,096
TOTAL POPULATION
15,385
MALE POPULATION
15,711
FEMALE POPULATION
97.93
MALES / 100 FEMALES
102.12
FEMALES / 100 MALES
48.6
MEDIAN AGE
2.8
AVG FAMILY SIZE
2.2
AVG HOUSEHOLD SIZE
13,747
LABOR FORCE [ PEOPLE ]
52.9%
PERCENT IN LABOR FORCE
7.0%
UNEMPLOYMENT RATE
Washington County Area Codes
Income in Washington County
Income Overview in Washington County
Per Capita Income in Washington County is $30,731, while median incomes of families and households are $68,207 and $51,669 respectively.
| Characteristic | Number | Measure |
| Per Capita Income | 31,096 | $30,731 |
| Median Family Income | 8,302 | $68,207 |
| Mean Family Income | 8,302 | $83,202 |
| Median Household Income | 13,585 | $51,669 |
| Mean Household Income | 13,585 | $68,265 |
| Income Deficit | 8,302 | $9,905 |
| Wage / Income Gap (%) | 31,096 | 26.45% |
| Wage / Income Gap ($) | 31,096 | 73.55¢ per $1 |
| Gini / Inequality Index | 31,096 | 0.46 |
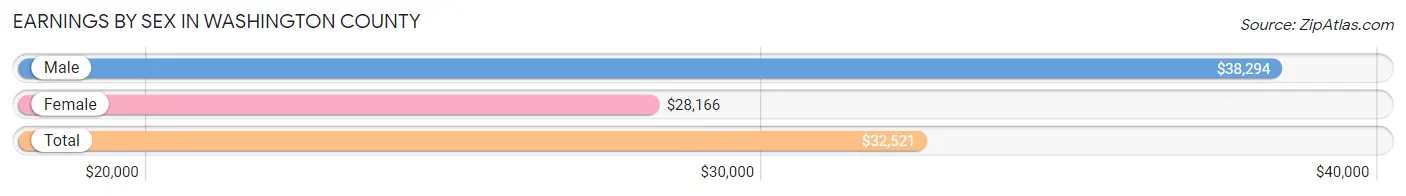
Earnings by Sex in Washington County
Average Earnings in Washington County are $32,521, $38,294 for men and $28,166 for women, a difference of 26.5%.
| Sex | Number | Average Earnings |
| Male | 7,934 (52.6%) | $38,294 |
| Female | 7,143 (47.4%) | $28,166 |
| Total | 15,077 (100.0%) | $32,521 |
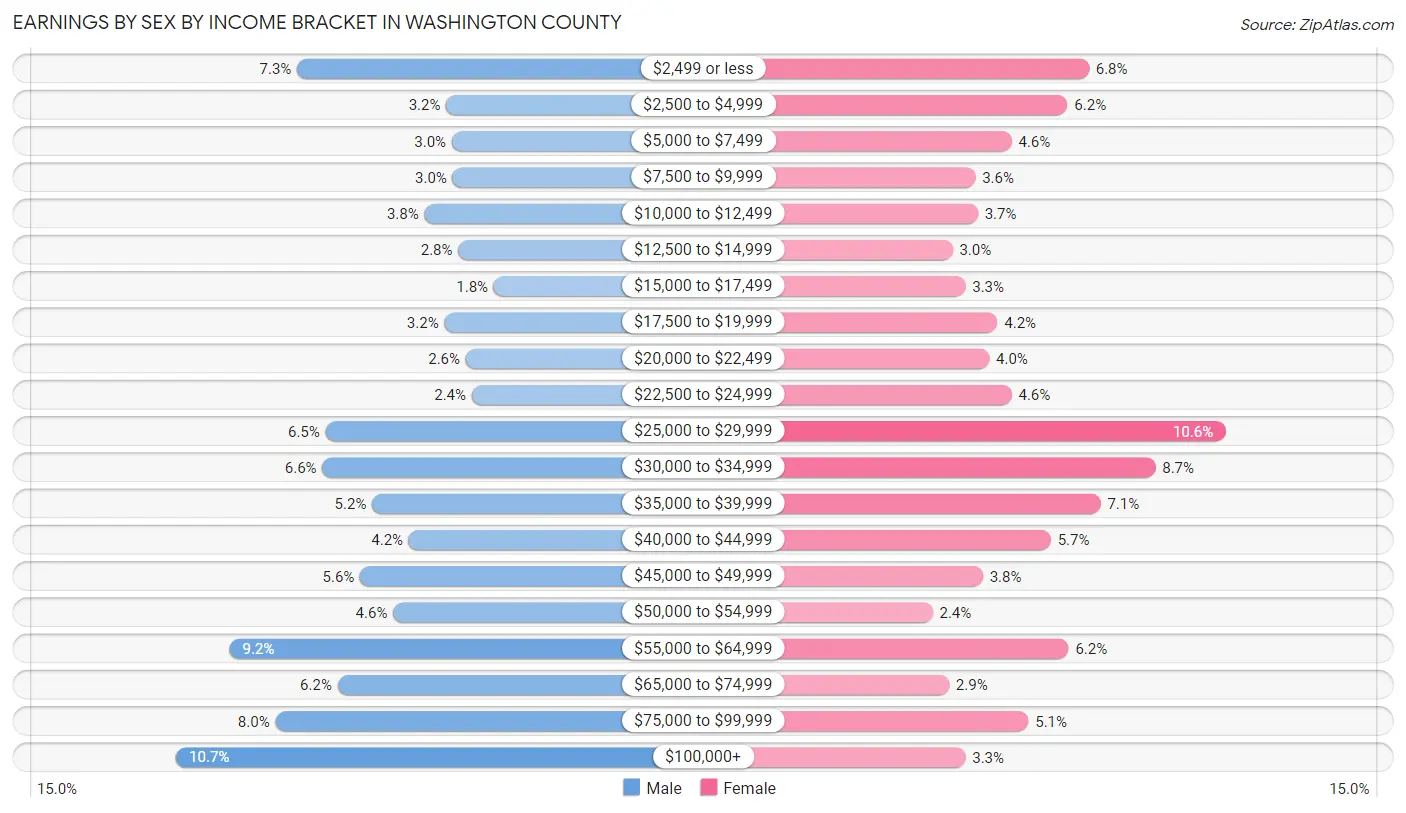
Earnings by Sex by Income Bracket in Washington County
The most common earnings brackets in Washington County are $100,000+ for men (852 | 10.7%) and $25,000 to $29,999 for women (759 | 10.6%).
| Income | Male | Female |
| $2,499 or less | 582 (7.3%) | 486 (6.8%) |
| $2,500 to $4,999 | 250 (3.2%) | 443 (6.2%) |
| $5,000 to $7,499 | 237 (3.0%) | 331 (4.6%) |
| $7,500 to $9,999 | 236 (3.0%) | 258 (3.6%) |
| $10,000 to $12,499 | 298 (3.8%) | 263 (3.7%) |
| $12,500 to $14,999 | 223 (2.8%) | 212 (3.0%) |
| $15,000 to $17,499 | 144 (1.8%) | 238 (3.3%) |
| $17,500 to $19,999 | 254 (3.2%) | 302 (4.2%) |
| $20,000 to $22,499 | 206 (2.6%) | 286 (4.0%) |
| $22,500 to $24,999 | 193 (2.4%) | 331 (4.6%) |
| $25,000 to $29,999 | 519 (6.5%) | 759 (10.6%) |
| $30,000 to $34,999 | 526 (6.6%) | 619 (8.7%) |
| $35,000 to $39,999 | 415 (5.2%) | 509 (7.1%) |
| $40,000 to $44,999 | 333 (4.2%) | 409 (5.7%) |
| $45,000 to $49,999 | 442 (5.6%) | 273 (3.8%) |
| $50,000 to $54,999 | 368 (4.6%) | 172 (2.4%) |
| $55,000 to $64,999 | 733 (9.2%) | 445 (6.2%) |
| $65,000 to $74,999 | 492 (6.2%) | 205 (2.9%) |
| $75,000 to $99,999 | 631 (8.0%) | 364 (5.1%) |
| $100,000+ | 852 (10.7%) | 238 (3.3%) |
| Total | 7,934 (100.0%) | 7,143 (100.0%) |
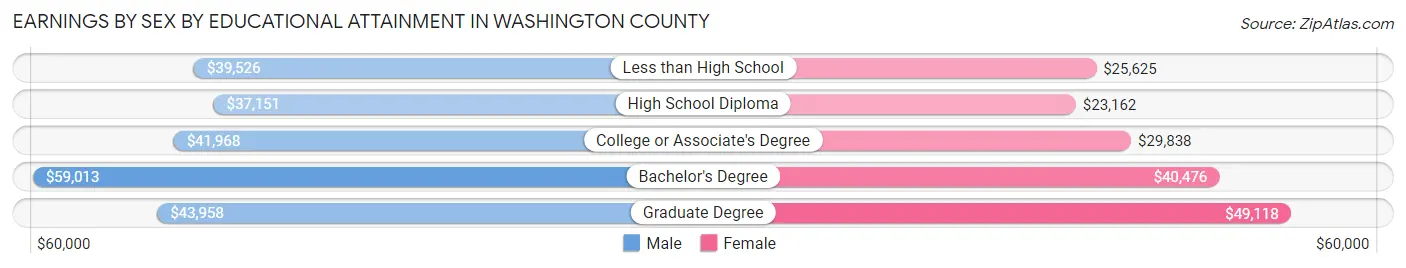
Earnings by Sex by Educational Attainment in Washington County
Average earnings in Washington County are $43,186 for men and $30,259 for women, a difference of 29.9%. Men with an educational attainment of bachelor's degree enjoy the highest average annual earnings of $59,013, while those with high school diploma education earn the least with $37,151. Women with an educational attainment of graduate degree earn the most with the average annual earnings of $49,118, while those with high school diploma education have the smallest earnings of $23,162.
| Educational Attainment | Male Income | Female Income |
| Less than High School | $39,526 | $25,625 |
| High School Diploma | $37,151 | $23,162 |
| College or Associate's Degree | $41,968 | $29,838 |
| Bachelor's Degree | $59,013 | $40,476 |
| Graduate Degree | $43,958 | $49,118 |
| Total | $43,186 | $30,259 |
Family Income in Washington County
Family Income Brackets in Washington County
According to the Washington County family income data, there are 1,652 families falling into the $50,000 to $74,999 income range, which is the most common income bracket and makes up 19.9% of all families. Conversely, the less than $10,000 income bracket is the least frequent group with only 307 families (3.7%) belonging to this category.
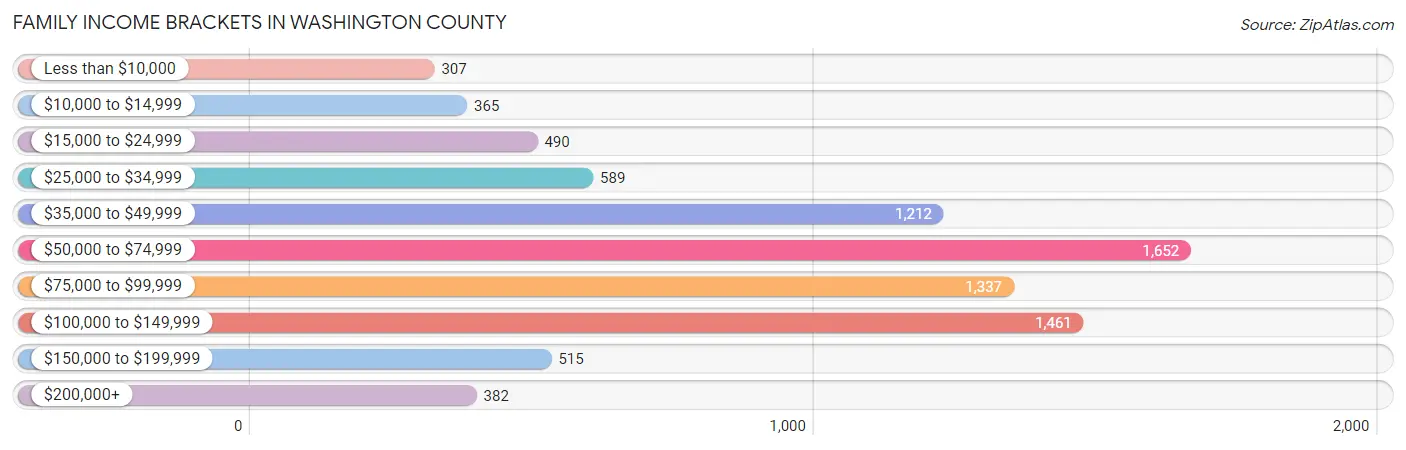
| Income Bracket | # Families | % Families |
| Less than $10,000 | 307 | 3.7% |
| $10,000 to $14,999 | 365 | 4.4% |
| $15,000 to $24,999 | 490 | 5.9% |
| $25,000 to $34,999 | 589 | 7.1% |
| $35,000 to $49,999 | 1,212 | 14.6% |
| $50,000 to $74,999 | 1,652 | 19.9% |
| $75,000 to $99,999 | 1,337 | 16.1% |
| $100,000 to $149,999 | 1,461 | 17.6% |
| $150,000 to $199,999 | 515 | 6.2% |
| $200,000+ | 382 | 4.6% |
Family Income by Famaliy Size in Washington County
7+ person families (99 | 1.2%) account for the highest median family income in Washington County with $108,542 per family, while 2-person families (5,221 | 62.9%) have the highest median income of $32,369 per family member.
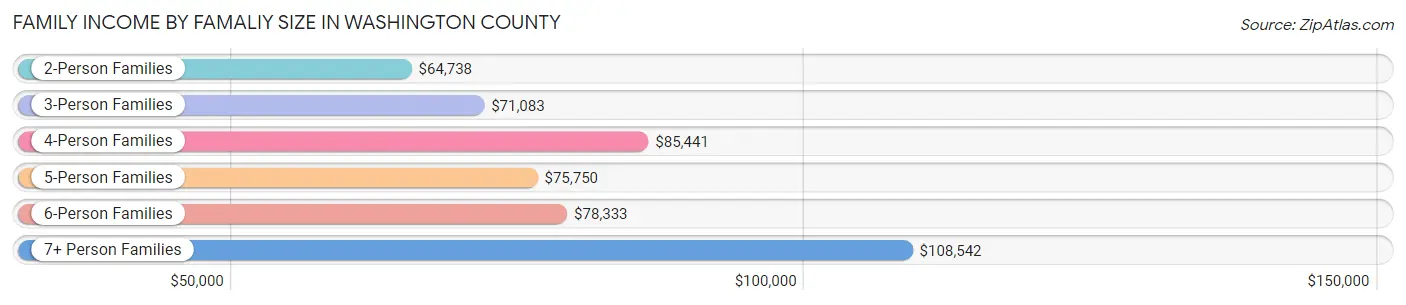
| Income Bracket | # Families | Median Income |
| 2-Person Families | 5,221 (62.9%) | $64,738 |
| 3-Person Families | 1,507 (18.1%) | $71,083 |
| 4-Person Families | 920 (11.1%) | $85,441 |
| 5-Person Families | 349 (4.2%) | $75,750 |
| 6-Person Families | 206 (2.5%) | $78,333 |
| 7+ Person Families | 99 (1.2%) | $108,542 |
| Total | 8,302 (100.0%) | $68,207 |
Family Income by Number of Earners in Washington County
The median family income in Washington County is $68,207, with families comprising 3+ earners (612) having the highest median family income of $108,250, while families with no earners (1,869) have the lowest median family income of $43,478, accounting for 7.4% and 22.5% of families, respectively.
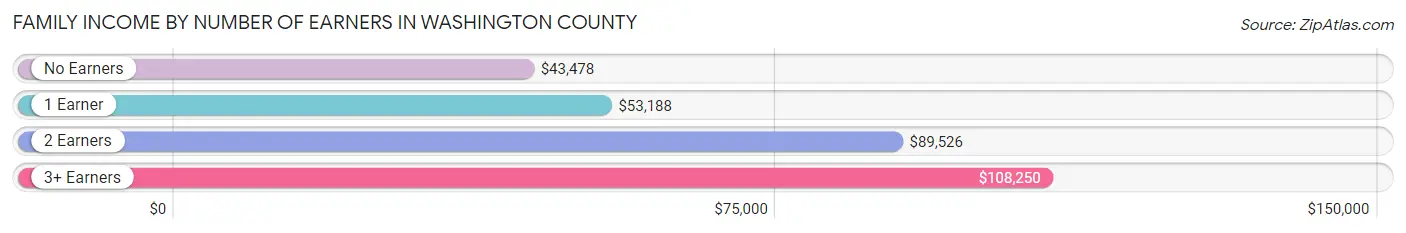
| Number of Earners | # Families | Median Income |
| No Earners | 1,869 (22.5%) | $43,478 |
| 1 Earner | 2,832 (34.1%) | $53,188 |
| 2 Earners | 2,989 (36.0%) | $89,526 |
| 3+ Earners | 612 (7.4%) | $108,250 |
| Total | 8,302 (100.0%) | $68,207 |
Household Income in Washington County
Household Income Brackets in Washington County
With 2,337 households falling in the category, the $50,000 to $74,999 income range is the most frequent in Washington County, accounting for 17.2% of all households. In contrast, only 448 households (3.3%) fall into the $200,000+ income bracket, making it the least populous group.
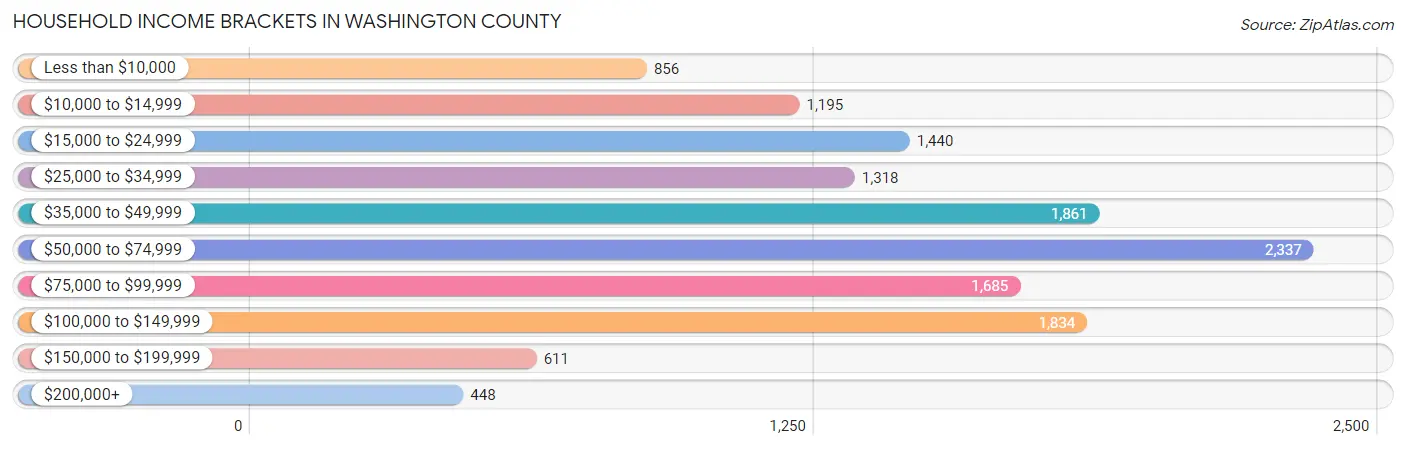
| Income Bracket | # Households | % Households |
| Less than $10,000 | 856 | 6.3% |
| $10,000 to $14,999 | 1,195 | 8.8% |
| $15,000 to $24,999 | 1,440 | 10.6% |
| $25,000 to $34,999 | 1,318 | 9.7% |
| $35,000 to $49,999 | 1,861 | 13.7% |
| $50,000 to $74,999 | 2,337 | 17.2% |
| $75,000 to $99,999 | 1,685 | 12.4% |
| $100,000 to $149,999 | 1,834 | 13.5% |
| $150,000 to $199,999 | 611 | 4.5% |
| $200,000+ | 448 | 3.3% |
Household Income by Householder Age in Washington County
The median household income in Washington County is $51,669, with the highest median household income of $62,653 found in the 25 to 44 years age bracket for the primary householder. A total of 3,048 households (22.4%) fall into this category. Meanwhile, the 65+ years age bracket for the primary householder has the lowest median household income of $41,963, with 5,006 households (36.8%) in this group.
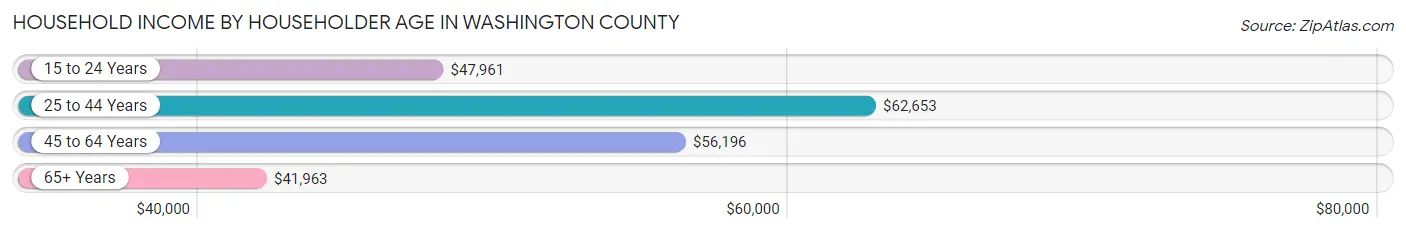
| Income Bracket | # Households | Median Income |
| 15 to 24 Years | 377 (2.8%) | $47,961 |
| 25 to 44 Years | 3,048 (22.4%) | $62,653 |
| 45 to 64 Years | 5,154 (37.9%) | $56,196 |
| 65+ Years | 5,006 (36.8%) | $41,963 |
| Total | 13,585 (100.0%) | $51,669 |
Poverty in Washington County
Income Below Poverty by Sex and Age in Washington County
With 16.4% poverty level for males and 18.7% for females among the residents of Washington County, 12 to 14 year old males and 5 year old females are the most vulnerable to poverty, with 161 males (35.3%) and 53 females (36.5%) in their respective age groups living below the poverty level.
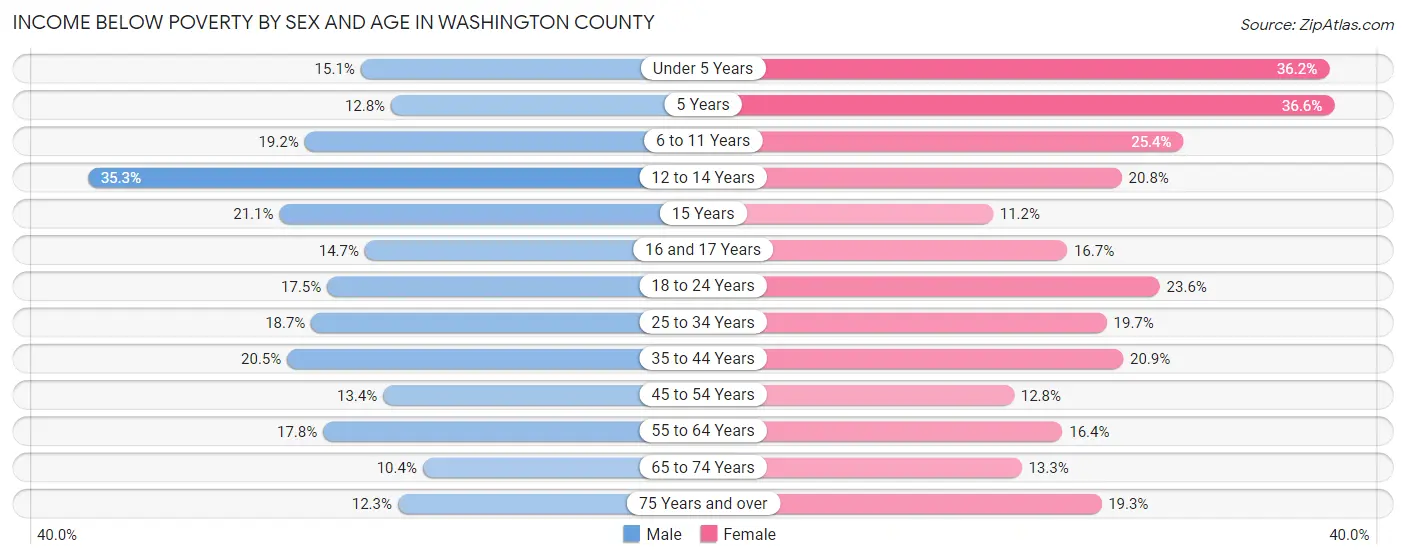
| Age Bracket | Male | Female |
| Under 5 Years | 115 (15.0%) | 238 (36.2%) |
| 5 Years | 21 (12.8%) | 53 (36.5%) |
| 6 to 11 Years | 178 (19.2%) | 217 (25.4%) |
| 12 to 14 Years | 161 (35.3%) | 112 (20.8%) |
| 15 Years | 31 (21.1%) | 24 (11.2%) |
| 16 and 17 Years | 56 (14.7%) | 56 (16.7%) |
| 18 to 24 Years | 175 (17.5%) | 231 (23.6%) |
| 25 to 34 Years | 277 (18.7%) | 290 (19.7%) |
| 35 to 44 Years | 319 (20.5%) | 352 (20.9%) |
| 45 to 54 Years | 248 (13.4%) | 233 (12.8%) |
| 55 to 64 Years | 440 (17.8%) | 426 (16.4%) |
| 65 to 74 Years | 248 (10.4%) | 313 (13.3%) |
| 75 Years and over | 157 (12.3%) | 305 (19.3%) |
| Total | 2,426 (16.4%) | 2,850 (18.7%) |
Income Above Poverty by Sex and Age in Washington County
According to the poverty statistics in Washington County, males aged 65 to 74 years and females aged 15 years are the age groups that are most secure financially, with 89.6% of males and 88.8% of females in these age groups living above the poverty line.
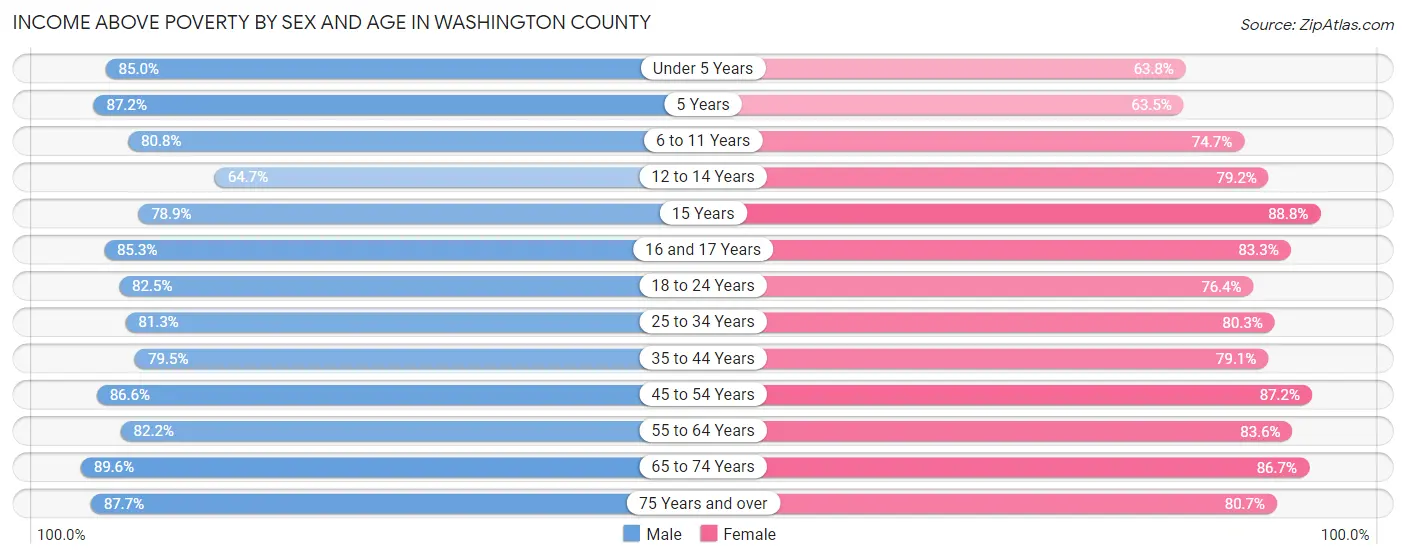
| Age Bracket | Male | Female |
| Under 5 Years | 649 (85.0%) | 420 (63.8%) |
| 5 Years | 143 (87.2%) | 92 (63.4%) |
| 6 to 11 Years | 748 (80.8%) | 639 (74.7%) |
| 12 to 14 Years | 295 (64.7%) | 427 (79.2%) |
| 15 Years | 116 (78.9%) | 190 (88.8%) |
| 16 and 17 Years | 324 (85.3%) | 279 (83.3%) |
| 18 to 24 Years | 823 (82.5%) | 748 (76.4%) |
| 25 to 34 Years | 1,203 (81.3%) | 1,185 (80.3%) |
| 35 to 44 Years | 1,236 (79.5%) | 1,334 (79.1%) |
| 45 to 54 Years | 1,604 (86.6%) | 1,591 (87.2%) |
| 55 to 64 Years | 2,027 (82.2%) | 2,177 (83.6%) |
| 65 to 74 Years | 2,128 (89.6%) | 2,034 (86.7%) |
| 75 Years and over | 1,120 (87.7%) | 1,279 (80.7%) |
| Total | 12,416 (83.7%) | 12,395 (81.3%) |
Income Below Poverty Among Married-Couple Families in Washington County
The poverty statistics for married-couple families in Washington County show that 5.6% or 343 of the total 6,134 families live below the poverty line. Families with 5 or more children have the highest poverty rate of 28.8%, comprising of 19 families. On the other hand, families with no children have the lowest poverty rate of 4.6%, which includes 201 families.

| Children | Above Poverty | Below Poverty |
| No Children | 4,117 (95.4%) | 201 (4.6%) |
| 1 or 2 Children | 1,328 (94.1%) | 83 (5.9%) |
| 3 or 4 Children | 299 (88.2%) | 40 (11.8%) |
| 5 or more Children | 47 (71.2%) | 19 (28.8%) |
| Total | 5,791 (94.4%) | 343 (5.6%) |
Income Below Poverty Among Single-Parent Households in Washington County
According to the poverty data in Washington County, 25.2% or 192 single-father households and 35.7% or 502 single-mother households are living below the poverty line. Among single-father households, those with 5 or more children have the highest poverty rate, with 3 households (100.0%) experiencing poverty. Likewise, among single-mother households, those with 5 or more children have the highest poverty rate, with 7 households (77.8%) falling below the poverty line.
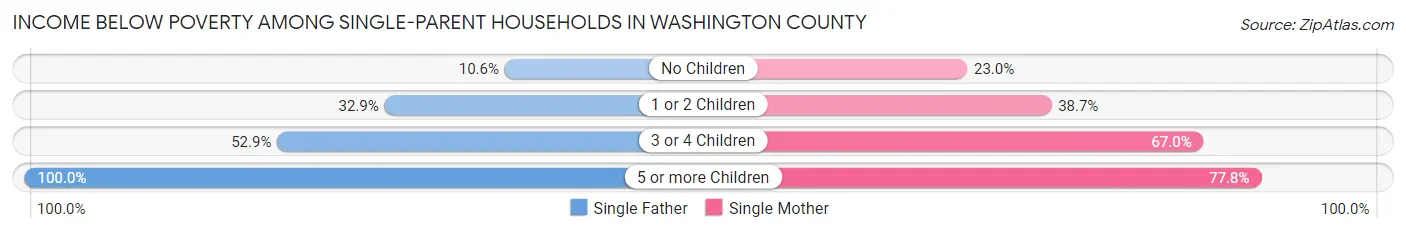
| Children | Single Father | Single Mother |
| No Children | 32 (10.6%) | 105 (23.0%) |
| 1 or 2 Children | 139 (32.9%) | 327 (38.7%) |
| 3 or 4 Children | 18 (52.9%) | 63 (67.0%) |
| 5 or more Children | 3 (100.0%) | 7 (77.8%) |
| Total | 192 (25.2%) | 502 (35.7%) |
Income Below Poverty Among Married-Couple vs Single-Parent Households in Washington County
The poverty data for Washington County shows that 343 of the married-couple family households (5.6%) and 694 of the single-parent households (32.0%) are living below the poverty level. Within the married-couple family households, those with 5 or more children have the highest poverty rate, with 19 households (28.8%) falling below the poverty line. Among the single-parent households, those with 5 or more children have the highest poverty rate, with 10 household (83.3%) living below poverty.
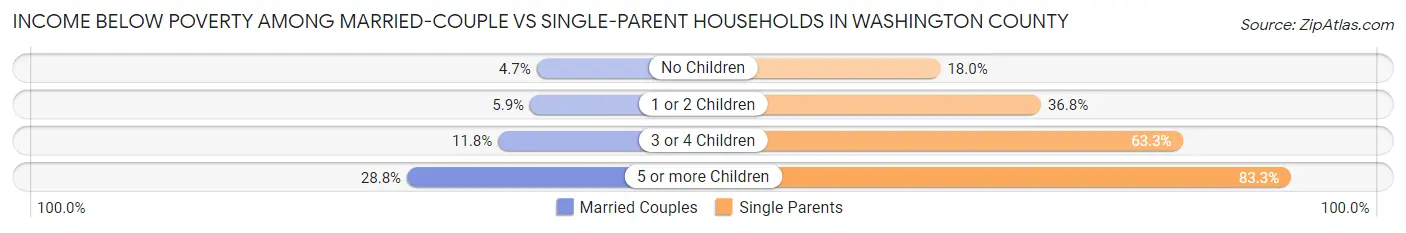
| Children | Married-Couple Families | Single-Parent Households |
| No Children | 201 (4.6%) | 137 (18.0%) |
| 1 or 2 Children | 83 (5.9%) | 466 (36.7%) |
| 3 or 4 Children | 40 (11.8%) | 81 (63.3%) |
| 5 or more Children | 19 (28.8%) | 10 (83.3%) |
| Total | 343 (5.6%) | 694 (32.0%) |
Race in Washington County
The most populous races in Washington County are White / Caucasian (27,591 | 88.7%), Native / Alaskan (1,522 | 4.9%), and Two or more Races (1,358 | 4.4%).
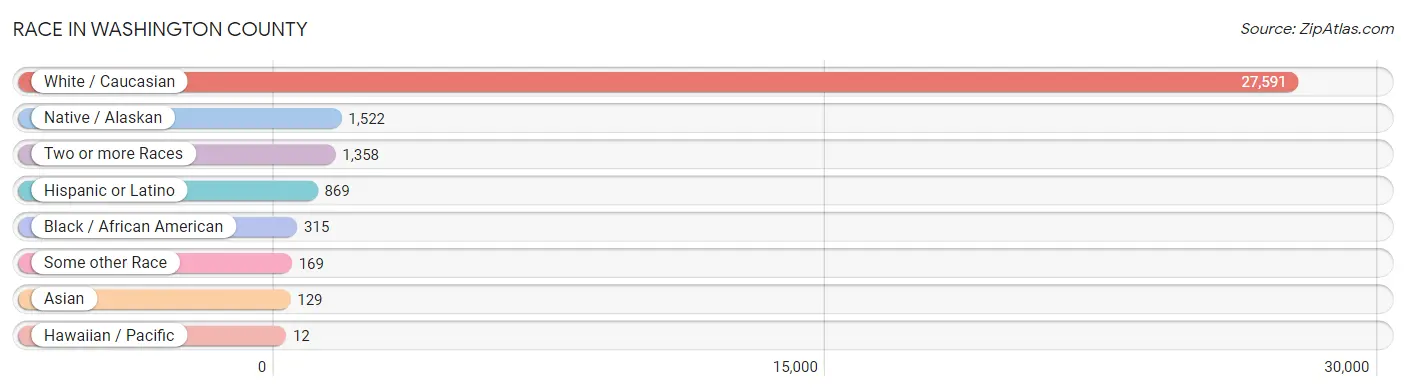
| Race | # Population | % Population |
| Asian | 129 | 0.4% |
| Black / African American | 315 | 1.0% |
| Hawaiian / Pacific | 12 | 0.0% |
| Hispanic or Latino | 869 | 2.8% |
| Native / Alaskan | 1,522 | 4.9% |
| White / Caucasian | 27,591 | 88.7% |
| Two or more Races | 1,358 | 4.4% |
| Some other Race | 169 | 0.5% |
| Total | 31,096 | 100.0% |
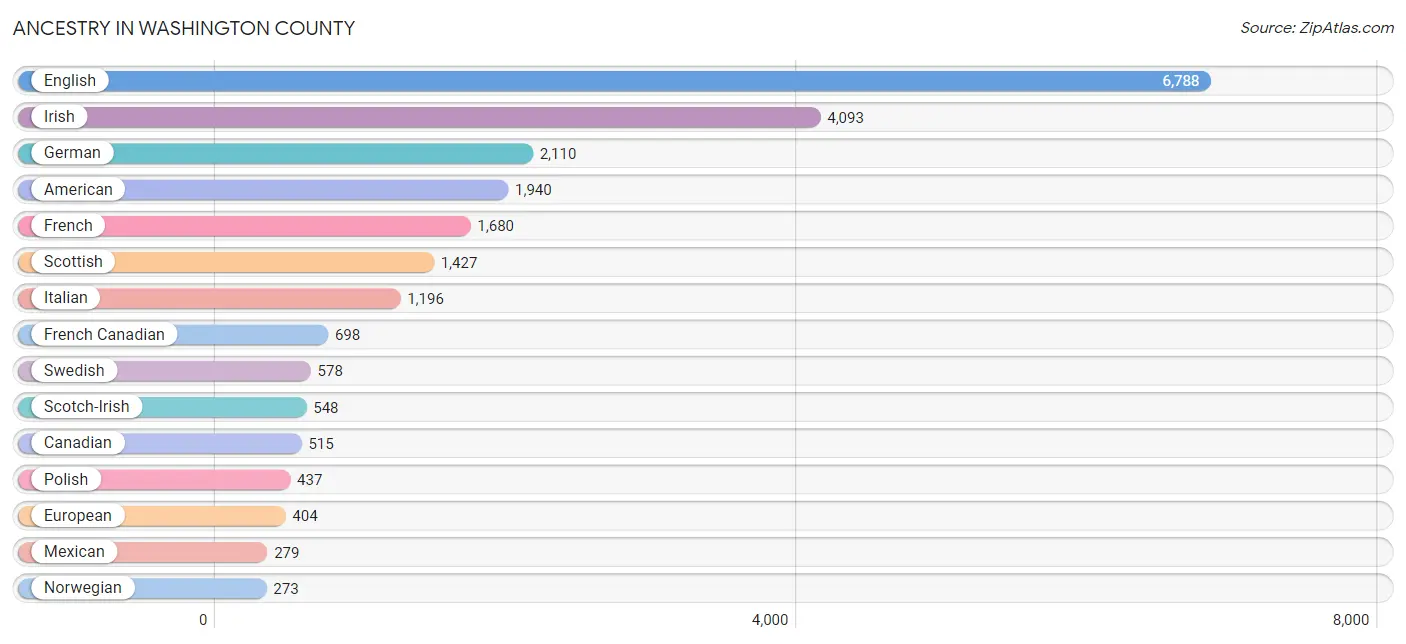
Ancestry in Washington County
The most populous ancestries reported in Washington County are English (6,788 | 21.8%), Irish (4,093 | 13.2%), German (2,110 | 6.8%), American (1,940 | 6.2%), and French (1,680 | 5.4%), together accounting for 53.4% of all Washington County residents.
| Ancestry | # Population | % Population |
| African | 45 | 0.1% |
| American | 1,940 | 6.2% |
| Apache | 5 | 0.0% |
| Arab | 51 | 0.2% |
| Armenian | 23 | 0.1% |
| Australian | 6 | 0.0% |
| Austrian | 60 | 0.2% |
| Belgian | 4 | 0.0% |
| Bermudan | 3 | 0.0% |
| Bhutanese | 5 | 0.0% |
| Blackfeet | 22 | 0.1% |
| Brazilian | 7 | 0.0% |
| British | 204 | 0.7% |
| British West Indian | 1 | 0.0% |
| Burmese | 35 | 0.1% |
| Cajun | 7 | 0.0% |
| Canadian | 515 | 1.7% |
| Cape Verdean | 2 | 0.0% |
| Celtic | 22 | 0.1% |
| Central American | 51 | 0.2% |
| Central American Indian | 10 | 0.0% |
| Cherokee | 50 | 0.2% |
| Chickasaw | 12 | 0.0% |
| Chippewa | 7 | 0.0% |
| Choctaw | 13 | 0.0% |
| Colombian | 13 | 0.0% |
| Creek | 1 | 0.0% |
| Croatian | 21 | 0.1% |
| Cuban | 93 | 0.3% |
| Czech | 80 | 0.3% |
| Czechoslovakian | 7 | 0.0% |
| Danish | 49 | 0.2% |
| Dominican | 54 | 0.2% |
| Dutch | 188 | 0.6% |
| Eastern European | 43 | 0.1% |
| Egyptian | 6 | 0.0% |
| English | 6,788 | 21.8% |
| European | 404 | 1.3% |
| Finnish | 76 | 0.2% |
| French | 1,680 | 5.4% |
| French American Indian | 24 | 0.1% |
| French Canadian | 698 | 2.2% |
| German | 2,110 | 6.8% |
| Greek | 93 | 0.3% |
| Guyanese | 4 | 0.0% |
| Honduran | 46 | 0.2% |
| Hungarian | 90 | 0.3% |
| Icelander | 8 | 0.0% |
| Indian (Asian) | 46 | 0.2% |
| Iranian | 15 | 0.1% |
| Irish | 4,093 | 13.2% |
| Iroquois | 1 | 0.0% |
| Israeli | 1 | 0.0% |
| Italian | 1,196 | 3.8% |
| Japanese | 24 | 0.1% |
| Kenyan | 14 | 0.1% |
| Korean | 72 | 0.2% |
| Latvian | 3 | 0.0% |
| Lebanese | 34 | 0.1% |
| Lithuanian | 66 | 0.2% |
| Mexican | 279 | 0.9% |
| Mongolian | 1 | 0.0% |
| Native Hawaiian | 14 | 0.1% |
| Navajo | 3 | 0.0% |
| Northern European | 59 | 0.2% |
| Norwegian | 273 | 0.9% |
| Peruvian | 30 | 0.1% |
| Polish | 437 | 1.4% |
| Portuguese | 120 | 0.4% |
| Potawatomi | 1 | 0.0% |
| Puerto Rican | 262 | 0.8% |
| Romanian | 3 | 0.0% |
| Russian | 117 | 0.4% |
| Salvadoran | 5 | 0.0% |
| Samoan | 4 | 0.0% |
| Scandinavian | 93 | 0.3% |
| Scotch-Irish | 548 | 1.8% |
| Scottish | 1,427 | 4.6% |
| Shoshone | 3 | 0.0% |
| Sioux | 38 | 0.1% |
| Slavic | 12 | 0.0% |
| Slovak | 11 | 0.0% |
| Somali | 3 | 0.0% |
| South African | 9 | 0.0% |
| South American | 60 | 0.2% |
| South American Indian | 3 | 0.0% |
| Spaniard | 5 | 0.0% |
| Spanish | 7 | 0.0% |
| Sri Lankan | 22 | 0.1% |
| Subsaharan African | 73 | 0.2% |
| Swedish | 578 | 1.9% |
| Swiss | 37 | 0.1% |
| Syrian | 1 | 0.0% |
| Thai | 10 | 0.0% |
| Ukrainian | 27 | 0.1% |
| Uruguayan | 5 | 0.0% |
| Welsh | 176 | 0.6% |
| West Indian | 16 | 0.1% |
| Yaqui | 16 | 0.1% |
| Yup'ik | 5 | 0.0% | View All 100 Rows |
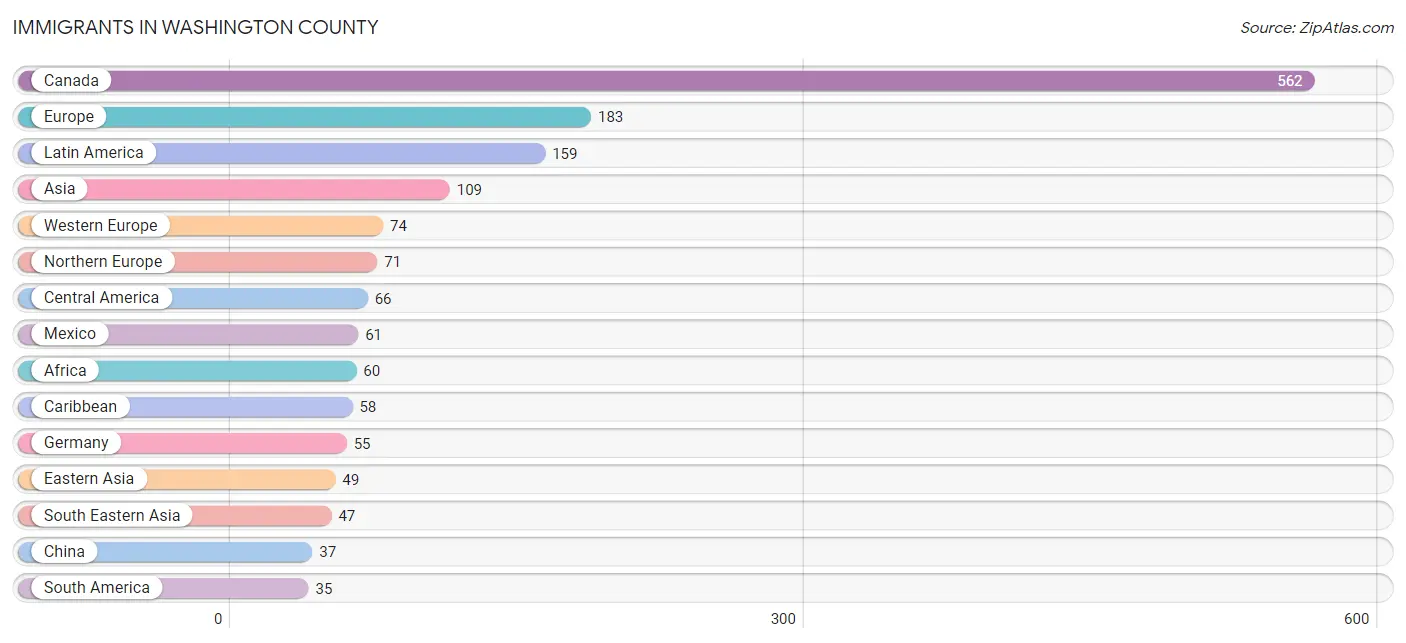
Immigrants in Washington County
The most numerous immigrant groups reported in Washington County came from Canada (562 | 1.8%), Europe (183 | 0.6%), Latin America (159 | 0.5%), Asia (109 | 0.4%), and Western Europe (74 | 0.2%), together accounting for 3.5% of all Washington County residents.
| Immigration Origin | # Population | % Population |
| Africa | 60 | 0.2% |
| Asia | 109 | 0.4% |
| Australia | 14 | 0.1% |
| Austria | 3 | 0.0% |
| Azores | 2 | 0.0% |
| Canada | 562 | 1.8% |
| Caribbean | 58 | 0.2% |
| Central America | 66 | 0.2% |
| China | 37 | 0.1% |
| Colombia | 1 | 0.0% |
| Cuba | 29 | 0.1% |
| Dominican Republic | 29 | 0.1% |
| Eastern Africa | 24 | 0.1% |
| Eastern Asia | 49 | 0.2% |
| Eastern Europe | 26 | 0.1% |
| Ecuador | 3 | 0.0% |
| Egypt | 3 | 0.0% |
| El Salvador | 5 | 0.0% |
| England | 19 | 0.1% |
| Europe | 183 | 0.6% |
| France | 2 | 0.0% |
| Germany | 55 | 0.2% |
| Guyana | 4 | 0.0% |
| India | 6 | 0.0% |
| Iran | 2 | 0.0% |
| Ireland | 22 | 0.1% |
| Italy | 2 | 0.0% |
| Japan | 2 | 0.0% |
| Kazakhstan | 2 | 0.0% |
| Kenya | 15 | 0.1% |
| Korea | 10 | 0.0% |
| Latin America | 159 | 0.5% |
| Malaysia | 1 | 0.0% |
| Mexico | 61 | 0.2% |
| Netherlands | 12 | 0.0% |
| Nigeria | 24 | 0.1% |
| Northern Africa | 3 | 0.0% |
| Northern Europe | 71 | 0.2% |
| Oceania | 14 | 0.1% |
| Peru | 9 | 0.0% |
| Philippines | 32 | 0.1% |
| Poland | 1 | 0.0% |
| Portugal | 10 | 0.0% |
| Romania | 2 | 0.0% |
| Russia | 16 | 0.1% |
| Scotland | 2 | 0.0% |
| Somalia | 3 | 0.0% |
| South Africa | 9 | 0.0% |
| South America | 35 | 0.1% |
| South Central Asia | 10 | 0.0% |
| South Eastern Asia | 47 | 0.2% |
| Southern Europe | 12 | 0.0% |
| Switzerland | 2 | 0.0% |
| Taiwan | 3 | 0.0% |
| Thailand | 3 | 0.0% |
| Turkey | 3 | 0.0% |
| Uganda | 6 | 0.0% |
| Ukraine | 7 | 0.0% |
| Vietnam | 11 | 0.0% |
| Western Africa | 24 | 0.1% |
| Western Asia | 3 | 0.0% |
| Western Europe | 74 | 0.2% | View All 62 Rows |
Sex and Age in Washington County
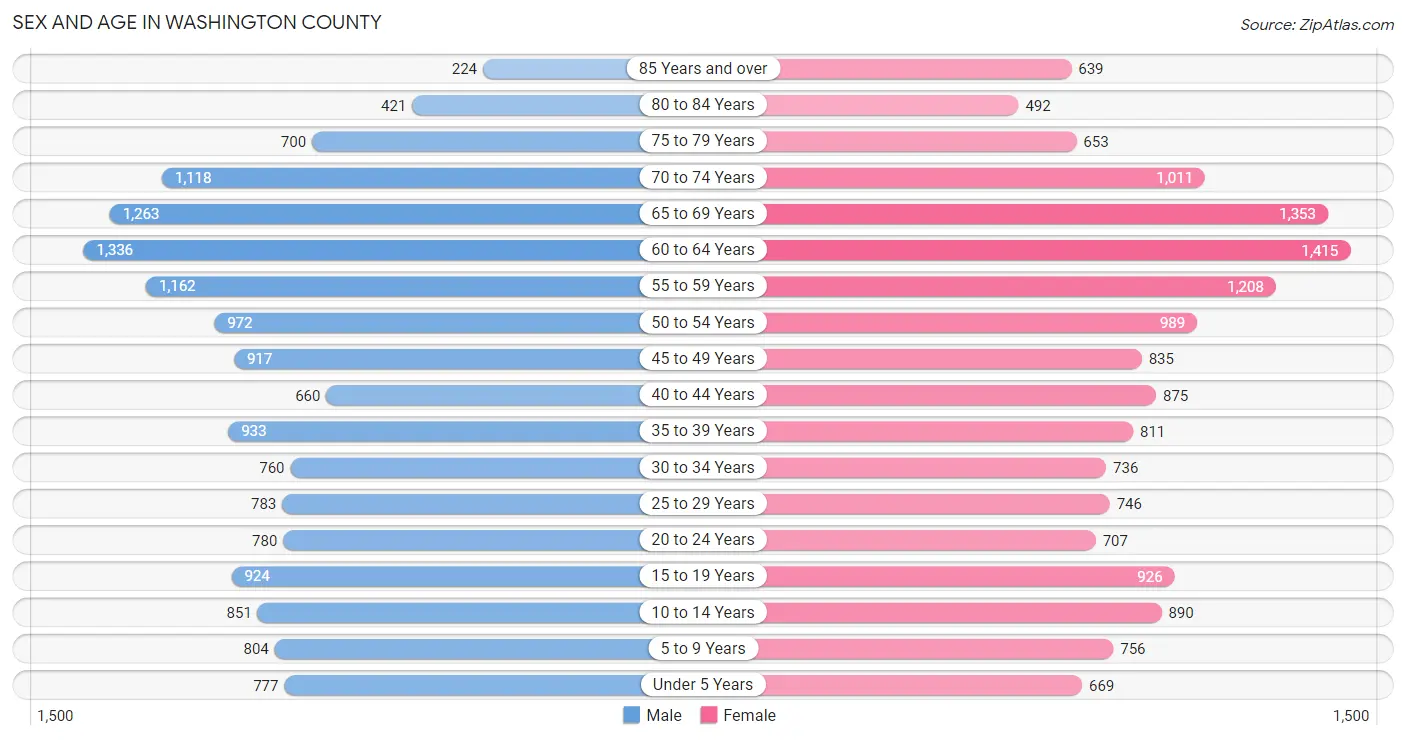
Sex and Age in Washington County
The most populous age groups in Washington County are 60 to 64 Years (1,336 | 8.7%) for men and 60 to 64 Years (1,415 | 9.0%) for women.
| Age Bracket | Male | Female |
| Under 5 Years | 777 (5.1%) | 669 (4.3%) |
| 5 to 9 Years | 804 (5.2%) | 756 (4.8%) |
| 10 to 14 Years | 851 (5.5%) | 890 (5.7%) |
| 15 to 19 Years | 924 (6.0%) | 926 (5.9%) |
| 20 to 24 Years | 780 (5.1%) | 707 (4.5%) |
| 25 to 29 Years | 783 (5.1%) | 746 (4.8%) |
| 30 to 34 Years | 760 (4.9%) | 736 (4.7%) |
| 35 to 39 Years | 933 (6.1%) | 811 (5.2%) |
| 40 to 44 Years | 660 (4.3%) | 875 (5.6%) |
| 45 to 49 Years | 917 (6.0%) | 835 (5.3%) |
| 50 to 54 Years | 972 (6.3%) | 989 (6.3%) |
| 55 to 59 Years | 1,162 (7.5%) | 1,208 (7.7%) |
| 60 to 64 Years | 1,336 (8.7%) | 1,415 (9.0%) |
| 65 to 69 Years | 1,263 (8.2%) | 1,353 (8.6%) |
| 70 to 74 Years | 1,118 (7.3%) | 1,011 (6.4%) |
| 75 to 79 Years | 700 (4.5%) | 653 (4.2%) |
| 80 to 84 Years | 421 (2.7%) | 492 (3.1%) |
| 85 Years and over | 224 (1.5%) | 639 (4.1%) |
| Total | 15,385 (100.0%) | 15,711 (100.0%) |
Families and Households in Washington County
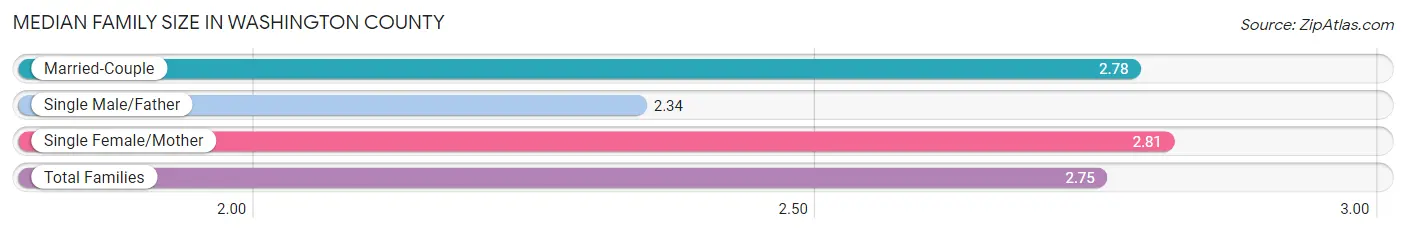
Median Family Size in Washington County
The median family size in Washington County is 2.75 persons per family, with single female/mother families (1,406 | 16.9%) accounting for the largest median family size of 2.81 persons per family. On the other hand, single male/father families (762 | 9.2%) represent the smallest median family size with 2.34 persons per family.
| Family Type | # Families | Family Size |
| Married-Couple | 6,134 (73.9%) | 2.78 |
| Single Male/Father | 762 (9.2%) | 2.34 |
| Single Female/Mother | 1,406 (16.9%) | 2.81 |
| Total Families | 8,302 (100.0%) | 2.75 |
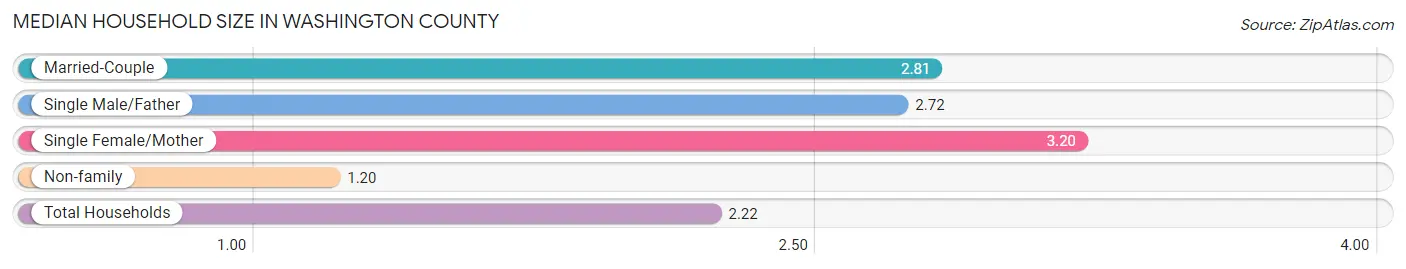
Median Household Size in Washington County
The median household size in Washington County is 2.22 persons per household, with single female/mother households (1,406 | 10.3%) accounting for the largest median household size of 3.2 persons per household. non-family households (5,283 | 38.9%) represent the smallest median household size with 1.20 persons per household.
| Household Type | # Households | Household Size |
| Married-Couple | 6,134 (45.2%) | 2.81 |
| Single Male/Father | 762 (5.6%) | 2.72 |
| Single Female/Mother | 1,406 (10.3%) | 3.20 |
| Non-family | 5,283 (38.9%) | 1.20 |
| Total Households | 13,585 (100.0%) | 2.22 |
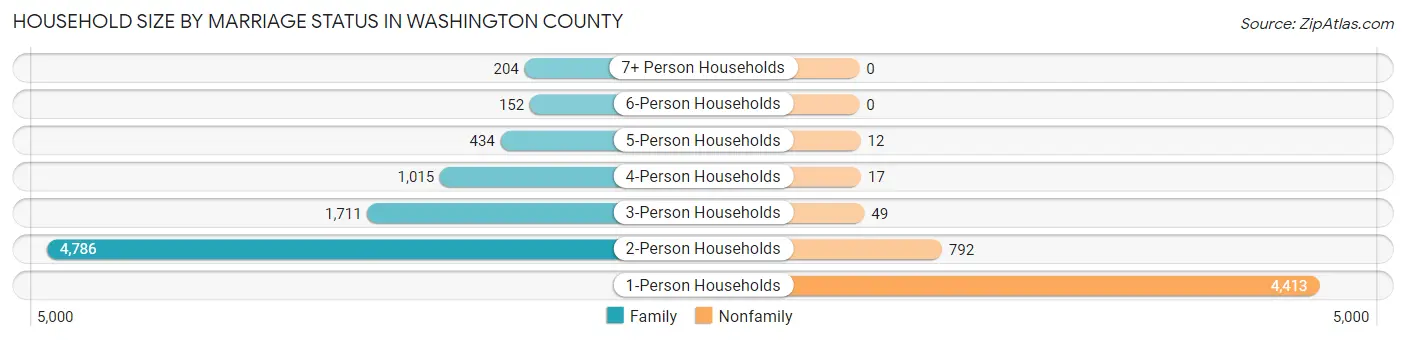
Household Size by Marriage Status in Washington County
Out of a total of 13,585 households in Washington County, 8,302 (61.1%) are family households, while 5,283 (38.9%) are nonfamily households. The most numerous type of family households are 2-person households, comprising 4,786, and the most common type of nonfamily households are 1-person households, comprising 4,413.
| Household Size | Family Households | Nonfamily Households |
| 1-Person Households | - | 4,413 (32.5%) |
| 2-Person Households | 4,786 (35.2%) | 792 (5.8%) |
| 3-Person Households | 1,711 (12.6%) | 49 (0.4%) |
| 4-Person Households | 1,015 (7.5%) | 17 (0.1%) |
| 5-Person Households | 434 (3.2%) | 12 (0.1%) |
| 6-Person Households | 152 (1.1%) | 0 (0.0%) |
| 7+ Person Households | 204 (1.5%) | 0 (0.0%) |
| Total | 8,302 (61.1%) | 5,283 (38.9%) |
Female Fertility in Washington County
Fertility by Age in Washington County
Average fertility rate in Washington County is 63.0 births per 1,000 women. Women in the age bracket of 20 to 34 years have the highest fertility rate with 124.0 births per 1,000 women. Women in the age bracket of 20 to 34 years acount for 73.5% of all women with births.
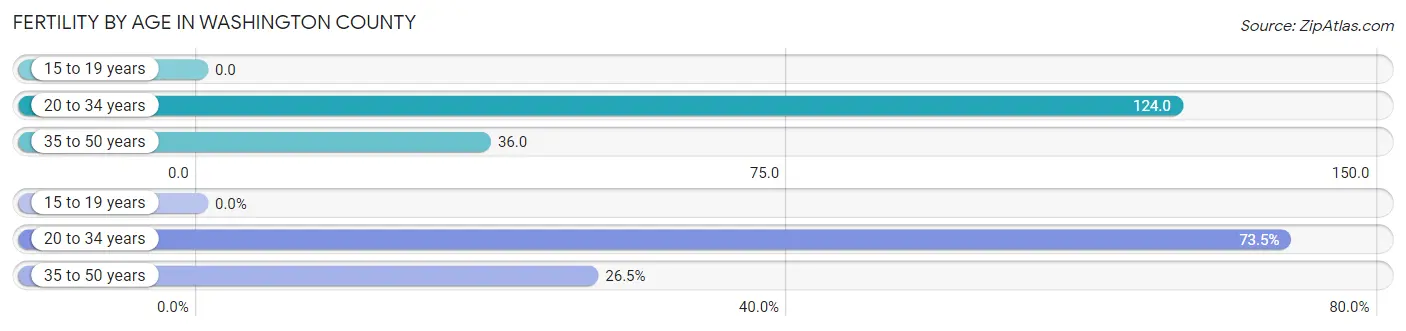
| Age Bracket | Women with Births | Births / 1,000 Women |
| 15 to 19 years | 0 (0.0%) | 0.0 |
| 20 to 34 years | 272 (73.5%) | 124.0 |
| 35 to 50 years | 98 (26.5%) | 36.0 |
| Total | 370 (100.0%) | 63.0 |
Fertility by Age by Marriage Status in Washington County
70.5% of women with births (370) in Washington County are married. The highest percentage of unmarried women with births falls into 20 to 34 years age bracket with 32.7% of them unmarried at the time of birth, while the lowest percentage of unmarried women with births belong to 35 to 50 years age bracket with 20.4% of them unmarried.
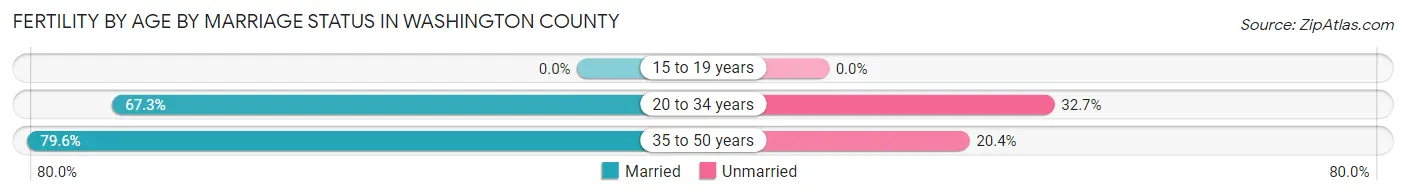
| Age Bracket | Married | Unmarried |
| 15 to 19 years | 0 (0.0%) | 0 (0.0%) |
| 20 to 34 years | 183 (67.3%) | 89 (32.7%) |
| 35 to 50 years | 78 (79.6%) | 20 (20.4%) |
| Total | 261 (70.5%) | 109 (29.5%) |
Fertility by Education in Washington County
Average fertility rate in Washington County is 63.0 births per 1,000 women. Women with the education attainment of bachelor's degree have the highest fertility rate of 97.0 births per 1,000 women, while women with the education attainment of less than high school have the lowest fertility at 18.0 births per 1,000 women. Women with the education attainment of college or associate's degree represent 35.7% of all women with births.
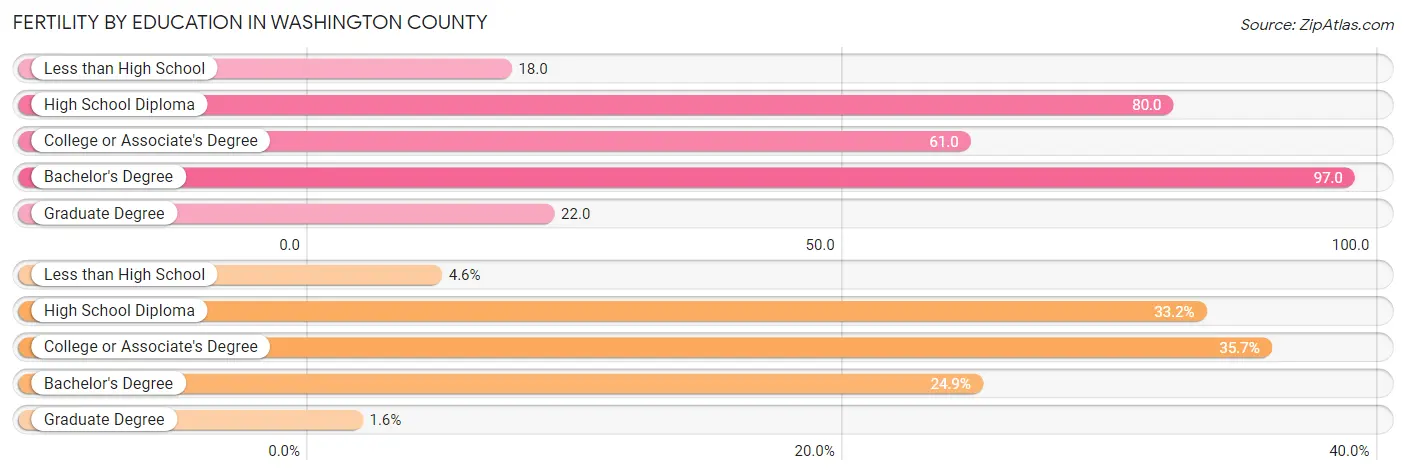
| Educational Attainment | Women with Births | Births / 1,000 Women |
| Less than High School | 17 (4.6%) | 18.0 |
| High School Diploma | 123 (33.2%) | 80.0 |
| College or Associate's Degree | 132 (35.7%) | 61.0 |
| Bachelor's Degree | 92 (24.9%) | 97.0 |
| Graduate Degree | 6 (1.6%) | 22.0 |
| Total | 370 (100.0%) | 63.0 |
Fertility by Education by Marriage Status in Washington County
29.5% of women with births in Washington County are unmarried. Women with the educational attainment of graduate degree are most likely to be married with 100.0% of them married at childbirth, while women with the educational attainment of less than high school are least likely to be married with 76.5% of them unmarried at childbirth.
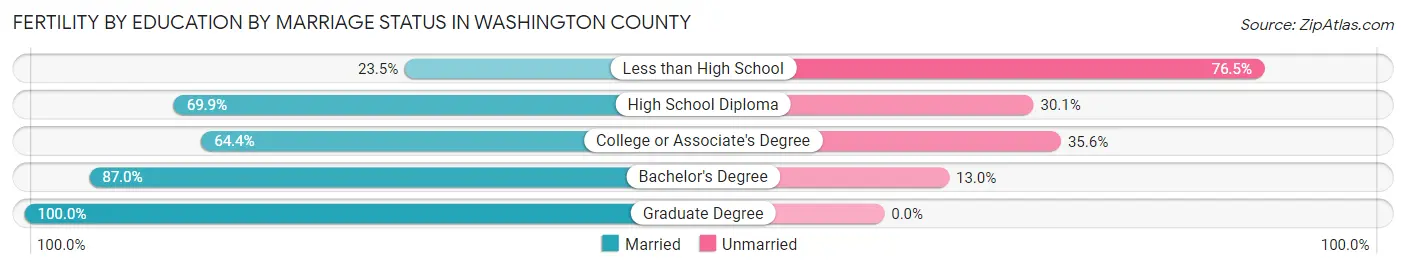
| Educational Attainment | Married | Unmarried |
| Less than High School | 4 (23.5%) | 13 (76.5%) |
| High School Diploma | 86 (69.9%) | 37 (30.1%) |
| College or Associate's Degree | 85 (64.4%) | 47 (35.6%) |
| Bachelor's Degree | 80 (87.0%) | 12 (13.0%) |
| Graduate Degree | 6 (100.0%) | 0 (0.0%) |
| Total | 261 (70.5%) | 109 (29.5%) |
Employment Characteristics in Washington County
Employment by Class of Employer in Washington County
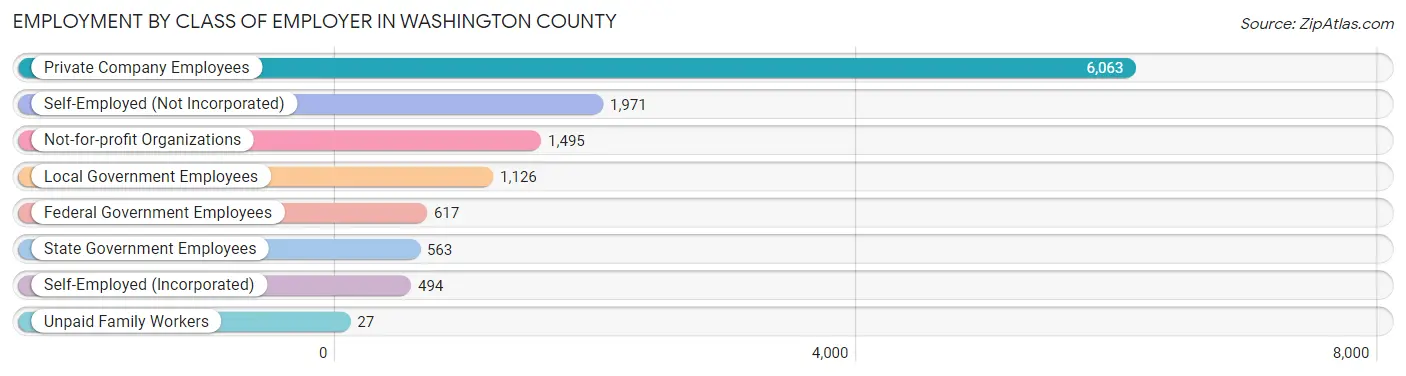
Among the 12,356 employed individuals in Washington County, private company employees (6,063 | 49.1%), self-employed (not incorporated) (1,971 | 16.0%), and not-for-profit organizations (1,495 | 12.1%) make up the most common classes of employment.
| Employer Class | # Employees | % Employees |
| Private Company Employees | 6,063 | 49.1% |
| Self-Employed (Incorporated) | 494 | 4.0% |
| Self-Employed (Not Incorporated) | 1,971 | 16.0% |
| Not-for-profit Organizations | 1,495 | 12.1% |
| Local Government Employees | 1,126 | 9.1% |
| State Government Employees | 563 | 4.6% |
| Federal Government Employees | 617 | 5.0% |
| Unpaid Family Workers | 27 | 0.2% |
| Total | 12,356 | 100.0% |
Employment Status by Age in Washington County
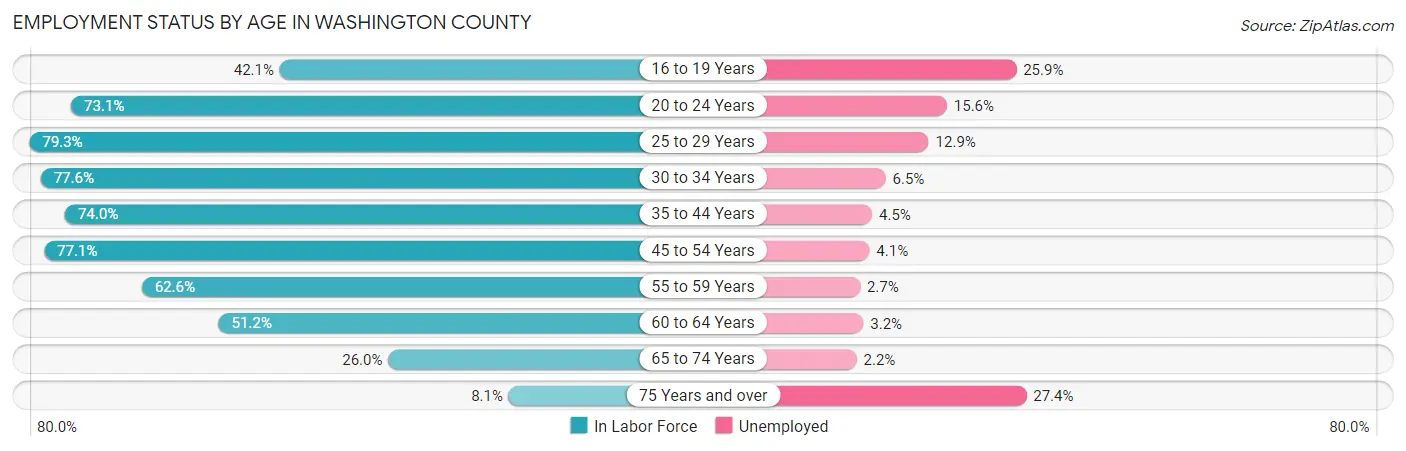
According to the labor force statistics for Washington County, out of the total population over 16 years of age (25,987), 52.9% or 13,747 individuals are in the labor force, with 7.0% or 962 of them unemployed. The age group with the highest labor force participation rate is 25 to 29 years, with 79.3% or 1,212 individuals in the labor force. Within the labor force, the 75 years and over age range has the highest percentage of unemployed individuals, with 27.4% or 69 of them being unemployed.
| Age Bracket | In Labor Force | Unemployed |
| 16 to 19 Years | 626 (42.1%) | 162 (25.9%) |
| 20 to 24 Years | 1,087 (73.1%) | 170 (15.6%) |
| 25 to 29 Years | 1,212 (79.3%) | 156 (12.9%) |
| 30 to 34 Years | 1,161 (77.6%) | 75 (6.5%) |
| 35 to 44 Years | 2,426 (74.0%) | 109 (4.5%) |
| 45 to 54 Years | 2,863 (77.1%) | 117 (4.1%) |
| 55 to 59 Years | 1,484 (62.6%) | 40 (2.7%) |
| 60 to 64 Years | 1,409 (51.2%) | 45 (3.2%) |
| 65 to 74 Years | 1,234 (26.0%) | 27 (2.2%) |
| 75 Years and over | 253 (8.1%) | 69 (27.4%) |
| Total | 13,747 (52.9%) | 962 (7.0%) |
Employment Status by Educational Attainment in Washington County
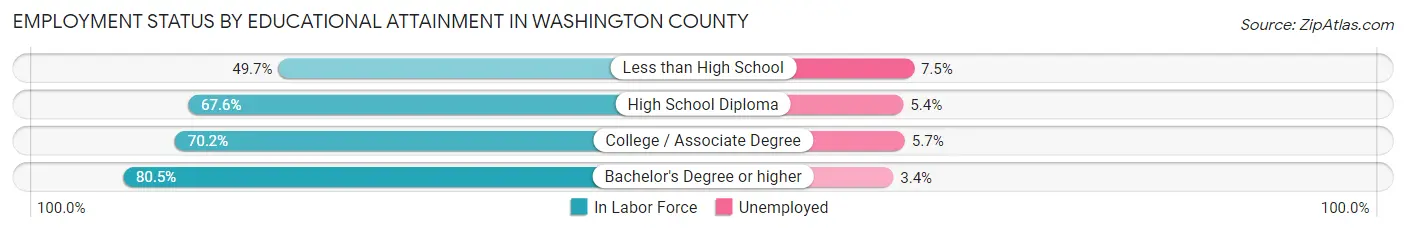
According to labor force statistics for Washington County, 69.7% of individuals (10,551) out of the total population between 25 and 64 years of age (15,138) are in the labor force, with 5.1% or 538 of them being unemployed. The group with the highest labor force participation rate are those with the educational attainment of bachelor's degree or higher, with 80.5% or 2,650 individuals in the labor force. Within the labor force, individuals with less than high school education have the highest percentage of unemployment, with 7.5% or 49 of them being unemployed.
| Educational Attainment | In Labor Force | Unemployed |
| Less than High School | 657 (49.7%) | 99 (7.5%) |
| High School Diploma | 3,721 (67.6%) | 297 (5.4%) |
| College / Associate Degree | 3,523 (70.2%) | 286 (5.7%) |
| Bachelor's Degree or higher | 2,650 (80.5%) | 112 (3.4%) |
| Total | 10,551 (69.7%) | 772 (5.1%) |
Employment Occupations by Sex in Washington County
Management, Business, Science and Arts Occupations
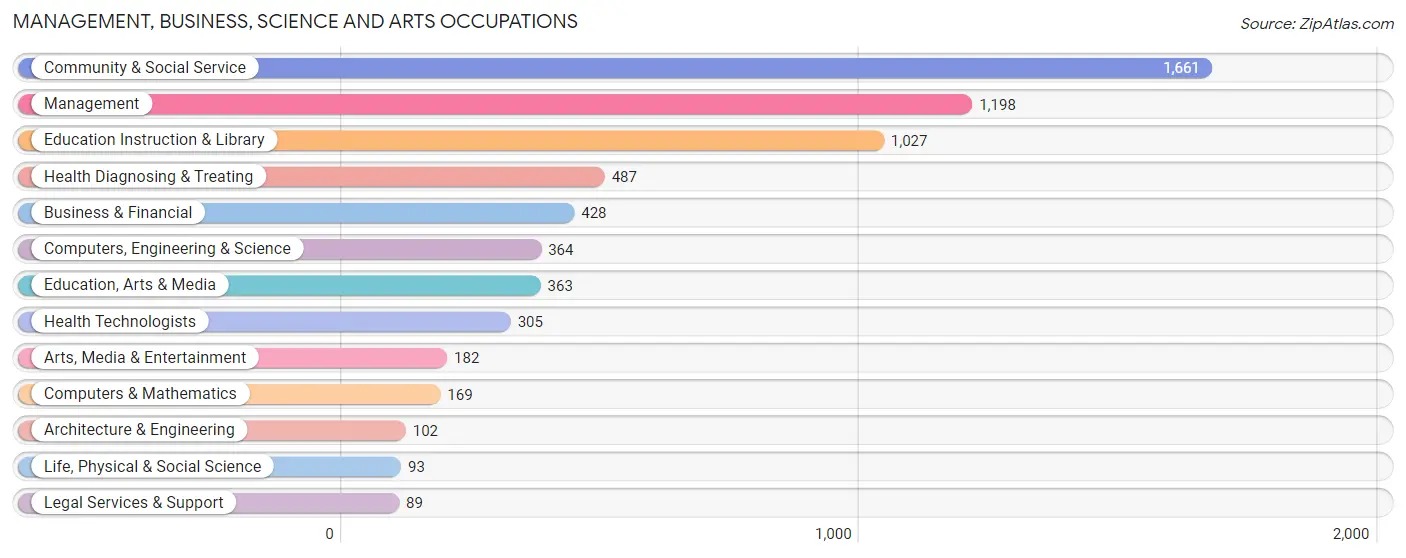
The most common Management, Business, Science and Arts occupations in Washington County are Community & Social Service (1,661 | 13.0%), Management (1,198 | 9.4%), Education Instruction & Library (1,027 | 8.1%), Health Diagnosing & Treating (487 | 3.8%), and Business & Financial (428 | 3.4%).
Management, Business, Science and Arts Occupations by Sex
Within the Management, Business, Science and Arts occupations in Washington County, the most male-oriented occupations are Architecture & Engineering (92.2%), Computers, Engineering & Science (71.4%), and Computers & Mathematics (66.9%), while the most female-oriented occupations are Health Diagnosing & Treating (85.6%), Education, Arts & Media (85.1%), and Health Technologists (83.6%).
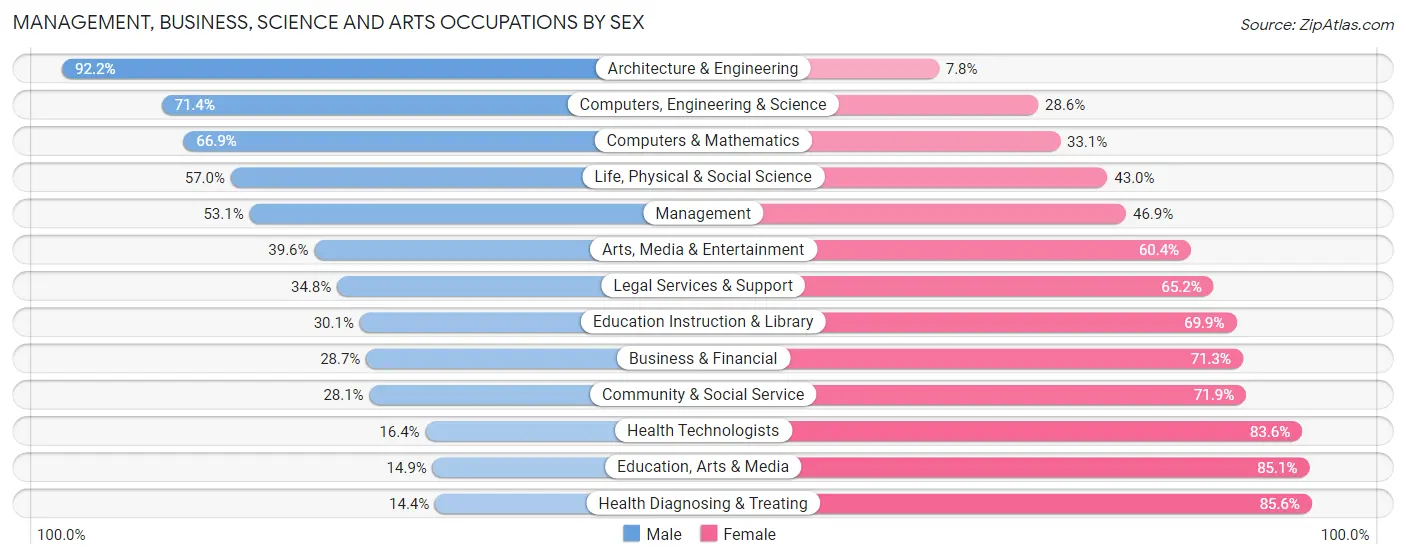
| Occupation | Male | Female |
| Management | 636 (53.1%) | 562 (46.9%) |
| Business & Financial | 123 (28.7%) | 305 (71.3%) |
| Computers, Engineering & Science | 260 (71.4%) | 104 (28.6%) |
| Computers & Mathematics | 113 (66.9%) | 56 (33.1%) |
| Architecture & Engineering | 94 (92.2%) | 8 (7.8%) |
| Life, Physical & Social Science | 53 (57.0%) | 40 (43.0%) |
| Community & Social Service | 466 (28.1%) | 1,195 (71.9%) |
| Education, Arts & Media | 54 (14.9%) | 309 (85.1%) |
| Legal Services & Support | 31 (34.8%) | 58 (65.2%) |
| Education Instruction & Library | 309 (30.1%) | 718 (69.9%) |
| Arts, Media & Entertainment | 72 (39.6%) | 110 (60.4%) |
| Health Diagnosing & Treating | 70 (14.4%) | 417 (85.6%) |
| Health Technologists | 50 (16.4%) | 255 (83.6%) |
| Total (Category) | 1,555 (37.6%) | 2,583 (62.4%) |
| Total (Overall) | 6,525 (51.2%) | 6,212 (48.8%) |
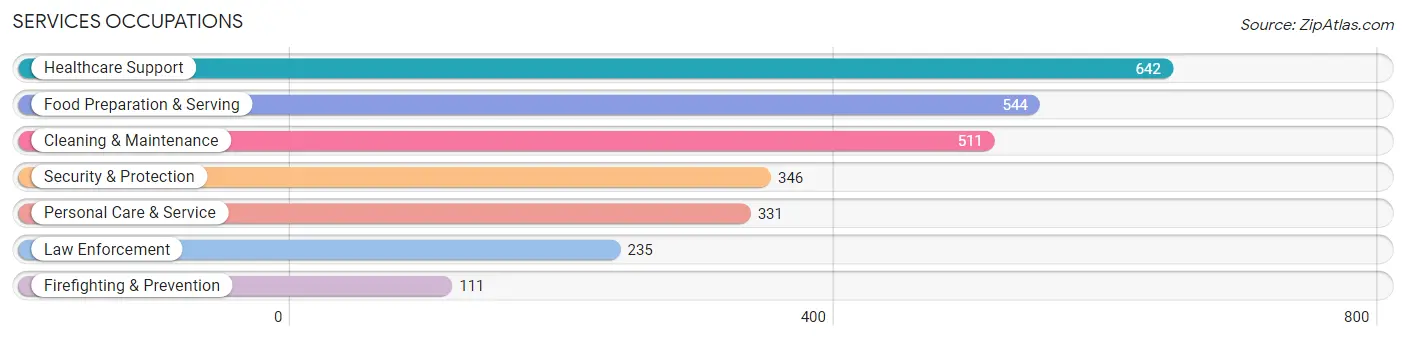
Services Occupations
The most common Services occupations in Washington County are Healthcare Support (642 | 5.0%), Food Preparation & Serving (544 | 4.3%), Cleaning & Maintenance (511 | 4.0%), Security & Protection (346 | 2.7%), and Personal Care & Service (331 | 2.6%).
Services Occupations by Sex
Within the Services occupations in Washington County, the most male-oriented occupations are Law Enforcement (91.9%), Security & Protection (91.0%), and Firefighting & Prevention (89.2%), while the most female-oriented occupations are Healthcare Support (91.1%), Personal Care & Service (82.5%), and Food Preparation & Serving (73.9%).
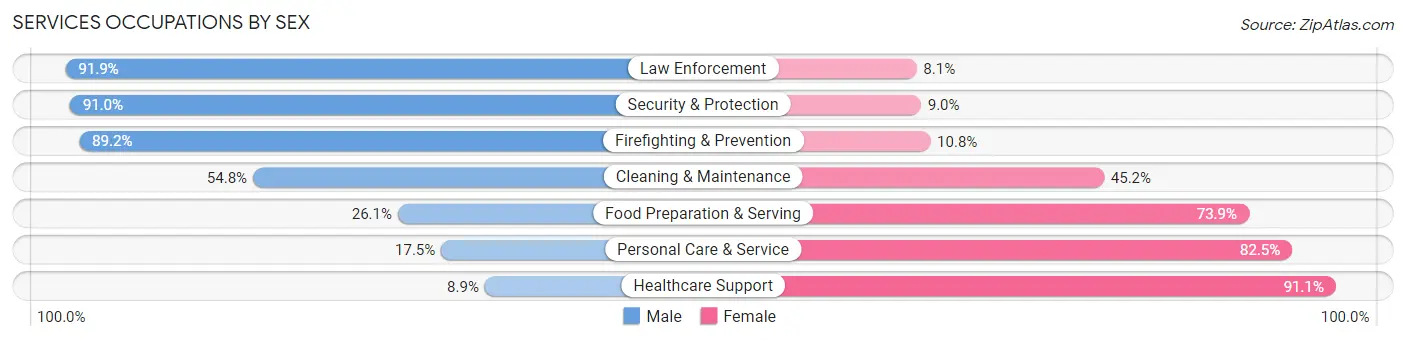
| Occupation | Male | Female |
| Healthcare Support | 57 (8.9%) | 585 (91.1%) |
| Security & Protection | 315 (91.0%) | 31 (9.0%) |
| Firefighting & Prevention | 99 (89.2%) | 12 (10.8%) |
| Law Enforcement | 216 (91.9%) | 19 (8.1%) |
| Food Preparation & Serving | 142 (26.1%) | 402 (73.9%) |
| Cleaning & Maintenance | 280 (54.8%) | 231 (45.2%) |
| Personal Care & Service | 58 (17.5%) | 273 (82.5%) |
| Total (Category) | 852 (35.9%) | 1,522 (64.1%) |
| Total (Overall) | 6,525 (51.2%) | 6,212 (48.8%) |
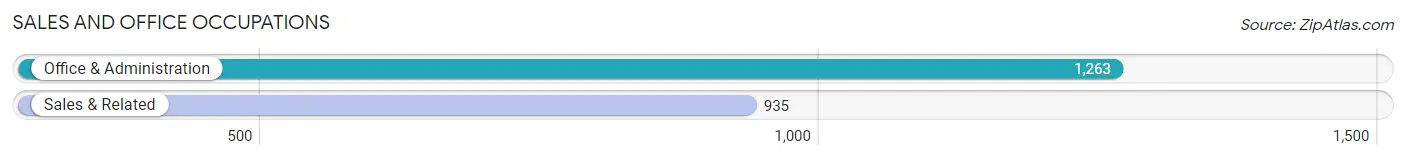
Sales and Office Occupations
The most common Sales and Office occupations in Washington County are Office & Administration (1,263 | 9.9%), and Sales & Related (935 | 7.3%).
Sales and Office Occupations by Sex
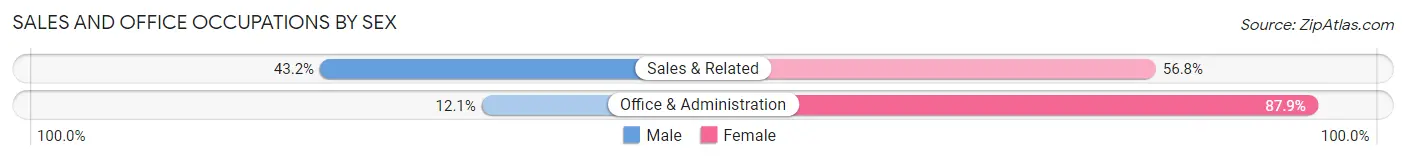
| Occupation | Male | Female |
| Sales & Related | 404 (43.2%) | 531 (56.8%) |
| Office & Administration | 153 (12.1%) | 1,110 (87.9%) |
| Total (Category) | 557 (25.3%) | 1,641 (74.7%) |
| Total (Overall) | 6,525 (51.2%) | 6,212 (48.8%) |
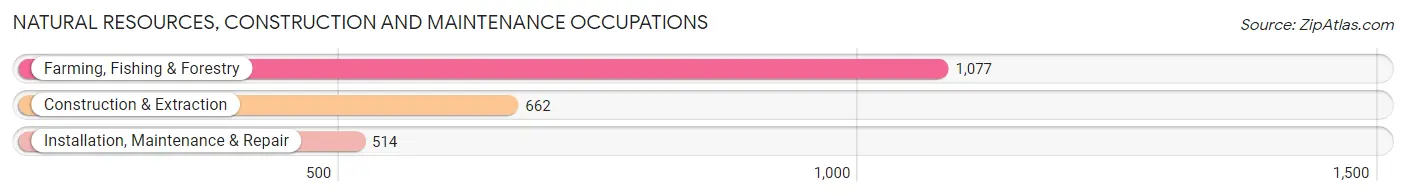
Natural Resources, Construction and Maintenance Occupations
The most common Natural Resources, Construction and Maintenance occupations in Washington County are Farming, Fishing & Forestry (1,077 | 8.5%), Construction & Extraction (662 | 5.2%), and Installation, Maintenance & Repair (514 | 4.0%).
Natural Resources, Construction and Maintenance Occupations by Sex
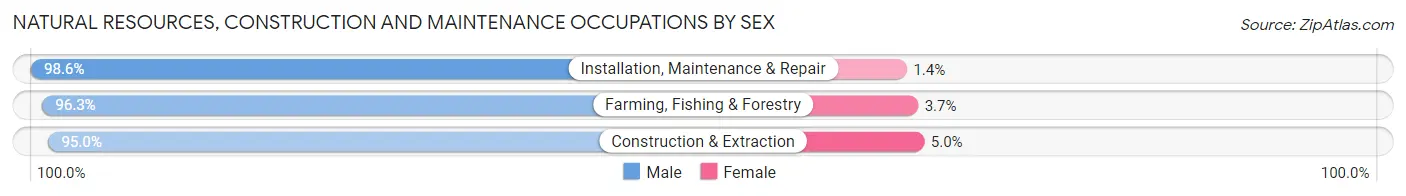
| Occupation | Male | Female |
| Farming, Fishing & Forestry | 1,037 (96.3%) | 40 (3.7%) |
| Construction & Extraction | 629 (95.0%) | 33 (5.0%) |
| Installation, Maintenance & Repair | 507 (98.6%) | 7 (1.4%) |
| Total (Category) | 2,173 (96.5%) | 80 (3.5%) |
| Total (Overall) | 6,525 (51.2%) | 6,212 (48.8%) |
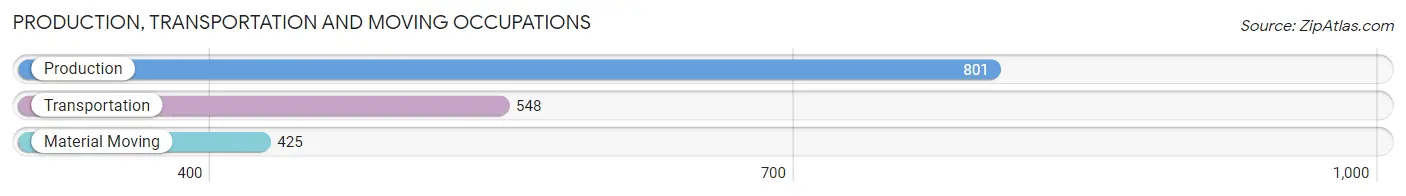
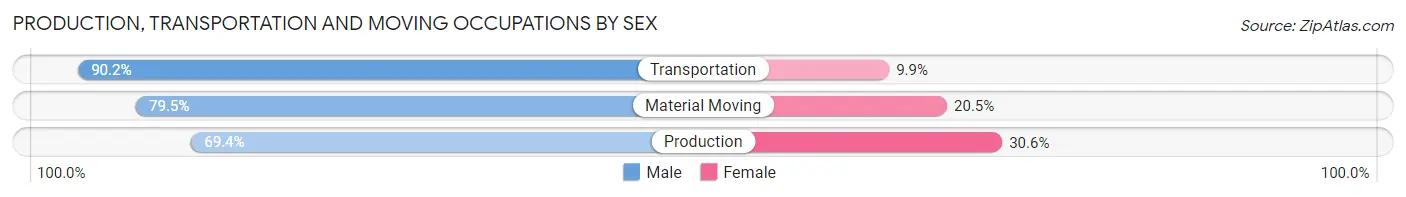
Production, Transportation and Moving Occupations
The most common Production, Transportation and Moving occupations in Washington County are Production (801 | 6.3%), Transportation (548 | 4.3%), and Material Moving (425 | 3.3%).
Production, Transportation and Moving Occupations by Sex
| Occupation | Male | Female |
| Production | 556 (69.4%) | 245 (30.6%) |
| Transportation | 494 (90.1%) | 54 (9.9%) |
| Material Moving | 338 (79.5%) | 87 (20.5%) |
| Total (Category) | 1,388 (78.2%) | 386 (21.8%) |
| Total (Overall) | 6,525 (51.2%) | 6,212 (48.8%) |
Employment Industries by Sex in Washington County
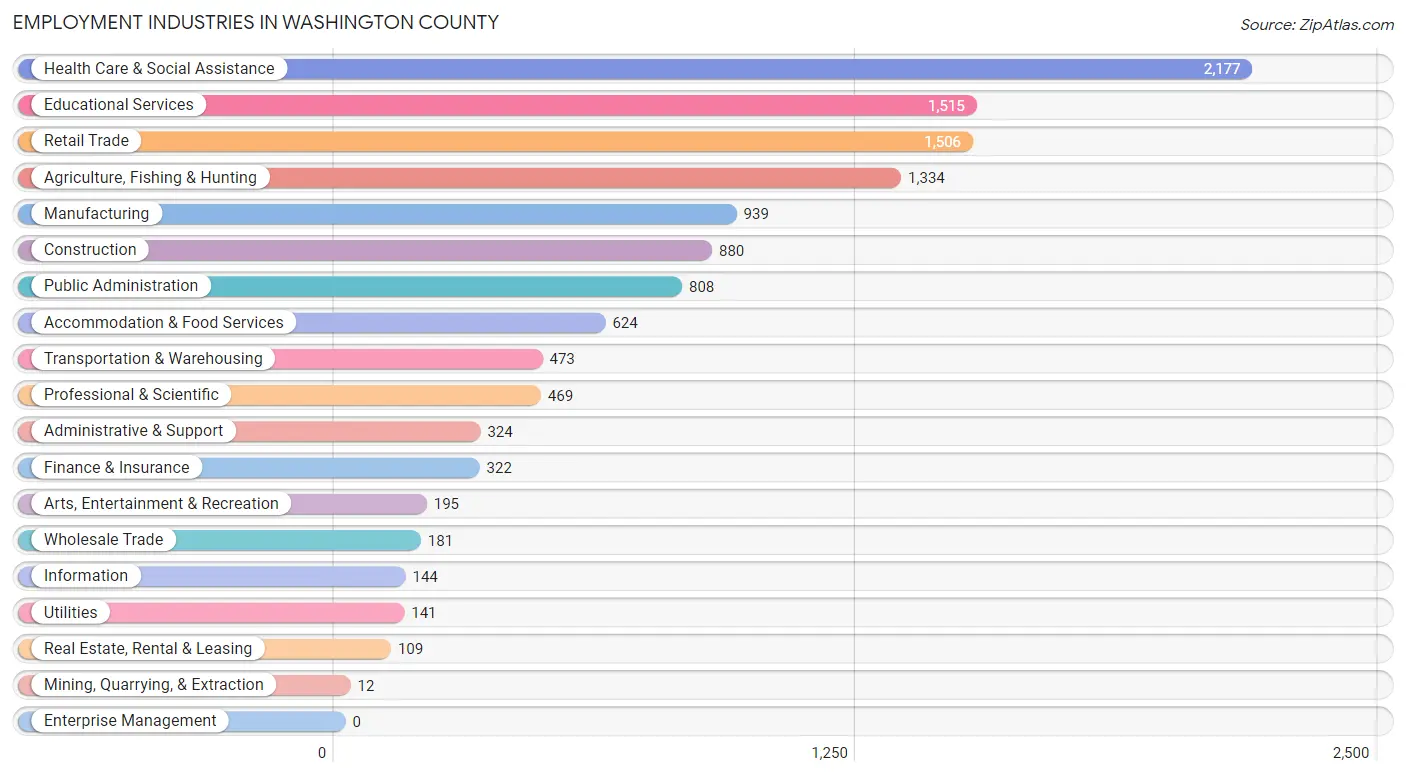
Employment Industries in Washington County
The major employment industries in Washington County include Health Care & Social Assistance (2,177 | 17.1%), Educational Services (1,515 | 11.9%), Retail Trade (1,506 | 11.8%), Agriculture, Fishing & Hunting (1,334 | 10.5%), and Manufacturing (939 | 7.4%).
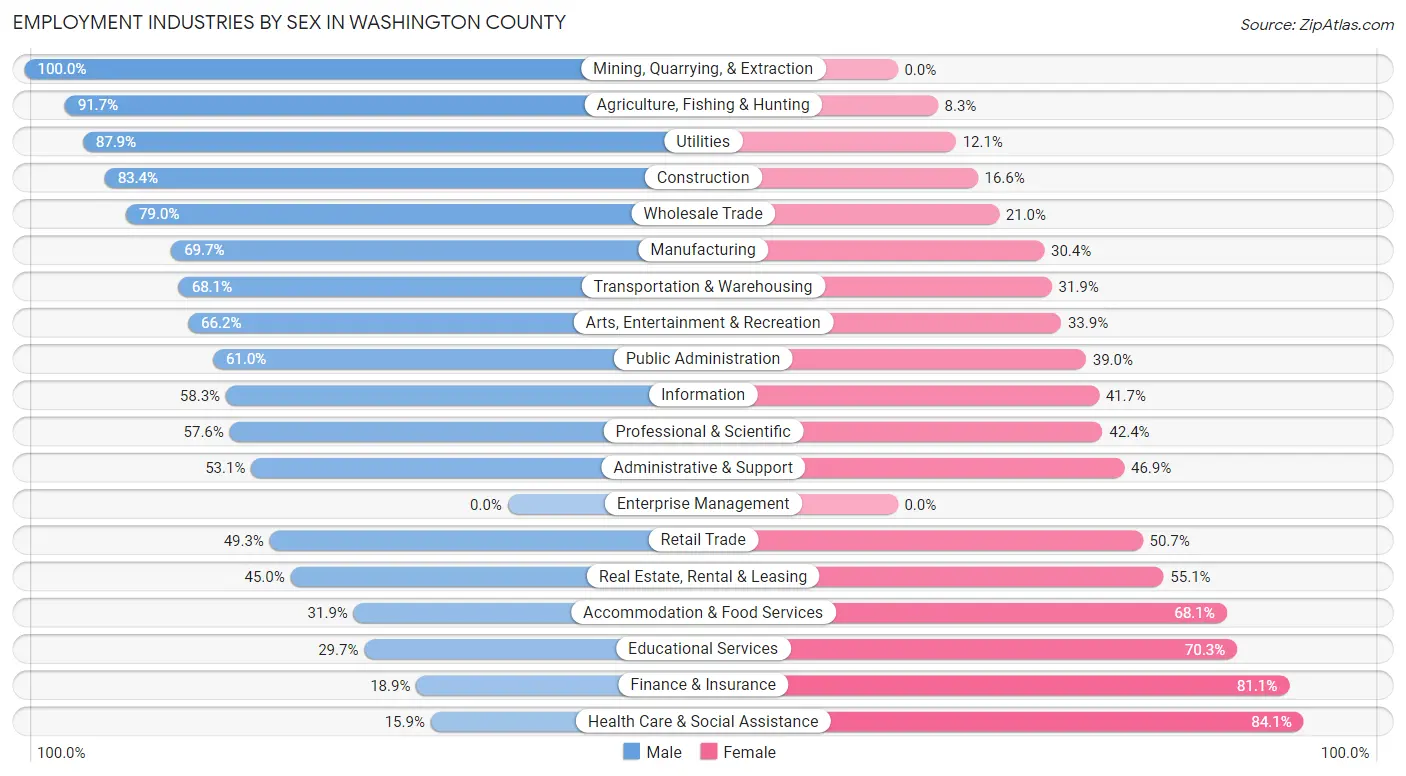
Employment Industries by Sex in Washington County
The Washington County industries that see more men than women are Mining, Quarrying, & Extraction (100.0%), Agriculture, Fishing & Hunting (91.7%), and Utilities (87.9%), whereas the industries that tend to have a higher number of women are Health Care & Social Assistance (84.1%), Finance & Insurance (81.1%), and Educational Services (70.3%).
| Industry | Male | Female |
| Agriculture, Fishing & Hunting | 1,223 (91.7%) | 111 (8.3%) |
| Mining, Quarrying, & Extraction | 12 (100.0%) | 0 (0.0%) |
| Construction | 734 (83.4%) | 146 (16.6%) |
| Manufacturing | 654 (69.7%) | 285 (30.3%) |
| Wholesale Trade | 143 (79.0%) | 38 (21.0%) |
| Retail Trade | 742 (49.3%) | 764 (50.7%) |
| Transportation & Warehousing | 322 (68.1%) | 151 (31.9%) |
| Utilities | 124 (87.9%) | 17 (12.1%) |
| Information | 84 (58.3%) | 60 (41.7%) |
| Finance & Insurance | 61 (18.9%) | 261 (81.1%) |
| Real Estate, Rental & Leasing | 49 (45.0%) | 60 (55.0%) |
| Professional & Scientific | 270 (57.6%) | 199 (42.4%) |
| Enterprise Management | 0 (0.0%) | 0 (0.0%) |
| Administrative & Support | 172 (53.1%) | 152 (46.9%) |
| Educational Services | 450 (29.7%) | 1,065 (70.3%) |
| Health Care & Social Assistance | 347 (15.9%) | 1,830 (84.1%) |
| Arts, Entertainment & Recreation | 129 (66.1%) | 66 (33.9%) |
| Accommodation & Food Services | 199 (31.9%) | 425 (68.1%) |
| Public Administration | 493 (61.0%) | 315 (39.0%) |
| Total | 6,525 (51.2%) | 6,212 (48.8%) |
Education in Washington County
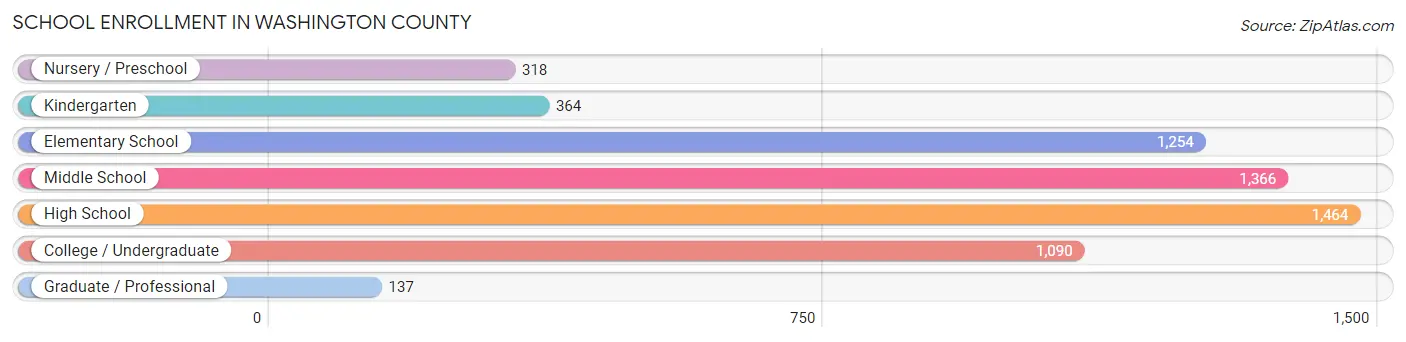
School Enrollment in Washington County
The most common levels of schooling among the 5,993 students in Washington County are high school (1,464 | 24.4%), middle school (1,366 | 22.8%), and elementary school (1,254 | 20.9%).
| School Level | # Students | % Students |
| Nursery / Preschool | 318 | 5.3% |
| Kindergarten | 364 | 6.1% |
| Elementary School | 1,254 | 20.9% |
| Middle School | 1,366 | 22.8% |
| High School | 1,464 | 24.4% |
| College / Undergraduate | 1,090 | 18.2% |
| Graduate / Professional | 137 | 2.3% |
| Total | 5,993 | 100.0% |
School Enrollment by Age by Funding Source in Washington County
Out of a total of 5,993 students who are enrolled in schools in Washington County, 893 (14.9%) attend a private institution, while the remaining 5,100 (85.1%) are enrolled in public schools. The age group of 25 to 34 year olds has the highest likelihood of being enrolled in private schools, with 60 (24.3% in the age bracket) enrolled. Conversely, the age group of 5 to 9 year old has the lowest likelihood of being enrolled in a private school, with 1,323 (88.3% in the age bracket) attending a public institution.
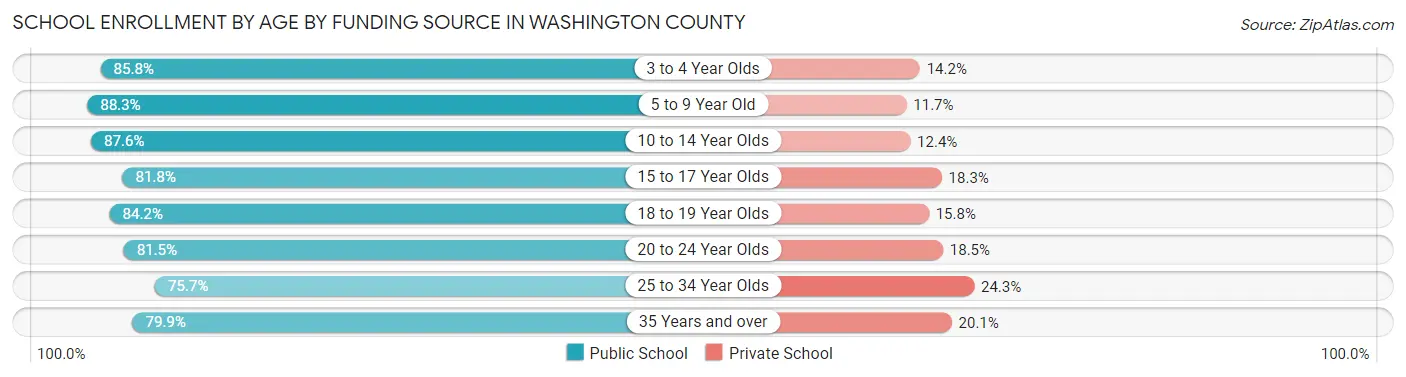
| Age Bracket | Public School | Private School |
| 3 to 4 Year Olds | 218 (85.8%) | 36 (14.2%) |
| 5 to 9 Year Old | 1,323 (88.3%) | 175 (11.7%) |
| 10 to 14 Year Olds | 1,493 (87.6%) | 211 (12.4%) |
| 15 to 17 Year Olds | 842 (81.8%) | 188 (18.2%) |
| 18 to 19 Year Olds | 473 (84.2%) | 89 (15.8%) |
| 20 to 24 Year Olds | 269 (81.5%) | 61 (18.5%) |
| 25 to 34 Year Olds | 187 (75.7%) | 60 (24.3%) |
| 35 Years and over | 294 (79.9%) | 74 (20.1%) |
| Total | 5,100 (85.1%) | 893 (14.9%) |
Educational Attainment by Field of Study in Washington County
Education (1,013 | 16.4%), business (797 | 12.9%), science & technology (604 | 9.8%), bio, nature & agricultural (517 | 8.4%), and social sciences (505 | 8.2%) are the most common fields of study among 6,189 individuals in Washington County who have obtained a bachelor's degree or higher.
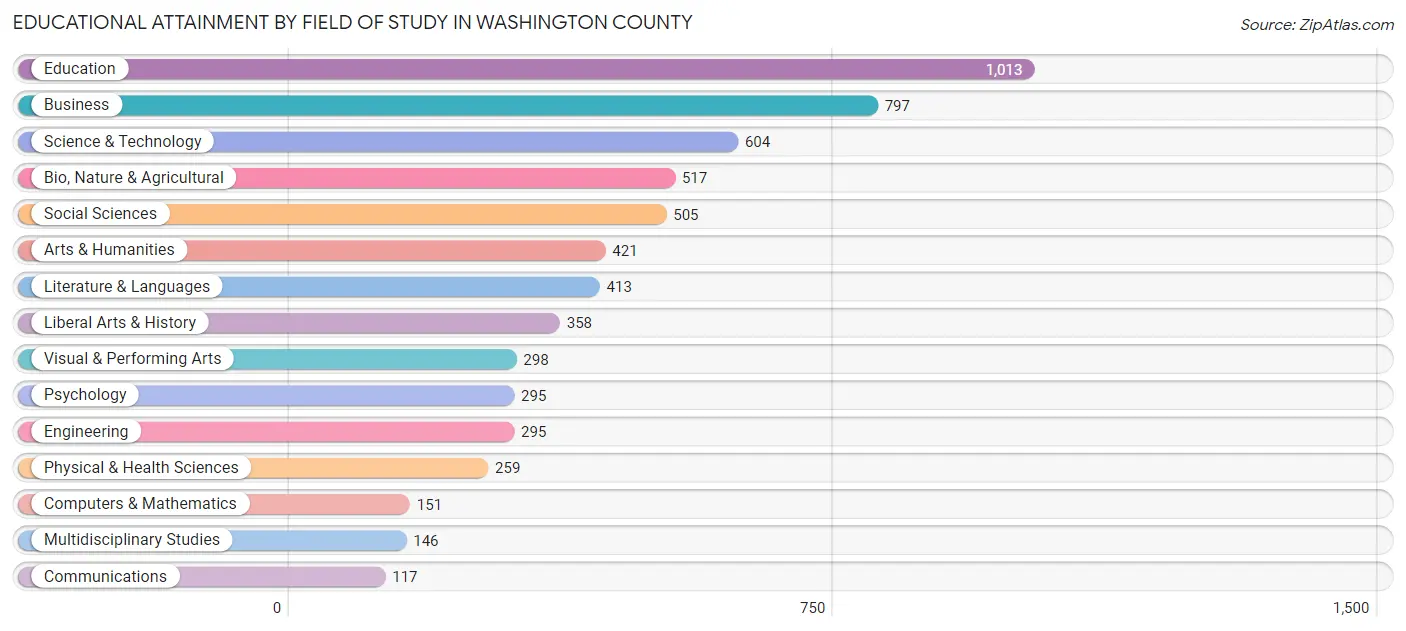
| Field of Study | # Graduates | % Graduates |
| Computers & Mathematics | 151 | 2.4% |
| Bio, Nature & Agricultural | 517 | 8.4% |
| Physical & Health Sciences | 259 | 4.2% |
| Psychology | 295 | 4.8% |
| Social Sciences | 505 | 8.2% |
| Engineering | 295 | 4.8% |
| Multidisciplinary Studies | 146 | 2.4% |
| Science & Technology | 604 | 9.8% |
| Business | 797 | 12.9% |
| Education | 1,013 | 16.4% |
| Literature & Languages | 413 | 6.7% |
| Liberal Arts & History | 358 | 5.8% |
| Visual & Performing Arts | 298 | 4.8% |
| Communications | 117 | 1.9% |
| Arts & Humanities | 421 | 6.8% |
| Total | 6,189 | 100.0% |
Transportation & Commute in Washington County
Vehicle Availability by Sex in Washington County
The most prevalent vehicle ownership categories in Washington County are males with 2 vehicles (2,968, accounting for 47.4%) and females with 2 vehicles (2,670, making up 50.0%).
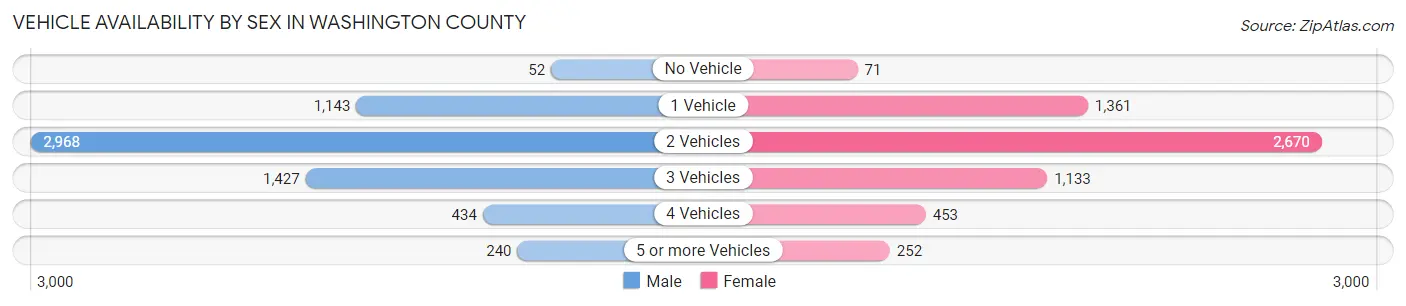
| Vehicles Available | Male | Female |
| No Vehicle | 52 (0.8%) | 71 (1.2%) |
| 1 Vehicle | 1,143 (18.2%) | 1,361 (22.9%) |
| 2 Vehicles | 2,968 (47.4%) | 2,670 (45.0%) |
| 3 Vehicles | 1,427 (22.8%) | 1,133 (19.1%) |
| 4 Vehicles | 434 (6.9%) | 453 (7.6%) |
| 5 or more Vehicles | 240 (3.8%) | 252 (4.2%) |
| Total | 6,264 (100.0%) | 5,940 (100.0%) |
Commute Time in Washington County
The most frequently occuring commute durations in Washington County are 5 to 9 minutes (1,817 commuters, 16.1%), 10 to 14 minutes (1,741 commuters, 15.4%), and less than 5 minutes (1,506 commuters, 13.3%).
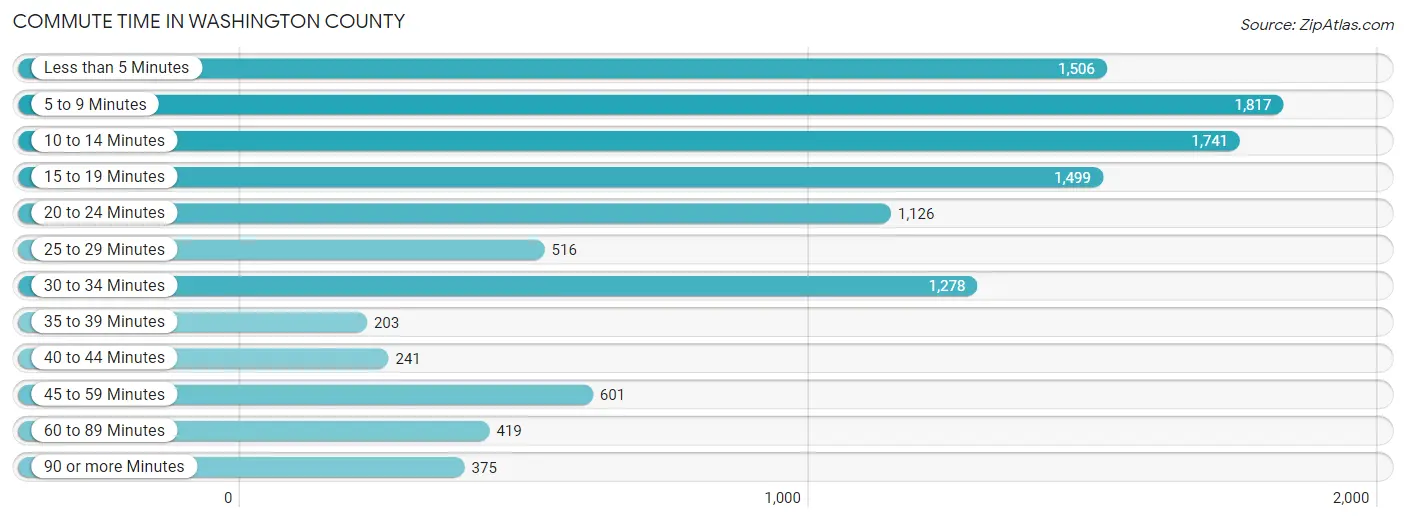
| Commute Time | # Commuters | % Commuters |
| Less than 5 Minutes | 1,506 | 13.3% |
| 5 to 9 Minutes | 1,817 | 16.1% |
| 10 to 14 Minutes | 1,741 | 15.4% |
| 15 to 19 Minutes | 1,499 | 13.2% |
| 20 to 24 Minutes | 1,126 | 10.0% |
| 25 to 29 Minutes | 516 | 4.6% |
| 30 to 34 Minutes | 1,278 | 11.3% |
| 35 to 39 Minutes | 203 | 1.8% |
| 40 to 44 Minutes | 241 | 2.1% |
| 45 to 59 Minutes | 601 | 5.3% |
| 60 to 89 Minutes | 419 | 3.7% |
| 90 or more Minutes | 375 | 3.3% |
Commute Time by Sex in Washington County
The most common commute times in Washington County are 15 to 19 minutes (868 commuters, 14.9%) for males and 5 to 9 minutes (971 commuters, 17.7%) for females.
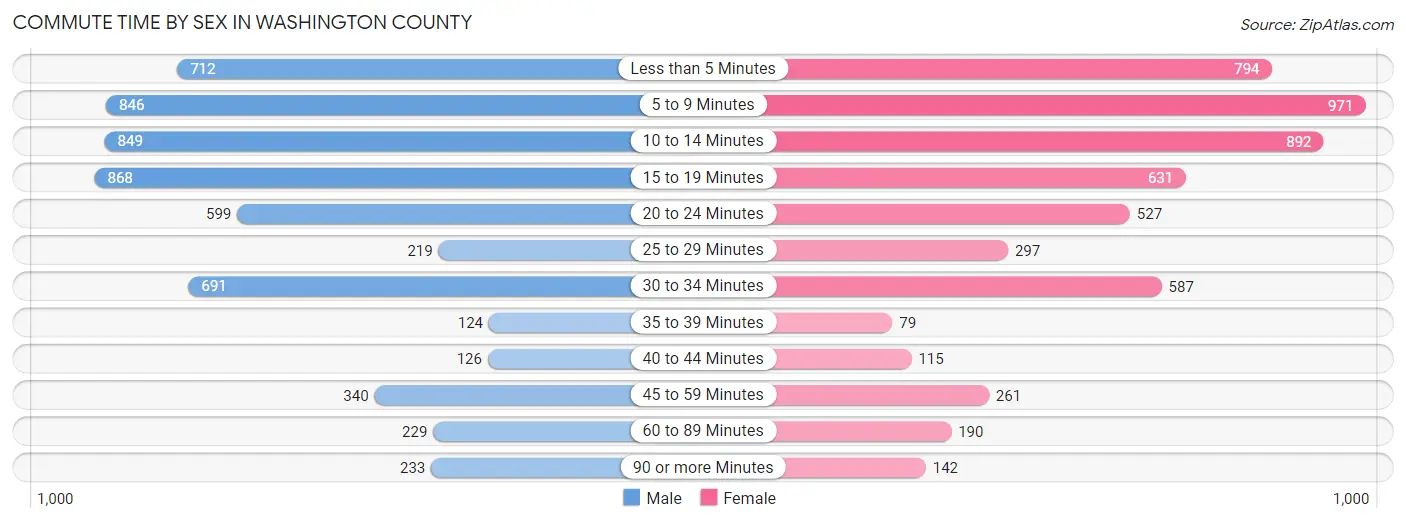
| Commute Time | Male | Female |
| Less than 5 Minutes | 712 (12.2%) | 794 (14.5%) |
| 5 to 9 Minutes | 846 (14.5%) | 971 (17.7%) |
| 10 to 14 Minutes | 849 (14.5%) | 892 (16.3%) |
| 15 to 19 Minutes | 868 (14.9%) | 631 (11.5%) |
| 20 to 24 Minutes | 599 (10.3%) | 527 (9.6%) |
| 25 to 29 Minutes | 219 (3.7%) | 297 (5.4%) |
| 30 to 34 Minutes | 691 (11.8%) | 587 (10.7%) |
| 35 to 39 Minutes | 124 (2.1%) | 79 (1.4%) |
| 40 to 44 Minutes | 126 (2.2%) | 115 (2.1%) |
| 45 to 59 Minutes | 340 (5.8%) | 261 (4.8%) |
| 60 to 89 Minutes | 229 (3.9%) | 190 (3.5%) |
| 90 or more Minutes | 233 (4.0%) | 142 (2.6%) |
Time of Departure to Work by Sex in Washington County
The most frequent times of departure to work in Washington County are 12:00 AM to 4:59 AM (980, 16.8%) for males and 7:00 AM to 7:29 AM (1,132, 20.6%) for females.
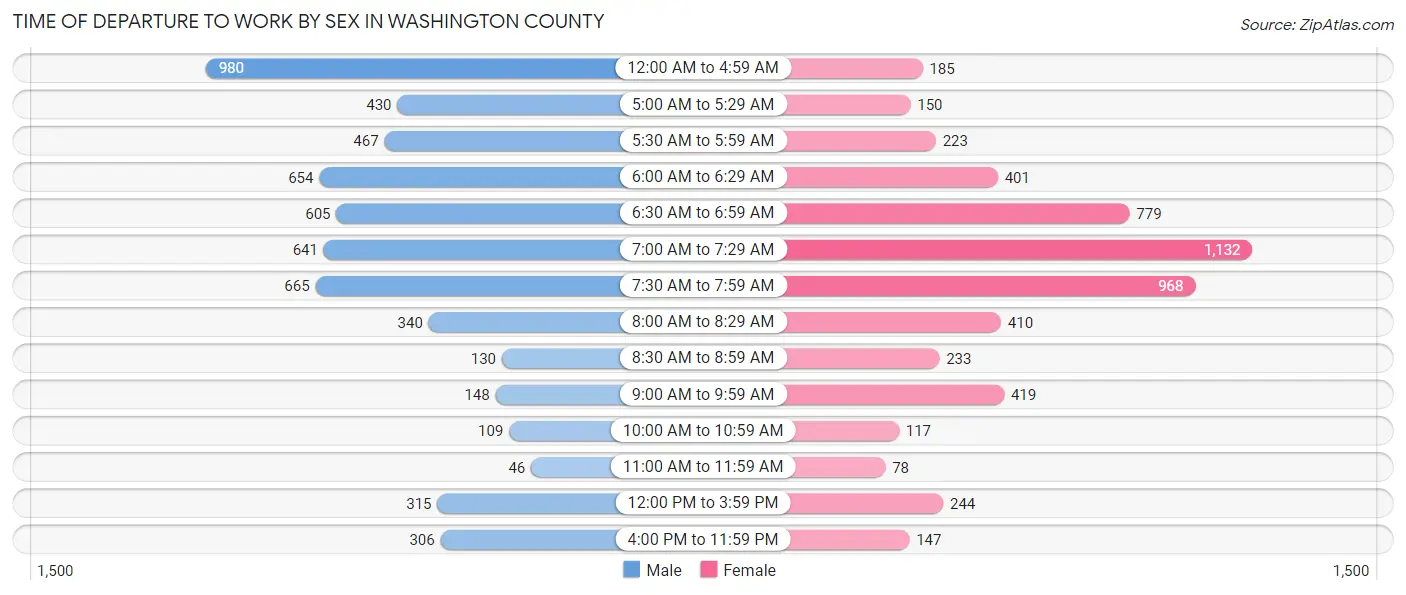
| Time of Departure | Male | Female |
| 12:00 AM to 4:59 AM | 980 (16.8%) | 185 (3.4%) |
| 5:00 AM to 5:29 AM | 430 (7.4%) | 150 (2.7%) |
| 5:30 AM to 5:59 AM | 467 (8.0%) | 223 (4.1%) |
| 6:00 AM to 6:29 AM | 654 (11.2%) | 401 (7.3%) |
| 6:30 AM to 6:59 AM | 605 (10.4%) | 779 (14.2%) |
| 7:00 AM to 7:29 AM | 641 (11.0%) | 1,132 (20.6%) |
| 7:30 AM to 7:59 AM | 665 (11.4%) | 968 (17.6%) |
| 8:00 AM to 8:29 AM | 340 (5.8%) | 410 (7.5%) |
| 8:30 AM to 8:59 AM | 130 (2.2%) | 233 (4.3%) |
| 9:00 AM to 9:59 AM | 148 (2.5%) | 419 (7.6%) |
| 10:00 AM to 10:59 AM | 109 (1.9%) | 117 (2.1%) |
| 11:00 AM to 11:59 AM | 46 (0.8%) | 78 (1.4%) |
| 12:00 PM to 3:59 PM | 315 (5.4%) | 244 (4.4%) |
| 4:00 PM to 11:59 PM | 306 (5.2%) | 147 (2.7%) |
| Total | 5,836 (100.0%) | 5,486 (100.0%) |
Housing Occupancy in Washington County
Occupancy by Ownership in Washington County
Of the total 13,585 dwellings in Washington County, owner-occupied units account for 10,645 (78.4%), while renter-occupied units make up 2,940 (21.6%).
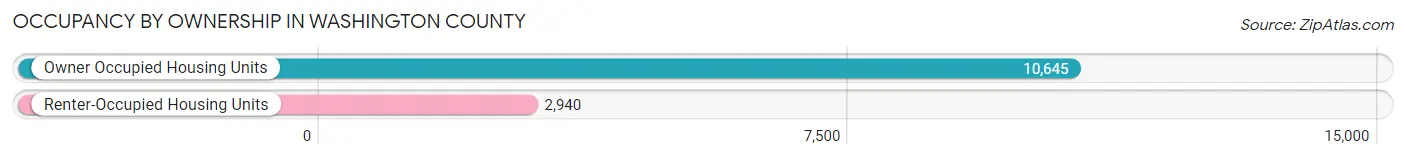
| Occupancy | # Housing Units | % Housing Units |
| Owner Occupied Housing Units | 10,645 | 78.4% |
| Renter-Occupied Housing Units | 2,940 | 21.6% |
| Total Occupied Housing Units | 13,585 | 100.0% |
Occupancy by Household Size in Washington County
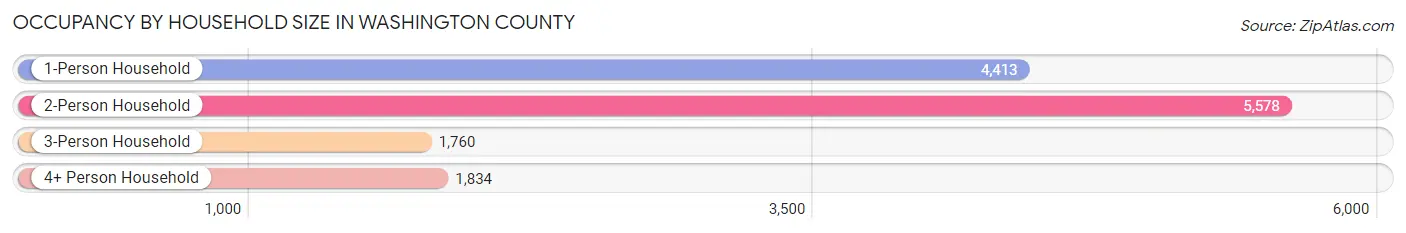
| Household Size | # Housing Units | % Housing Units |
| 1-Person Household | 4,413 | 32.5% |
| 2-Person Household | 5,578 | 41.1% |
| 3-Person Household | 1,760 | 13.0% |
| 4+ Person Household | 1,834 | 13.5% |
| Total Housing Units | 13,585 | 100.0% |
Occupancy by Ownership by Household Size in Washington County
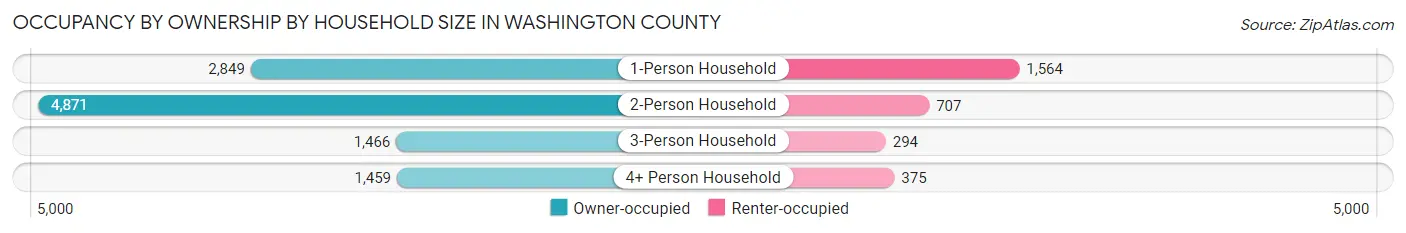
| Household Size | Owner-occupied | Renter-occupied |
| 1-Person Household | 2,849 (64.6%) | 1,564 (35.4%) |
| 2-Person Household | 4,871 (87.3%) | 707 (12.7%) |
| 3-Person Household | 1,466 (83.3%) | 294 (16.7%) |
| 4+ Person Household | 1,459 (79.5%) | 375 (20.4%) |
| Total Housing Units | 10,645 (78.4%) | 2,940 (21.6%) |
Occupancy by Educational Attainment in Washington County
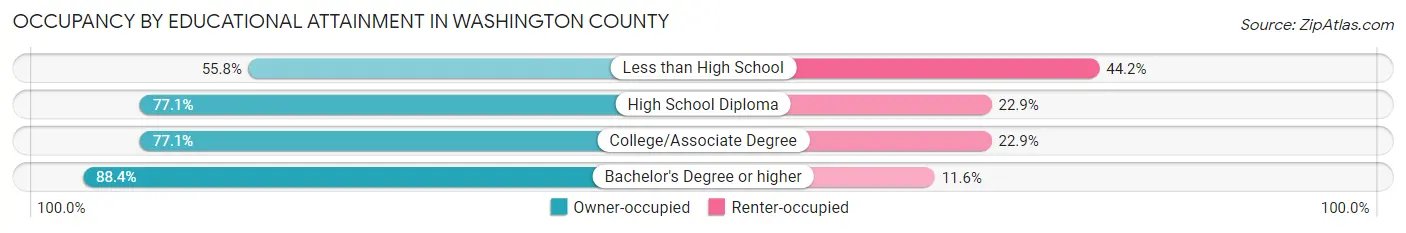
| Household Size | Owner-occupied | Renter-occupied |
| Less than High School | 605 (55.8%) | 480 (44.2%) |
| High School Diploma | 3,522 (77.1%) | 1,045 (22.9%) |
| College/Associate Degree | 3,382 (77.1%) | 1,003 (22.9%) |
| Bachelor's Degree or higher | 3,136 (88.4%) | 412 (11.6%) |
Occupancy by Age of Householder in Washington County
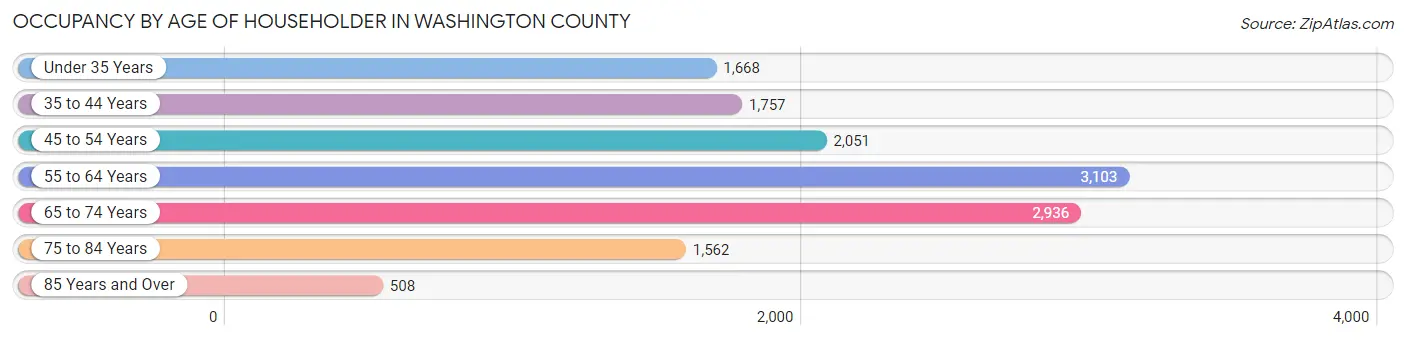
| Age Bracket | # Households | % Households |
| Under 35 Years | 1,668 | 12.3% |
| 35 to 44 Years | 1,757 | 12.9% |
| 45 to 54 Years | 2,051 | 15.1% |
| 55 to 64 Years | 3,103 | 22.8% |
| 65 to 74 Years | 2,936 | 21.6% |
| 75 to 84 Years | 1,562 | 11.5% |
| 85 Years and Over | 508 | 3.7% |
| Total | 13,585 | 100.0% |
Housing Finances in Washington County
Median Income by Occupancy in Washington County
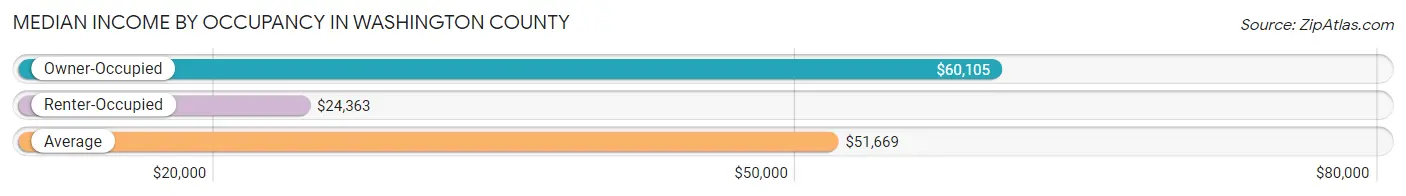
| Occupancy Type | # Households | Median Income |
| Owner-Occupied | 10,645 (78.4%) | $60,105 |
| Renter-Occupied | 2,940 (21.6%) | $24,363 |
| Average | 13,585 (100.0%) | $51,669 |
Occupancy by Householder Income Bracket in Washington County
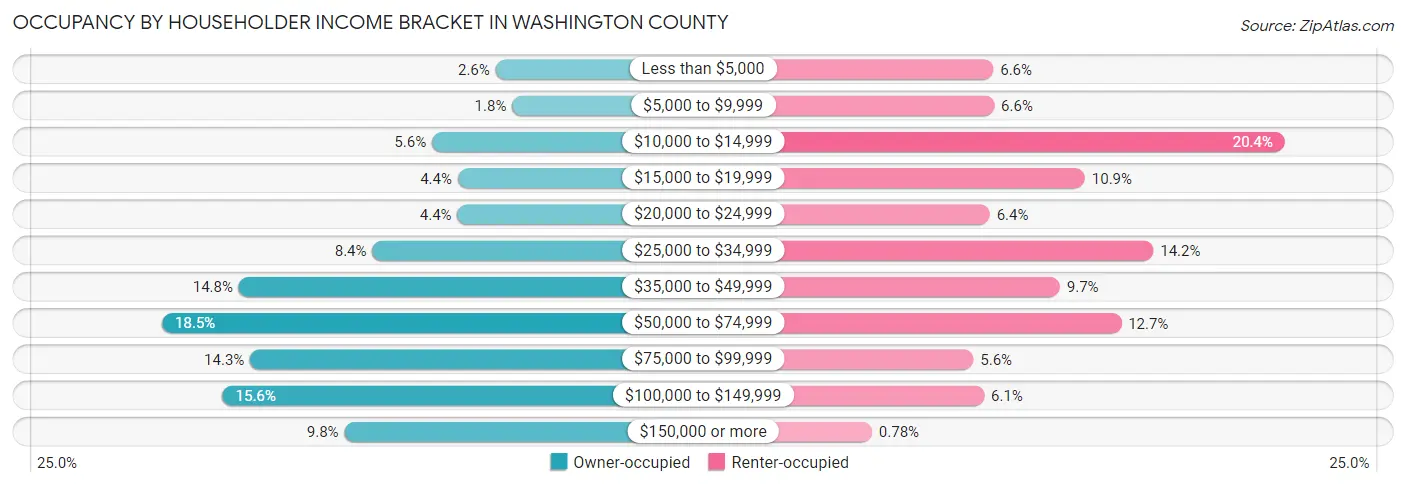
| Income Bracket | Owner-occupied | Renter-occupied |
| Less than $5,000 | 274 (2.6%) | 193 (6.6%) |
| $5,000 to $9,999 | 190 (1.8%) | 194 (6.6%) |
| $10,000 to $14,999 | 596 (5.6%) | 601 (20.4%) |
| $15,000 to $19,999 | 465 (4.4%) | 321 (10.9%) |
| $20,000 to $24,999 | 467 (4.4%) | 188 (6.4%) |
| $25,000 to $34,999 | 898 (8.4%) | 417 (14.2%) |
| $35,000 to $49,999 | 1,575 (14.8%) | 286 (9.7%) |
| $50,000 to $74,999 | 1,965 (18.5%) | 372 (12.7%) |
| $75,000 to $99,999 | 1,518 (14.3%) | 165 (5.6%) |
| $100,000 to $149,999 | 1,657 (15.6%) | 180 (6.1%) |
| $150,000 or more | 1,040 (9.8%) | 23 (0.8%) |
| Total | 10,645 (100.0%) | 2,940 (100.0%) |
Monthly Housing Cost Tiers in Washington County
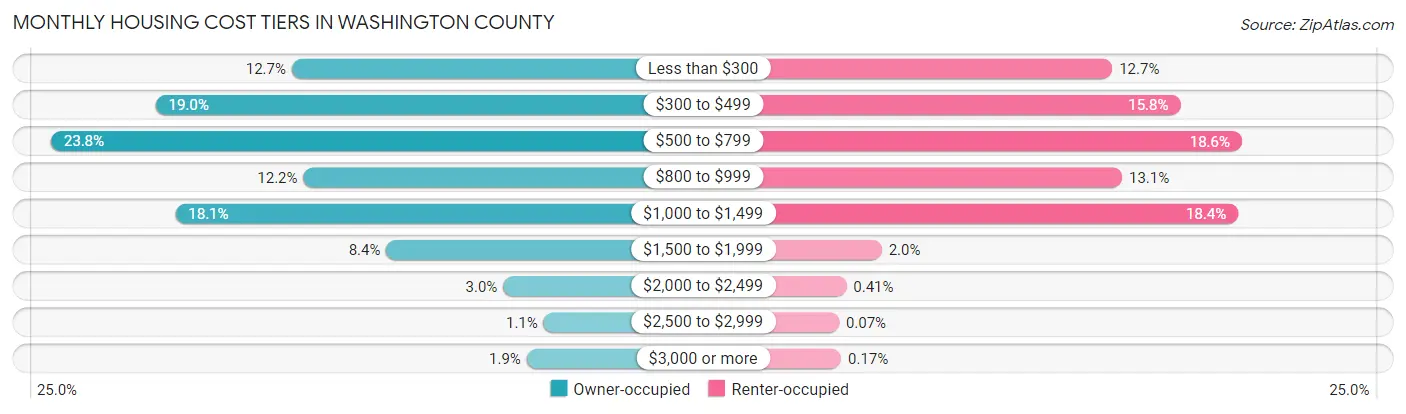
| Monthly Cost | Owner-occupied | Renter-occupied |
| Less than $300 | 1,352 (12.7%) | 372 (12.7%) |
| $300 to $499 | 2,019 (19.0%) | 464 (15.8%) |
| $500 to $799 | 2,532 (23.8%) | 547 (18.6%) |
| $800 to $999 | 1,296 (12.2%) | 385 (13.1%) |
| $1,000 to $1,499 | 1,922 (18.1%) | 542 (18.4%) |
| $1,500 to $1,999 | 889 (8.4%) | 60 (2.0%) |
| $2,000 to $2,499 | 316 (3.0%) | 12 (0.4%) |
| $2,500 to $2,999 | 118 (1.1%) | 2 (0.1%) |
| $3,000 or more | 201 (1.9%) | 5 (0.2%) |
| Total | 10,645 (100.0%) | 2,940 (100.0%) |
Physical Housing Characteristics in Washington County
Housing Structures in Washington County
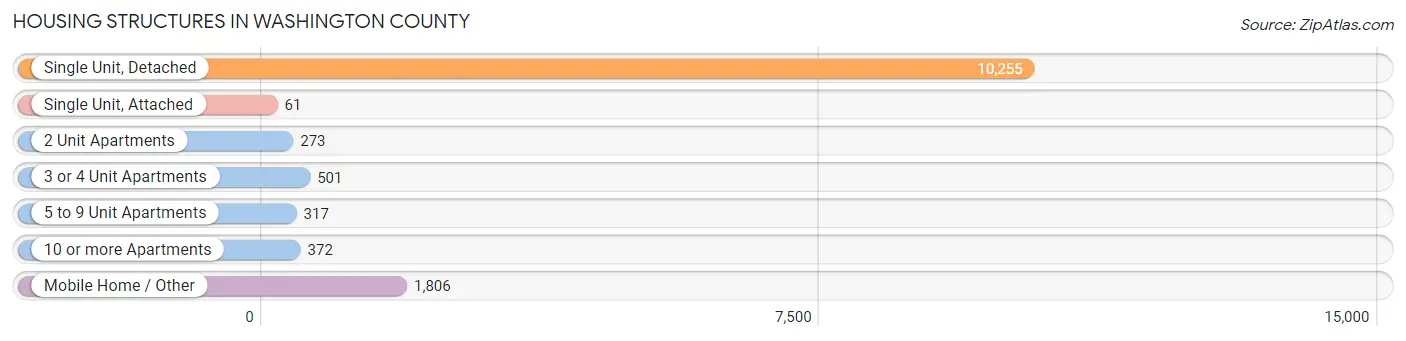
| Structure Type | # Housing Units | % Housing Units |
| Single Unit, Detached | 10,255 | 75.5% |
| Single Unit, Attached | 61 | 0.4% |
| 2 Unit Apartments | 273 | 2.0% |
| 3 or 4 Unit Apartments | 501 | 3.7% |
| 5 to 9 Unit Apartments | 317 | 2.3% |
| 10 or more Apartments | 372 | 2.7% |
| Mobile Home / Other | 1,806 | 13.3% |
| Total | 13,585 | 100.0% |
Housing Structures by Occupancy in Washington County
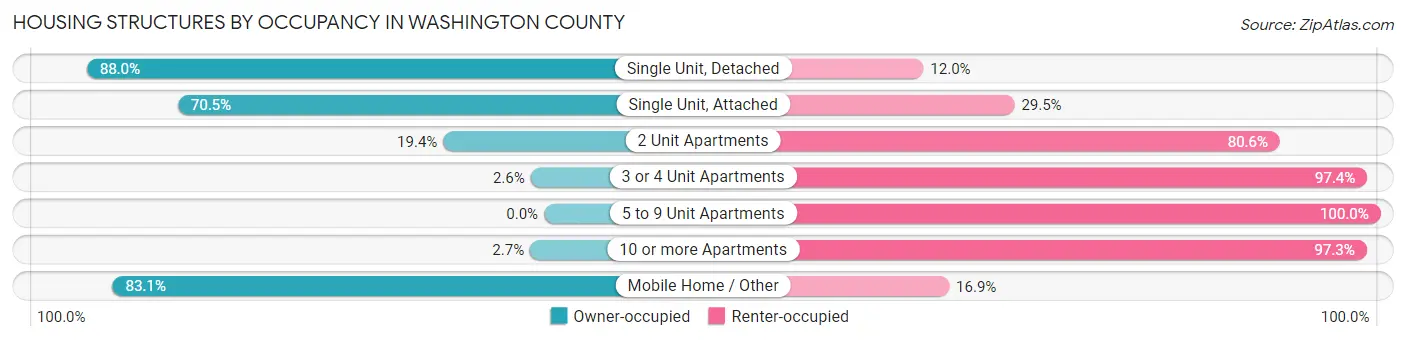
| Structure Type | Owner-occupied | Renter-occupied |
| Single Unit, Detached | 9,026 (88.0%) | 1,229 (12.0%) |
| Single Unit, Attached | 43 (70.5%) | 18 (29.5%) |
| 2 Unit Apartments | 53 (19.4%) | 220 (80.6%) |
| 3 or 4 Unit Apartments | 13 (2.6%) | 488 (97.4%) |
| 5 to 9 Unit Apartments | 0 (0.0%) | 317 (100.0%) |
| 10 or more Apartments | 10 (2.7%) | 362 (97.3%) |
| Mobile Home / Other | 1,500 (83.1%) | 306 (16.9%) |
| Total | 10,645 (78.4%) | 2,940 (21.6%) |
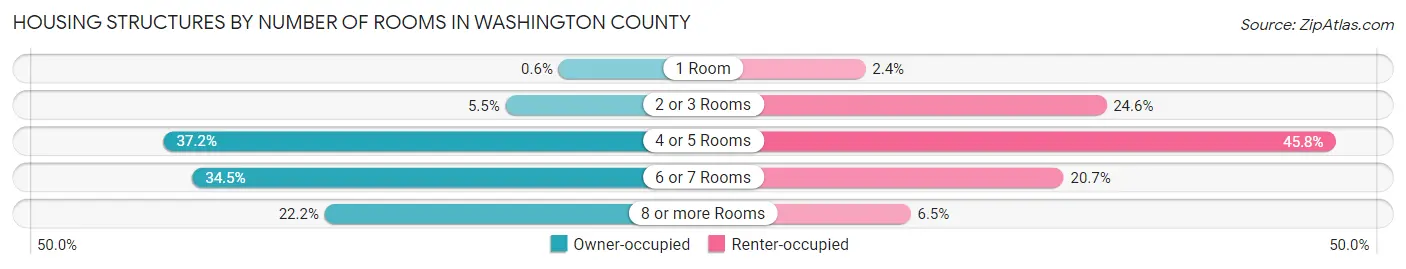
Housing Structures by Number of Rooms in Washington County
| Number of Rooms | Owner-occupied | Renter-occupied |
| 1 Room | 64 (0.6%) | 69 (2.4%) |
| 2 or 3 Rooms | 588 (5.5%) | 724 (24.6%) |
| 4 or 5 Rooms | 3,955 (37.1%) | 1,347 (45.8%) |
| 6 or 7 Rooms | 3,671 (34.5%) | 608 (20.7%) |
| 8 or more Rooms | 2,367 (22.2%) | 192 (6.5%) |
| Total | 10,645 (100.0%) | 2,940 (100.0%) |
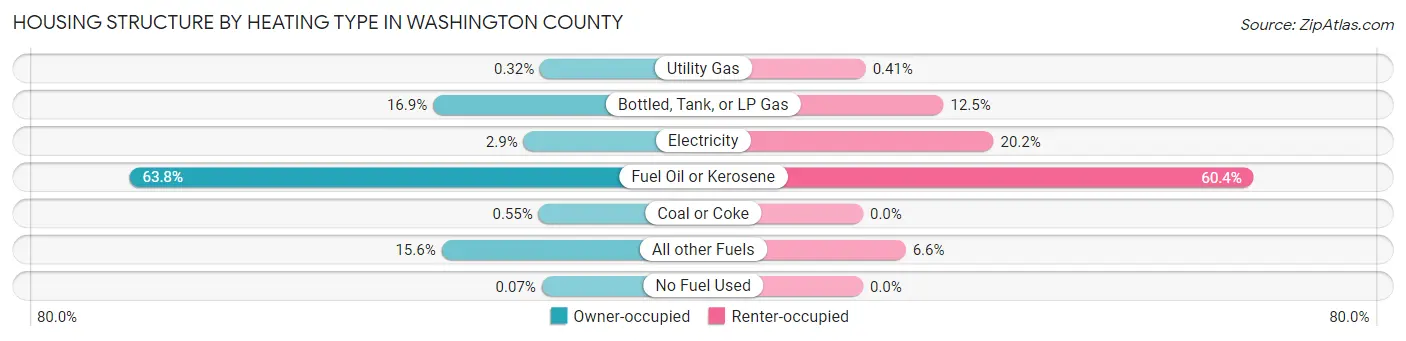
Housing Structure by Heating Type in Washington County
| Heating Type | Owner-occupied | Renter-occupied |
| Utility Gas | 34 (0.3%) | 12 (0.4%) |
| Bottled, Tank, or LP Gas | 1,796 (16.9%) | 366 (12.4%) |
| Electricity | 307 (2.9%) | 593 (20.2%) |
| Fuel Oil or Kerosene | 6,787 (63.8%) | 1,775 (60.4%) |
| Coal or Coke | 59 (0.5%) | 0 (0.0%) |
| All other Fuels | 1,655 (15.5%) | 194 (6.6%) |
| No Fuel Used | 7 (0.1%) | 0 (0.0%) |
| Total | 10,645 (100.0%) | 2,940 (100.0%) |
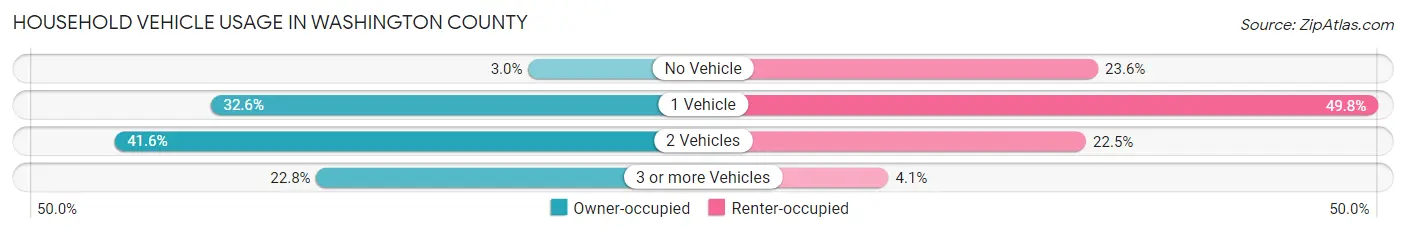
Household Vehicle Usage in Washington County
| Vehicles per Household | Owner-occupied | Renter-occupied |
| No Vehicle | 317 (3.0%) | 695 (23.6%) |
| 1 Vehicle | 3,474 (32.6%) | 1,463 (49.8%) |
| 2 Vehicles | 4,431 (41.6%) | 662 (22.5%) |
| 3 or more Vehicles | 2,423 (22.8%) | 120 (4.1%) |
| Total | 10,645 (100.0%) | 2,940 (100.0%) |
Real Estate & Mortgages in Washington County
Real Estate and Mortgage Overview in Washington County
| Characteristic | Without Mortgage | With Mortgage |
| Housing Units | 5,979 | 4,666 |
| Median Property Value | $120,200 | $150,600 |
| Median Household Income | $51,148 | $631 |
| Monthly Housing Costs | $472 | $195 |
| Real Estate Taxes | $1,443 | $57 |
Property Value by Mortgage Status in Washington County
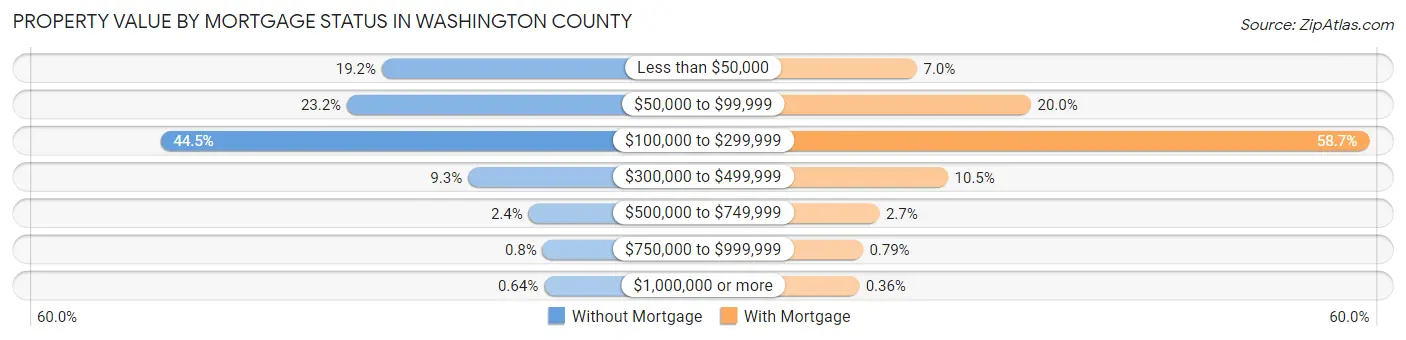
| Property Value | Without Mortgage | With Mortgage |
| Less than $50,000 | 1,147 (19.2%) | 325 (7.0%) |
| $50,000 to $99,999 | 1,385 (23.2%) | 933 (20.0%) |
| $100,000 to $299,999 | 2,659 (44.5%) | 2,738 (58.7%) |
| $300,000 to $499,999 | 558 (9.3%) | 491 (10.5%) |
| $500,000 to $749,999 | 144 (2.4%) | 125 (2.7%) |
| $750,000 to $999,999 | 48 (0.8%) | 37 (0.8%) |
| $1,000,000 or more | 38 (0.6%) | 17 (0.4%) |
| Total | 5,979 (100.0%) | 4,666 (100.0%) |
Household Income by Mortgage Status in Washington County
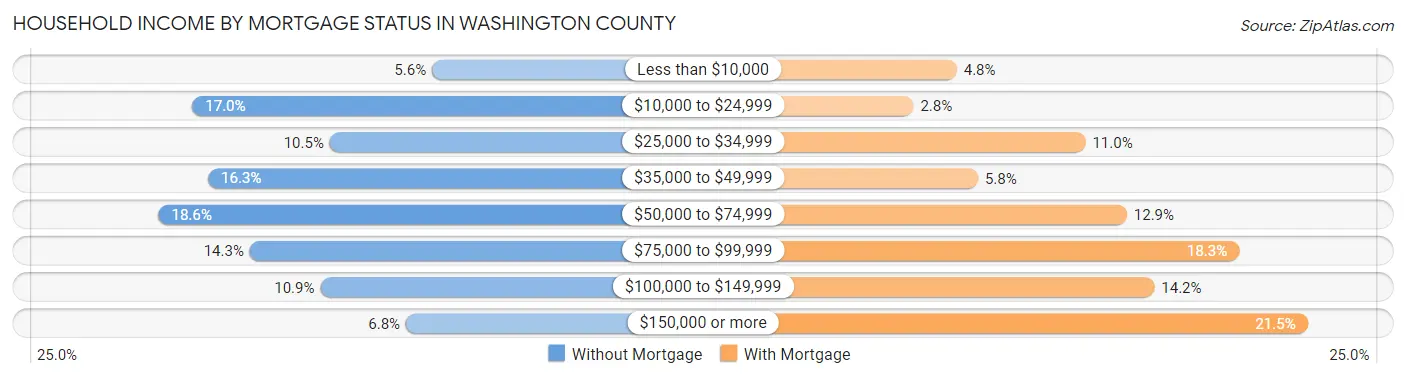
| Household Income | Without Mortgage | With Mortgage |
| Less than $10,000 | 335 (5.6%) | 225 (4.8%) |
| $10,000 to $24,999 | 1,017 (17.0%) | 129 (2.8%) |
| $25,000 to $34,999 | 626 (10.5%) | 511 (11.0%) |
| $35,000 to $49,999 | 972 (16.3%) | 272 (5.8%) |
| $50,000 to $74,999 | 1,113 (18.6%) | 603 (12.9%) |
| $75,000 to $99,999 | 854 (14.3%) | 852 (18.3%) |
| $100,000 to $149,999 | 653 (10.9%) | 664 (14.2%) |
| $150,000 or more | 409 (6.8%) | 1,004 (21.5%) |
| Total | 5,979 (100.0%) | 4,666 (100.0%) |
Property Value to Household Income Ratio in Washington County
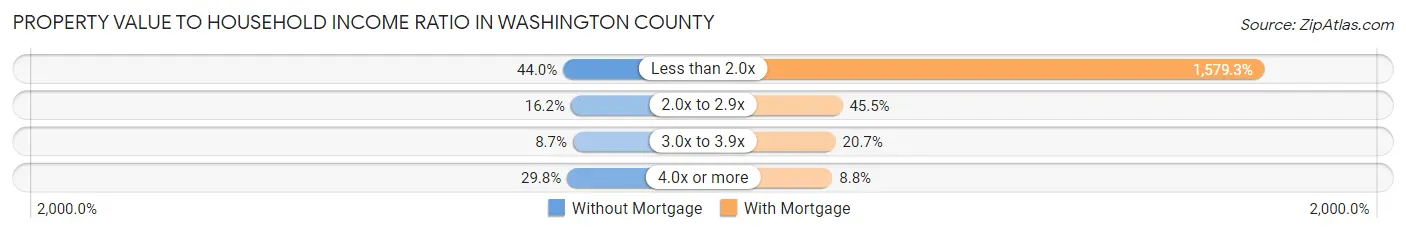
| Value-to-Income Ratio | Without Mortgage | With Mortgage |
| Less than 2.0x | 2,629 (44.0%) | 73,692 (1,579.3%) |
| 2.0x to 2.9x | 971 (16.2%) | 2,124 (45.5%) |
| 3.0x to 3.9x | 518 (8.7%) | 965 (20.7%) |
| 4.0x or more | 1,781 (29.8%) | 409 (8.8%) |
| Total | 5,979 (100.0%) | 4,666 (100.0%) |
Real Estate Taxes by Mortgage Status in Washington County
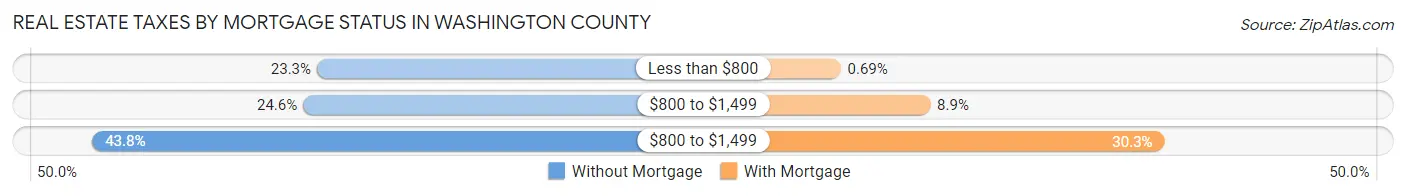
| Property Taxes | Without Mortgage | With Mortgage |
| Less than $800 | 1,394 (23.3%) | 32 (0.7%) |
| $800 to $1,499 | 1,469 (24.6%) | 414 (8.9%) |
| $800 to $1,499 | 2,620 (43.8%) | 1,412 (30.3%) |
| Total | 5,979 (100.0%) | 4,666 (100.0%) |
Health & Disability in Washington County
Health Insurance Coverage by Age in Washington County
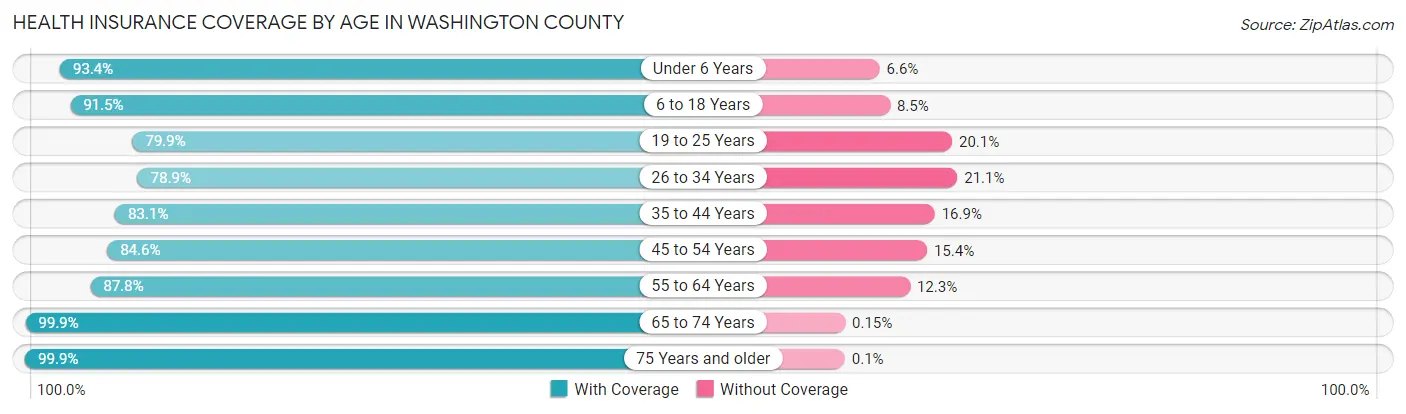
| Age Bracket | With Coverage | Without Coverage |
| Under 6 Years | 1,648 (93.4%) | 116 (6.6%) |
| 6 to 18 Years | 4,105 (91.5%) | 382 (8.5%) |
| 19 to 25 Years | 1,659 (79.9%) | 417 (20.1%) |
| 26 to 34 Years | 2,112 (78.9%) | 564 (21.1%) |
| 35 to 44 Years | 2,682 (83.1%) | 544 (16.9%) |
| 45 to 54 Years | 3,109 (84.6%) | 567 (15.4%) |
| 55 to 64 Years | 4,449 (87.7%) | 621 (12.2%) |
| 65 to 74 Years | 4,716 (99.9%) | 7 (0.2%) |
| 75 Years and older | 2,858 (99.9%) | 3 (0.1%) |
| Total | 27,338 (89.5%) | 3,221 (10.5%) |
Health Insurance Coverage by Citizenship Status in Washington County
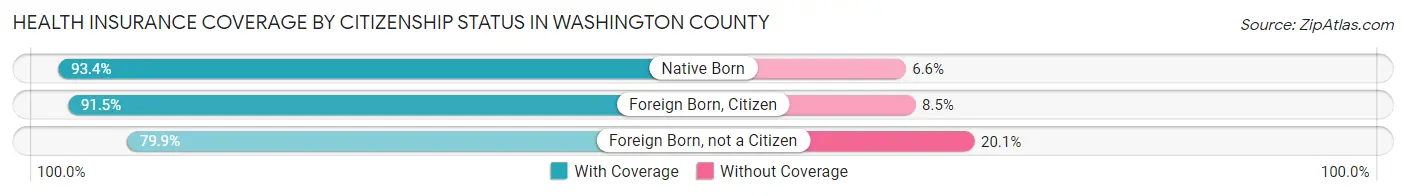
| Citizenship Status | With Coverage | Without Coverage |
| Native Born | 1,648 (93.4%) | 116 (6.6%) |
| Foreign Born, Citizen | 4,105 (91.5%) | 382 (8.5%) |
| Foreign Born, not a Citizen | 1,659 (79.9%) | 417 (20.1%) |
Health Insurance Coverage by Household Income in Washington County
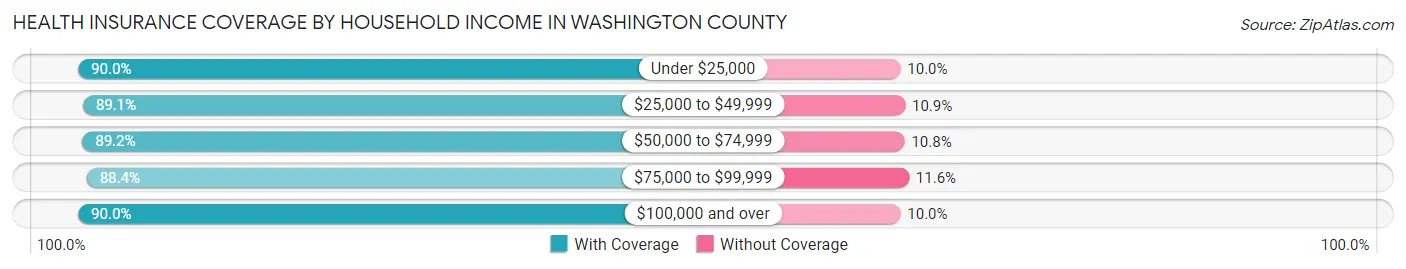
| Household Income | With Coverage | Without Coverage |
| Under $25,000 | 4,759 (90.0%) | 531 (10.0%) |
| $25,000 to $49,999 | 5,840 (89.1%) | 715 (10.9%) |
| $50,000 to $74,999 | 4,668 (89.2%) | 566 (10.8%) |
| $75,000 to $99,999 | 3,895 (88.4%) | 513 (11.6%) |
| $100,000 and over | 7,757 (90.0%) | 866 (10.0%) |
Public vs Private Health Insurance Coverage by Age in Washington County
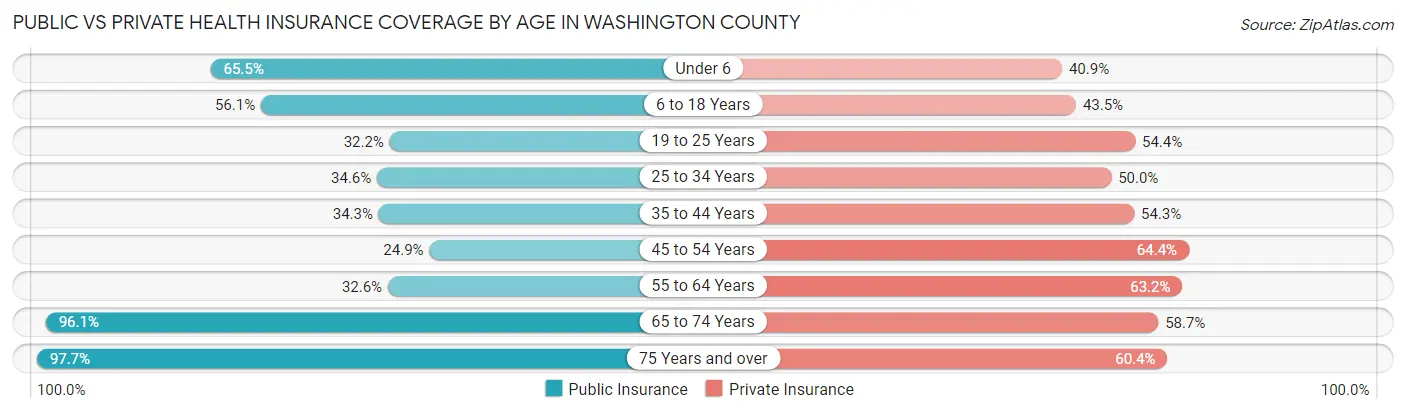
| Age Bracket | Public Insurance | Private Insurance |
| Under 6 | 1,155 (65.5%) | 721 (40.9%) |
| 6 to 18 Years | 2,518 (56.1%) | 1,950 (43.5%) |
| 19 to 25 Years | 669 (32.2%) | 1,130 (54.4%) |
| 25 to 34 Years | 925 (34.6%) | 1,338 (50.0%) |
| 35 to 44 Years | 1,105 (34.3%) | 1,750 (54.2%) |
| 45 to 54 Years | 914 (24.9%) | 2,368 (64.4%) |
| 55 to 64 Years | 1,651 (32.6%) | 3,204 (63.2%) |
| 65 to 74 Years | 4,538 (96.1%) | 2,774 (58.7%) |
| 75 Years and over | 2,796 (97.7%) | 1,729 (60.4%) |
| Total | 16,271 (53.2%) | 16,964 (55.5%) |
Disability Status by Sex by Age in Washington County
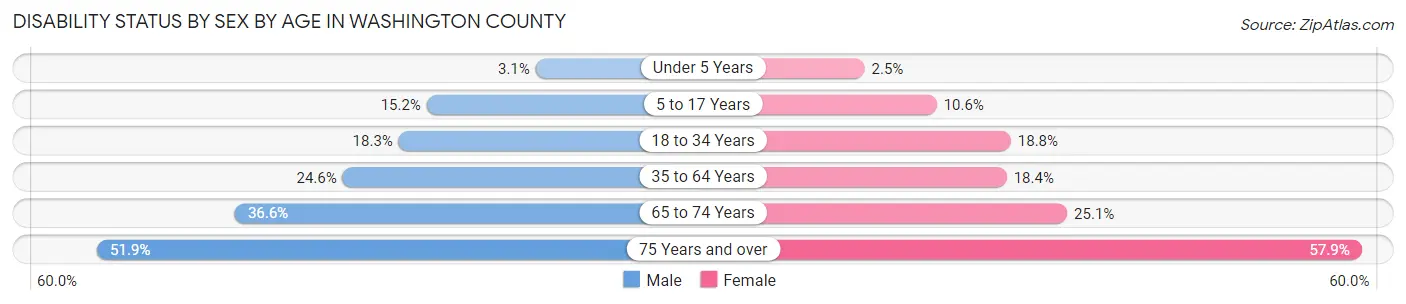
| Age Bracket | Male | Female |
| Under 5 Years | 24 (3.1%) | 17 (2.5%) |
| 5 to 17 Years | 334 (15.2%) | 232 (10.6%) |
| 18 to 34 Years | 481 (18.3%) | 479 (18.8%) |
| 35 to 64 Years | 1,441 (24.6%) | 1,123 (18.4%) |
| 65 to 74 Years | 869 (36.6%) | 589 (25.1%) |
| 75 Years and over | 663 (51.9%) | 917 (57.9%) |
Disability Class by Sex by Age in Washington County
Disability Class: Hearing Difficulty
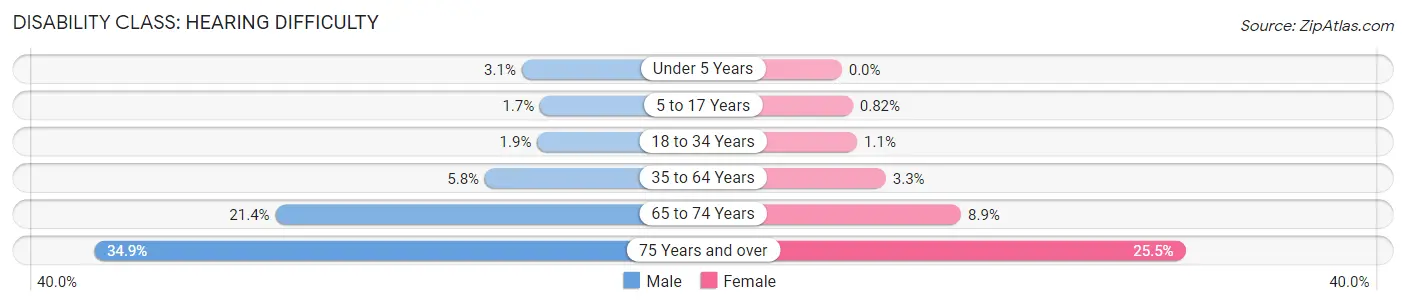
| Age Bracket | Male | Female |
| Under 5 Years | 24 (3.1%) | 0 (0.0%) |
| 5 to 17 Years | 38 (1.7%) | 18 (0.8%) |
| 18 to 34 Years | 51 (1.9%) | 29 (1.1%) |
| 35 to 64 Years | 341 (5.8%) | 200 (3.3%) |
| 65 to 74 Years | 508 (21.4%) | 208 (8.9%) |
| 75 Years and over | 445 (34.8%) | 404 (25.5%) |
Disability Class: Vision Difficulty
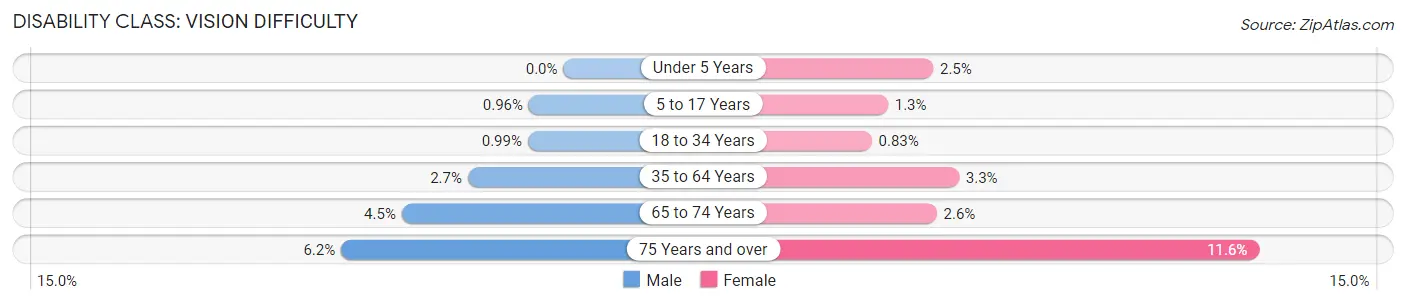
| Age Bracket | Male | Female |
| Under 5 Years | 0 (0.0%) | 17 (2.5%) |
| 5 to 17 Years | 21 (1.0%) | 28 (1.3%) |
| 18 to 34 Years | 26 (1.0%) | 21 (0.8%) |
| 35 to 64 Years | 156 (2.7%) | 199 (3.3%) |
| 65 to 74 Years | 107 (4.5%) | 62 (2.6%) |
| 75 Years and over | 79 (6.2%) | 184 (11.6%) |
Disability Class: Cognitive Difficulty
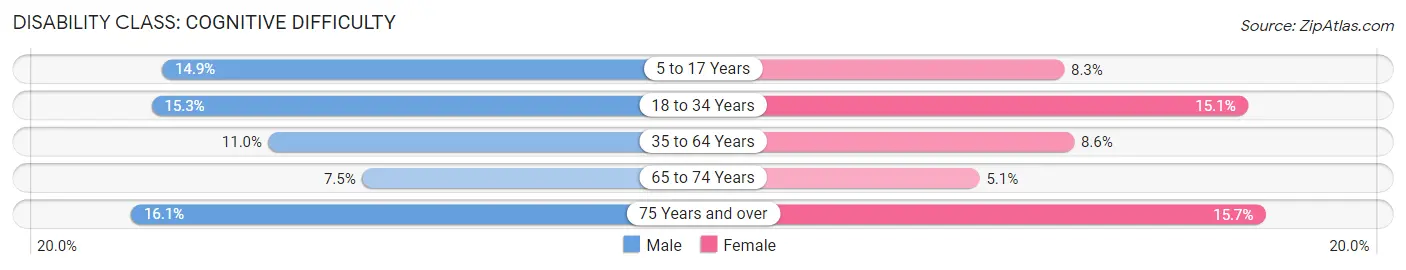
| Age Bracket | Male | Female |
| 5 to 17 Years | 327 (14.9%) | 181 (8.3%) |
| 18 to 34 Years | 401 (15.3%) | 383 (15.1%) |
| 35 to 64 Years | 643 (11.0%) | 527 (8.6%) |
| 65 to 74 Years | 178 (7.5%) | 120 (5.1%) |
| 75 Years and over | 205 (16.1%) | 249 (15.7%) |
Disability Class: Ambulatory Difficulty
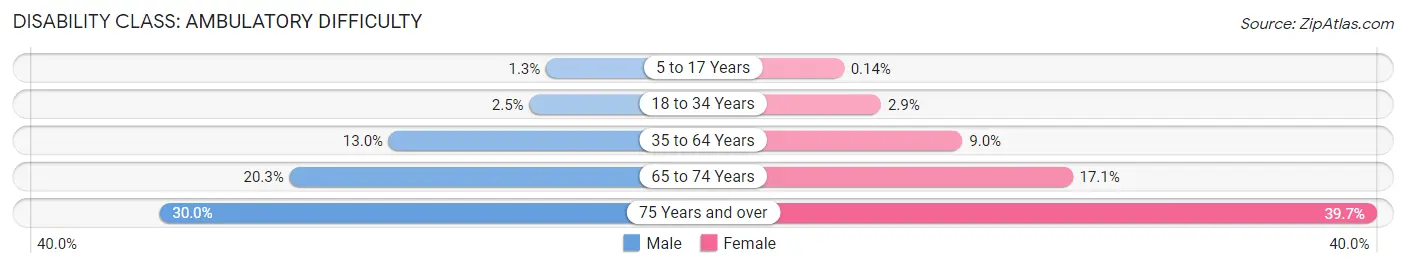
| Age Bracket | Male | Female |
| 5 to 17 Years | 28 (1.3%) | 3 (0.1%) |
| 18 to 34 Years | 66 (2.5%) | 74 (2.9%) |
| 35 to 64 Years | 759 (13.0%) | 547 (8.9%) |
| 65 to 74 Years | 483 (20.3%) | 402 (17.1%) |
| 75 Years and over | 383 (30.0%) | 629 (39.7%) |
Disability Class: Self-Care Difficulty
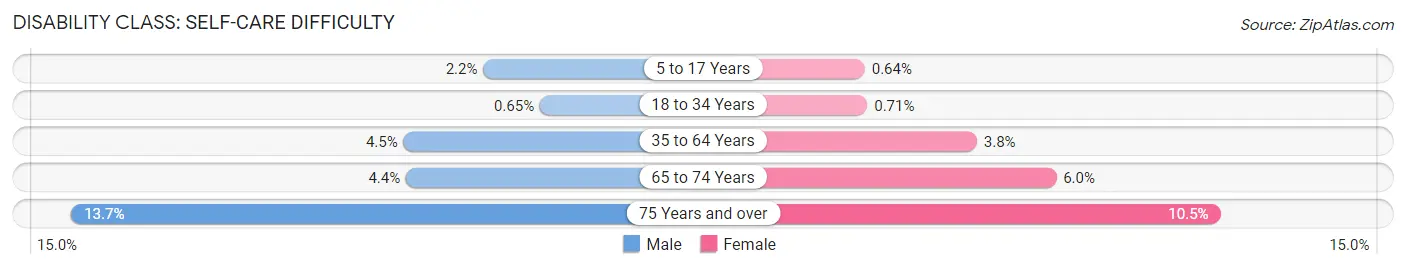
| Age Bracket | Male | Female |
| 5 to 17 Years | 49 (2.2%) | 14 (0.6%) |
| 18 to 34 Years | 17 (0.6%) | 18 (0.7%) |
| 35 to 64 Years | 261 (4.4%) | 230 (3.8%) |
| 65 to 74 Years | 104 (4.4%) | 140 (6.0%) |
| 75 Years and over | 175 (13.7%) | 167 (10.5%) |
Technology Access in Washington County
Computing Device Access in Washington County
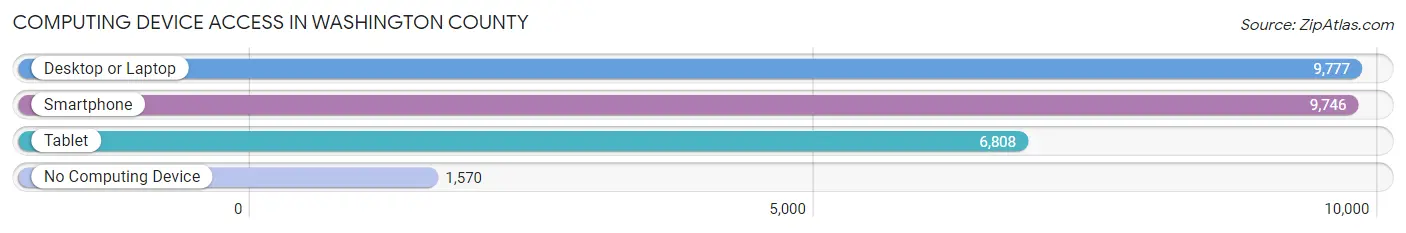
| Device Type | # Households | % Households |
| Desktop or Laptop | 9,777 | 72.0% |
| Smartphone | 9,746 | 71.7% |
| Tablet | 6,808 | 50.1% |
| No Computing Device | 1,570 | 11.6% |
| Total | 13,585 | 100.0% |
Internet Access in Washington County
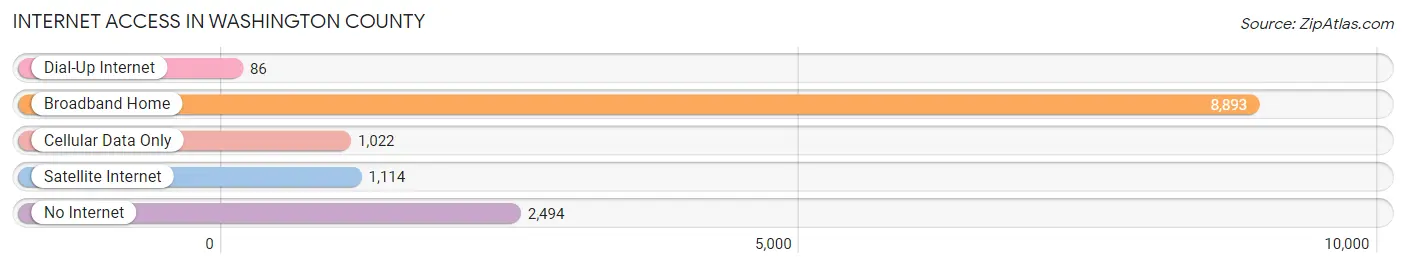
| Internet Type | # Households | % Households |
| Dial-Up Internet | 86 | 0.6% |
| Broadband Home | 8,893 | 65.5% |
| Cellular Data Only | 1,022 | 7.5% |
| Satellite Internet | 1,114 | 8.2% |
| No Internet | 2,494 | 18.4% |
| Total | 13,585 | 100.0% |
Washington County Summary
Introduction
Washington County is located in the state of Maine, in the United States of America. It is the easternmost county in the state and is bordered by the Atlantic Ocean to the east, the Canadian province of New Brunswick to the north, and the state of New Hampshire to the west. The county seat is Machias, and the largest city is Calais. The county was established in 1789 and is named after George Washington, the first President of the United States.
History
The area that is now Washington County was originally inhabited by the Passamaquoddy and Maliseet tribes. The first European settlers arrived in the area in the late 1600s, and the county was established in 1789. The county was originally part of Hancock County, but was split off in 1827.
During the War of 1812, the county was the site of several battles between the British and American forces. The most famous of these battles was the Battle of Hampden, which took place in 1814. The British were victorious in this battle, and the county was occupied by British forces until the end of the war.
In the 19th century, the county was an important center for the lumber industry. The county was also home to several shipbuilding yards, which produced wooden sailing vessels for the fishing and merchant fleets.
Geography
Washington County is located in the eastern part of the state of Maine. It is bordered by the Atlantic Ocean to the east, the Canadian province of New Brunswick to the north, and the state of New Hampshire to the west. The county is divided into two parts by the Machias River, which runs through the center of the county.
The county is mostly rural, with a few small towns and villages scattered throughout. The largest city in the county is Calais, which is located on the border with New Brunswick. The county seat is Machias, which is located on the Machias River.
The county is home to several state parks, including Cobscook Bay State Park, Cutler Coast Public Reserved Land, and Roque Bluffs State Park. The county is also home to several wildlife refuges, including Moosehorn National Wildlife Refuge and Petit Manan National Wildlife Refuge.
Economy
The economy of Washington County is largely based on the fishing and tourism industries. The county is home to several fishing fleets, which harvest lobster, crab, and other seafood from the waters off the coast. The county is also home to several tourist attractions, including the Roosevelt Campobello International Park, which is located on the border with New Brunswick.
The county is also home to several manufacturing companies, including a paper mill in Calais and a wood products plant in Machias. The county is also home to several small businesses, including restaurants, shops, and other services.
Demographics
As of the 2010 census, the population of Washington County was 32,856. The population is largely rural, with the largest city being Calais, which has a population of 3,123. The county is predominantly white, with 91.3% of the population identifying as white. The largest minority group is African American, which makes up 4.2% of the population.
Conclusion
Washington County is located in the eastern part of the state of Maine. It is bordered by the Atlantic Ocean to the east, the Canadian province of New Brunswick to the north, and the state of New Hampshire to the west. The county was established in 1789 and is named after George Washington, the first President of the United States. The economy of the county is largely based on the fishing and tourism industries, and the population is largely rural.
Common Questions
What is Per Capita Income in Washington County?
Per Capita income in Washington County is $30,731.
What is the Median Family Income in Washington County?
Median Family Income in Washington County is $68,207.
What is the Median Household income in Washington County?
Median Household Income in Washington County is $51,669.
What is Income or Wage Gap in Washington County?
Income or Wage Gap in Washington County is 26.4%.
Women in Washington County earn 73.6 cents for every dollar earned by a man.
What is Family Income Deficit in Washington County?
Family Income Deficit in Washington County is $9,905.
Families that are below poverty line in Washington County earn $9,905 less on average than the poverty threshold level.
What is Inequality or Gini Index in Washington County?
Inequality or Gini Index in Washington County is 0.46.
What is the Total Population of Washington County?
Total Population of Washington County is 31,096.
What is the Total Male Population of Washington County?
Total Male Population of Washington County is 15,385.
What is the Total Female Population of Washington County?
Total Female Population of Washington County is 15,711.
What is the Ratio of Males per 100 Females in Washington County?
There are 97.93 Males per 100 Females in Washington County.
What is the Ratio of Females per 100 Males in Washington County?
There are 102.12 Females per 100 Males in Washington County.
What is the Median Population Age in Washington County?
Median Population Age in Washington County is 48.6 Years.
What is the Average Family Size in Washington County
Average Family Size in Washington County is 2.8 People.
What is the Average Household Size in Washington County
Average Household Size in Washington County is 2.2 People.
How Large is the Labor Force in Washington County?
There are 13,747 People in the Labor Forcein in Washington County.
What is the Percentage of People in the Labor Force in Washington County?
52.9% of People are in the Labor Force in Washington County.
What is the Unemployment Rate in Washington County?
Unemployment Rate in Washington County is 7.0%.