Penobscot County, ME Map & Demographics
Penobscot County Map
Penobscot County Overview
$34,423
PER CAPITA INCOME
$82,139
AVG FAMILY INCOME
$59,438
AVG HOUSEHOLD INCOME
19.3%
WAGE / INCOME GAP [ % ]
80.7¢/ $1
WAGE / INCOME GAP [ $ ]
$10,344
FAMILY INCOME DEFICIT
0.46
INEQUALITY / GINI INDEX
152,640
TOTAL POPULATION
75,942
MALE POPULATION
76,698
FEMALE POPULATION
99.01
MALES / 100 FEMALES
101.00
FEMALES / 100 MALES
42.4
MEDIAN AGE
2.9
AVG FAMILY SIZE
2.3
AVG HOUSEHOLD SIZE
77,488
LABOR FORCE [ PEOPLE ]
60.0%
PERCENT IN LABOR FORCE
4.3%
UNEMPLOYMENT RATE
Penobscot County Area Codes
Income in Penobscot County
Income Overview in Penobscot County
Per Capita Income in Penobscot County is $34,423, while median incomes of families and households are $82,139 and $59,438 respectively.
| Characteristic | Number | Measure |
| Per Capita Income | 152,640 | $34,423 |
| Median Family Income | 37,634 | $82,139 |
| Mean Family Income | 37,634 | $100,406 |
| Median Household Income | 63,687 | $59,438 |
| Mean Household Income | 63,687 | $79,488 |
| Income Deficit | 37,634 | $10,344 |
| Wage / Income Gap (%) | 152,640 | 19.32% |
| Wage / Income Gap ($) | 152,640 | 80.68¢ per $1 |
| Gini / Inequality Index | 152,640 | 0.46 |
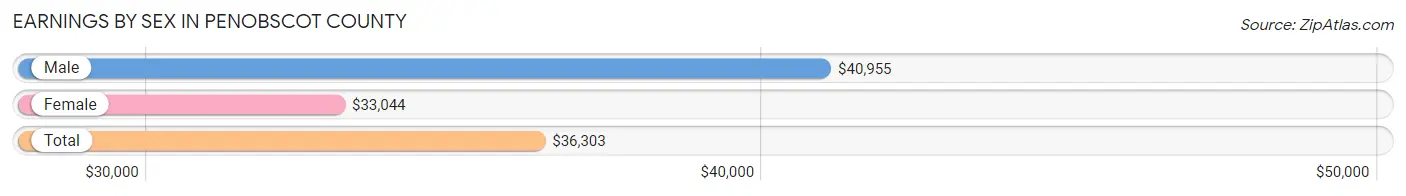
Earnings by Sex in Penobscot County
Average Earnings in Penobscot County are $36,303, $40,955 for men and $33,044 for women, a difference of 19.3%.
| Sex | Number | Average Earnings |
| Male | 42,744 (50.9%) | $40,955 |
| Female | 41,182 (49.1%) | $33,044 |
| Total | 83,926 (100.0%) | $36,303 |
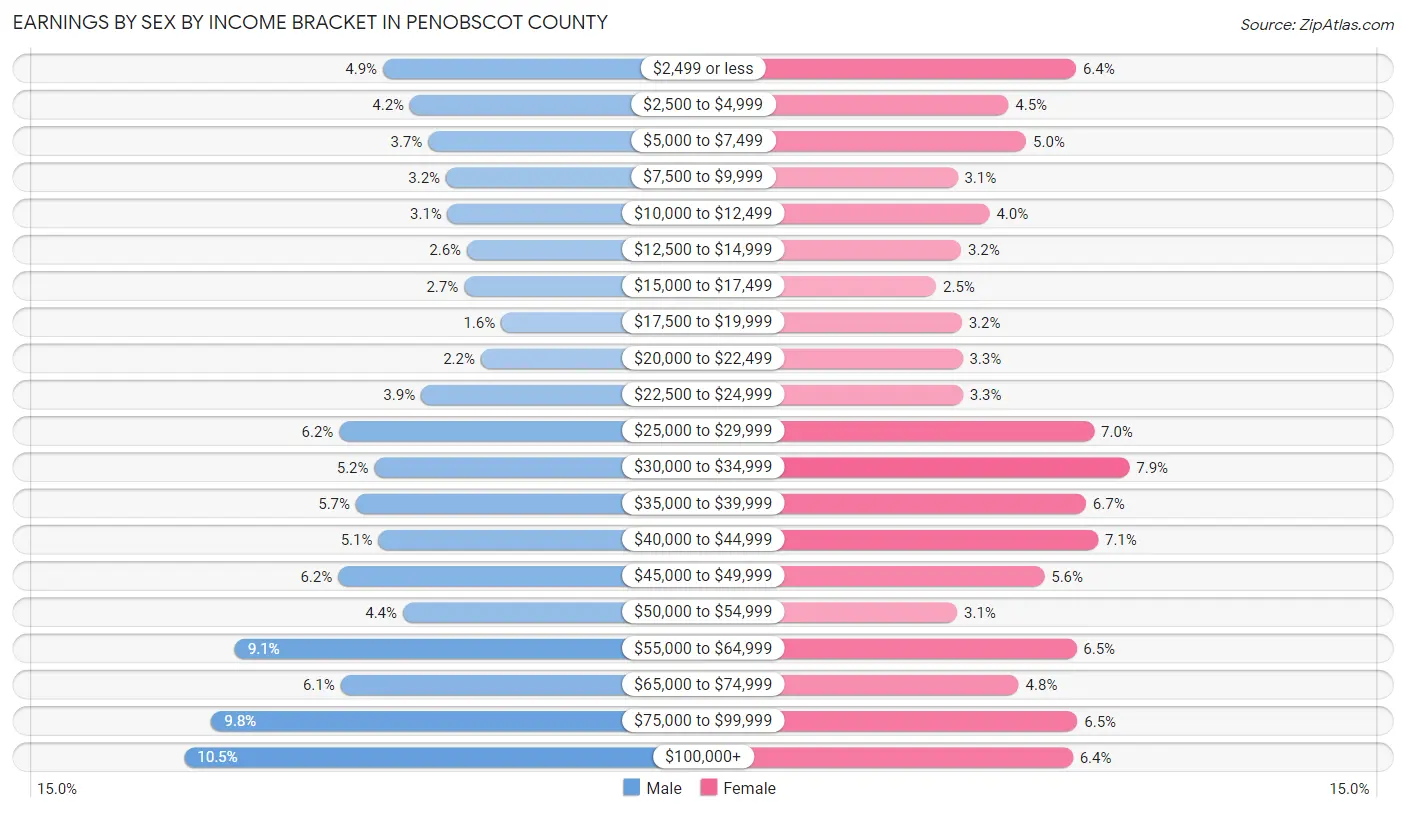
Earnings by Sex by Income Bracket in Penobscot County
The most common earnings brackets in Penobscot County are $100,000+ for men (4,494 | 10.5%) and $30,000 to $34,999 for women (3,268 | 7.9%).
| Income | Male | Female |
| $2,499 or less | 2,108 (4.9%) | 2,654 (6.4%) |
| $2,500 to $4,999 | 1,784 (4.2%) | 1,871 (4.5%) |
| $5,000 to $7,499 | 1,563 (3.7%) | 2,075 (5.0%) |
| $7,500 to $9,999 | 1,350 (3.2%) | 1,281 (3.1%) |
| $10,000 to $12,499 | 1,328 (3.1%) | 1,650 (4.0%) |
| $12,500 to $14,999 | 1,098 (2.6%) | 1,323 (3.2%) |
| $15,000 to $17,499 | 1,133 (2.6%) | 1,032 (2.5%) |
| $17,500 to $19,999 | 690 (1.6%) | 1,330 (3.2%) |
| $20,000 to $22,499 | 933 (2.2%) | 1,337 (3.3%) |
| $22,500 to $24,999 | 1,648 (3.9%) | 1,341 (3.3%) |
| $25,000 to $29,999 | 2,631 (6.2%) | 2,861 (7.0%) |
| $30,000 to $34,999 | 2,209 (5.2%) | 3,268 (7.9%) |
| $35,000 to $39,999 | 2,432 (5.7%) | 2,768 (6.7%) |
| $40,000 to $44,999 | 2,161 (5.1%) | 2,906 (7.1%) |
| $45,000 to $49,999 | 2,644 (6.2%) | 2,285 (5.6%) |
| $50,000 to $54,999 | 1,870 (4.4%) | 1,276 (3.1%) |
| $55,000 to $64,999 | 3,885 (9.1%) | 2,655 (6.5%) |
| $65,000 to $74,999 | 2,614 (6.1%) | 1,988 (4.8%) |
| $75,000 to $99,999 | 4,169 (9.8%) | 2,667 (6.5%) |
| $100,000+ | 4,494 (10.5%) | 2,614 (6.4%) |
| Total | 42,744 (100.0%) | 41,182 (100.0%) |
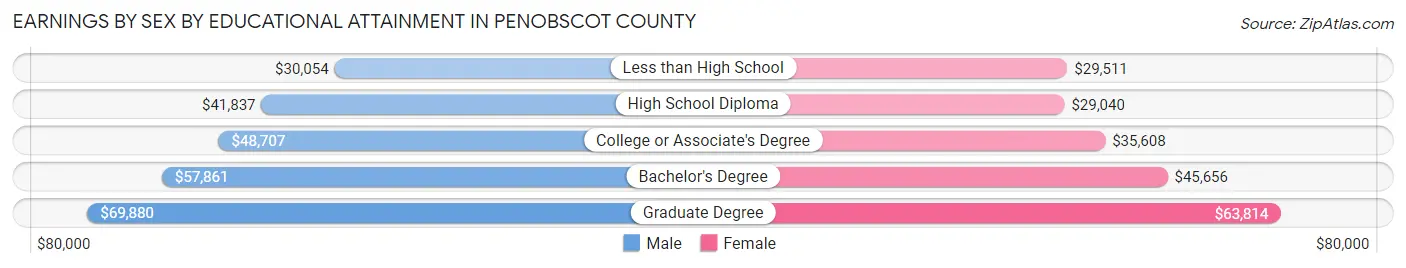
Earnings by Sex by Educational Attainment in Penobscot County
Average earnings in Penobscot County are $47,361 for men and $37,665 for women, a difference of 20.5%. Men with an educational attainment of graduate degree enjoy the highest average annual earnings of $69,880, while those with less than high school education earn the least with $30,054. Women with an educational attainment of graduate degree earn the most with the average annual earnings of $63,814, while those with high school diploma education have the smallest earnings of $29,040.
| Educational Attainment | Male Income | Female Income |
| Less than High School | $30,054 | $29,511 |
| High School Diploma | $41,837 | $29,040 |
| College or Associate's Degree | $48,707 | $35,608 |
| Bachelor's Degree | $57,861 | $45,656 |
| Graduate Degree | $69,880 | $63,814 |
| Total | $47,361 | $37,665 |
Family Income in Penobscot County
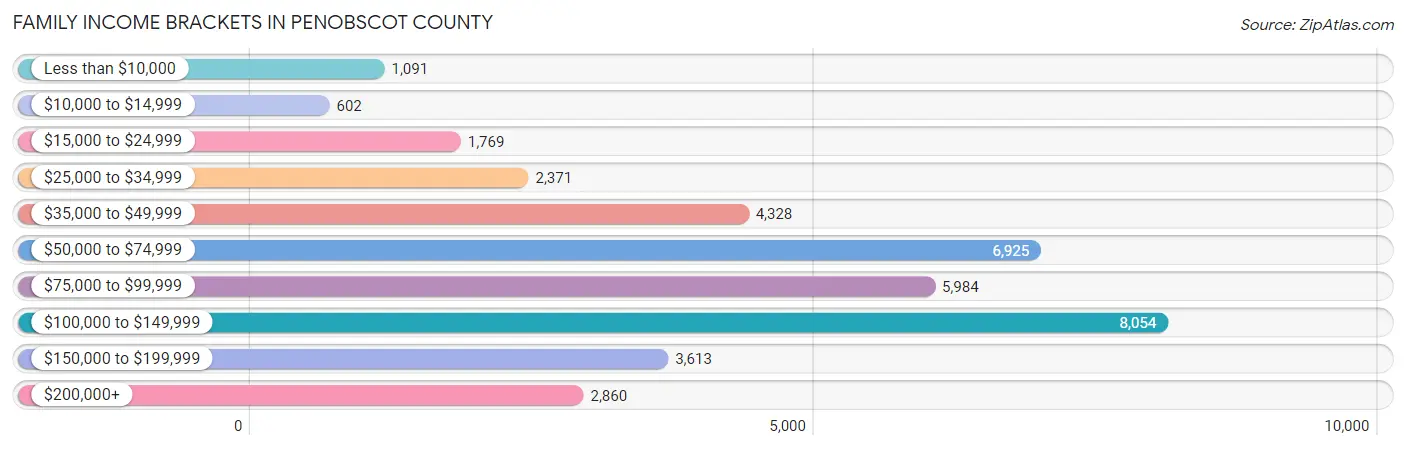
Family Income Brackets in Penobscot County
According to the Penobscot County family income data, there are 8,054 families falling into the $100,000 to $149,999 income range, which is the most common income bracket and makes up 21.4% of all families. Conversely, the $10,000 to $14,999 income bracket is the least frequent group with only 602 families (1.6%) belonging to this category.
| Income Bracket | # Families | % Families |
| Less than $10,000 | 1,091 | 2.9% |
| $10,000 to $14,999 | 602 | 1.6% |
| $15,000 to $24,999 | 1,769 | 4.7% |
| $25,000 to $34,999 | 2,371 | 6.3% |
| $35,000 to $49,999 | 4,328 | 11.5% |
| $50,000 to $74,999 | 6,925 | 18.4% |
| $75,000 to $99,999 | 5,984 | 15.9% |
| $100,000 to $149,999 | 8,054 | 21.4% |
| $150,000 to $199,999 | 3,613 | 9.6% |
| $200,000+ | 2,860 | 7.6% |
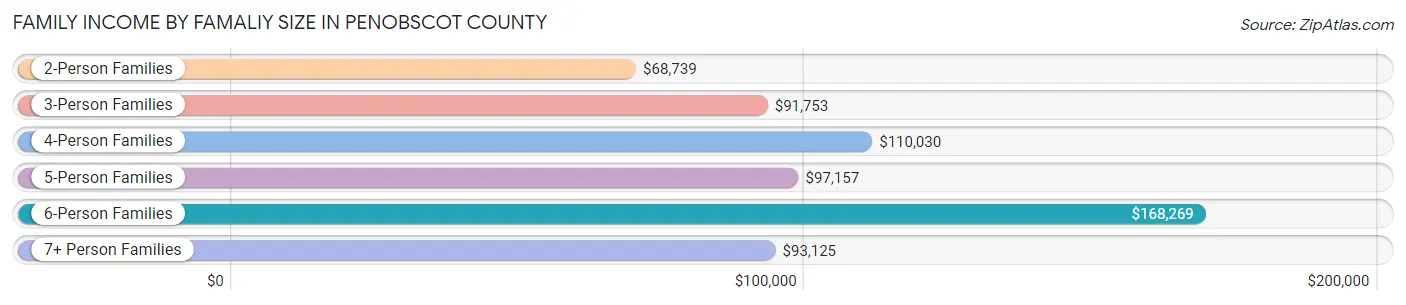
Family Income by Famaliy Size in Penobscot County
6-person families (600 | 1.6%) account for the highest median family income in Penobscot County with $168,269 per family, while 2-person families (20,509 | 54.5%) have the highest median income of $34,370 per family member.
| Income Bracket | # Families | Median Income |
| 2-Person Families | 20,509 (54.5%) | $68,739 |
| 3-Person Families | 7,894 (21.0%) | $91,753 |
| 4-Person Families | 6,229 (16.6%) | $110,030 |
| 5-Person Families | 2,108 (5.6%) | $97,157 |
| 6-Person Families | 600 (1.6%) | $168,269 |
| 7+ Person Families | 294 (0.8%) | $93,125 |
| Total | 37,634 (100.0%) | $82,139 |
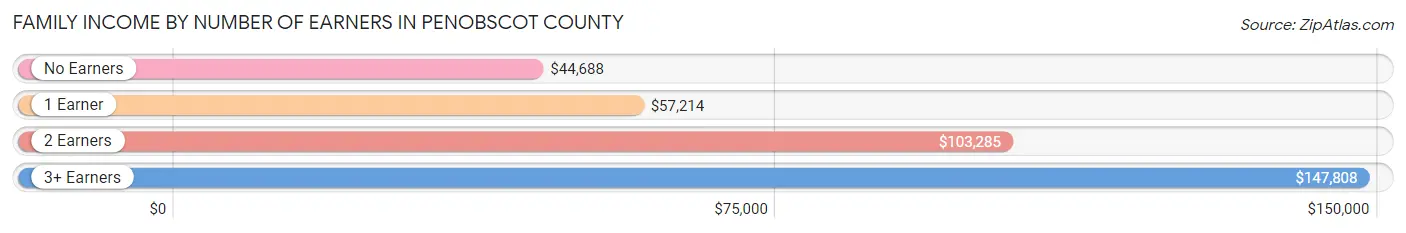
Family Income by Number of Earners in Penobscot County
The median family income in Penobscot County is $82,139, with families comprising 3+ earners (3,741) having the highest median family income of $147,808, while families with no earners (7,259) have the lowest median family income of $44,688, accounting for 9.9% and 19.3% of families, respectively.
| Number of Earners | # Families | Median Income |
| No Earners | 7,259 (19.3%) | $44,688 |
| 1 Earner | 10,262 (27.3%) | $57,214 |
| 2 Earners | 16,372 (43.5%) | $103,285 |
| 3+ Earners | 3,741 (9.9%) | $147,808 |
| Total | 37,634 (100.0%) | $82,139 |
Household Income in Penobscot County
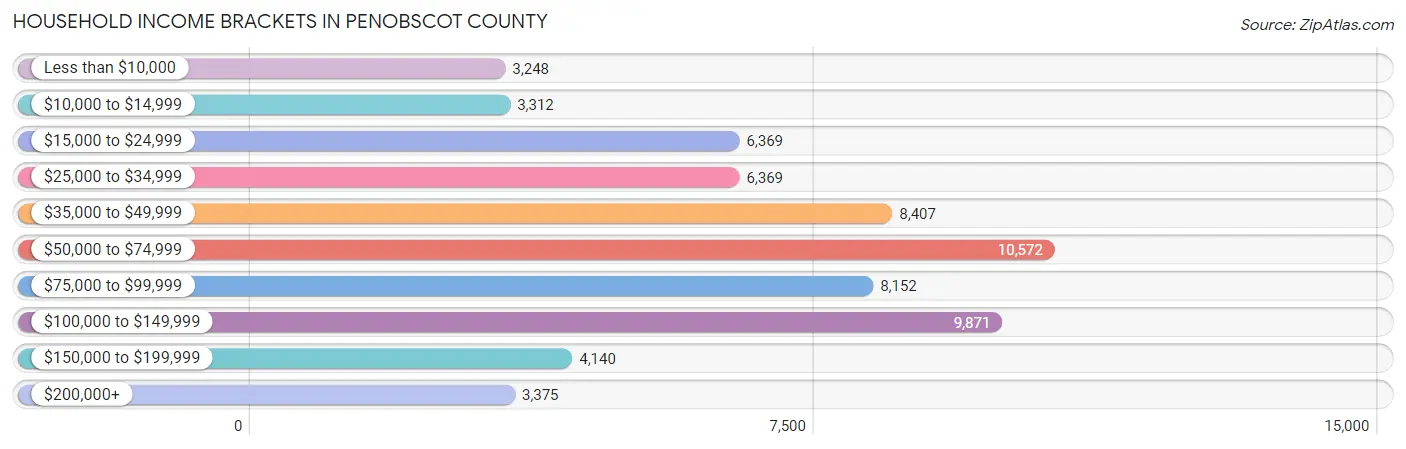
Household Income Brackets in Penobscot County
With 10,572 households falling in the category, the $50,000 to $74,999 income range is the most frequent in Penobscot County, accounting for 16.6% of all households. In contrast, only 3,248 households (5.1%) fall into the less than $10,000 income bracket, making it the least populous group.
| Income Bracket | # Households | % Households |
| Less than $10,000 | 3,248 | 5.1% |
| $10,000 to $14,999 | 3,312 | 5.2% |
| $15,000 to $24,999 | 6,369 | 10.0% |
| $25,000 to $34,999 | 6,369 | 10.0% |
| $35,000 to $49,999 | 8,407 | 13.2% |
| $50,000 to $74,999 | 10,572 | 16.6% |
| $75,000 to $99,999 | 8,152 | 12.8% |
| $100,000 to $149,999 | 9,871 | 15.5% |
| $150,000 to $199,999 | 4,140 | 6.5% |
| $200,000+ | 3,375 | 5.3% |
Household Income by Householder Age in Penobscot County
The median household income in Penobscot County is $59,438, with the highest median household income of $70,548 found in the 25 to 44 years age bracket for the primary householder. A total of 18,966 households (29.8%) fall into this category. Meanwhile, the 15 to 24 years age bracket for the primary householder has the lowest median household income of $38,446, with 1,986 households (3.1%) in this group.
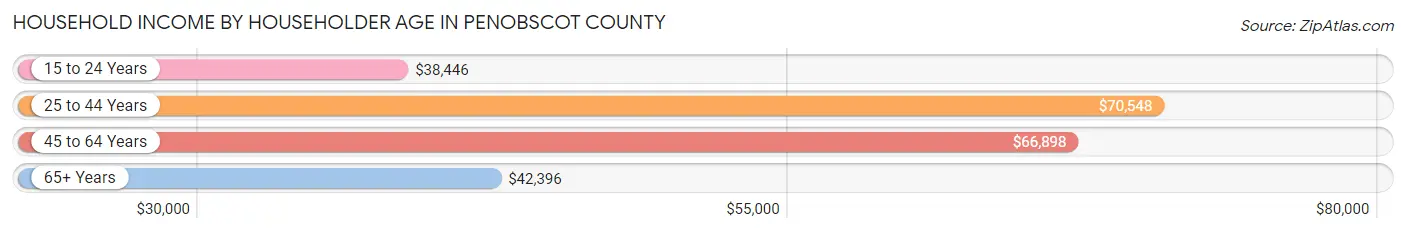
| Income Bracket | # Households | Median Income |
| 15 to 24 Years | 1,986 (3.1%) | $38,446 |
| 25 to 44 Years | 18,966 (29.8%) | $70,548 |
| 45 to 64 Years | 24,225 (38.0%) | $66,898 |
| 65+ Years | 18,510 (29.1%) | $42,396 |
| Total | 63,687 (100.0%) | $59,438 |
Poverty in Penobscot County
Income Below Poverty by Sex and Age in Penobscot County
With 11.8% poverty level for males and 15.0% for females among the residents of Penobscot County, 18 to 24 year old males and 18 to 24 year old females are the most vulnerable to poverty, with 1,679 males (26.9%) and 1,741 females (33.7%) in their respective age groups living below the poverty level.
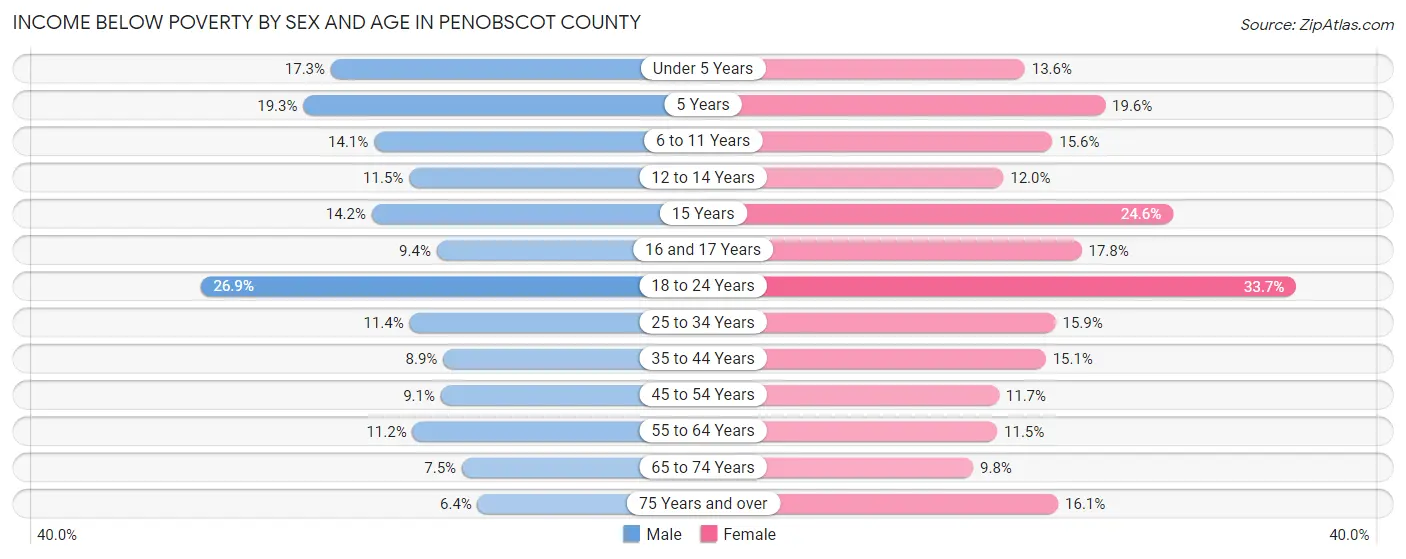
| Age Bracket | Male | Female |
| Under 5 Years | 574 (17.3%) | 440 (13.6%) |
| 5 Years | 150 (19.3%) | 184 (19.6%) |
| 6 to 11 Years | 648 (14.1%) | 649 (15.6%) |
| 12 to 14 Years | 272 (11.5%) | 234 (12.0%) |
| 15 Years | 97 (14.2%) | 180 (24.6%) |
| 16 and 17 Years | 176 (9.4%) | 316 (17.8%) |
| 18 to 24 Years | 1,679 (26.9%) | 1,741 (33.7%) |
| 25 to 34 Years | 1,134 (11.4%) | 1,512 (15.9%) |
| 35 to 44 Years | 790 (8.9%) | 1,379 (15.1%) |
| 45 to 54 Years | 872 (9.1%) | 1,146 (11.7%) |
| 55 to 64 Years | 1,278 (11.2%) | 1,353 (11.5%) |
| 65 to 74 Years | 635 (7.5%) | 882 (9.8%) |
| 75 Years and over | 300 (6.4%) | 987 (16.1%) |
| Total | 8,605 (11.8%) | 11,003 (15.0%) |
Income Above Poverty by Sex and Age in Penobscot County
According to the poverty statistics in Penobscot County, males aged 75 years and over and females aged 65 to 74 years are the age groups that are most secure financially, with 93.6% of males and 90.2% of females in these age groups living above the poverty line.
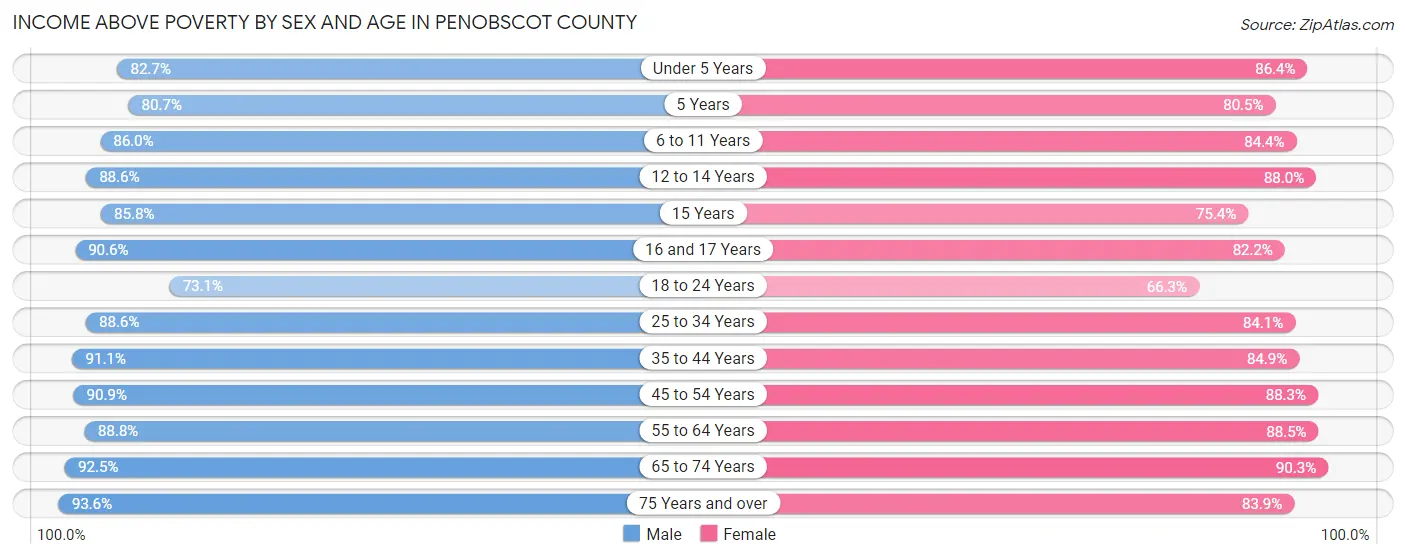
| Age Bracket | Male | Female |
| Under 5 Years | 2,751 (82.7%) | 2,798 (86.4%) |
| 5 Years | 627 (80.7%) | 757 (80.4%) |
| 6 to 11 Years | 3,965 (86.0%) | 3,502 (84.4%) |
| 12 to 14 Years | 2,103 (88.5%) | 1,718 (88.0%) |
| 15 Years | 585 (85.8%) | 552 (75.4%) |
| 16 and 17 Years | 1,697 (90.6%) | 1,459 (82.2%) |
| 18 to 24 Years | 4,554 (73.1%) | 3,421 (66.3%) |
| 25 to 34 Years | 8,798 (88.6%) | 8,013 (84.1%) |
| 35 to 44 Years | 8,065 (91.1%) | 7,727 (84.9%) |
| 45 to 54 Years | 8,712 (90.9%) | 8,679 (88.3%) |
| 55 to 64 Years | 10,133 (88.8%) | 10,382 (88.5%) |
| 65 to 74 Years | 7,795 (92.5%) | 8,168 (90.2%) |
| 75 Years and over | 4,420 (93.6%) | 5,160 (83.9%) |
| Total | 64,205 (88.2%) | 62,336 (85.0%) |
Income Below Poverty Among Married-Couple Families in Penobscot County
The poverty statistics for married-couple families in Penobscot County show that 3.5% or 1,027 of the total 29,324 families live below the poverty line. Families with 5 or more children have the highest poverty rate of 15.6%, comprising of 27 families. On the other hand, families with no children have the lowest poverty rate of 2.6%, which includes 506 families.
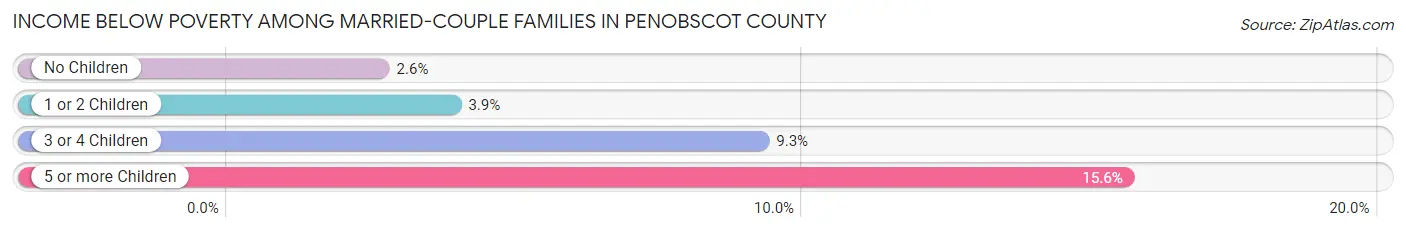
| Children | Above Poverty | Below Poverty |
| No Children | 18,686 (97.4%) | 506 (2.6%) |
| 1 or 2 Children | 7,660 (96.1%) | 310 (3.9%) |
| 3 or 4 Children | 1,805 (90.7%) | 184 (9.2%) |
| 5 or more Children | 146 (84.4%) | 27 (15.6%) |
| Total | 28,297 (96.5%) | 1,027 (3.5%) |
Income Below Poverty Among Single-Parent Households in Penobscot County
According to the poverty data in Penobscot County, 11.0% or 275 single-father households and 27.1% or 1,573 single-mother households are living below the poverty line. Among single-father households, those with 5 or more children have the highest poverty rate, with 22 households (91.7%) experiencing poverty. Likewise, among single-mother households, those with 5 or more children have the highest poverty rate, with 3 households (100.0%) falling below the poverty line.
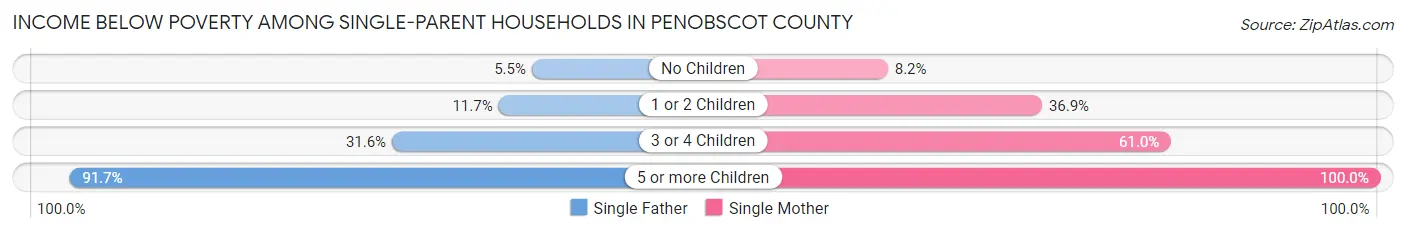
| Children | Single Father | Single Mother |
| No Children | 53 (5.5%) | 194 (8.2%) |
| 1 or 2 Children | 164 (11.7%) | 1,118 (36.9%) |
| 3 or 4 Children | 36 (31.6%) | 258 (61.0%) |
| 5 or more Children | 22 (91.7%) | 3 (100.0%) |
| Total | 275 (11.0%) | 1,573 (27.1%) |
Income Below Poverty Among Married-Couple vs Single-Parent Households in Penobscot County
The poverty data for Penobscot County shows that 1,027 of the married-couple family households (3.5%) and 1,848 of the single-parent households (22.2%) are living below the poverty level. Within the married-couple family households, those with 5 or more children have the highest poverty rate, with 27 households (15.6%) falling below the poverty line. Among the single-parent households, those with 5 or more children have the highest poverty rate, with 25 household (92.6%) living below poverty.
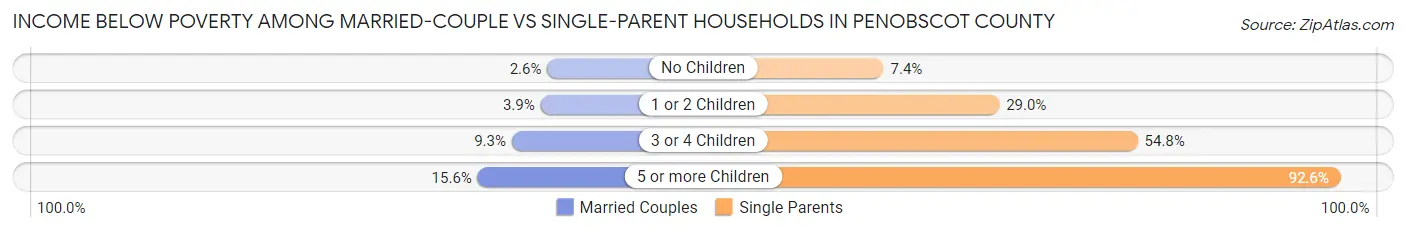
| Children | Married-Couple Families | Single-Parent Households |
| No Children | 506 (2.6%) | 247 (7.4%) |
| 1 or 2 Children | 310 (3.9%) | 1,282 (29.0%) |
| 3 or 4 Children | 184 (9.2%) | 294 (54.7%) |
| 5 or more Children | 27 (15.6%) | 25 (92.6%) |
| Total | 1,027 (3.5%) | 1,848 (22.2%) |
Race in Penobscot County
The most populous races in Penobscot County are White / Caucasian (141,780 | 92.9%), Two or more Races (5,101 | 3.3%), and Hispanic or Latino (2,498 | 1.6%).
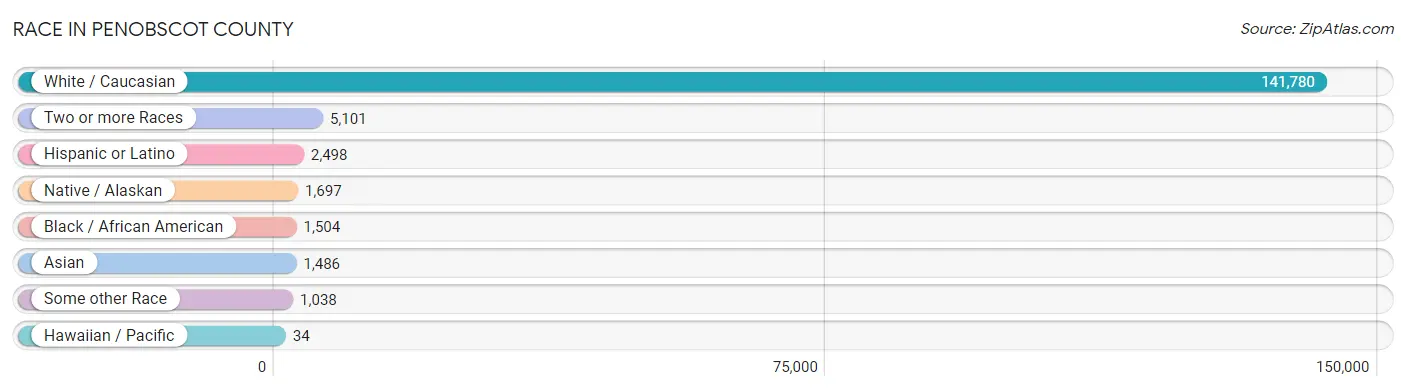
| Race | # Population | % Population |
| Asian | 1,486 | 1.0% |
| Black / African American | 1,504 | 1.0% |
| Hawaiian / Pacific | 34 | 0.0% |
| Hispanic or Latino | 2,498 | 1.6% |
| Native / Alaskan | 1,697 | 1.1% |
| White / Caucasian | 141,780 | 92.9% |
| Two or more Races | 5,101 | 3.3% |
| Some other Race | 1,038 | 0.7% |
| Total | 152,640 | 100.0% |
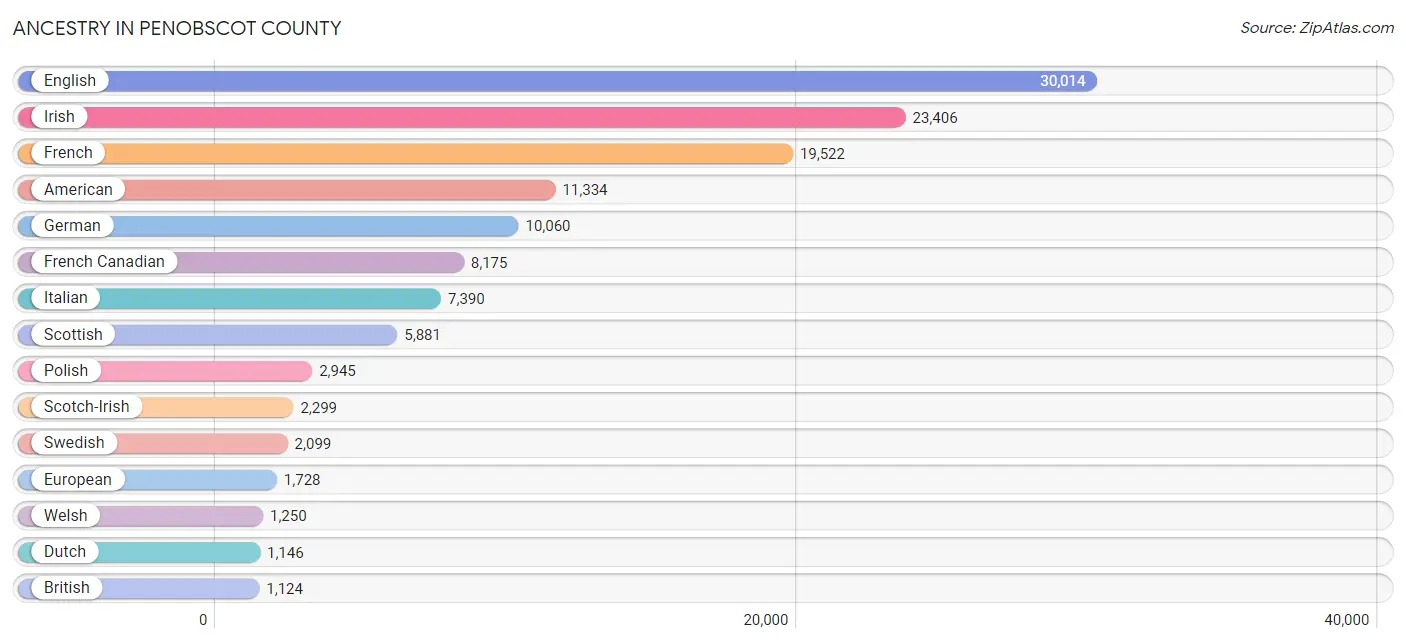
Ancestry in Penobscot County
The most populous ancestries reported in Penobscot County are English (30,014 | 19.7%), Irish (23,406 | 15.3%), French (19,522 | 12.8%), American (11,334 | 7.4%), and German (10,060 | 6.6%), together accounting for 61.8% of all Penobscot County residents.
| Ancestry | # Population | % Population |
| African | 181 | 0.1% |
| Albanian | 33 | 0.0% |
| American | 11,334 | 7.4% |
| Apache | 29 | 0.0% |
| Arab | 564 | 0.4% |
| Argentinean | 27 | 0.0% |
| Armenian | 96 | 0.1% |
| Australian | 69 | 0.1% |
| Austrian | 92 | 0.1% |
| Belgian | 29 | 0.0% |
| Bhutanese | 156 | 0.1% |
| Blackfeet | 181 | 0.1% |
| Brazilian | 150 | 0.1% |
| British | 1,124 | 0.7% |
| Bulgarian | 38 | 0.0% |
| Burmese | 237 | 0.2% |
| Cajun | 30 | 0.0% |
| Canadian | 936 | 0.6% |
| Celtic | 45 | 0.0% |
| Central American | 64 | 0.0% |
| Cherokee | 90 | 0.1% |
| Chickasaw | 9 | 0.0% |
| Chilean | 3 | 0.0% |
| Chinese | 10 | 0.0% |
| Chippewa | 6 | 0.0% |
| Colombian | 185 | 0.1% |
| Costa Rican | 8 | 0.0% |
| Cree | 3 | 0.0% |
| Creek | 8 | 0.0% |
| Croatian | 35 | 0.0% |
| Crow | 8 | 0.0% |
| Cuban | 73 | 0.1% |
| Cypriot | 60 | 0.0% |
| Czech | 181 | 0.1% |
| Czechoslovakian | 42 | 0.0% |
| Danish | 303 | 0.2% |
| Dominican | 53 | 0.0% |
| Dutch | 1,146 | 0.7% |
| Eastern European | 536 | 0.4% |
| Ecuadorian | 18 | 0.0% |
| Egyptian | 55 | 0.0% |
| English | 30,014 | 19.7% |
| Estonian | 14 | 0.0% |
| Ethiopian | 24 | 0.0% |
| European | 1,728 | 1.1% |
| Filipino | 10 | 0.0% |
| Finnish | 285 | 0.2% |
| French | 19,522 | 12.8% |
| French American Indian | 48 | 0.0% |
| French Canadian | 8,175 | 5.4% |
| German | 10,060 | 6.6% |
| Greek | 430 | 0.3% |
| Guamanian / Chamorro | 22 | 0.0% |
| Guatemalan | 3 | 0.0% |
| Guyanese | 9 | 0.0% |
| Haitian | 23 | 0.0% |
| Honduran | 8 | 0.0% |
| Hungarian | 211 | 0.1% |
| Icelander | 23 | 0.0% |
| Indian (Asian) | 530 | 0.4% |
| Indonesian | 30 | 0.0% |
| Iranian | 144 | 0.1% |
| Iraqi | 35 | 0.0% |
| Irish | 23,406 | 15.3% |
| Iroquois | 61 | 0.0% |
| Italian | 7,390 | 4.8% |
| Jamaican | 320 | 0.2% |
| Japanese | 5 | 0.0% |
| Korean | 727 | 0.5% |
| Laotian | 2 | 0.0% |
| Latvian | 46 | 0.0% |
| Lebanese | 279 | 0.2% |
| Lithuanian | 532 | 0.4% |
| Lumbee | 4 | 0.0% |
| Luxembourger | 4 | 0.0% |
| Mexican | 1,074 | 0.7% |
| Mexican American Indian | 35 | 0.0% |
| Mongolian | 53 | 0.0% |
| Navajo | 88 | 0.1% |
| New Zealander | 23 | 0.0% |
| Nicaraguan | 10 | 0.0% |
| Nigerian | 212 | 0.1% |
| Northern European | 192 | 0.1% |
| Norwegian | 760 | 0.5% |
| Pakistani | 16 | 0.0% |
| Pennsylvania German | 69 | 0.1% |
| Peruvian | 124 | 0.1% |
| Polish | 2,945 | 1.9% |
| Portuguese | 974 | 0.6% |
| Puerto Rican | 533 | 0.4% |
| Romanian | 32 | 0.0% |
| Russian | 640 | 0.4% |
| Salvadoran | 35 | 0.0% |
| Scandinavian | 425 | 0.3% |
| Scotch-Irish | 2,299 | 1.5% |
| Scottish | 5,881 | 3.8% |
| Serbian | 65 | 0.0% |
| Sioux | 22 | 0.0% |
| Slavic | 39 | 0.0% |
| Slovak | 106 | 0.1% |
| Somali | 82 | 0.1% |
| South American | 383 | 0.3% |
| South American Indian | 12 | 0.0% |
| Soviet Union | 4 | 0.0% |
| Spaniard | 142 | 0.1% |
| Spanish | 59 | 0.0% |
| Sri Lankan | 170 | 0.1% |
| Subsaharan African | 504 | 0.3% |
| Sudanese | 1 | 0.0% |
| Swedish | 2,099 | 1.4% |
| Swiss | 80 | 0.1% |
| Syrian | 19 | 0.0% |
| Thai | 174 | 0.1% |
| Trinidadian and Tobagonian | 23 | 0.0% |
| Turkish | 42 | 0.0% |
| Ukrainian | 211 | 0.1% |
| Uruguayan | 20 | 0.0% |
| Venezuelan | 6 | 0.0% |
| Welsh | 1,250 | 0.8% |
| Yugoslavian | 2 | 0.0% | View All 120 Rows |
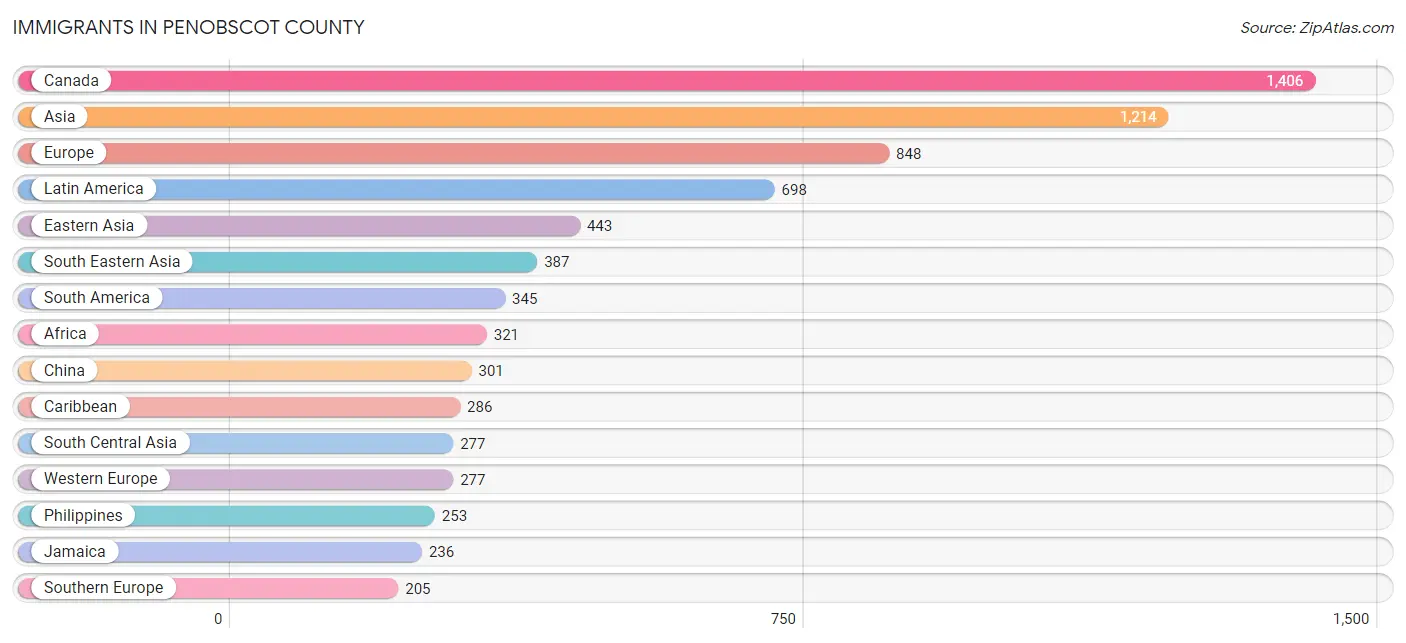
Immigrants in Penobscot County
The most numerous immigrant groups reported in Penobscot County came from Canada (1,406 | 0.9%), Asia (1,214 | 0.8%), Europe (848 | 0.6%), Latin America (698 | 0.5%), and Eastern Asia (443 | 0.3%), together accounting for 3.0% of all Penobscot County residents.
| Immigration Origin | # Population | % Population |
| Africa | 321 | 0.2% |
| Albania | 35 | 0.0% |
| Argentina | 8 | 0.0% |
| Asia | 1,214 | 0.8% |
| Australia | 141 | 0.1% |
| Austria | 7 | 0.0% |
| Azores | 38 | 0.0% |
| Barbados | 13 | 0.0% |
| Belarus | 5 | 0.0% |
| Brazil | 68 | 0.0% |
| Bulgaria | 16 | 0.0% |
| Canada | 1,406 | 0.9% |
| Caribbean | 286 | 0.2% |
| Central America | 67 | 0.0% |
| Chile | 2 | 0.0% |
| China | 301 | 0.2% |
| Colombia | 89 | 0.1% |
| Costa Rica | 2 | 0.0% |
| Cuba | 2 | 0.0% |
| Czechoslovakia | 25 | 0.0% |
| Denmark | 26 | 0.0% |
| Dominican Republic | 18 | 0.0% |
| Eastern Africa | 52 | 0.0% |
| Eastern Asia | 443 | 0.3% |
| Eastern Europe | 172 | 0.1% |
| Ecuador | 18 | 0.0% |
| Egypt | 40 | 0.0% |
| England | 76 | 0.1% |
| Ethiopia | 26 | 0.0% |
| Europe | 848 | 0.6% |
| France | 69 | 0.1% |
| Germany | 179 | 0.1% |
| Ghana | 6 | 0.0% |
| Greece | 68 | 0.0% |
| Haiti | 11 | 0.0% |
| Hong Kong | 17 | 0.0% |
| Hungary | 9 | 0.0% |
| India | 95 | 0.1% |
| Indonesia | 2 | 0.0% |
| Iran | 132 | 0.1% |
| Iraq | 30 | 0.0% |
| Ireland | 14 | 0.0% |
| Italy | 25 | 0.0% |
| Jamaica | 236 | 0.2% |
| Japan | 19 | 0.0% |
| Kenya | 13 | 0.0% |
| Korea | 123 | 0.1% |
| Latin America | 698 | 0.5% |
| Mexico | 55 | 0.0% |
| Nepal | 3 | 0.0% |
| Netherlands | 10 | 0.0% |
| Nicaragua | 10 | 0.0% |
| Nigeria | 145 | 0.1% |
| Northern Africa | 93 | 0.1% |
| Northern Europe | 194 | 0.1% |
| Oceania | 141 | 0.1% |
| Pakistan | 44 | 0.0% |
| Peru | 154 | 0.1% |
| Philippines | 253 | 0.2% |
| Poland | 47 | 0.0% |
| Portugal | 74 | 0.1% |
| Romania | 18 | 0.0% |
| Russia | 17 | 0.0% |
| Scotland | 27 | 0.0% |
| Somalia | 4 | 0.0% |
| South Africa | 23 | 0.0% |
| South America | 345 | 0.2% |
| South Central Asia | 277 | 0.2% |
| South Eastern Asia | 387 | 0.3% |
| Southern Europe | 205 | 0.1% |
| Spain | 17 | 0.0% |
| Sri Lanka | 3 | 0.0% |
| Sweden | 2 | 0.0% |
| Switzerland | 12 | 0.0% |
| Syria | 19 | 0.0% |
| Taiwan | 30 | 0.0% |
| Thailand | 16 | 0.0% |
| Trinidad and Tobago | 6 | 0.0% |
| Turkey | 12 | 0.0% |
| Venezuela | 6 | 0.0% |
| Vietnam | 116 | 0.1% |
| Western Africa | 153 | 0.1% |
| Western Asia | 107 | 0.1% |
| Western Europe | 277 | 0.2% |
| Zimbabwe | 7 | 0.0% | View All 85 Rows |
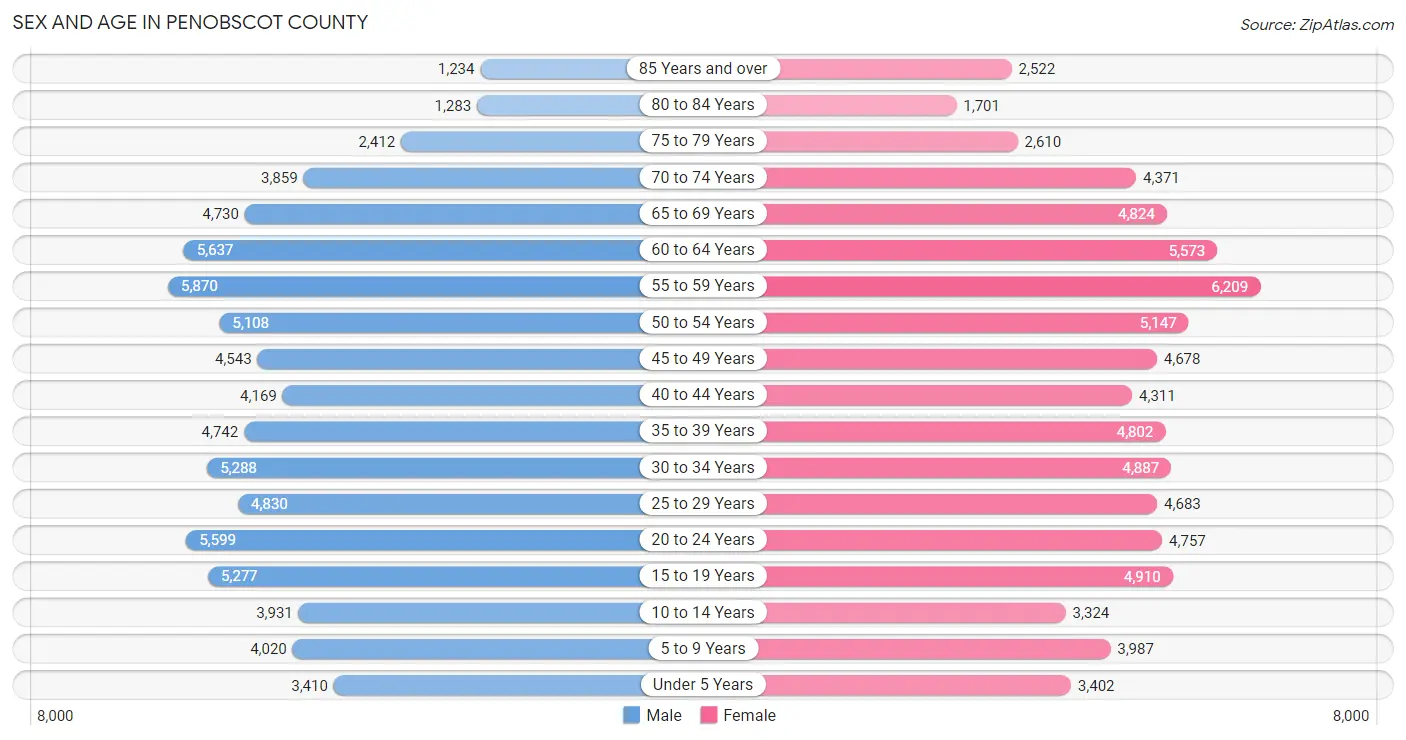
Sex and Age in Penobscot County
Sex and Age in Penobscot County
The most populous age groups in Penobscot County are 55 to 59 Years (5,870 | 7.7%) for men and 55 to 59 Years (6,209 | 8.1%) for women.
| Age Bracket | Male | Female |
| Under 5 Years | 3,410 (4.5%) | 3,402 (4.4%) |
| 5 to 9 Years | 4,020 (5.3%) | 3,987 (5.2%) |
| 10 to 14 Years | 3,931 (5.2%) | 3,324 (4.3%) |
| 15 to 19 Years | 5,277 (7.0%) | 4,910 (6.4%) |
| 20 to 24 Years | 5,599 (7.4%) | 4,757 (6.2%) |
| 25 to 29 Years | 4,830 (6.4%) | 4,683 (6.1%) |
| 30 to 34 Years | 5,288 (7.0%) | 4,887 (6.4%) |
| 35 to 39 Years | 4,742 (6.2%) | 4,802 (6.3%) |
| 40 to 44 Years | 4,169 (5.5%) | 4,311 (5.6%) |
| 45 to 49 Years | 4,543 (6.0%) | 4,678 (6.1%) |
| 50 to 54 Years | 5,108 (6.7%) | 5,147 (6.7%) |
| 55 to 59 Years | 5,870 (7.7%) | 6,209 (8.1%) |
| 60 to 64 Years | 5,637 (7.4%) | 5,573 (7.3%) |
| 65 to 69 Years | 4,730 (6.2%) | 4,824 (6.3%) |
| 70 to 74 Years | 3,859 (5.1%) | 4,371 (5.7%) |
| 75 to 79 Years | 2,412 (3.2%) | 2,610 (3.4%) |
| 80 to 84 Years | 1,283 (1.7%) | 1,701 (2.2%) |
| 85 Years and over | 1,234 (1.6%) | 2,522 (3.3%) |
| Total | 75,942 (100.0%) | 76,698 (100.0%) |
Families and Households in Penobscot County
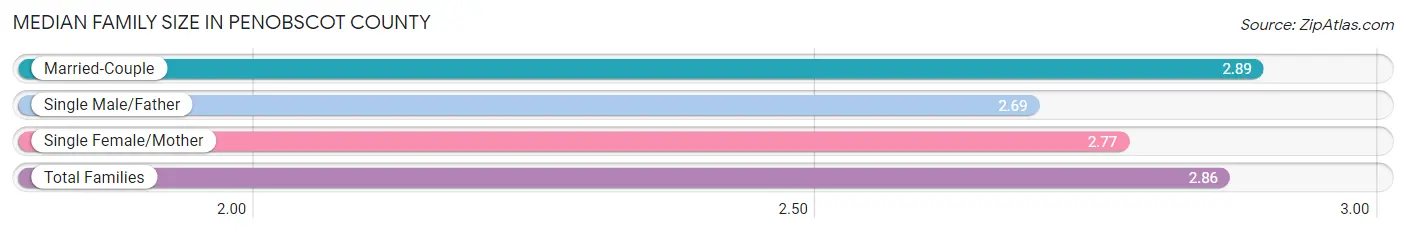
Median Family Size in Penobscot County
The median family size in Penobscot County is 2.86 persons per family, with married-couple families (29,324 | 77.9%) accounting for the largest median family size of 2.89 persons per family. On the other hand, single male/father families (2,497 | 6.6%) represent the smallest median family size with 2.69 persons per family.
| Family Type | # Families | Family Size |
| Married-Couple | 29,324 (77.9%) | 2.89 |
| Single Male/Father | 2,497 (6.6%) | 2.69 |
| Single Female/Mother | 5,813 (15.4%) | 2.77 |
| Total Families | 37,634 (100.0%) | 2.86 |
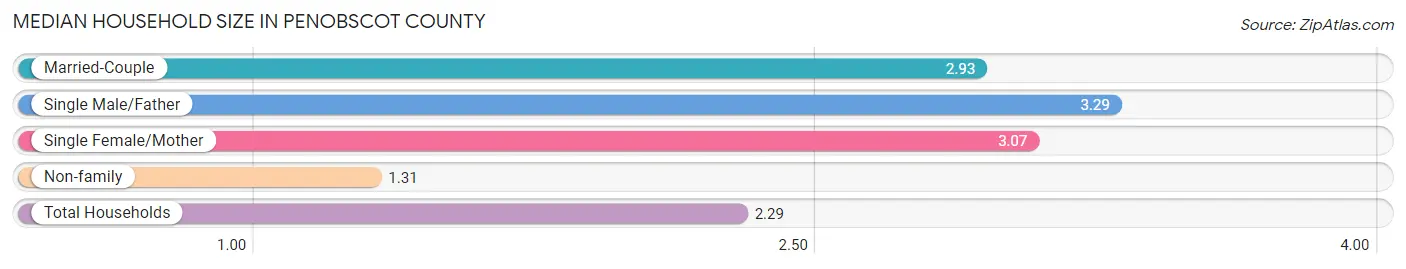
Median Household Size in Penobscot County
The median household size in Penobscot County is 2.29 persons per household, with single male/father households (2,497 | 3.9%) accounting for the largest median household size of 3.29 persons per household. non-family households (26,053 | 40.9%) represent the smallest median household size with 1.31 persons per household.
| Household Type | # Households | Household Size |
| Married-Couple | 29,324 (46.0%) | 2.93 |
| Single Male/Father | 2,497 (3.9%) | 3.29 |
| Single Female/Mother | 5,813 (9.1%) | 3.07 |
| Non-family | 26,053 (40.9%) | 1.31 |
| Total Households | 63,687 (100.0%) | 2.29 |
Household Size by Marriage Status in Penobscot County
Out of a total of 63,687 households in Penobscot County, 37,634 (59.1%) are family households, while 26,053 (40.9%) are nonfamily households. The most numerous type of family households are 2-person households, comprising 19,070, and the most common type of nonfamily households are 1-person households, comprising 20,060.
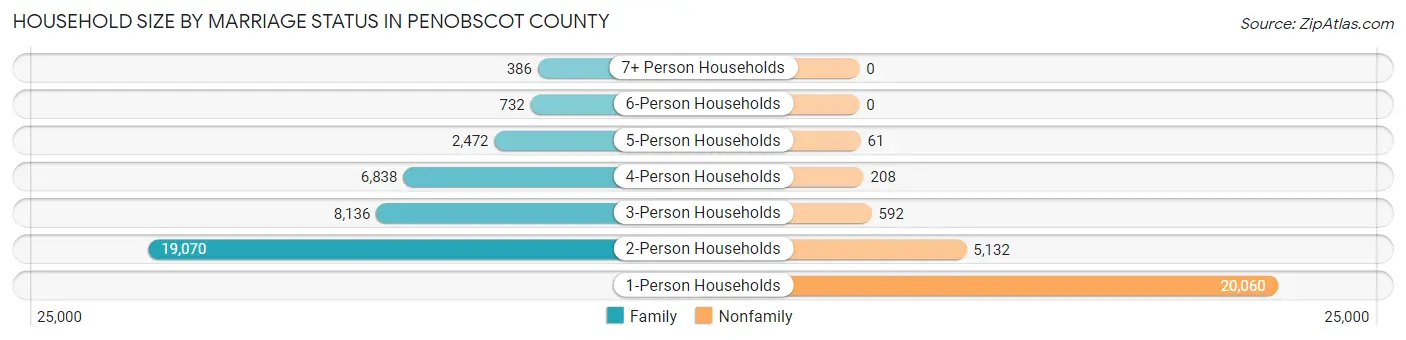
| Household Size | Family Households | Nonfamily Households |
| 1-Person Households | - | 20,060 (31.5%) |
| 2-Person Households | 19,070 (29.9%) | 5,132 (8.1%) |
| 3-Person Households | 8,136 (12.8%) | 592 (0.9%) |
| 4-Person Households | 6,838 (10.7%) | 208 (0.3%) |
| 5-Person Households | 2,472 (3.9%) | 61 (0.1%) |
| 6-Person Households | 732 (1.1%) | 0 (0.0%) |
| 7+ Person Households | 386 (0.6%) | 0 (0.0%) |
| Total | 37,634 (59.1%) | 26,053 (40.9%) |
Female Fertility in Penobscot County
Fertility by Age in Penobscot County
Average fertility rate in Penobscot County is 65.0 births per 1,000 women. Women in the age bracket of 20 to 34 years have the highest fertility rate with 88.0 births per 1,000 women. Women in the age bracket of 20 to 34 years acount for 57.2% of all women with births.
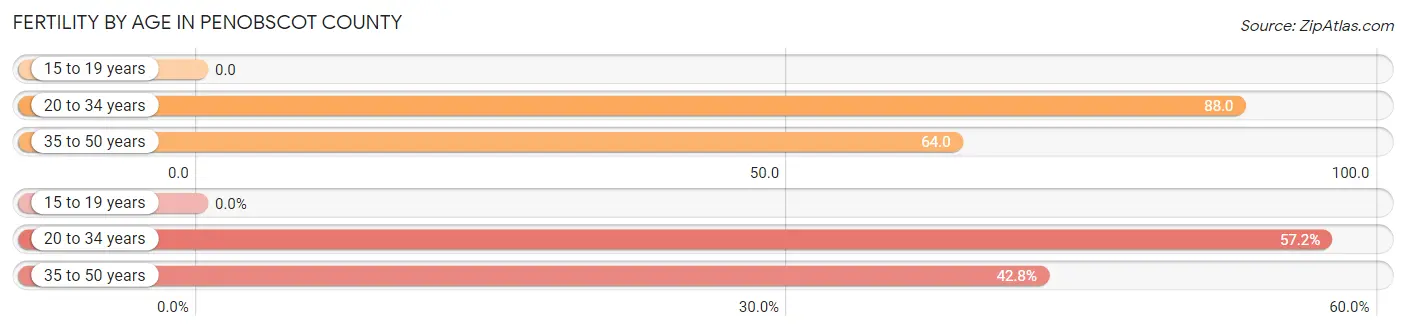
| Age Bracket | Women with Births | Births / 1,000 Women |
| 15 to 19 years | 0 (0.0%) | 0.0 |
| 20 to 34 years | 1,265 (57.2%) | 88.0 |
| 35 to 50 years | 946 (42.8%) | 64.0 |
| Total | 2,211 (100.0%) | 65.0 |
Fertility by Age by Marriage Status in Penobscot County
64.5% of women with births (2,211) in Penobscot County are married. The highest percentage of unmarried women with births falls into 35 to 50 years age bracket with 38.1% of them unmarried at the time of birth, while the lowest percentage of unmarried women with births belong to 20 to 34 years age bracket with 33.5% of them unmarried.
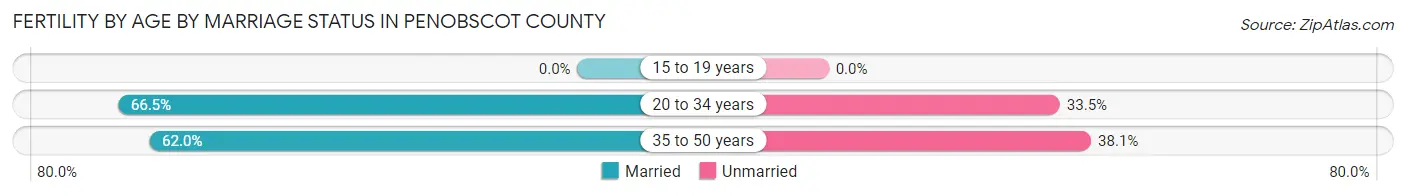
| Age Bracket | Married | Unmarried |
| 15 to 19 years | 0 (0.0%) | 0 (0.0%) |
| 20 to 34 years | 841 (66.5%) | 424 (33.5%) |
| 35 to 50 years | 586 (62.0%) | 360 (38.1%) |
| Total | 1,426 (64.5%) | 785 (35.5%) |
Fertility by Education in Penobscot County
Average fertility rate in Penobscot County is 65.0 births per 1,000 women. Women with the education attainment of graduate degree have the highest fertility rate of 145.0 births per 1,000 women, while women with the education attainment of less than high school have the lowest fertility at 27.0 births per 1,000 women. Women with the education attainment of college or associate's degree represent 35.9% of all women with births.
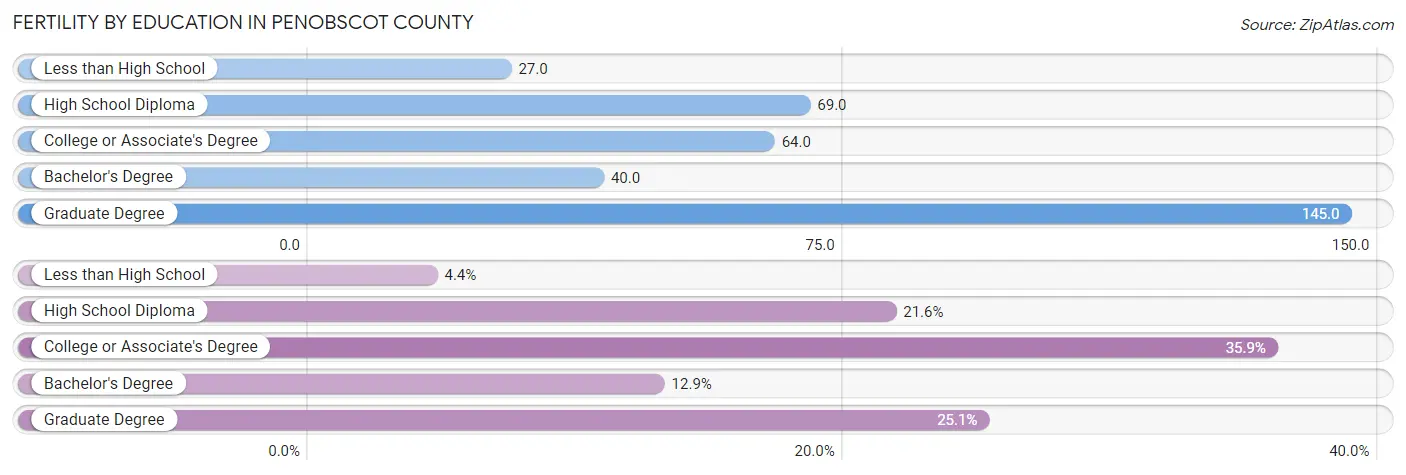
| Educational Attainment | Women with Births | Births / 1,000 Women |
| Less than High School | 98 (4.4%) | 27.0 |
| High School Diploma | 478 (21.6%) | 69.0 |
| College or Associate's Degree | 794 (35.9%) | 64.0 |
| Bachelor's Degree | 286 (12.9%) | 40.0 |
| Graduate Degree | 555 (25.1%) | 145.0 |
| Total | 2,211 (100.0%) | 65.0 |
Fertility by Education by Marriage Status in Penobscot County
35.5% of women with births in Penobscot County are unmarried. Women with the educational attainment of graduate degree are most likely to be married with 88.1% of them married at childbirth, while women with the educational attainment of high school diploma are least likely to be married with 54.4% of them unmarried at childbirth.
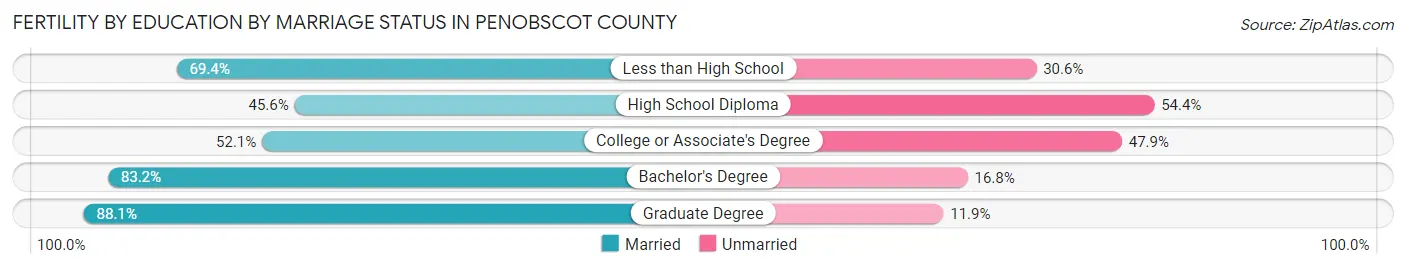
| Educational Attainment | Married | Unmarried |
| Less than High School | 68 (69.4%) | 30 (30.6%) |
| High School Diploma | 218 (45.6%) | 260 (54.4%) |
| College or Associate's Degree | 414 (52.1%) | 380 (47.9%) |
| Bachelor's Degree | 238 (83.2%) | 48 (16.8%) |
| Graduate Degree | 489 (88.1%) | 66 (11.9%) |
| Total | 1,426 (64.5%) | 785 (35.5%) |
Employment Characteristics in Penobscot County
Employment by Class of Employer in Penobscot County
Among the 72,207 employed individuals in Penobscot County, private company employees (41,373 | 57.3%), not-for-profit organizations (12,133 | 16.8%), and local government employees (4,944 | 6.9%) make up the most common classes of employment.
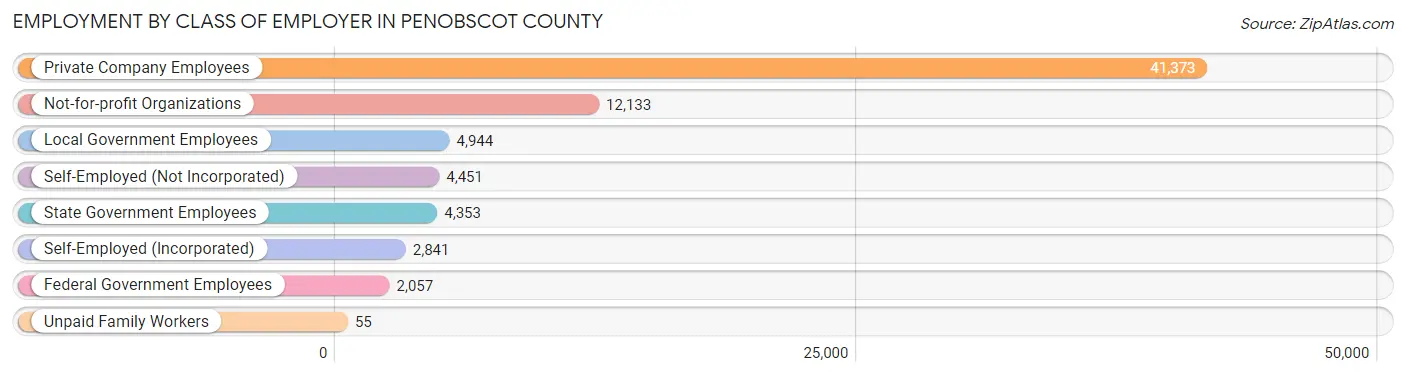
| Employer Class | # Employees | % Employees |
| Private Company Employees | 41,373 | 57.3% |
| Self-Employed (Incorporated) | 2,841 | 3.9% |
| Self-Employed (Not Incorporated) | 4,451 | 6.2% |
| Not-for-profit Organizations | 12,133 | 16.8% |
| Local Government Employees | 4,944 | 6.9% |
| State Government Employees | 4,353 | 6.0% |
| Federal Government Employees | 2,057 | 2.9% |
| Unpaid Family Workers | 55 | 0.1% |
| Total | 72,207 | 100.0% |
Employment Status by Age in Penobscot County
According to the labor force statistics for Penobscot County, out of the total population over 16 years of age (129,147), 60.0% or 77,488 individuals are in the labor force, with 4.3% or 3,332 of them unemployed. The age group with the highest labor force participation rate is 25 to 29 years, with 82.9% or 7,886 individuals in the labor force. Within the labor force, the 16 to 19 years age range has the highest percentage of unemployed individuals, with 9.4% or 397 of them being unemployed.
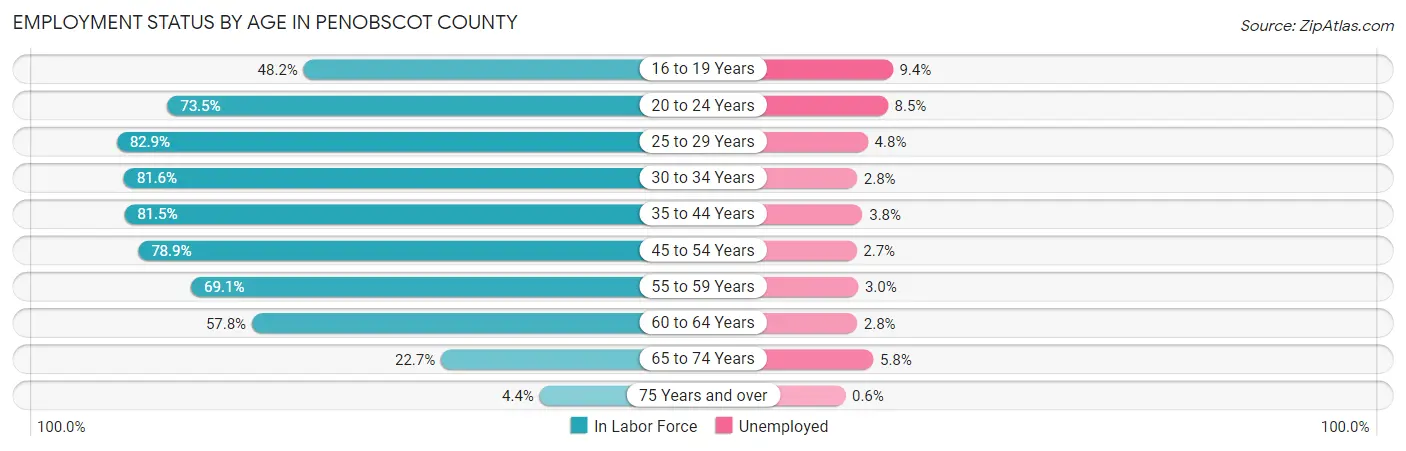
| Age Bracket | In Labor Force | Unemployed |
| 16 to 19 Years | 4,226 (48.2%) | 397 (9.4%) |
| 20 to 24 Years | 7,612 (73.5%) | 647 (8.5%) |
| 25 to 29 Years | 7,886 (82.9%) | 379 (4.8%) |
| 30 to 34 Years | 8,303 (81.6%) | 232 (2.8%) |
| 35 to 44 Years | 14,690 (81.5%) | 558 (3.8%) |
| 45 to 54 Years | 15,367 (78.9%) | 415 (2.7%) |
| 55 to 59 Years | 8,347 (69.1%) | 250 (3.0%) |
| 60 to 64 Years | 6,479 (57.8%) | 181 (2.8%) |
| 65 to 74 Years | 4,037 (22.7%) | 234 (5.8%) |
| 75 Years and over | 518 (4.4%) | 3 (0.6%) |
| Total | 77,488 (60.0%) | 3,332 (4.3%) |
Employment Status by Educational Attainment in Penobscot County
According to labor force statistics for Penobscot County, 75.9% of individuals (61,082) out of the total population between 25 and 64 years of age (80,477) are in the labor force, with 3.3% or 2,016 of them being unemployed. The group with the highest labor force participation rate are those with the educational attainment of bachelor's degree or higher, with 87.8% or 21,697 individuals in the labor force. Within the labor force, individuals with less than high school education have the highest percentage of unemployment, with 10.1% or 182 of them being unemployed.
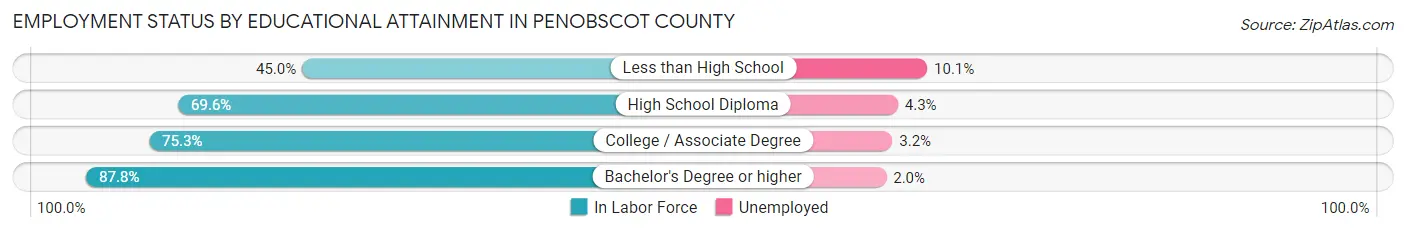
| Educational Attainment | In Labor Force | Unemployed |
| Less than High School | 1,802 (45.0%) | 405 (10.1%) |
| High School Diploma | 17,273 (69.6%) | 1,067 (4.3%) |
| College / Associate Degree | 20,288 (75.3%) | 862 (3.2%) |
| Bachelor's Degree or higher | 21,697 (87.8%) | 494 (2.0%) |
| Total | 61,082 (75.9%) | 2,656 (3.3%) |
Employment Occupations by Sex in Penobscot County
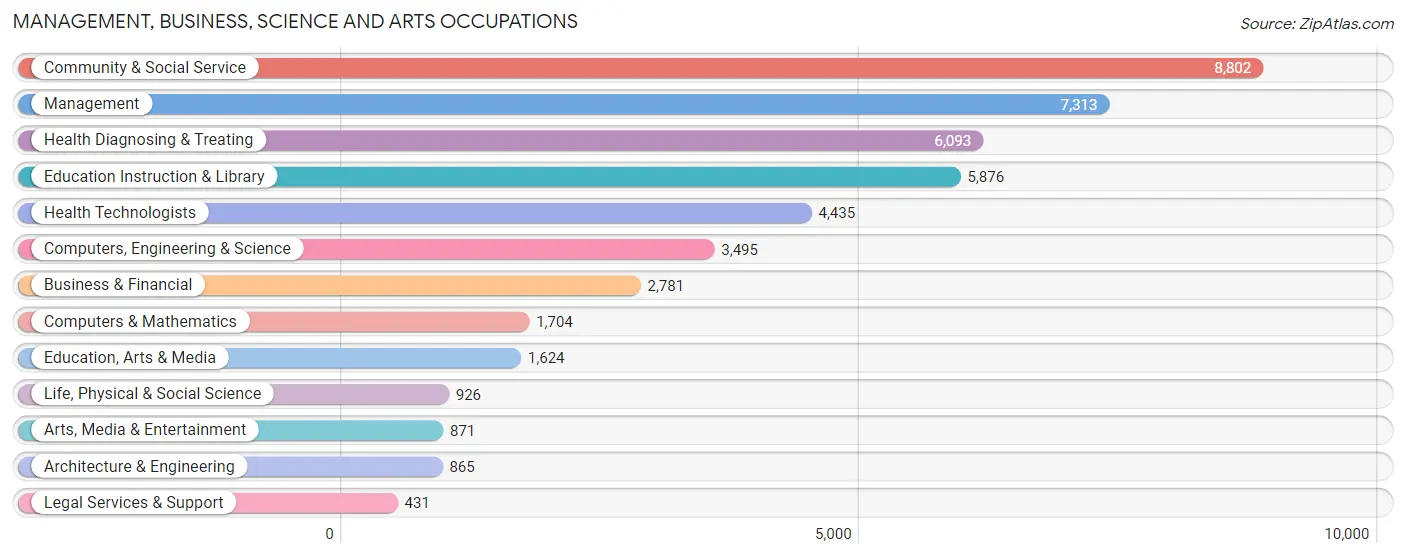
Management, Business, Science and Arts Occupations
The most common Management, Business, Science and Arts occupations in Penobscot County are Community & Social Service (8,802 | 11.9%), Management (7,313 | 9.9%), Health Diagnosing & Treating (6,093 | 8.2%), Education Instruction & Library (5,876 | 8.0%), and Health Technologists (4,435 | 6.0%).
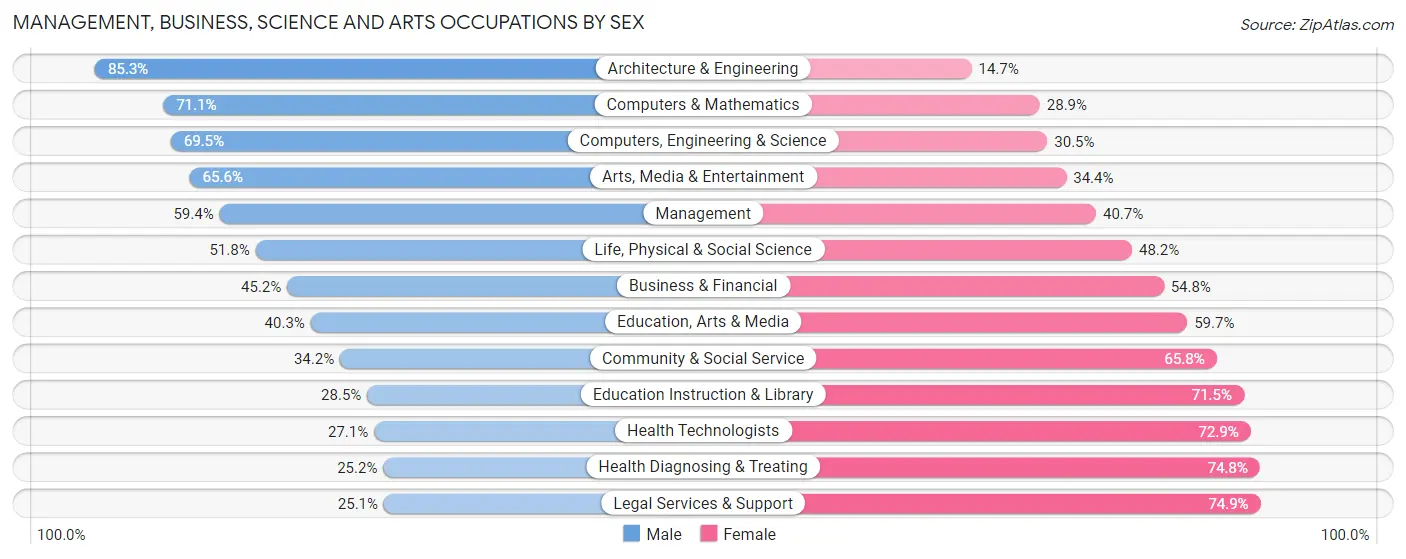
Management, Business, Science and Arts Occupations by Sex
Within the Management, Business, Science and Arts occupations in Penobscot County, the most male-oriented occupations are Architecture & Engineering (85.3%), Computers & Mathematics (71.1%), and Computers, Engineering & Science (69.5%), while the most female-oriented occupations are Legal Services & Support (74.9%), Health Diagnosing & Treating (74.8%), and Health Technologists (72.9%).
| Occupation | Male | Female |
| Management | 4,340 (59.4%) | 2,973 (40.6%) |
| Business & Financial | 1,258 (45.2%) | 1,523 (54.8%) |
| Computers, Engineering & Science | 2,429 (69.5%) | 1,066 (30.5%) |
| Computers & Mathematics | 1,211 (71.1%) | 493 (28.9%) |
| Architecture & Engineering | 738 (85.3%) | 127 (14.7%) |
| Life, Physical & Social Science | 480 (51.8%) | 446 (48.2%) |
| Community & Social Service | 3,011 (34.2%) | 5,791 (65.8%) |
| Education, Arts & Media | 655 (40.3%) | 969 (59.7%) |
| Legal Services & Support | 108 (25.1%) | 323 (74.9%) |
| Education Instruction & Library | 1,677 (28.5%) | 4,199 (71.5%) |
| Arts, Media & Entertainment | 571 (65.6%) | 300 (34.4%) |
| Health Diagnosing & Treating | 1,535 (25.2%) | 4,558 (74.8%) |
| Health Technologists | 1,202 (27.1%) | 3,233 (72.9%) |
| Total (Category) | 12,573 (44.1%) | 15,911 (55.9%) |
| Total (Overall) | 37,496 (50.7%) | 36,416 (49.3%) |
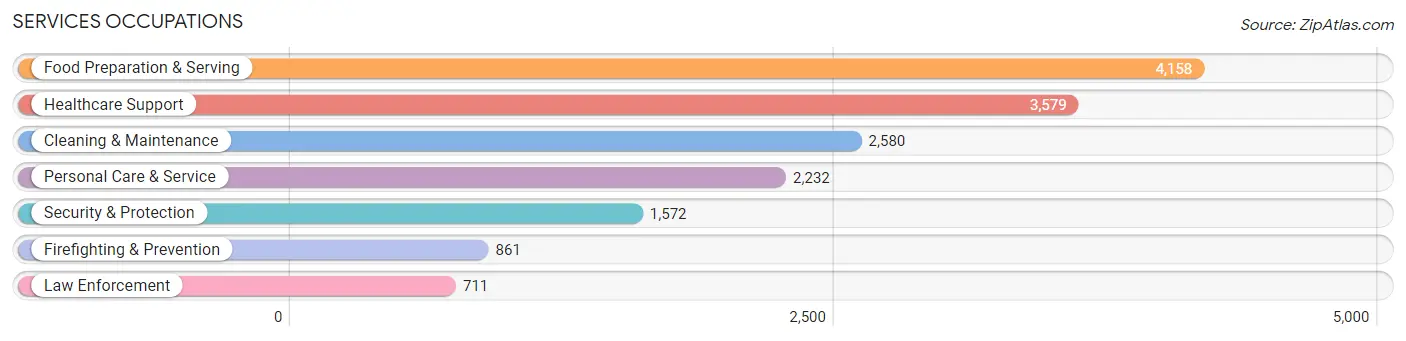
Services Occupations
The most common Services occupations in Penobscot County are Food Preparation & Serving (4,158 | 5.6%), Healthcare Support (3,579 | 4.8%), Cleaning & Maintenance (2,580 | 3.5%), Personal Care & Service (2,232 | 3.0%), and Security & Protection (1,572 | 2.1%).
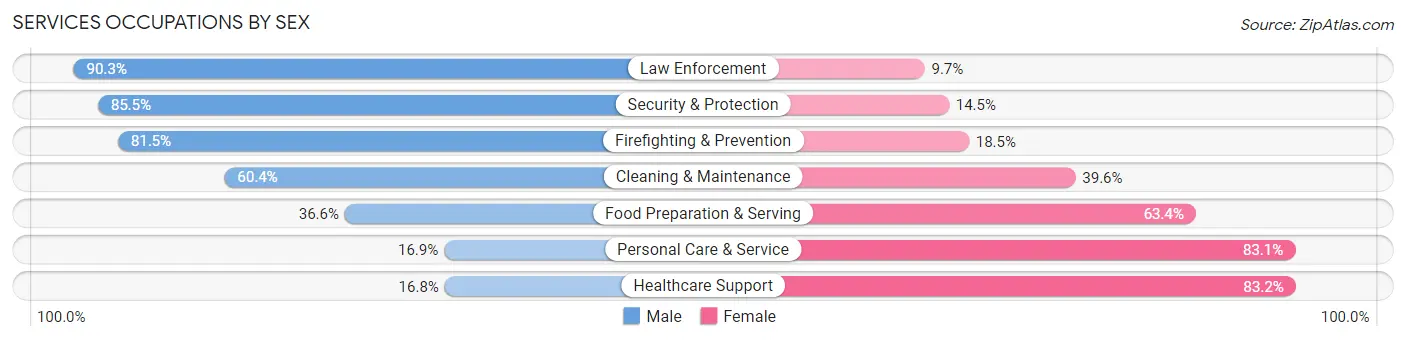
Services Occupations by Sex
Within the Services occupations in Penobscot County, the most male-oriented occupations are Law Enforcement (90.3%), Security & Protection (85.5%), and Firefighting & Prevention (81.5%), while the most female-oriented occupations are Healthcare Support (83.2%), Personal Care & Service (83.1%), and Food Preparation & Serving (63.4%).
| Occupation | Male | Female |
| Healthcare Support | 602 (16.8%) | 2,977 (83.2%) |
| Security & Protection | 1,344 (85.5%) | 228 (14.5%) |
| Firefighting & Prevention | 702 (81.5%) | 159 (18.5%) |
| Law Enforcement | 642 (90.3%) | 69 (9.7%) |
| Food Preparation & Serving | 1,522 (36.6%) | 2,636 (63.4%) |
| Cleaning & Maintenance | 1,559 (60.4%) | 1,021 (39.6%) |
| Personal Care & Service | 378 (16.9%) | 1,854 (83.1%) |
| Total (Category) | 5,405 (38.3%) | 8,716 (61.7%) |
| Total (Overall) | 37,496 (50.7%) | 36,416 (49.3%) |
Sales and Office Occupations
The most common Sales and Office occupations in Penobscot County are Office & Administration (8,631 | 11.7%), and Sales & Related (7,060 | 9.6%).

Sales and Office Occupations by Sex

| Occupation | Male | Female |
| Sales & Related | 3,604 (51.0%) | 3,456 (48.9%) |
| Office & Administration | 1,890 (21.9%) | 6,741 (78.1%) |
| Total (Category) | 5,494 (35.0%) | 10,197 (65.0%) |
| Total (Overall) | 37,496 (50.7%) | 36,416 (49.3%) |
Natural Resources, Construction and Maintenance Occupations
The most common Natural Resources, Construction and Maintenance occupations in Penobscot County are Construction & Extraction (4,139 | 5.6%), Installation, Maintenance & Repair (2,902 | 3.9%), and Farming, Fishing & Forestry (747 | 1.0%).

Natural Resources, Construction and Maintenance Occupations by Sex

| Occupation | Male | Female |
| Farming, Fishing & Forestry | 674 (90.2%) | 73 (9.8%) |
| Construction & Extraction | 4,093 (98.9%) | 46 (1.1%) |
| Installation, Maintenance & Repair | 2,884 (99.4%) | 18 (0.6%) |
| Total (Category) | 7,651 (98.2%) | 137 (1.8%) |
| Total (Overall) | 37,496 (50.7%) | 36,416 (49.3%) |
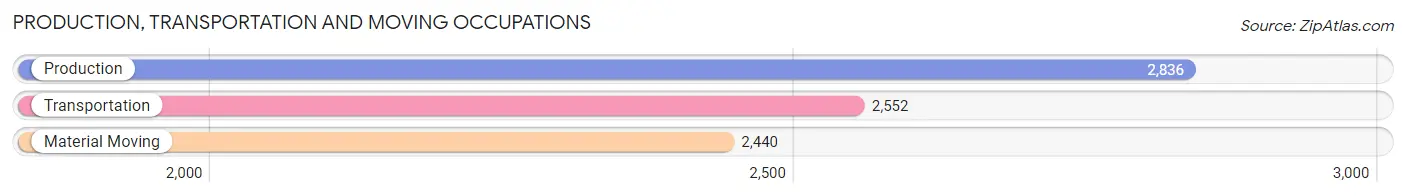
Production, Transportation and Moving Occupations
The most common Production, Transportation and Moving occupations in Penobscot County are Production (2,836 | 3.8%), Transportation (2,552 | 3.5%), and Material Moving (2,440 | 3.3%).
Production, Transportation and Moving Occupations by Sex
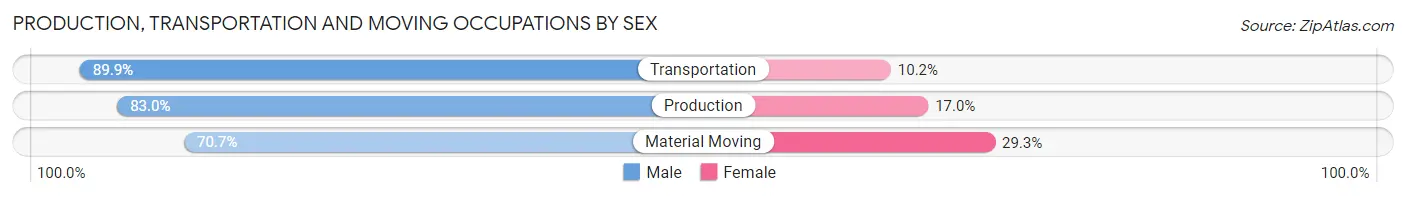
| Occupation | Male | Female |
| Production | 2,354 (83.0%) | 482 (17.0%) |
| Transportation | 2,293 (89.8%) | 259 (10.2%) |
| Material Moving | 1,726 (70.7%) | 714 (29.3%) |
| Total (Category) | 6,373 (81.4%) | 1,455 (18.6%) |
| Total (Overall) | 37,496 (50.7%) | 36,416 (49.3%) |
Employment Industries by Sex in Penobscot County
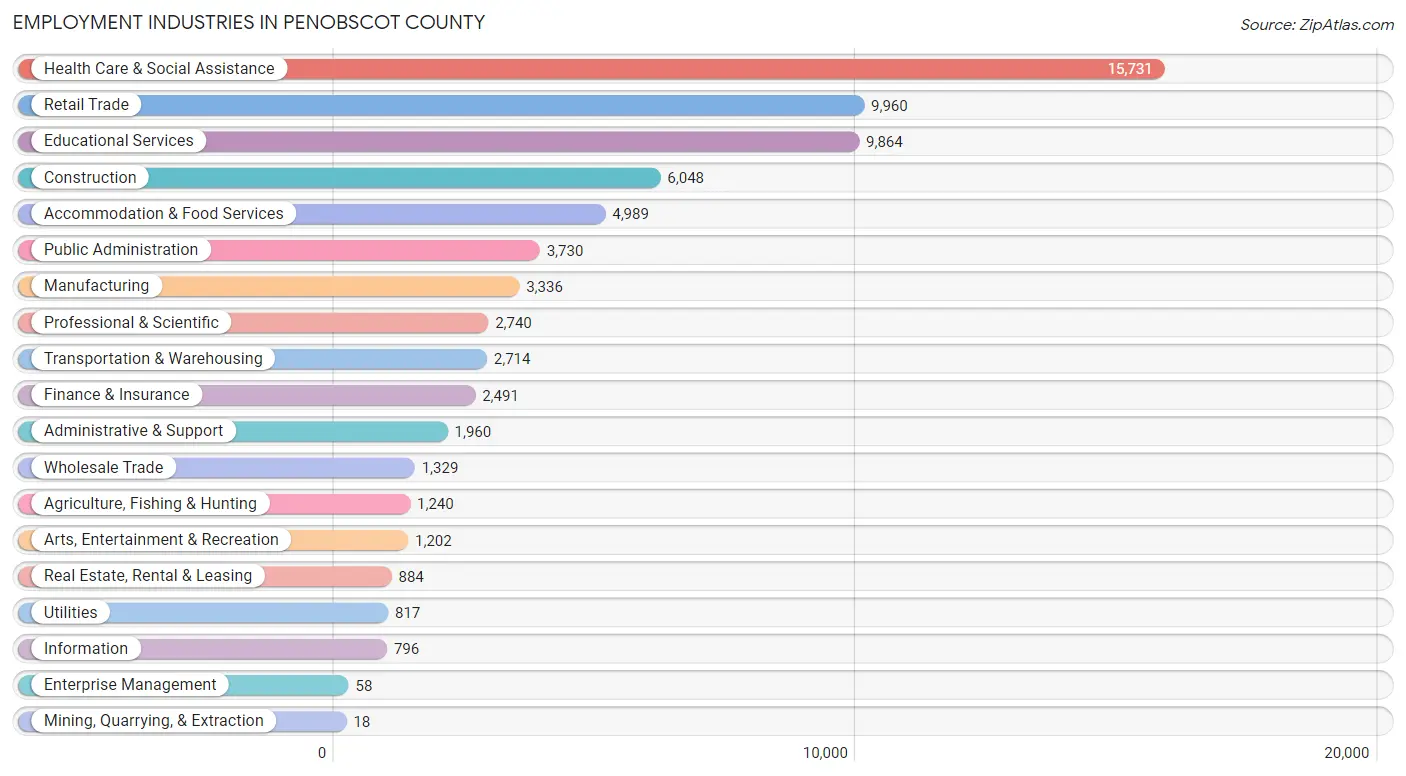
Employment Industries in Penobscot County
The major employment industries in Penobscot County include Health Care & Social Assistance (15,731 | 21.3%), Retail Trade (9,960 | 13.5%), Educational Services (9,864 | 13.4%), Construction (6,048 | 8.2%), and Accommodation & Food Services (4,989 | 6.8%).
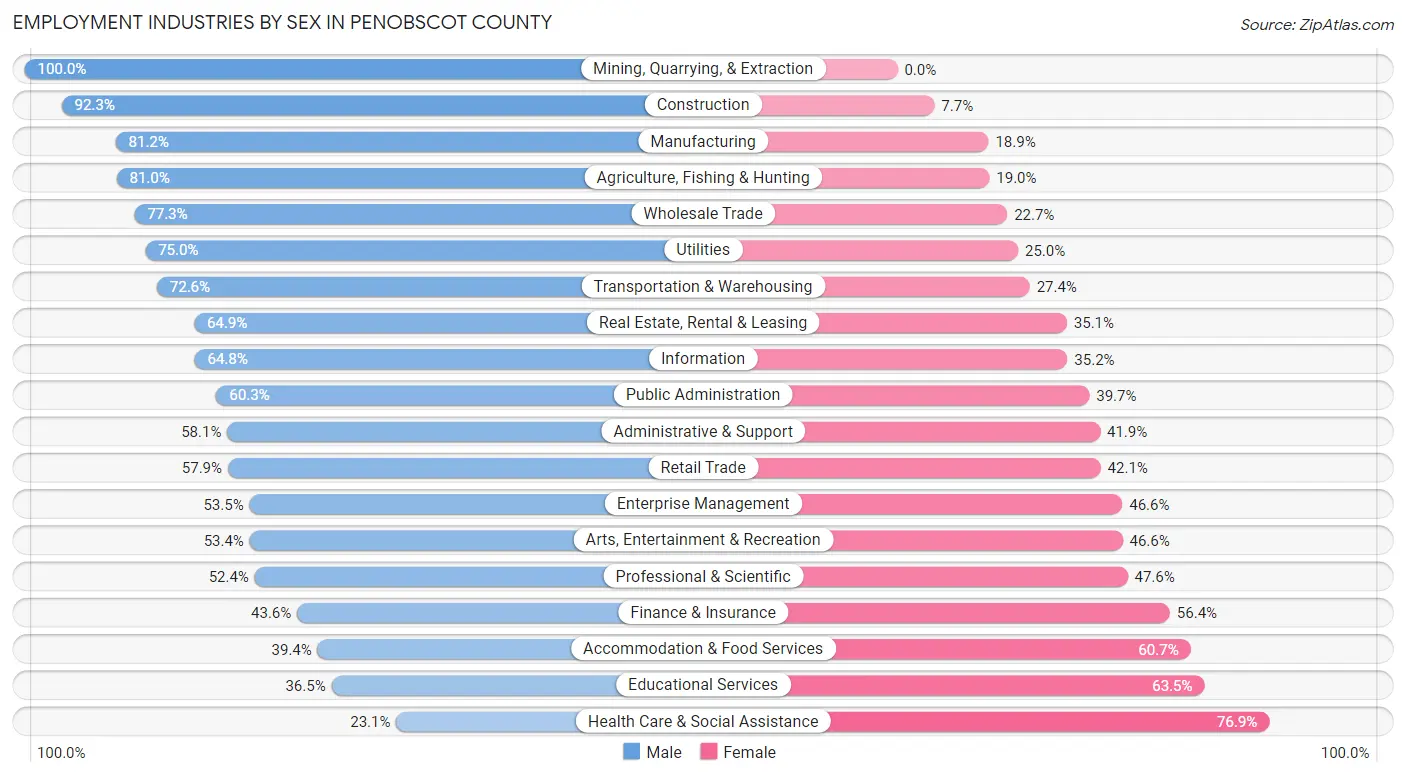
Employment Industries by Sex in Penobscot County
The Penobscot County industries that see more men than women are Mining, Quarrying, & Extraction (100.0%), Construction (92.3%), and Manufacturing (81.1%), whereas the industries that tend to have a higher number of women are Health Care & Social Assistance (76.9%), Educational Services (63.5%), and Accommodation & Food Services (60.7%).
| Industry | Male | Female |
| Agriculture, Fishing & Hunting | 1,004 (81.0%) | 236 (19.0%) |
| Mining, Quarrying, & Extraction | 18 (100.0%) | 0 (0.0%) |
| Construction | 5,585 (92.3%) | 463 (7.7%) |
| Manufacturing | 2,707 (81.1%) | 629 (18.9%) |
| Wholesale Trade | 1,027 (77.3%) | 302 (22.7%) |
| Retail Trade | 5,770 (57.9%) | 4,190 (42.1%) |
| Transportation & Warehousing | 1,971 (72.6%) | 743 (27.4%) |
| Utilities | 613 (75.0%) | 204 (25.0%) |
| Information | 516 (64.8%) | 280 (35.2%) |
| Finance & Insurance | 1,086 (43.6%) | 1,405 (56.4%) |
| Real Estate, Rental & Leasing | 574 (64.9%) | 310 (35.1%) |
| Professional & Scientific | 1,435 (52.4%) | 1,305 (47.6%) |
| Enterprise Management | 31 (53.4%) | 27 (46.6%) |
| Administrative & Support | 1,138 (58.1%) | 822 (41.9%) |
| Educational Services | 3,598 (36.5%) | 6,266 (63.5%) |
| Health Care & Social Assistance | 3,628 (23.1%) | 12,103 (76.9%) |
| Arts, Entertainment & Recreation | 642 (53.4%) | 560 (46.6%) |
| Accommodation & Food Services | 1,963 (39.4%) | 3,026 (60.7%) |
| Public Administration | 2,249 (60.3%) | 1,481 (39.7%) |
| Total | 37,496 (50.7%) | 36,416 (49.3%) |
Education in Penobscot County
School Enrollment in Penobscot County
The most common levels of schooling among the 35,405 students in Penobscot County are college / undergraduate (11,381 | 32.2%), high school (6,307 | 17.8%), and elementary school (6,186 | 17.5%).
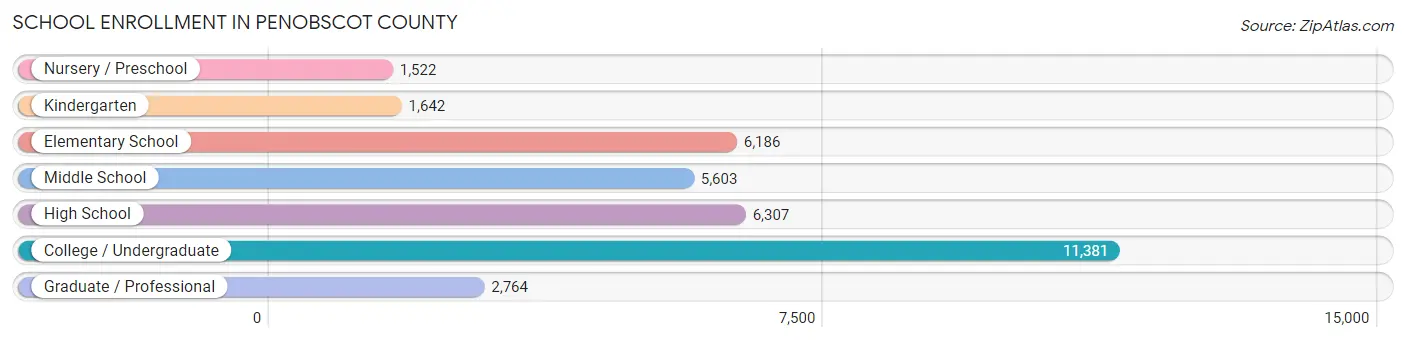
| School Level | # Students | % Students |
| Nursery / Preschool | 1,522 | 4.3% |
| Kindergarten | 1,642 | 4.6% |
| Elementary School | 6,186 | 17.5% |
| Middle School | 5,603 | 15.8% |
| High School | 6,307 | 17.8% |
| College / Undergraduate | 11,381 | 32.2% |
| Graduate / Professional | 2,764 | 7.8% |
| Total | 35,405 | 100.0% |
School Enrollment by Age by Funding Source in Penobscot County
Out of a total of 35,405 students who are enrolled in schools in Penobscot County, 6,302 (17.8%) attend a private institution, while the remaining 29,103 (82.2%) are enrolled in public schools. The age group of 3 to 4 year olds has the highest likelihood of being enrolled in private schools, with 395 (43.1% in the age bracket) enrolled. Conversely, the age group of 10 to 14 year olds has the lowest likelihood of being enrolled in a private school, with 6,437 (90.0% in the age bracket) attending a public institution.
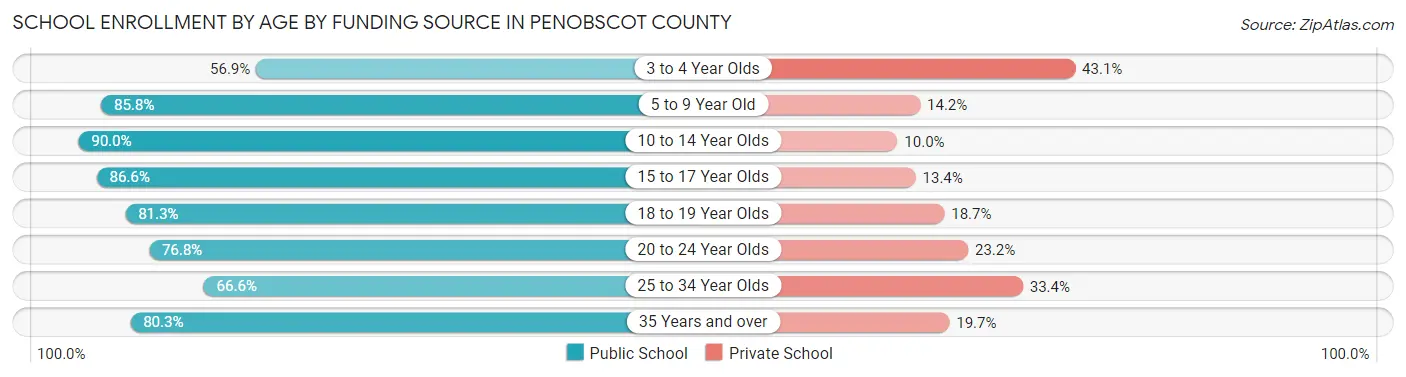
| Age Bracket | Public School | Private School |
| 3 to 4 Year Olds | 521 (56.9%) | 395 (43.1%) |
| 5 to 9 Year Old | 6,563 (85.8%) | 1,090 (14.2%) |
| 10 to 14 Year Olds | 6,437 (90.0%) | 716 (10.0%) |
| 15 to 17 Year Olds | 4,209 (86.6%) | 651 (13.4%) |
| 18 to 19 Year Olds | 3,396 (81.3%) | 783 (18.7%) |
| 20 to 24 Year Olds | 4,536 (76.8%) | 1,368 (23.2%) |
| 25 to 34 Year Olds | 1,818 (66.6%) | 910 (33.4%) |
| 35 Years and over | 1,616 (80.3%) | 396 (19.7%) |
| Total | 29,103 (82.2%) | 6,302 (17.8%) |
Educational Attainment by Field of Study in Penobscot County
Education (5,246 | 14.5%), science & technology (5,227 | 14.4%), business (4,524 | 12.5%), arts & humanities (3,404 | 9.4%), and bio, nature & agricultural (3,367 | 9.3%) are the most common fields of study among 36,284 individuals in Penobscot County who have obtained a bachelor's degree or higher.
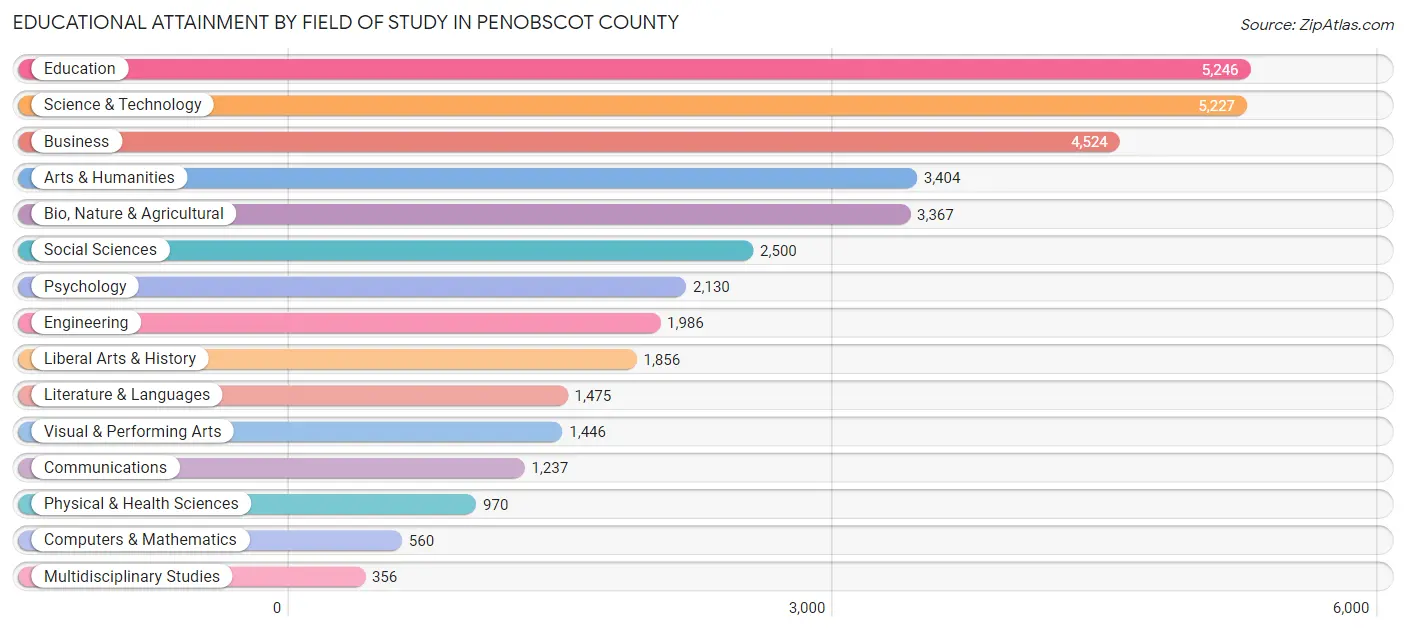
| Field of Study | # Graduates | % Graduates |
| Computers & Mathematics | 560 | 1.5% |
| Bio, Nature & Agricultural | 3,367 | 9.3% |
| Physical & Health Sciences | 970 | 2.7% |
| Psychology | 2,130 | 5.9% |
| Social Sciences | 2,500 | 6.9% |
| Engineering | 1,986 | 5.5% |
| Multidisciplinary Studies | 356 | 1.0% |
| Science & Technology | 5,227 | 14.4% |
| Business | 4,524 | 12.5% |
| Education | 5,246 | 14.5% |
| Literature & Languages | 1,475 | 4.1% |
| Liberal Arts & History | 1,856 | 5.1% |
| Visual & Performing Arts | 1,446 | 4.0% |
| Communications | 1,237 | 3.4% |
| Arts & Humanities | 3,404 | 9.4% |
| Total | 36,284 | 100.0% |
Transportation & Commute in Penobscot County
Vehicle Availability by Sex in Penobscot County
The most prevalent vehicle ownership categories in Penobscot County are males with 2 vehicles (16,499, accounting for 45.8%) and females with 2 vehicles (14,642, making up 47.9%).
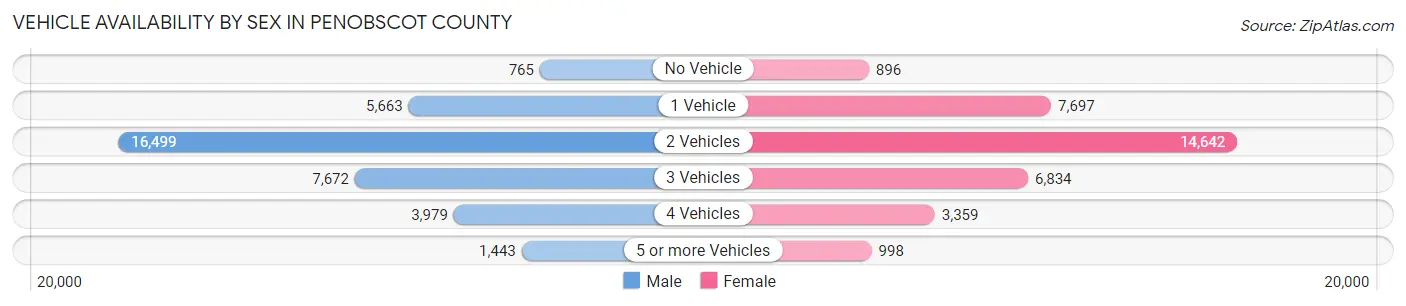
| Vehicles Available | Male | Female |
| No Vehicle | 765 (2.1%) | 896 (2.6%) |
| 1 Vehicle | 5,663 (15.7%) | 7,697 (22.4%) |
| 2 Vehicles | 16,499 (45.8%) | 14,642 (42.5%) |
| 3 Vehicles | 7,672 (21.3%) | 6,834 (19.9%) |
| 4 Vehicles | 3,979 (11.1%) | 3,359 (9.8%) |
| 5 or more Vehicles | 1,443 (4.0%) | 998 (2.9%) |
| Total | 36,021 (100.0%) | 34,426 (100.0%) |
Commute Time in Penobscot County
The most frequently occuring commute durations in Penobscot County are 15 to 19 minutes (11,904 commuters, 18.2%), 10 to 14 minutes (11,240 commuters, 17.2%), and 20 to 24 minutes (9,280 commuters, 14.2%).
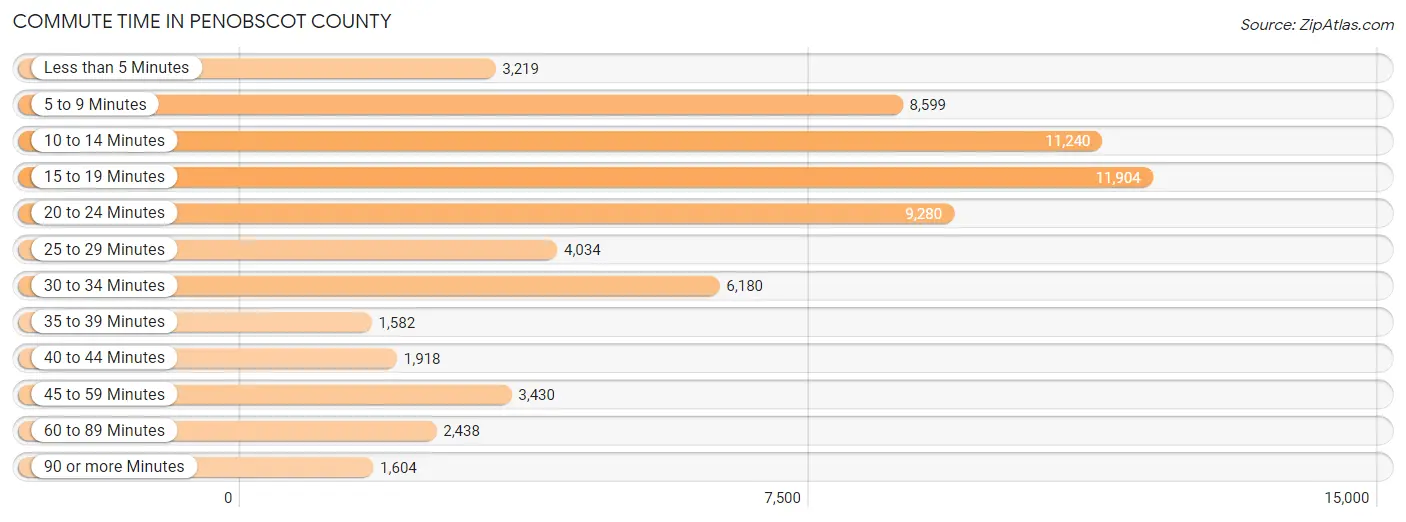
| Commute Time | # Commuters | % Commuters |
| Less than 5 Minutes | 3,219 | 4.9% |
| 5 to 9 Minutes | 8,599 | 13.1% |
| 10 to 14 Minutes | 11,240 | 17.2% |
| 15 to 19 Minutes | 11,904 | 18.2% |
| 20 to 24 Minutes | 9,280 | 14.2% |
| 25 to 29 Minutes | 4,034 | 6.2% |
| 30 to 34 Minutes | 6,180 | 9.5% |
| 35 to 39 Minutes | 1,582 | 2.4% |
| 40 to 44 Minutes | 1,918 | 2.9% |
| 45 to 59 Minutes | 3,430 | 5.2% |
| 60 to 89 Minutes | 2,438 | 3.7% |
| 90 or more Minutes | 1,604 | 2.5% |
Commute Time by Sex in Penobscot County
The most common commute times in Penobscot County are 15 to 19 minutes (6,913 commuters, 20.5%) for males and 10 to 14 minutes (5,979 commuters, 18.9%) for females.
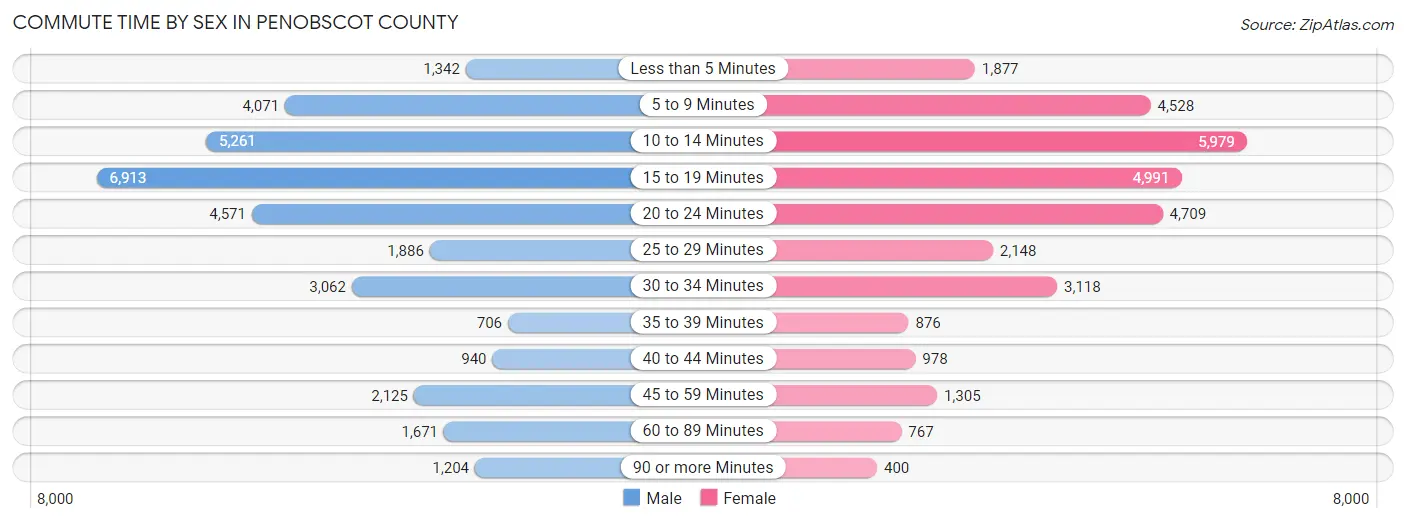
| Commute Time | Male | Female |
| Less than 5 Minutes | 1,342 (4.0%) | 1,877 (5.9%) |
| 5 to 9 Minutes | 4,071 (12.1%) | 4,528 (14.3%) |
| 10 to 14 Minutes | 5,261 (15.6%) | 5,979 (18.9%) |
| 15 to 19 Minutes | 6,913 (20.5%) | 4,991 (15.8%) |
| 20 to 24 Minutes | 4,571 (13.5%) | 4,709 (14.9%) |
| 25 to 29 Minutes | 1,886 (5.6%) | 2,148 (6.8%) |
| 30 to 34 Minutes | 3,062 (9.1%) | 3,118 (9.8%) |
| 35 to 39 Minutes | 706 (2.1%) | 876 (2.8%) |
| 40 to 44 Minutes | 940 (2.8%) | 978 (3.1%) |
| 45 to 59 Minutes | 2,125 (6.3%) | 1,305 (4.1%) |
| 60 to 89 Minutes | 1,671 (5.0%) | 767 (2.4%) |
| 90 or more Minutes | 1,204 (3.6%) | 400 (1.3%) |
Time of Departure to Work by Sex in Penobscot County
The most frequent times of departure to work in Penobscot County are 7:00 AM to 7:29 AM (4,914, 14.6%) for males and 7:00 AM to 7:29 AM (6,241, 19.7%) for females.
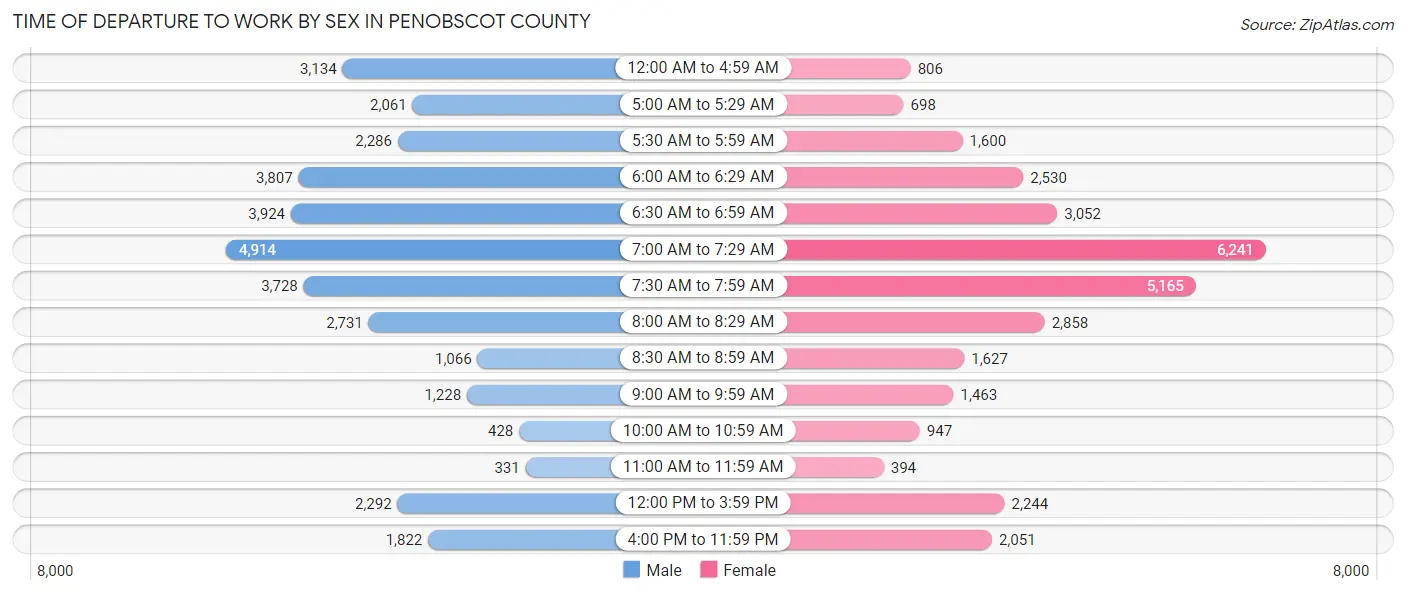
| Time of Departure | Male | Female |
| 12:00 AM to 4:59 AM | 3,134 (9.3%) | 806 (2.5%) |
| 5:00 AM to 5:29 AM | 2,061 (6.1%) | 698 (2.2%) |
| 5:30 AM to 5:59 AM | 2,286 (6.8%) | 1,600 (5.1%) |
| 6:00 AM to 6:29 AM | 3,807 (11.3%) | 2,530 (8.0%) |
| 6:30 AM to 6:59 AM | 3,924 (11.6%) | 3,052 (9.6%) |
| 7:00 AM to 7:29 AM | 4,914 (14.6%) | 6,241 (19.7%) |
| 7:30 AM to 7:59 AM | 3,728 (11.1%) | 5,165 (16.3%) |
| 8:00 AM to 8:29 AM | 2,731 (8.1%) | 2,858 (9.0%) |
| 8:30 AM to 8:59 AM | 1,066 (3.2%) | 1,627 (5.1%) |
| 9:00 AM to 9:59 AM | 1,228 (3.6%) | 1,463 (4.6%) |
| 10:00 AM to 10:59 AM | 428 (1.3%) | 947 (3.0%) |
| 11:00 AM to 11:59 AM | 331 (1.0%) | 394 (1.2%) |
| 12:00 PM to 3:59 PM | 2,292 (6.8%) | 2,244 (7.1%) |
| 4:00 PM to 11:59 PM | 1,822 (5.4%) | 2,051 (6.5%) |
| Total | 33,752 (100.0%) | 31,676 (100.0%) |
Housing Occupancy in Penobscot County
Occupancy by Ownership in Penobscot County
Of the total 63,687 dwellings in Penobscot County, owner-occupied units account for 44,498 (69.9%), while renter-occupied units make up 19,189 (30.1%).
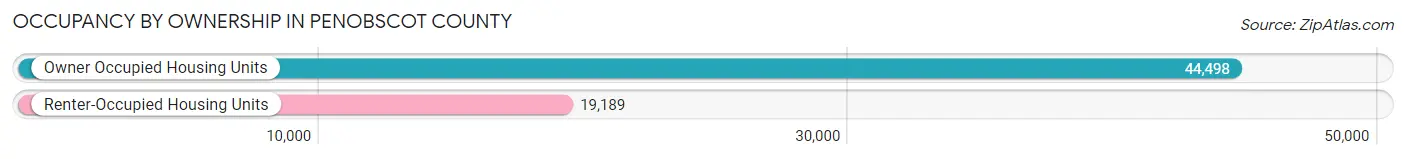
| Occupancy | # Housing Units | % Housing Units |
| Owner Occupied Housing Units | 44,498 | 69.9% |
| Renter-Occupied Housing Units | 19,189 | 30.1% |
| Total Occupied Housing Units | 63,687 | 100.0% |
Occupancy by Household Size in Penobscot County
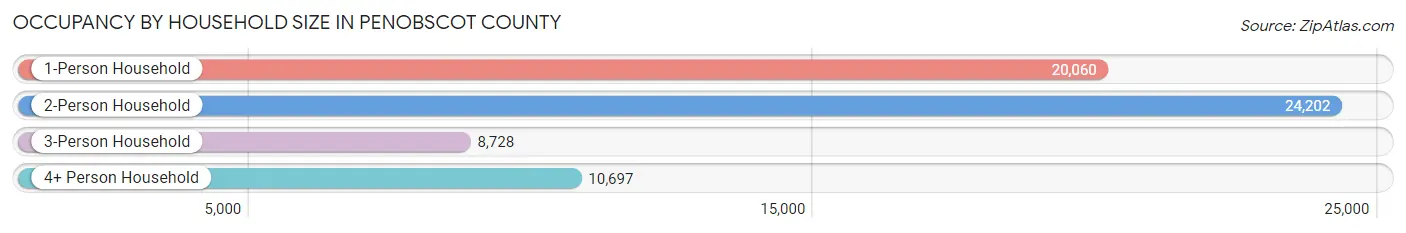
| Household Size | # Housing Units | % Housing Units |
| 1-Person Household | 20,060 | 31.5% |
| 2-Person Household | 24,202 | 38.0% |
| 3-Person Household | 8,728 | 13.7% |
| 4+ Person Household | 10,697 | 16.8% |
| Total Housing Units | 63,687 | 100.0% |
Occupancy by Ownership by Household Size in Penobscot County
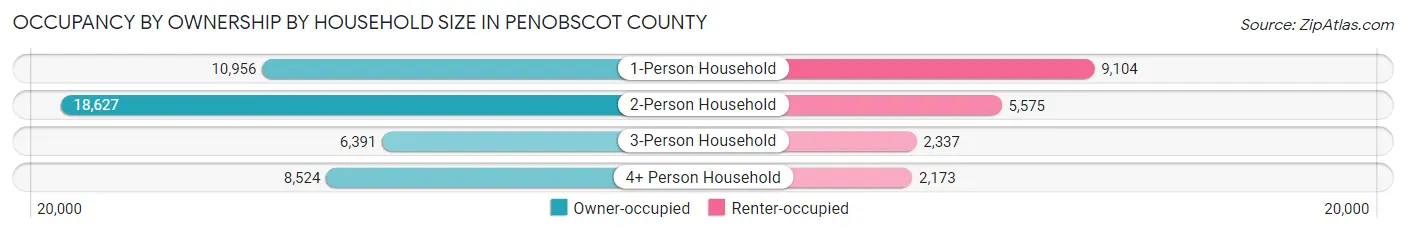
| Household Size | Owner-occupied | Renter-occupied |
| 1-Person Household | 10,956 (54.6%) | 9,104 (45.4%) |
| 2-Person Household | 18,627 (77.0%) | 5,575 (23.0%) |
| 3-Person Household | 6,391 (73.2%) | 2,337 (26.8%) |
| 4+ Person Household | 8,524 (79.7%) | 2,173 (20.3%) |
| Total Housing Units | 44,498 (69.9%) | 19,189 (30.1%) |
Occupancy by Educational Attainment in Penobscot County
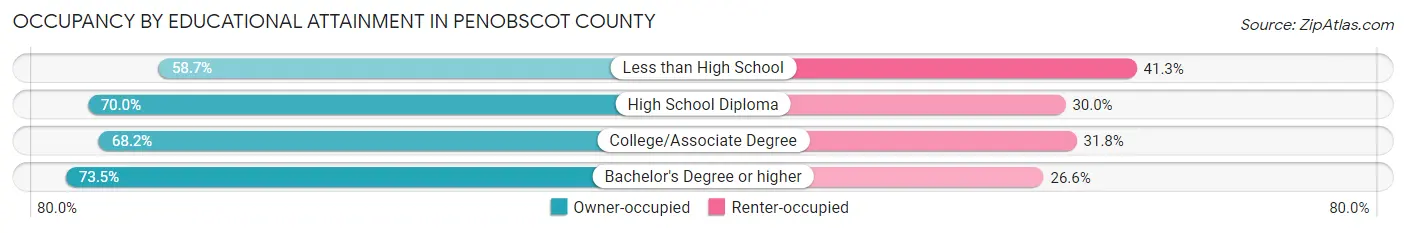
| Household Size | Owner-occupied | Renter-occupied |
| Less than High School | 2,049 (58.7%) | 1,442 (41.3%) |
| High School Diploma | 13,154 (70.0%) | 5,643 (30.0%) |
| College/Associate Degree | 14,486 (68.2%) | 6,752 (31.8%) |
| Bachelor's Degree or higher | 14,809 (73.5%) | 5,352 (26.6%) |
Occupancy by Age of Householder in Penobscot County
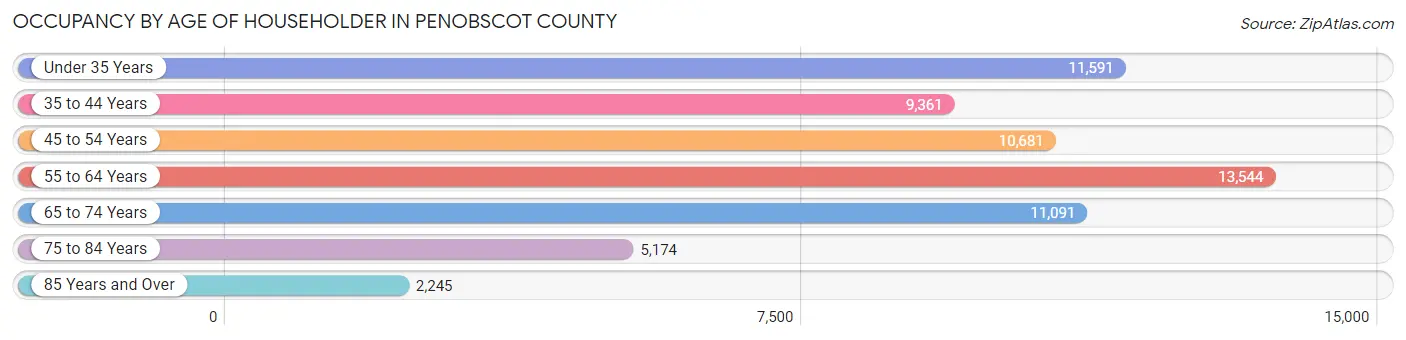
| Age Bracket | # Households | % Households |
| Under 35 Years | 11,591 | 18.2% |
| 35 to 44 Years | 9,361 | 14.7% |
| 45 to 54 Years | 10,681 | 16.8% |
| 55 to 64 Years | 13,544 | 21.3% |
| 65 to 74 Years | 11,091 | 17.4% |
| 75 to 84 Years | 5,174 | 8.1% |
| 85 Years and Over | 2,245 | 3.5% |
| Total | 63,687 | 100.0% |
Housing Finances in Penobscot County
Median Income by Occupancy in Penobscot County
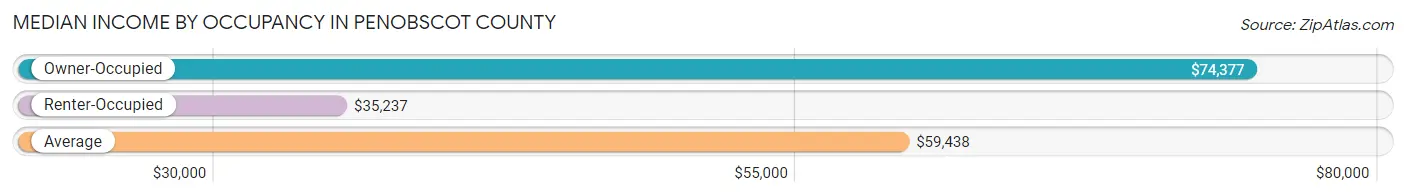
| Occupancy Type | # Households | Median Income |
| Owner-Occupied | 44,498 (69.9%) | $74,377 |
| Renter-Occupied | 19,189 (30.1%) | $35,237 |
| Average | 63,687 (100.0%) | $59,438 |
Occupancy by Householder Income Bracket in Penobscot County
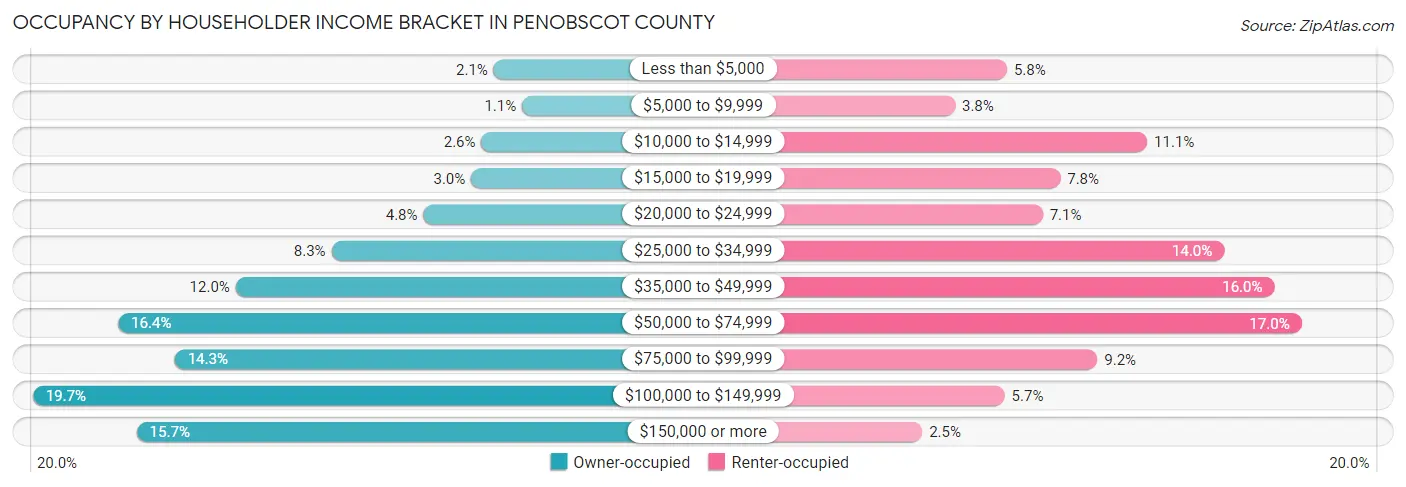
| Income Bracket | Owner-occupied | Renter-occupied |
| Less than $5,000 | 947 (2.1%) | 1,107 (5.8%) |
| $5,000 to $9,999 | 467 (1.1%) | 727 (3.8%) |
| $10,000 to $14,999 | 1,157 (2.6%) | 2,131 (11.1%) |
| $15,000 to $19,999 | 1,332 (3.0%) | 1,496 (7.8%) |
| $20,000 to $24,999 | 2,141 (4.8%) | 1,369 (7.1%) |
| $25,000 to $34,999 | 3,700 (8.3%) | 2,695 (14.0%) |
| $35,000 to $49,999 | 5,321 (12.0%) | 3,060 (16.0%) |
| $50,000 to $74,999 | 7,317 (16.4%) | 3,260 (17.0%) |
| $75,000 to $99,999 | 6,355 (14.3%) | 1,768 (9.2%) |
| $100,000 to $149,999 | 8,761 (19.7%) | 1,089 (5.7%) |
| $150,000 or more | 7,000 (15.7%) | 487 (2.5%) |
| Total | 44,498 (100.0%) | 19,189 (100.0%) |
Monthly Housing Cost Tiers in Penobscot County
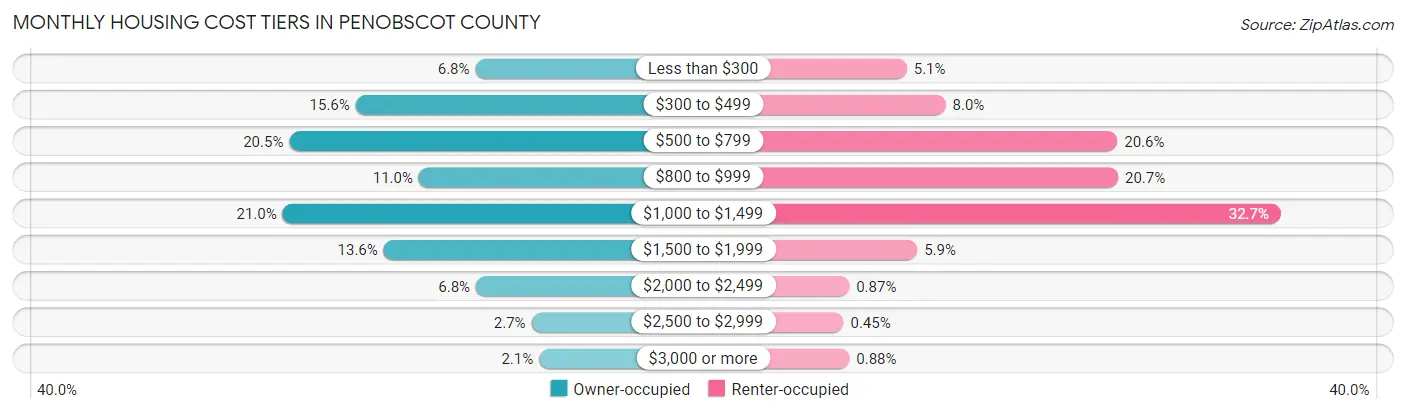
| Monthly Cost | Owner-occupied | Renter-occupied |
| Less than $300 | 3,027 (6.8%) | 981 (5.1%) |
| $300 to $499 | 6,951 (15.6%) | 1,530 (8.0%) |
| $500 to $799 | 9,127 (20.5%) | 3,954 (20.6%) |
| $800 to $999 | 4,881 (11.0%) | 3,966 (20.7%) |
| $1,000 to $1,499 | 9,343 (21.0%) | 6,266 (32.7%) |
| $1,500 to $1,999 | 6,033 (13.6%) | 1,128 (5.9%) |
| $2,000 to $2,499 | 3,009 (6.8%) | 166 (0.9%) |
| $2,500 to $2,999 | 1,188 (2.7%) | 87 (0.4%) |
| $3,000 or more | 939 (2.1%) | 169 (0.9%) |
| Total | 44,498 (100.0%) | 19,189 (100.0%) |
Physical Housing Characteristics in Penobscot County
Housing Structures in Penobscot County
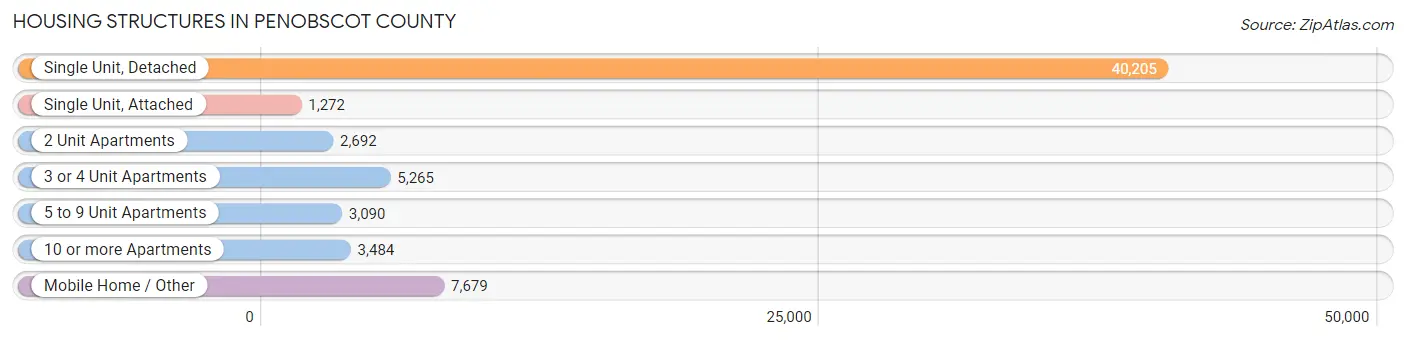
| Structure Type | # Housing Units | % Housing Units |
| Single Unit, Detached | 40,205 | 63.1% |
| Single Unit, Attached | 1,272 | 2.0% |
| 2 Unit Apartments | 2,692 | 4.2% |
| 3 or 4 Unit Apartments | 5,265 | 8.3% |
| 5 to 9 Unit Apartments | 3,090 | 4.9% |
| 10 or more Apartments | 3,484 | 5.5% |
| Mobile Home / Other | 7,679 | 12.1% |
| Total | 63,687 | 100.0% |
Housing Structures by Occupancy in Penobscot County
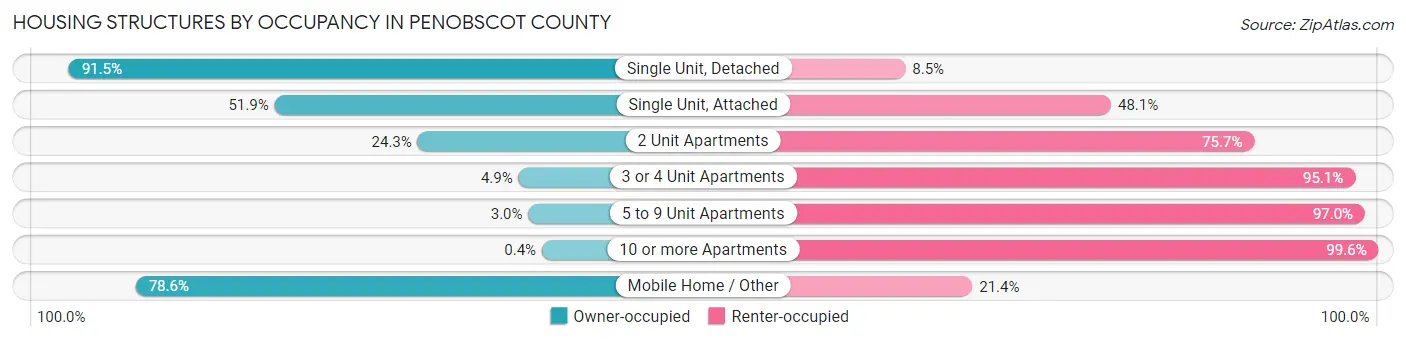
| Structure Type | Owner-occupied | Renter-occupied |
| Single Unit, Detached | 36,782 (91.5%) | 3,423 (8.5%) |
| Single Unit, Attached | 660 (51.9%) | 612 (48.1%) |
| 2 Unit Apartments | 655 (24.3%) | 2,037 (75.7%) |
| 3 or 4 Unit Apartments | 258 (4.9%) | 5,007 (95.1%) |
| 5 to 9 Unit Apartments | 93 (3.0%) | 2,997 (97.0%) |
| 10 or more Apartments | 14 (0.4%) | 3,470 (99.6%) |
| Mobile Home / Other | 6,036 (78.6%) | 1,643 (21.4%) |
| Total | 44,498 (69.9%) | 19,189 (30.1%) |
Housing Structures by Number of Rooms in Penobscot County
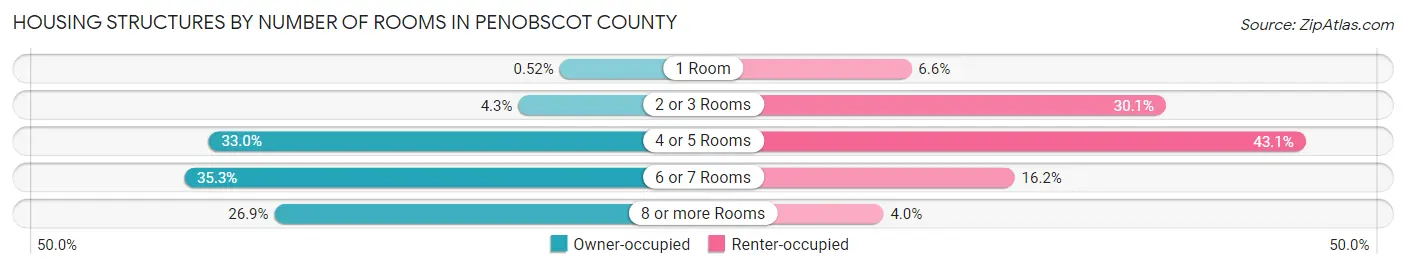
| Number of Rooms | Owner-occupied | Renter-occupied |
| 1 Room | 230 (0.5%) | 1,269 (6.6%) |
| 2 or 3 Rooms | 1,929 (4.3%) | 5,784 (30.1%) |
| 4 or 5 Rooms | 14,681 (33.0%) | 8,262 (43.1%) |
| 6 or 7 Rooms | 15,690 (35.3%) | 3,101 (16.2%) |
| 8 or more Rooms | 11,968 (26.9%) | 773 (4.0%) |
| Total | 44,498 (100.0%) | 19,189 (100.0%) |
Housing Structure by Heating Type in Penobscot County
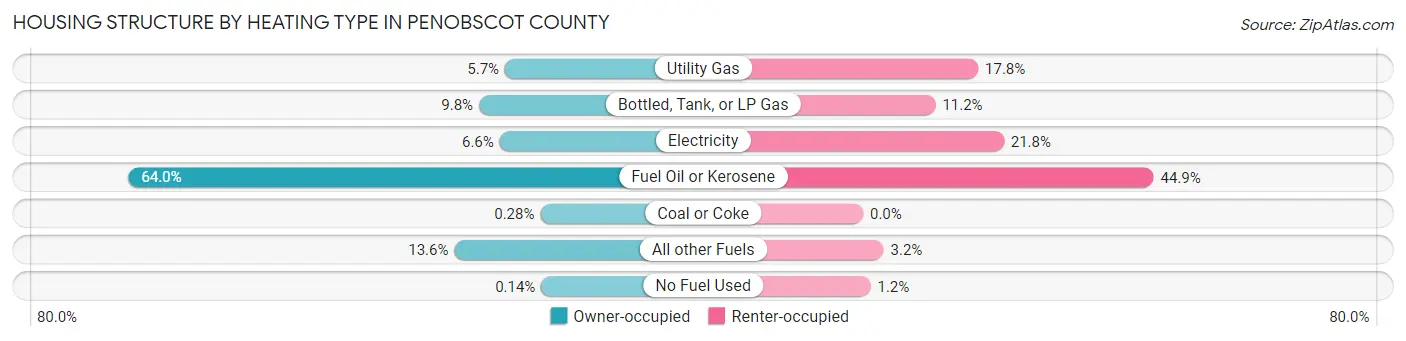
| Heating Type | Owner-occupied | Renter-occupied |
| Utility Gas | 2,552 (5.7%) | 3,414 (17.8%) |
| Bottled, Tank, or LP Gas | 4,342 (9.8%) | 2,148 (11.2%) |
| Electricity | 2,923 (6.6%) | 4,176 (21.8%) |
| Fuel Oil or Kerosene | 28,456 (63.9%) | 8,618 (44.9%) |
| Coal or Coke | 125 (0.3%) | 0 (0.0%) |
| All other Fuels | 6,037 (13.6%) | 611 (3.2%) |
| No Fuel Used | 63 (0.1%) | 222 (1.2%) |
| Total | 44,498 (100.0%) | 19,189 (100.0%) |
Household Vehicle Usage in Penobscot County
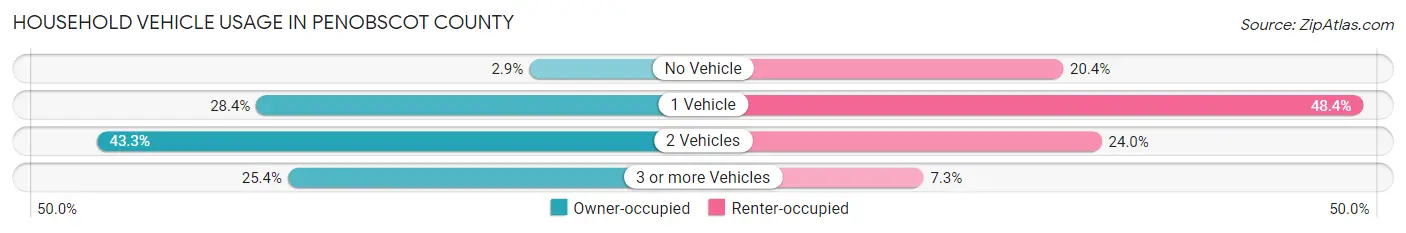
| Vehicles per Household | Owner-occupied | Renter-occupied |
| No Vehicle | 1,294 (2.9%) | 3,906 (20.4%) |
| 1 Vehicle | 12,627 (28.4%) | 9,280 (48.4%) |
| 2 Vehicles | 19,260 (43.3%) | 4,597 (24.0%) |
| 3 or more Vehicles | 11,317 (25.4%) | 1,406 (7.3%) |
| Total | 44,498 (100.0%) | 19,189 (100.0%) |
Real Estate & Mortgages in Penobscot County
Real Estate and Mortgage Overview in Penobscot County
| Characteristic | Without Mortgage | With Mortgage |
| Housing Units | 19,715 | 24,783 |
| Median Property Value | $146,000 | $195,500 |
| Median Household Income | $53,720 | $5,115 |
| Monthly Housing Costs | $510 | $934 |
| Real Estate Taxes | $1,883 | $305 |
Property Value by Mortgage Status in Penobscot County
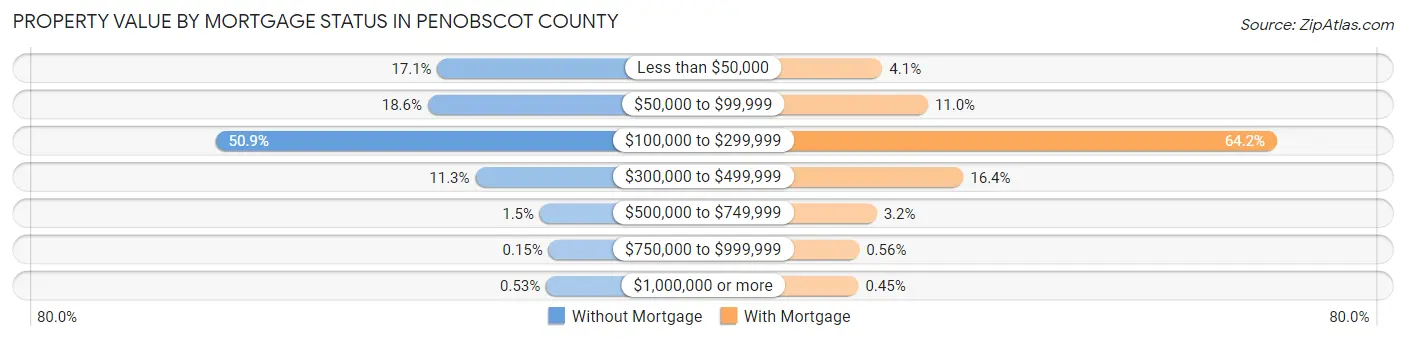
| Property Value | Without Mortgage | With Mortgage |
| Less than $50,000 | 3,370 (17.1%) | 1,013 (4.1%) |
| $50,000 to $99,999 | 3,659 (18.6%) | 2,734 (11.0%) |
| $100,000 to $299,999 | 10,032 (50.9%) | 15,913 (64.2%) |
| $300,000 to $499,999 | 2,230 (11.3%) | 4,071 (16.4%) |
| $500,000 to $749,999 | 291 (1.5%) | 801 (3.2%) |
| $750,000 to $999,999 | 29 (0.2%) | 140 (0.6%) |
| $1,000,000 or more | 104 (0.5%) | 111 (0.4%) |
| Total | 19,715 (100.0%) | 24,783 (100.0%) |
Household Income by Mortgage Status in Penobscot County
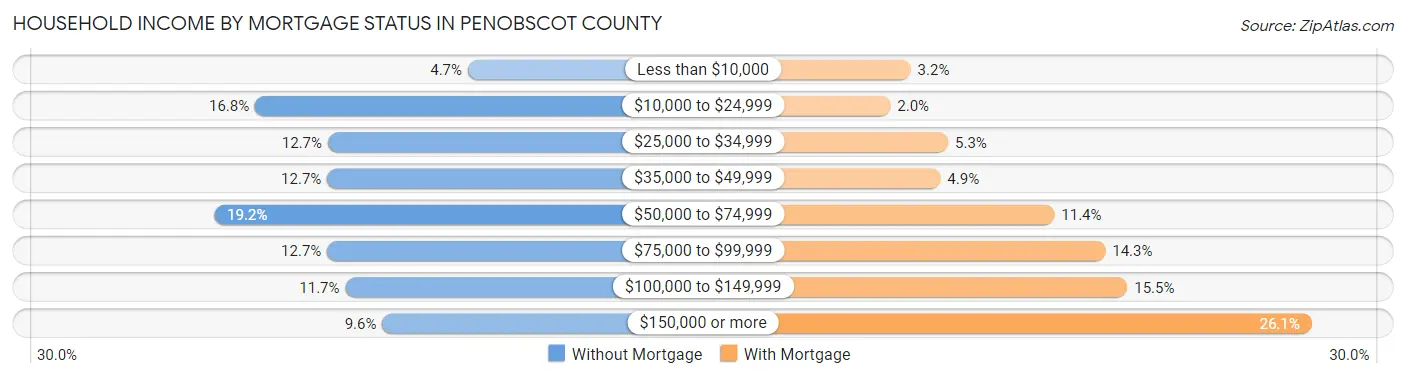
| Household Income | Without Mortgage | With Mortgage |
| Less than $10,000 | 921 (4.7%) | 780 (3.2%) |
| $10,000 to $24,999 | 3,319 (16.8%) | 493 (2.0%) |
| $25,000 to $34,999 | 2,498 (12.7%) | 1,311 (5.3%) |
| $35,000 to $49,999 | 2,505 (12.7%) | 1,202 (4.9%) |
| $50,000 to $74,999 | 3,780 (19.2%) | 2,816 (11.4%) |
| $75,000 to $99,999 | 2,506 (12.7%) | 3,537 (14.3%) |
| $100,000 to $149,999 | 2,301 (11.7%) | 3,849 (15.5%) |
| $150,000 or more | 1,885 (9.6%) | 6,460 (26.1%) |
| Total | 19,715 (100.0%) | 24,783 (100.0%) |
Property Value to Household Income Ratio in Penobscot County
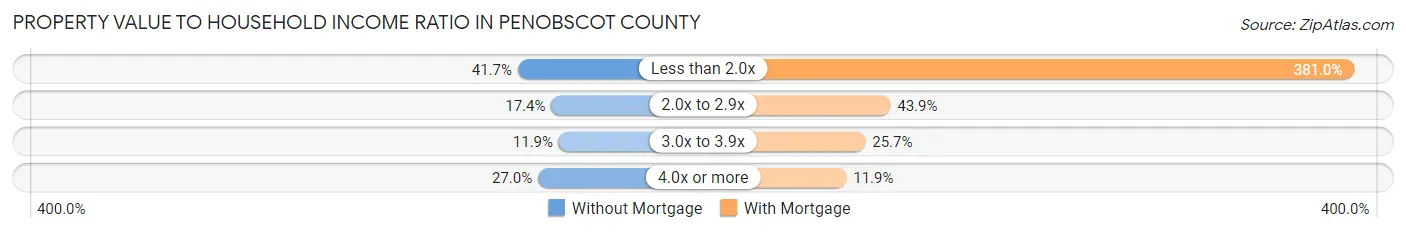
| Value-to-Income Ratio | Without Mortgage | With Mortgage |
| Less than 2.0x | 8,229 (41.7%) | 94,412 (380.9%) |
| 2.0x to 2.9x | 3,431 (17.4%) | 10,873 (43.9%) |
| 3.0x to 3.9x | 2,346 (11.9%) | 6,366 (25.7%) |
| 4.0x or more | 5,321 (27.0%) | 2,944 (11.9%) |
| Total | 19,715 (100.0%) | 24,783 (100.0%) |
Real Estate Taxes by Mortgage Status in Penobscot County

| Property Taxes | Without Mortgage | With Mortgage |
| Less than $800 | 3,766 (19.1%) | 128 (0.5%) |
| $800 to $1,499 | 3,783 (19.2%) | 1,518 (6.1%) |
| $800 to $1,499 | 11,108 (56.3%) | 3,753 (15.1%) |
| Total | 19,715 (100.0%) | 24,783 (100.0%) |
Health & Disability in Penobscot County
Health Insurance Coverage by Age in Penobscot County
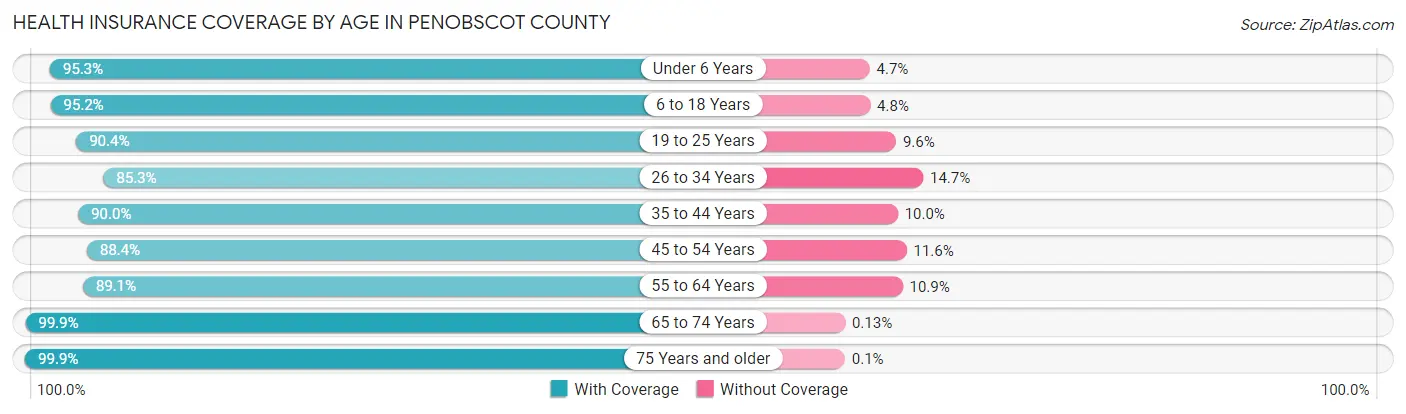
| Age Bracket | With Coverage | Without Coverage |
| Under 6 Years | 8,187 (95.3%) | 406 (4.7%) |
| 6 to 18 Years | 19,984 (95.2%) | 1,012 (4.8%) |
| 19 to 25 Years | 13,436 (90.4%) | 1,433 (9.6%) |
| 26 to 34 Years | 14,863 (85.3%) | 2,560 (14.7%) |
| 35 to 44 Years | 16,140 (90.0%) | 1,785 (10.0%) |
| 45 to 54 Years | 17,145 (88.4%) | 2,252 (11.6%) |
| 55 to 64 Years | 20,632 (89.1%) | 2,514 (10.9%) |
| 65 to 74 Years | 17,458 (99.9%) | 22 (0.1%) |
| 75 Years and older | 10,856 (99.9%) | 11 (0.1%) |
| Total | 138,701 (92.0%) | 11,995 (8.0%) |
Health Insurance Coverage by Citizenship Status in Penobscot County

| Citizenship Status | With Coverage | Without Coverage |
| Native Born | 8,187 (95.3%) | 406 (4.7%) |
| Foreign Born, Citizen | 19,984 (95.2%) | 1,012 (4.8%) |
| Foreign Born, not a Citizen | 13,436 (90.4%) | 1,433 (9.6%) |
Health Insurance Coverage by Household Income in Penobscot County
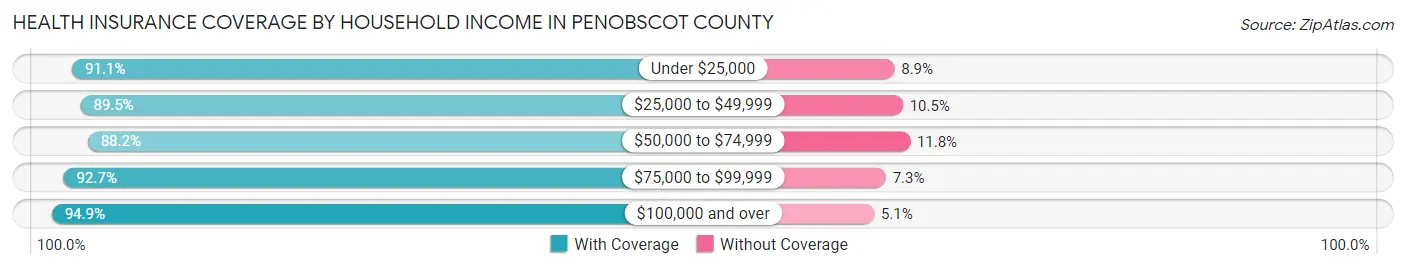
| Household Income | With Coverage | Without Coverage |
| Under $25,000 | 17,452 (91.1%) | 1,704 (8.9%) |
| $25,000 to $49,999 | 24,944 (89.5%) | 2,917 (10.5%) |
| $50,000 to $74,999 | 21,693 (88.2%) | 2,910 (11.8%) |
| $75,000 to $99,999 | 19,807 (92.7%) | 1,557 (7.3%) |
| $100,000 and over | 50,170 (94.9%) | 2,692 (5.1%) |
Public vs Private Health Insurance Coverage by Age in Penobscot County
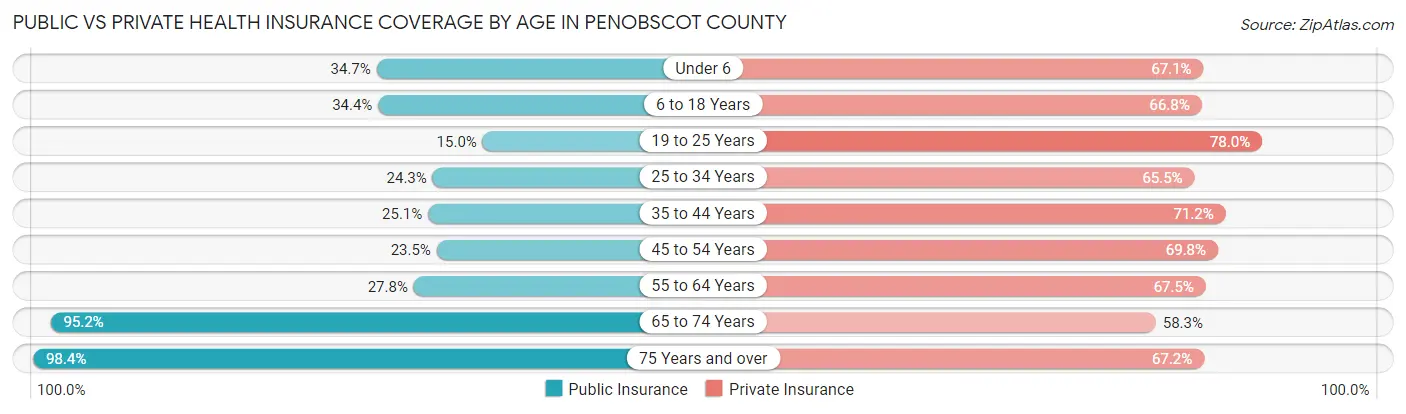
| Age Bracket | Public Insurance | Private Insurance |
| Under 6 | 2,979 (34.7%) | 5,768 (67.1%) |
| 6 to 18 Years | 7,217 (34.4%) | 14,020 (66.8%) |
| 19 to 25 Years | 2,227 (15.0%) | 11,597 (78.0%) |
| 25 to 34 Years | 4,228 (24.3%) | 11,403 (65.4%) |
| 35 to 44 Years | 4,499 (25.1%) | 12,769 (71.2%) |
| 45 to 54 Years | 4,560 (23.5%) | 13,539 (69.8%) |
| 55 to 64 Years | 6,427 (27.8%) | 15,632 (67.5%) |
| 65 to 74 Years | 16,641 (95.2%) | 10,189 (58.3%) |
| 75 Years and over | 10,697 (98.4%) | 7,307 (67.2%) |
| Total | 59,475 (39.5%) | 102,224 (67.8%) |
Disability Status by Sex by Age in Penobscot County
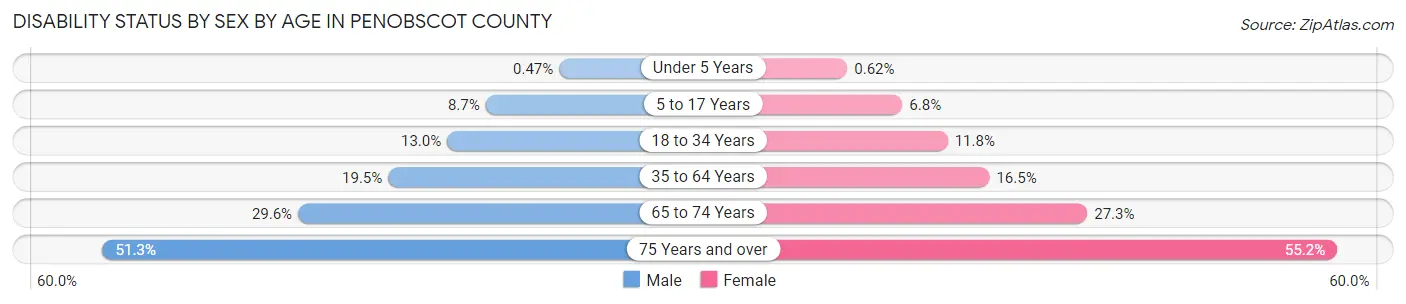
| Age Bracket | Male | Female |
| Under 5 Years | 16 (0.5%) | 21 (0.6%) |
| 5 to 17 Years | 909 (8.7%) | 663 (6.8%) |
| 18 to 34 Years | 2,342 (13.0%) | 1,966 (11.8%) |
| 35 to 64 Years | 5,818 (19.5%) | 5,045 (16.5%) |
| 65 to 74 Years | 2,492 (29.6%) | 2,474 (27.3%) |
| 75 Years and over | 2,422 (51.3%) | 3,390 (55.1%) |
Disability Class by Sex by Age in Penobscot County
Disability Class: Hearing Difficulty
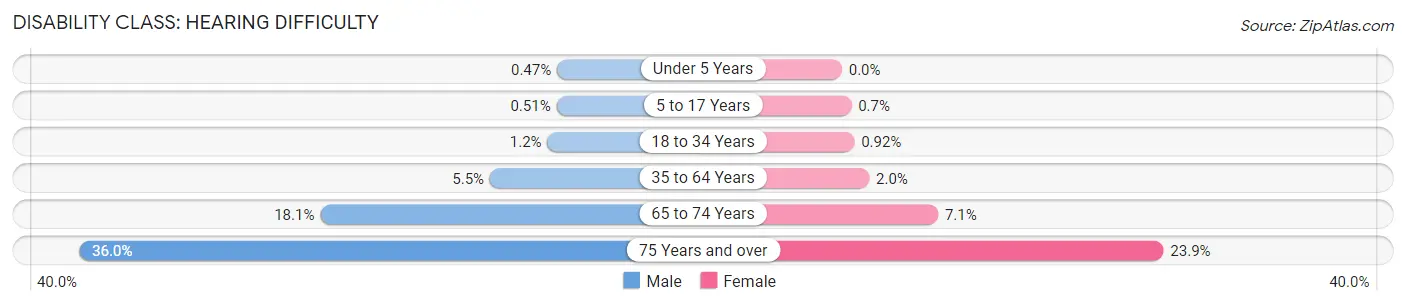
| Age Bracket | Male | Female |
| Under 5 Years | 16 (0.5%) | 0 (0.0%) |
| 5 to 17 Years | 54 (0.5%) | 69 (0.7%) |
| 18 to 34 Years | 214 (1.2%) | 153 (0.9%) |
| 35 to 64 Years | 1,624 (5.4%) | 622 (2.0%) |
| 65 to 74 Years | 1,522 (18.0%) | 646 (7.1%) |
| 75 Years and over | 1,697 (35.9%) | 1,468 (23.9%) |
Disability Class: Vision Difficulty
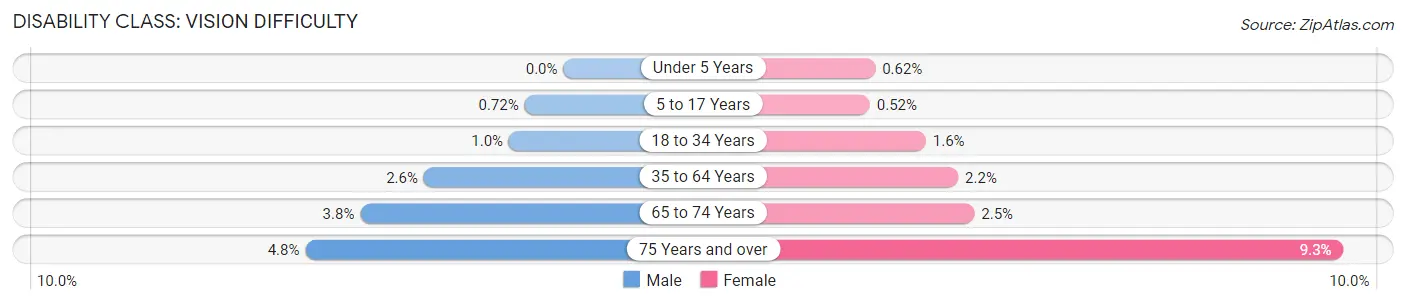
| Age Bracket | Male | Female |
| Under 5 Years | 0 (0.0%) | 21 (0.6%) |
| 5 to 17 Years | 76 (0.7%) | 51 (0.5%) |
| 18 to 34 Years | 183 (1.0%) | 260 (1.6%) |
| 35 to 64 Years | 773 (2.6%) | 662 (2.2%) |
| 65 to 74 Years | 318 (3.8%) | 223 (2.5%) |
| 75 Years and over | 226 (4.8%) | 572 (9.3%) |
Disability Class: Cognitive Difficulty
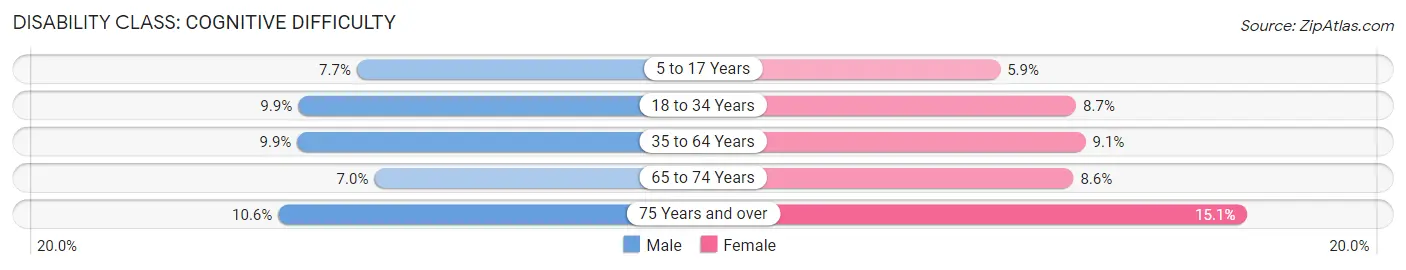
| Age Bracket | Male | Female |
| 5 to 17 Years | 805 (7.7%) | 577 (5.9%) |
| 18 to 34 Years | 1,782 (9.9%) | 1,450 (8.7%) |
| 35 to 64 Years | 2,944 (9.9%) | 2,774 (9.0%) |
| 65 to 74 Years | 592 (7.0%) | 778 (8.6%) |
| 75 Years and over | 500 (10.6%) | 925 (15.0%) |
Disability Class: Ambulatory Difficulty
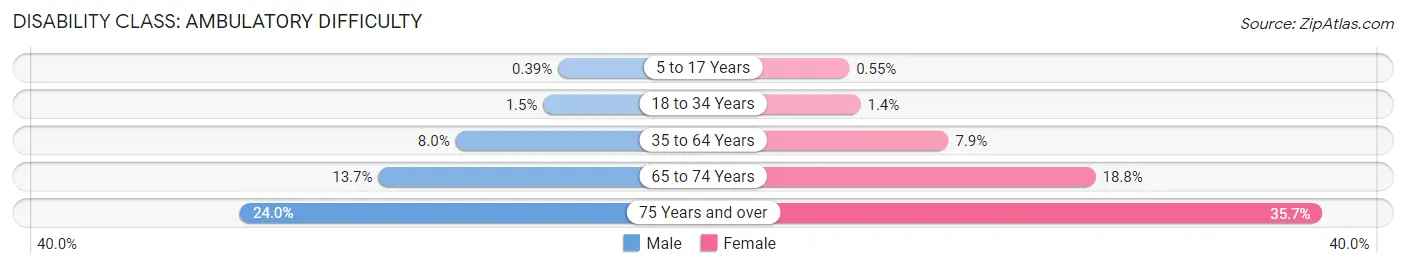
| Age Bracket | Male | Female |
| 5 to 17 Years | 41 (0.4%) | 54 (0.5%) |
| 18 to 34 Years | 270 (1.5%) | 232 (1.4%) |
| 35 to 64 Years | 2,388 (8.0%) | 2,429 (7.9%) |
| 65 to 74 Years | 1,158 (13.7%) | 1,705 (18.8%) |
| 75 Years and over | 1,133 (24.0%) | 2,193 (35.7%) |
Disability Class: Self-Care Difficulty

| Age Bracket | Male | Female |
| 5 to 17 Years | 148 (1.4%) | 132 (1.3%) |
| 18 to 34 Years | 164 (0.9%) | 232 (1.4%) |
| 35 to 64 Years | 907 (3.0%) | 749 (2.4%) |
| 65 to 74 Years | 418 (5.0%) | 398 (4.4%) |
| 75 Years and over | 332 (7.0%) | 856 (13.9%) |
Technology Access in Penobscot County
Computing Device Access in Penobscot County
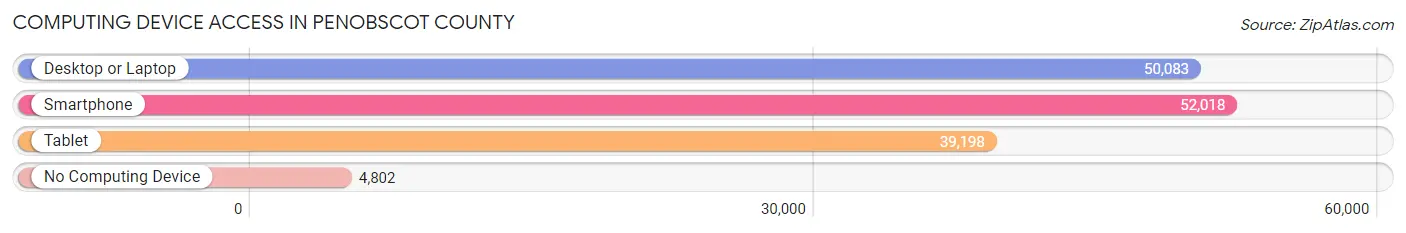
| Device Type | # Households | % Households |
| Desktop or Laptop | 50,083 | 78.6% |
| Smartphone | 52,018 | 81.7% |
| Tablet | 39,198 | 61.6% |
| No Computing Device | 4,802 | 7.5% |
| Total | 63,687 | 100.0% |
Internet Access in Penobscot County
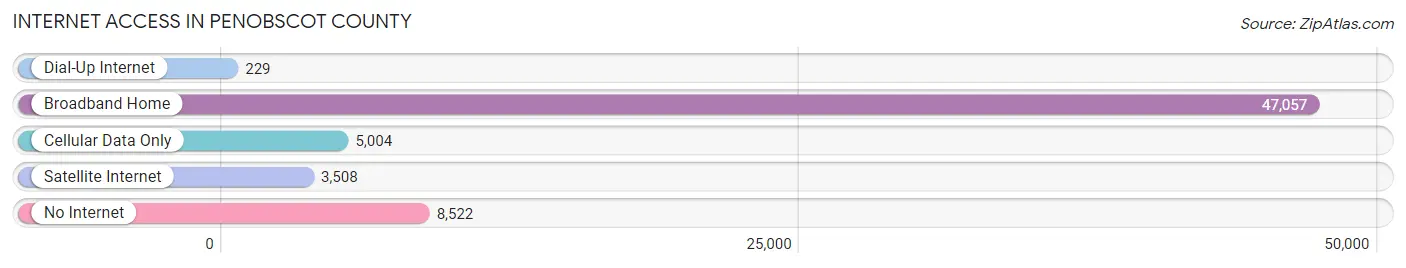
| Internet Type | # Households | % Households |
| Dial-Up Internet | 229 | 0.4% |
| Broadband Home | 47,057 | 73.9% |
| Cellular Data Only | 5,004 | 7.9% |
| Satellite Internet | 3,508 | 5.5% |
| No Internet | 8,522 | 13.4% |
| Total | 63,687 | 100.0% |
Penobscot County Summary
Introduction
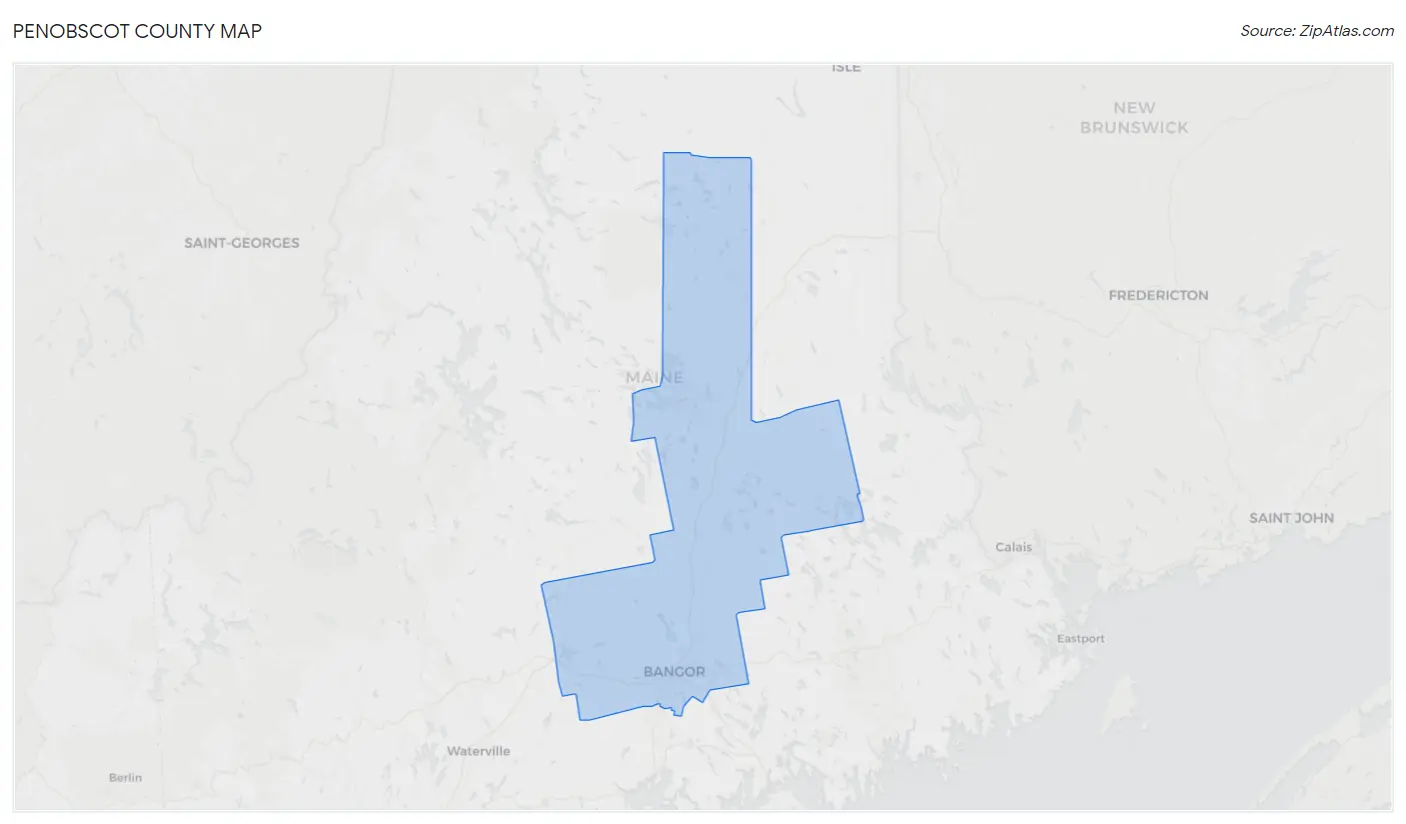
Penobscot County is located in the state of Maine, in the United States of America. It is the largest county in the state, covering an area of 3,717 square miles. The county is bordered by Aroostook County to the north, Hancock County to the east, Waldo County to the south, and Somerset County to the west. The county seat is Bangor, which is also the largest city in the county. The county is home to a population of 153,923 people, as of the 2020 census.
History
Penobscot County was established in 1816, when it was separated from Hancock County. The county was named after the Penobscot River, which runs through the county. The river was named by the Abenaki people, who lived in the area before European settlers arrived. The county was originally part of the District of Maine, which was part of Massachusetts until 1820, when Maine became a state.
The county was home to a variety of Native American tribes, including the Abenaki, Passamaquoddy, and Penobscot. The first European settlers arrived in the area in the late 1600s, and the county was officially established in 1816.
The county was an important center of the lumber industry in the 19th century, and Bangor became a major port for the export of lumber. The county was also home to several paper mills, which were important to the local economy.
Geography
Penobscot County is located in the northeastern part of the state of Maine. It is bordered by Aroostook County to the north, Hancock County to the east, Waldo County to the south, and Somerset County to the west. The county covers an area of 3,717 square miles, making it the largest county in the state.
The county is home to a variety of landscapes, including mountains, forests, rivers, and lakes. The highest point in the county is Mount Katahdin, which is located in Baxter State Park. The county is also home to the Penobscot River, which runs through the county and is the longest river in the state.
Economy
The economy of Penobscot County is largely based on the service industry, with healthcare, education, and retail being the largest sectors. The county is also home to several manufacturing companies, including paper mills, lumber mills, and food processing plants.
The county is home to several major employers, including Eastern Maine Medical Center, Bangor International Airport, and the University of Maine. The county is also home to several tourist attractions, including Baxter State Park, the Bangor Waterfront, and the Penobscot Narrows Bridge.
Demographics
As of the 2020 census, Penobscot County had a population of 153,923 people. The population is spread out across the county, with the largest city being Bangor, which has a population of 33,039. The county is home to a variety of ethnic and racial groups, including White (90.2%), Black or African American (3.2%), Native American (1.2%), Asian (1.1%), and Hispanic or Latino (2.3%).
The median household income in the county is $50,945, and the median home value is $179,400. The county has a poverty rate of 11.3%, and the unemployment rate is 4.2%.
Conclusion
Penobscot County is located in the state of Maine, in the United States of America. It is the largest county in the state, covering an area of 3,717 square miles. The county was established in 1816, and it is home to a population of 153,923 people, as of the 2020 census. The economy of the county is largely based on the service industry, and the county is home to several major employers. The county is also home to a variety of ethnic and racial groups, and the median household income is $50,945. Penobscot County is an important part of the state of Maine, and it is home to a variety of landscapes, including mountains, forests, rivers, and lakes.
Common Questions
What is Per Capita Income in Penobscot County?
Per Capita income in Penobscot County is $34,423.
What is the Median Family Income in Penobscot County?
Median Family Income in Penobscot County is $82,139.
What is the Median Household income in Penobscot County?
Median Household Income in Penobscot County is $59,438.
What is Income or Wage Gap in Penobscot County?
Income or Wage Gap in Penobscot County is 19.3%.
Women in Penobscot County earn 80.7 cents for every dollar earned by a man.
What is Family Income Deficit in Penobscot County?
Family Income Deficit in Penobscot County is $10,344.
Families that are below poverty line in Penobscot County earn $10,344 less on average than the poverty threshold level.
What is Inequality or Gini Index in Penobscot County?
Inequality or Gini Index in Penobscot County is 0.46.
What is the Total Population of Penobscot County?
Total Population of Penobscot County is 152,640.
What is the Total Male Population of Penobscot County?
Total Male Population of Penobscot County is 75,942.
What is the Total Female Population of Penobscot County?
Total Female Population of Penobscot County is 76,698.
What is the Ratio of Males per 100 Females in Penobscot County?
There are 99.01 Males per 100 Females in Penobscot County.
What is the Ratio of Females per 100 Males in Penobscot County?
There are 101.00 Females per 100 Males in Penobscot County.
What is the Median Population Age in Penobscot County?
Median Population Age in Penobscot County is 42.4 Years.
What is the Average Family Size in Penobscot County
Average Family Size in Penobscot County is 2.9 People.
What is the Average Household Size in Penobscot County
Average Household Size in Penobscot County is 2.3 People.
How Large is the Labor Force in Penobscot County?
There are 77,488 People in the Labor Forcein in Penobscot County.
What is the Percentage of People in the Labor Force in Penobscot County?
60.0% of People are in the Labor Force in Penobscot County.
What is the Unemployment Rate in Penobscot County?
Unemployment Rate in Penobscot County is 4.3%.