Chippewa Falls, WI Map & Demographics
Chippewa Falls Map
Chippewa Falls Overview
$29,967
PER CAPITA INCOME
$70,581
AVG FAMILY INCOME
$58,558
AVG HOUSEHOLD INCOME
24.4%
WAGE / INCOME GAP [ % ]
75.6¢/ $1
WAGE / INCOME GAP [ $ ]
$12,214
FAMILY INCOME DEFICIT
0.40
INEQUALITY / GINI INDEX
14,623
TOTAL POPULATION
7,131
MALE POPULATION
7,492
FEMALE POPULATION
95.18
MALES / 100 FEMALES
105.06
FEMALES / 100 MALES
38.2
MEDIAN AGE
3.0
AVG FAMILY SIZE
2.1
AVG HOUSEHOLD SIZE
7,313
LABOR FORCE [ PEOPLE ]
61.4%
PERCENT IN LABOR FORCE
5.4%
UNEMPLOYMENT RATE
Chippewa Falls Zip Codes
Income in Chippewa Falls
Income Overview in Chippewa Falls
Per Capita Income in Chippewa Falls is $29,967, while median incomes of families and households are $70,581 and $58,558 respectively.
| Characteristic | Number | Measure |
| Per Capita Income | 14,623 | $29,967 |
| Median Family Income | 3,081 | $70,581 |
| Mean Family Income | 3,081 | $81,723 |
| Median Household Income | 6,360 | $58,558 |
| Mean Household Income | 6,360 | $67,560 |
| Income Deficit | 3,081 | $12,214 |
| Wage / Income Gap (%) | 14,623 | 24.40% |
| Wage / Income Gap ($) | 14,623 | 75.60¢ per $1 |
| Gini / Inequality Index | 14,623 | 0.40 |
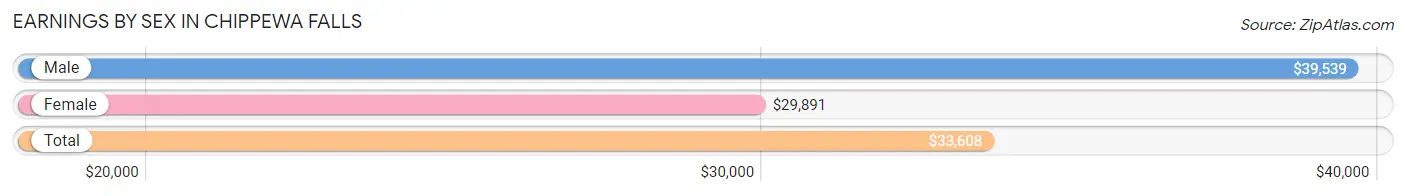
Earnings by Sex in Chippewa Falls
Average Earnings in Chippewa Falls are $33,608, $39,539 for men and $29,891 for women, a difference of 24.4%.
| Sex | Number | Average Earnings |
| Male | 4,323 (55.9%) | $39,539 |
| Female | 3,414 (44.1%) | $29,891 |
| Total | 7,737 (100.0%) | $33,608 |
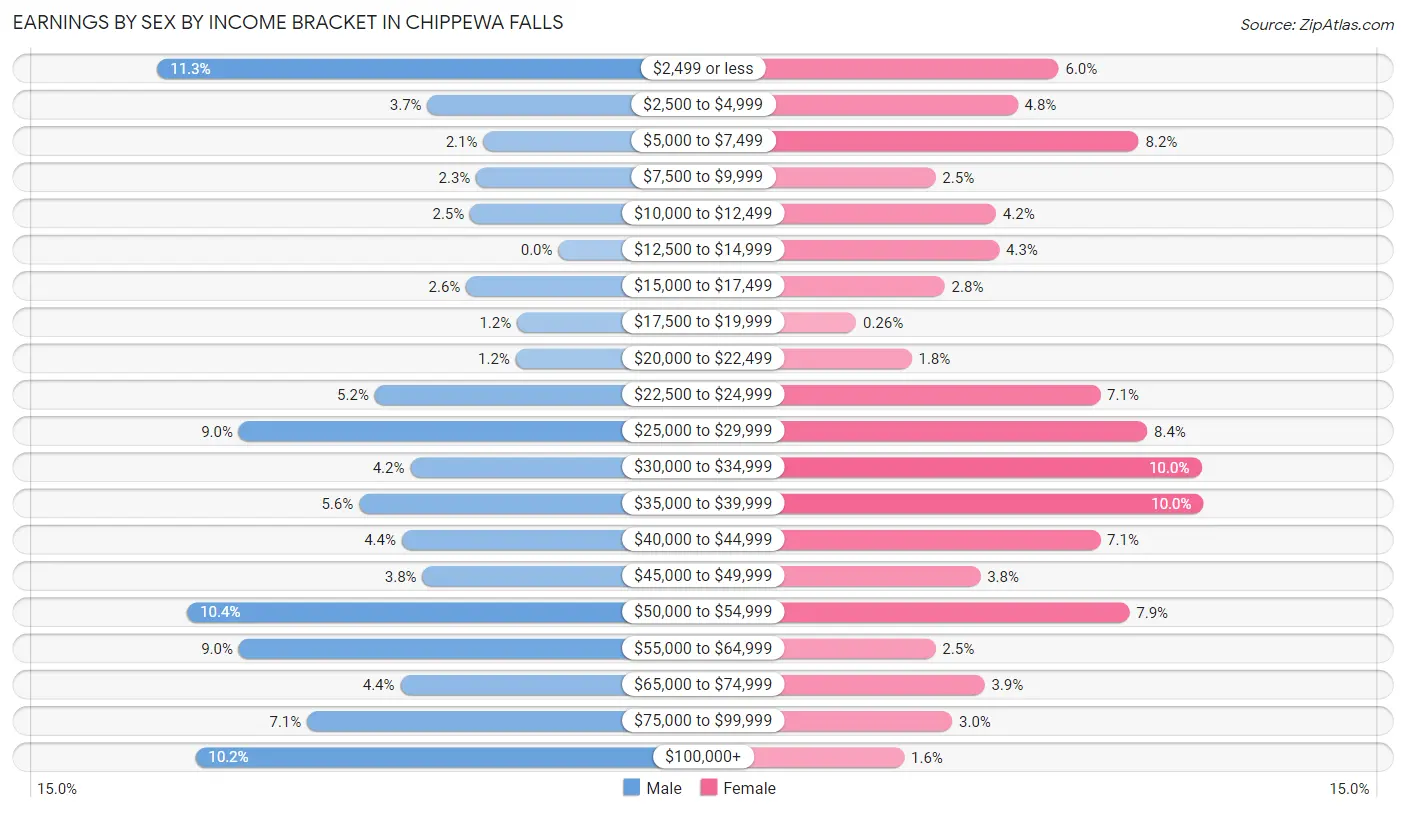
Earnings by Sex by Income Bracket in Chippewa Falls
The most common earnings brackets in Chippewa Falls are $2,499 or less for men (487 | 11.3%) and $35,000 to $39,999 for women (342 | 10.0%).
| Income | Male | Female |
| $2,499 or less | 487 (11.3%) | 203 (5.9%) |
| $2,500 to $4,999 | 159 (3.7%) | 164 (4.8%) |
| $5,000 to $7,499 | 91 (2.1%) | 280 (8.2%) |
| $7,500 to $9,999 | 100 (2.3%) | 85 (2.5%) |
| $10,000 to $12,499 | 107 (2.5%) | 143 (4.2%) |
| $12,500 to $14,999 | 0 (0.0%) | 146 (4.3%) |
| $15,000 to $17,499 | 112 (2.6%) | 94 (2.8%) |
| $17,500 to $19,999 | 50 (1.2%) | 9 (0.3%) |
| $20,000 to $22,499 | 52 (1.2%) | 62 (1.8%) |
| $22,500 to $24,999 | 223 (5.2%) | 243 (7.1%) |
| $25,000 to $29,999 | 388 (9.0%) | 288 (8.4%) |
| $30,000 to $34,999 | 180 (4.2%) | 340 (10.0%) |
| $35,000 to $39,999 | 242 (5.6%) | 342 (10.0%) |
| $40,000 to $44,999 | 190 (4.4%) | 243 (7.1%) |
| $45,000 to $49,999 | 165 (3.8%) | 128 (3.7%) |
| $50,000 to $54,999 | 451 (10.4%) | 271 (7.9%) |
| $55,000 to $64,999 | 388 (9.0%) | 85 (2.5%) |
| $65,000 to $74,999 | 192 (4.4%) | 132 (3.9%) |
| $75,000 to $99,999 | 305 (7.1%) | 101 (3.0%) |
| $100,000+ | 441 (10.2%) | 55 (1.6%) |
| Total | 4,323 (100.0%) | 3,414 (100.0%) |
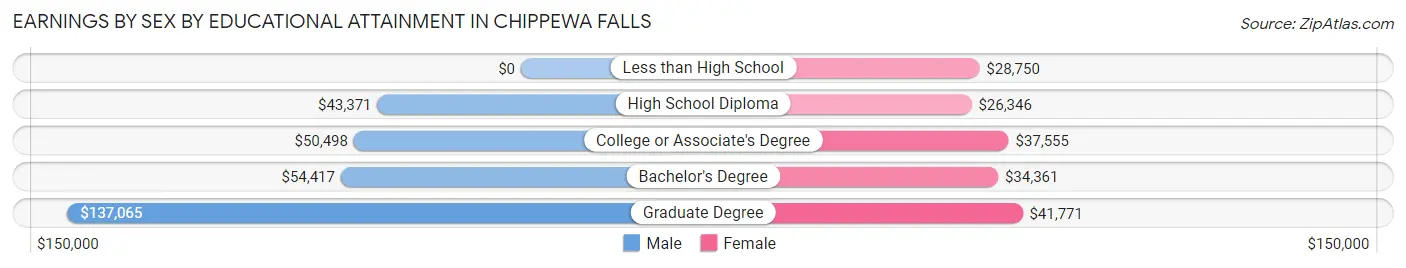
Earnings by Sex by Educational Attainment in Chippewa Falls
Average earnings in Chippewa Falls are $49,097 for men and $33,706 for women, a difference of 31.4%. Men with an educational attainment of graduate degree enjoy the highest average annual earnings of $137,065, while those with high school diploma education earn the least with $43,371. Women with an educational attainment of graduate degree earn the most with the average annual earnings of $41,771, while those with high school diploma education have the smallest earnings of $26,346.
| Educational Attainment | Male Income | Female Income |
| Less than High School | - | - |
| High School Diploma | $43,371 | $26,346 |
| College or Associate's Degree | $50,498 | $37,555 |
| Bachelor's Degree | $54,417 | $34,361 |
| Graduate Degree | $137,065 | $41,771 |
| Total | $49,097 | $33,706 |
Family Income in Chippewa Falls
Family Income Brackets in Chippewa Falls
According to the Chippewa Falls family income data, there are 632 families falling into the $100,000 to $149,999 income range, which is the most common income bracket and makes up 20.5% of all families. Conversely, the $10,000 to $14,999 income bracket is the least frequent group with only 68 families (2.2%) belonging to this category.
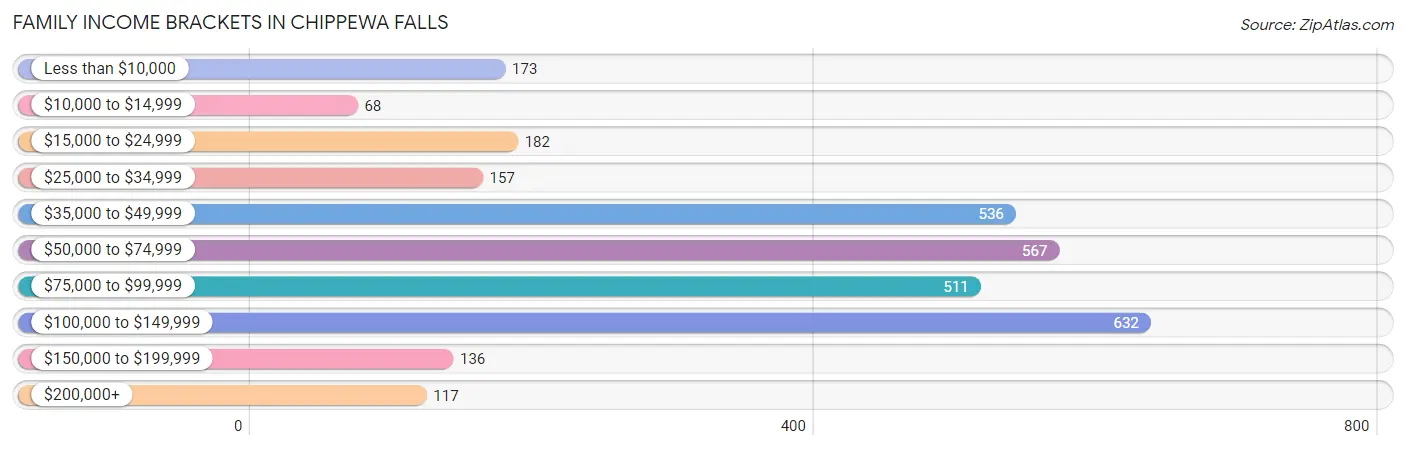
| Income Bracket | # Families | % Families |
| Less than $10,000 | 173 | 5.6% |
| $10,000 to $14,999 | 68 | 2.2% |
| $15,000 to $24,999 | 182 | 5.9% |
| $25,000 to $34,999 | 157 | 5.1% |
| $35,000 to $49,999 | 536 | 17.4% |
| $50,000 to $74,999 | 567 | 18.4% |
| $75,000 to $99,999 | 511 | 16.6% |
| $100,000 to $149,999 | 632 | 20.5% |
| $150,000 to $199,999 | 136 | 4.4% |
| $200,000+ | 117 | 3.8% |
Family Income by Famaliy Size in Chippewa Falls
4-person families (420 | 13.6%) account for the highest median family income in Chippewa Falls with $98,100 per family, while 2-person families (1,584 | 51.4%) have the highest median income of $34,070 per family member.
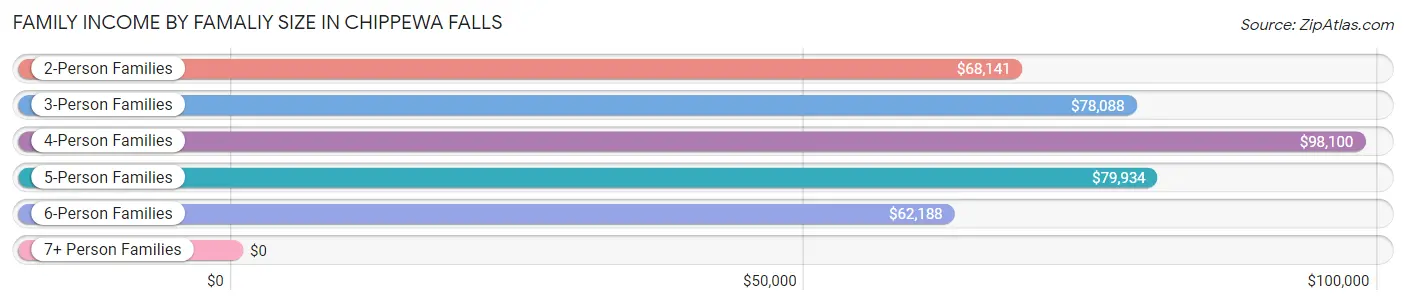
| Income Bracket | # Families | Median Income |
| 2-Person Families | 1,584 (51.4%) | $68,141 |
| 3-Person Families | 638 (20.7%) | $78,088 |
| 4-Person Families | 420 (13.6%) | $98,100 |
| 5-Person Families | 357 (11.6%) | $79,934 |
| 6-Person Families | 51 (1.7%) | $62,188 |
| 7+ Person Families | 31 (1.0%) | $0 |
| Total | 3,081 (100.0%) | $70,581 |
Family Income by Number of Earners in Chippewa Falls
The median family income in Chippewa Falls is $70,581, with families comprising 3+ earners (151) having the highest median family income of $116,369, while families with 1 earner (1,019) have the lowest median family income of $44,841, accounting for 4.9% and 33.1% of families, respectively.
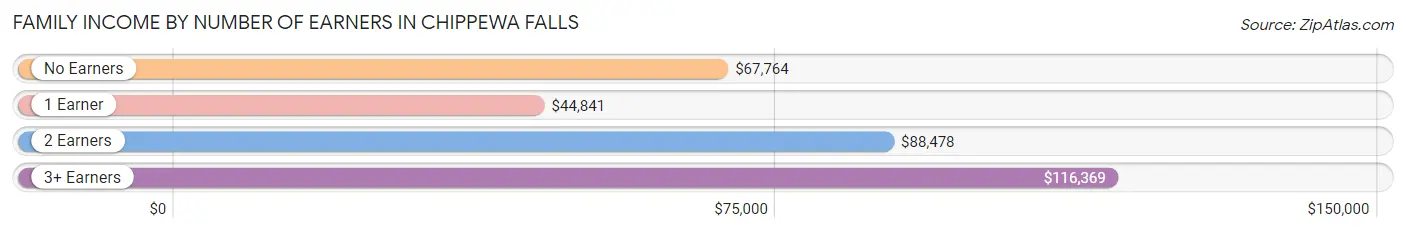
| Number of Earners | # Families | Median Income |
| No Earners | 489 (15.9%) | $67,764 |
| 1 Earner | 1,019 (33.1%) | $44,841 |
| 2 Earners | 1,422 (46.2%) | $88,478 |
| 3+ Earners | 151 (4.9%) | $116,369 |
| Total | 3,081 (100.0%) | $70,581 |
Household Income in Chippewa Falls
Household Income Brackets in Chippewa Falls
With 1,431 households falling in the category, the $50,000 to $74,999 income range is the most frequent in Chippewa Falls, accounting for 22.5% of all households. In contrast, only 114 households (1.8%) fall into the $200,000+ income bracket, making it the least populous group.
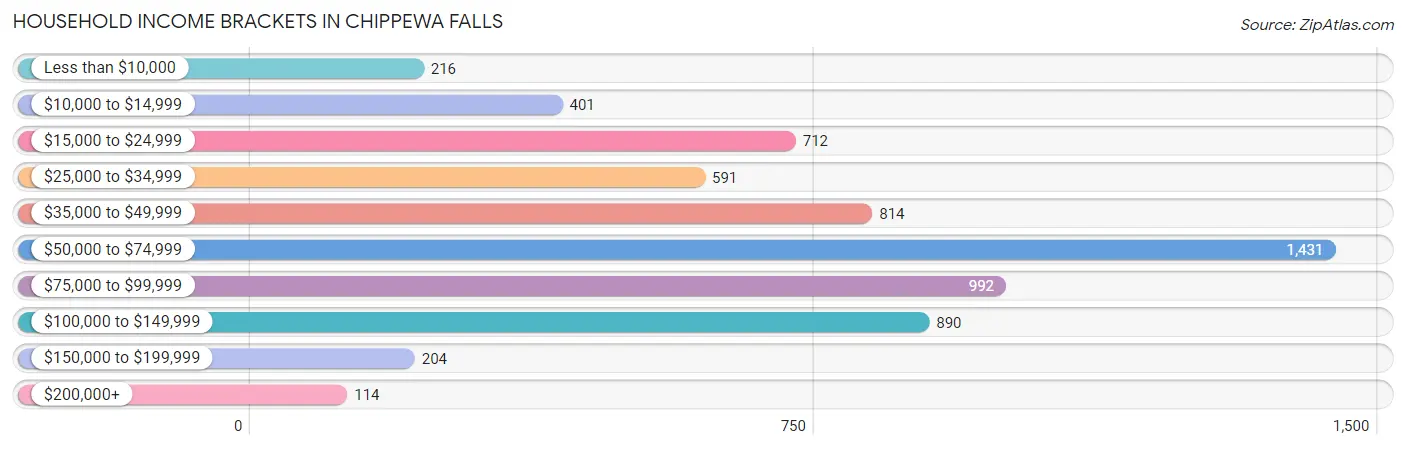
| Income Bracket | # Households | % Households |
| Less than $10,000 | 216 | 3.4% |
| $10,000 to $14,999 | 401 | 6.3% |
| $15,000 to $24,999 | 712 | 11.2% |
| $25,000 to $34,999 | 591 | 9.3% |
| $35,000 to $49,999 | 814 | 12.8% |
| $50,000 to $74,999 | 1,431 | 22.5% |
| $75,000 to $99,999 | 992 | 15.6% |
| $100,000 to $149,999 | 890 | 14.0% |
| $150,000 to $199,999 | 204 | 3.2% |
| $200,000+ | 114 | 1.8% |
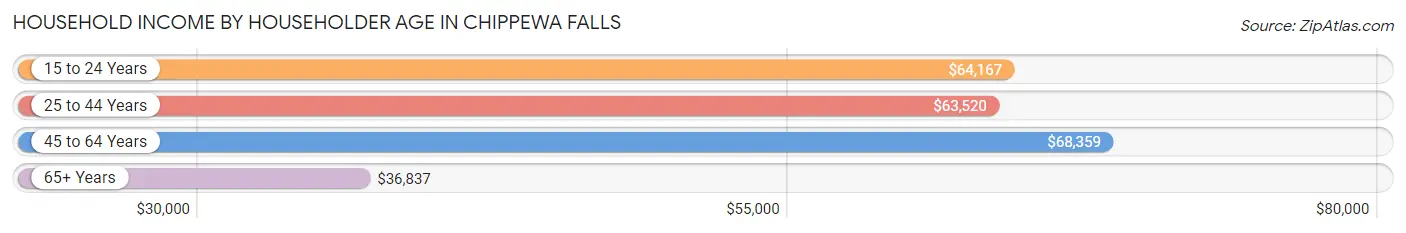
Household Income by Householder Age in Chippewa Falls
The median household income in Chippewa Falls is $58,558, with the highest median household income of $68,359 found in the 45 to 64 years age bracket for the primary householder. A total of 1,879 households (29.5%) fall into this category. Meanwhile, the 65+ years age bracket for the primary householder has the lowest median household income of $36,837, with 2,100 households (33.0%) in this group.
| Income Bracket | # Households | Median Income |
| 15 to 24 Years | 400 (6.3%) | $64,167 |
| 25 to 44 Years | 1,981 (31.1%) | $63,520 |
| 45 to 64 Years | 1,879 (29.5%) | $68,359 |
| 65+ Years | 2,100 (33.0%) | $36,837 |
| Total | 6,360 (100.0%) | $58,558 |
Poverty in Chippewa Falls
Income Below Poverty by Sex and Age in Chippewa Falls
With 9.3% poverty level for males and 18.5% for females among the residents of Chippewa Falls, 16 and 17 year old males and 15 year old females are the most vulnerable to poverty, with 56 males (35.2%) and 46 females (39.3%) in their respective age groups living below the poverty level.
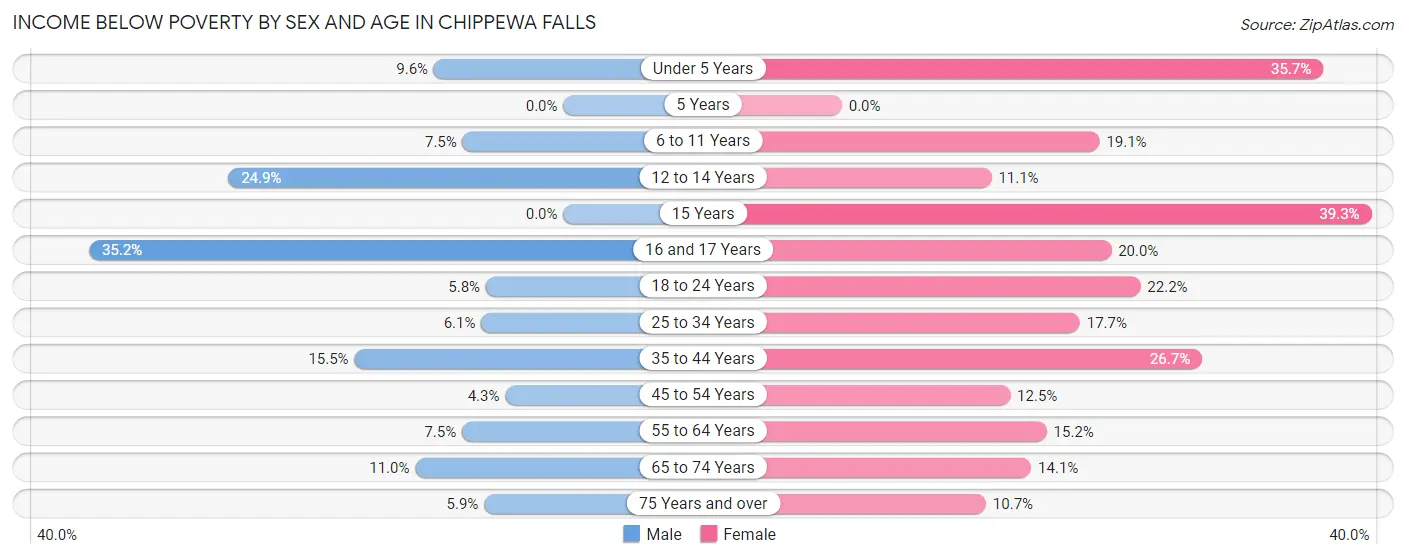
| Age Bracket | Male | Female |
| Under 5 Years | 32 (9.6%) | 189 (35.7%) |
| 5 Years | 0 (0.0%) | 0 (0.0%) |
| 6 to 11 Years | 40 (7.5%) | 132 (19.1%) |
| 12 to 14 Years | 51 (24.9%) | 9 (11.1%) |
| 15 Years | 0 (0.0%) | 46 (39.3%) |
| 16 and 17 Years | 56 (35.2%) | 16 (20.0%) |
| 18 to 24 Years | 51 (5.8%) | 149 (22.2%) |
| 25 to 34 Years | 61 (6.1%) | 135 (17.7%) |
| 35 to 44 Years | 134 (15.5%) | 227 (26.7%) |
| 45 to 54 Years | 30 (4.3%) | 99 (12.5%) |
| 55 to 64 Years | 53 (7.5%) | 134 (15.2%) |
| 65 to 74 Years | 69 (11.0%) | 124 (14.1%) |
| 75 Years and over | 19 (5.9%) | 98 (10.7%) |
| Total | 596 (9.3%) | 1,358 (18.5%) |
Income Above Poverty by Sex and Age in Chippewa Falls
According to the poverty statistics in Chippewa Falls, males aged 5 years and females aged 5 years are the age groups that are most secure financially, with 100.0% of males and 100.0% of females in these age groups living above the poverty line.
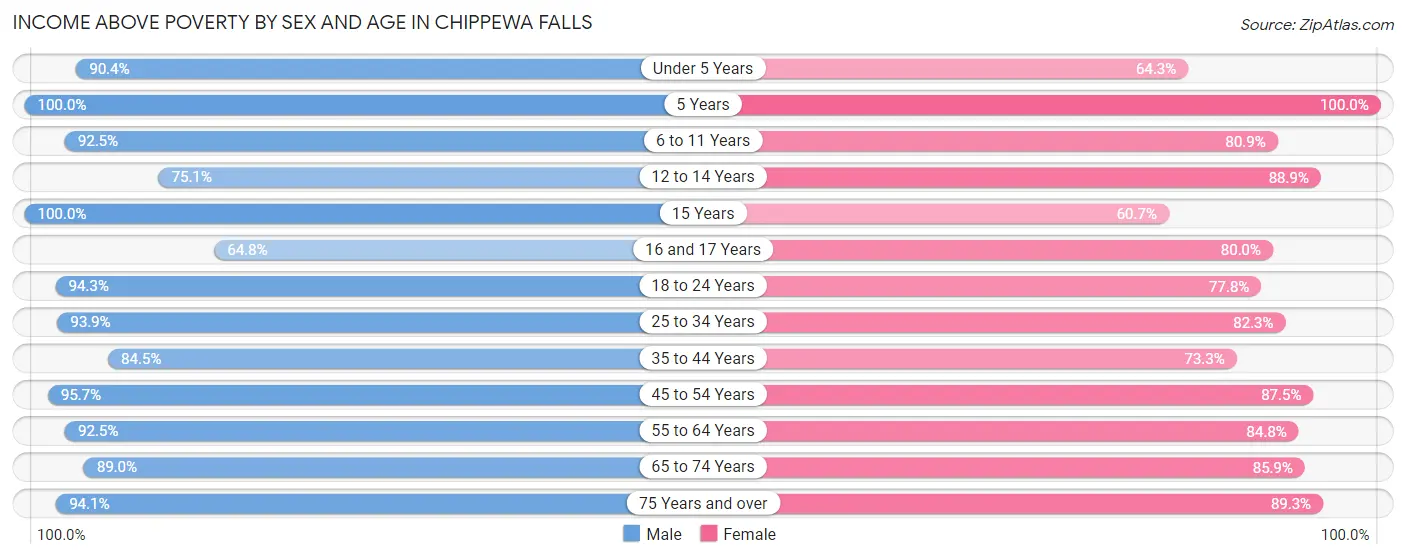
| Age Bracket | Male | Female |
| Under 5 Years | 301 (90.4%) | 340 (64.3%) |
| 5 Years | 40 (100.0%) | 93 (100.0%) |
| 6 to 11 Years | 495 (92.5%) | 558 (80.9%) |
| 12 to 14 Years | 154 (75.1%) | 72 (88.9%) |
| 15 Years | 46 (100.0%) | 71 (60.7%) |
| 16 and 17 Years | 103 (64.8%) | 64 (80.0%) |
| 18 to 24 Years | 836 (94.3%) | 523 (77.8%) |
| 25 to 34 Years | 940 (93.9%) | 629 (82.3%) |
| 35 to 44 Years | 730 (84.5%) | 622 (73.3%) |
| 45 to 54 Years | 666 (95.7%) | 693 (87.5%) |
| 55 to 64 Years | 652 (92.5%) | 747 (84.8%) |
| 65 to 74 Years | 559 (89.0%) | 758 (85.9%) |
| 75 Years and over | 304 (94.1%) | 818 (89.3%) |
| Total | 5,826 (90.7%) | 5,988 (81.5%) |
Income Below Poverty Among Married-Couple Families in Chippewa Falls
The poverty statistics for married-couple families in Chippewa Falls show that 7.7% or 162 of the total 2,106 families live below the poverty line. Families with 5 or more children have the highest poverty rate of 73.9%, comprising of 17 families. On the other hand, families with no children have the lowest poverty rate of 4.2%, which includes 50 families.
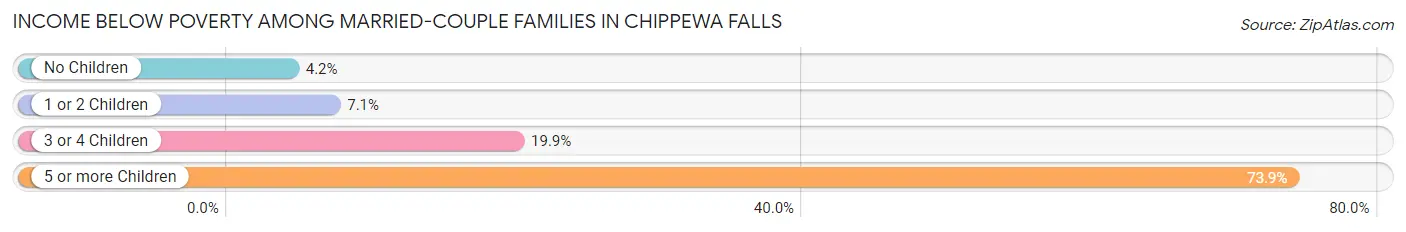
| Children | Above Poverty | Below Poverty |
| No Children | 1,132 (95.8%) | 50 (4.2%) |
| 1 or 2 Children | 613 (92.9%) | 47 (7.1%) |
| 3 or 4 Children | 193 (80.1%) | 48 (19.9%) |
| 5 or more Children | 6 (26.1%) | 17 (73.9%) |
| Total | 1,944 (92.3%) | 162 (7.7%) |
Income Below Poverty Among Single-Parent Households in Chippewa Falls
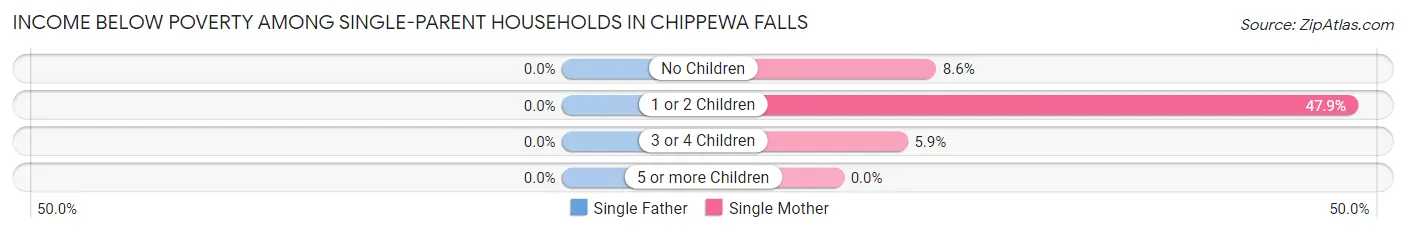
| Children | Single Father | Single Mother |
| No Children | 0 (0.0%) | 28 (8.6%) |
| 1 or 2 Children | 0 (0.0%) | 181 (47.9%) |
| 3 or 4 Children | 0 (0.0%) | 6 (5.9%) |
| 5 or more Children | 0 (0.0%) | 0 (0.0%) |
| Total | 0 (0.0%) | 215 (26.7%) |
Income Below Poverty Among Married-Couple vs Single-Parent Households in Chippewa Falls
The poverty data for Chippewa Falls shows that 162 of the married-couple family households (7.7%) and 215 of the single-parent households (22.1%) are living below the poverty level. Within the married-couple family households, those with 5 or more children have the highest poverty rate, with 17 households (73.9%) falling below the poverty line. Among the single-parent households, those with 1 or 2 children have the highest poverty rate, with 181 household (40.2%) living below poverty.
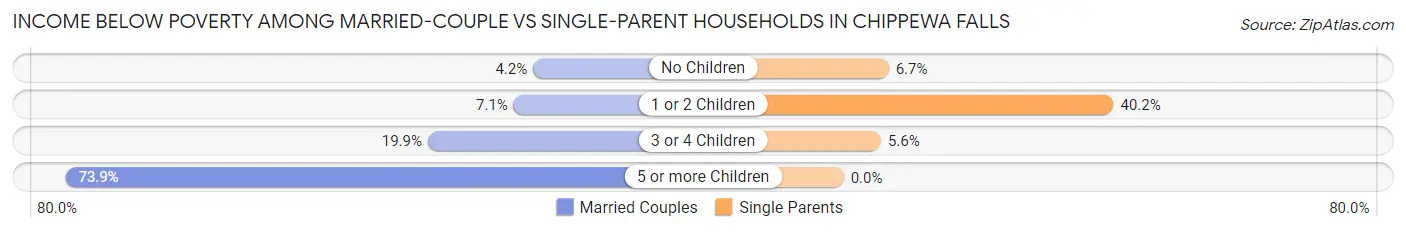
| Children | Married-Couple Families | Single-Parent Households |
| No Children | 50 (4.2%) | 28 (6.7%) |
| 1 or 2 Children | 47 (7.1%) | 181 (40.2%) |
| 3 or 4 Children | 48 (19.9%) | 6 (5.6%) |
| 5 or more Children | 17 (73.9%) | 0 (0.0%) |
| Total | 162 (7.7%) | 215 (22.1%) |
Race in Chippewa Falls
The most populous races in Chippewa Falls are White / Caucasian (13,357 | 91.3%), Two or more Races (599 | 4.1%), and Black / African American (392 | 2.7%).
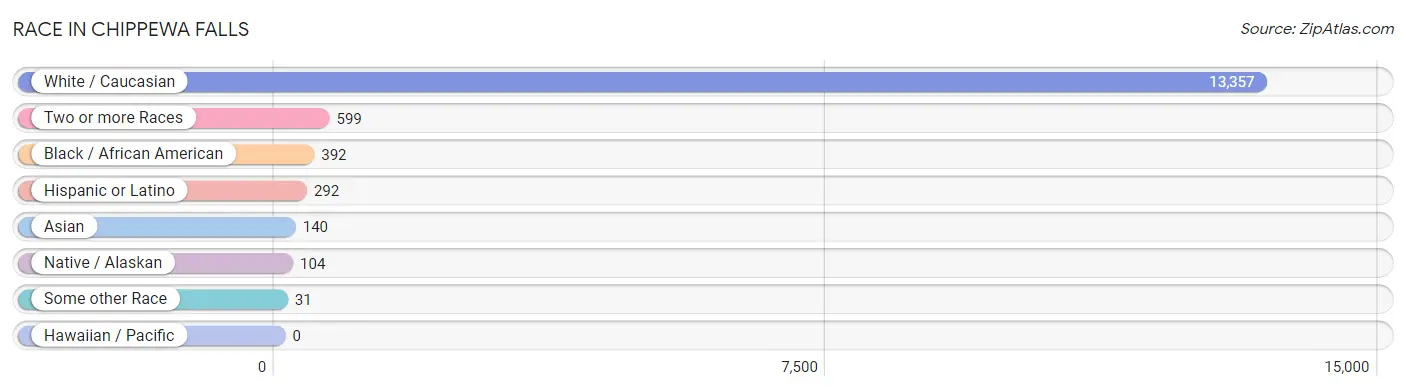
| Race | # Population | % Population |
| Asian | 140 | 1.0% |
| Black / African American | 392 | 2.7% |
| Hawaiian / Pacific | 0 | 0.0% |
| Hispanic or Latino | 292 | 2.0% |
| Native / Alaskan | 104 | 0.7% |
| White / Caucasian | 13,357 | 91.3% |
| Two or more Races | 599 | 4.1% |
| Some other Race | 31 | 0.2% |
| Total | 14,623 | 100.0% |
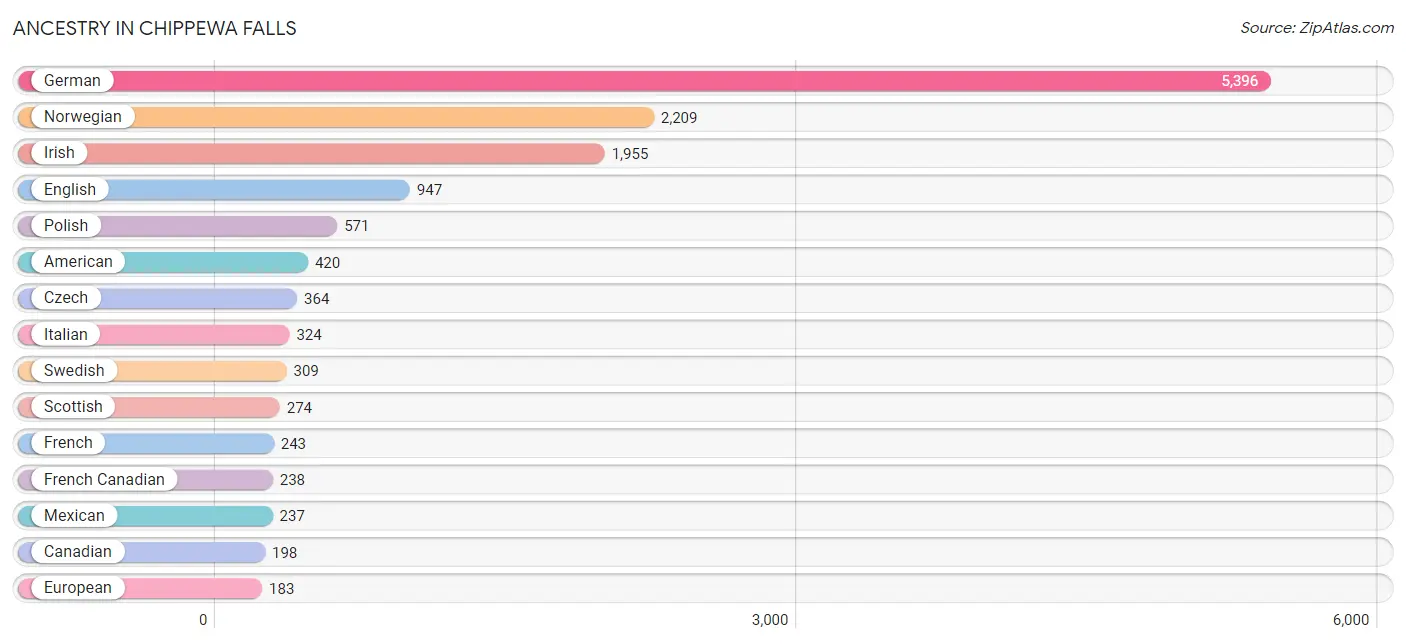
Ancestry in Chippewa Falls
The most populous ancestries reported in Chippewa Falls are German (5,396 | 36.9%), Norwegian (2,209 | 15.1%), Irish (1,955 | 13.4%), English (947 | 6.5%), and Polish (571 | 3.9%), together accounting for 75.8% of all Chippewa Falls residents.
| Ancestry | # Population | % Population |
| African | 42 | 0.3% |
| Alaska Native | 2 | 0.0% |
| Aleut | 11 | 0.1% |
| American | 420 | 2.9% |
| Arab | 2 | 0.0% |
| Armenian | 9 | 0.1% |
| Austrian | 23 | 0.2% |
| Belgian | 65 | 0.4% |
| Brazilian | 58 | 0.4% |
| British | 14 | 0.1% |
| Bulgarian | 39 | 0.3% |
| Canadian | 198 | 1.3% |
| Cherokee | 8 | 0.1% |
| Chippewa | 25 | 0.2% |
| Croatian | 13 | 0.1% |
| Czech | 364 | 2.5% |
| Czechoslovakian | 17 | 0.1% |
| Danish | 140 | 1.0% |
| Dutch | 95 | 0.6% |
| Eastern European | 19 | 0.1% |
| English | 947 | 6.5% |
| European | 183 | 1.3% |
| Finnish | 11 | 0.1% |
| French | 243 | 1.7% |
| French Canadian | 238 | 1.6% |
| German | 5,396 | 36.9% |
| Greek | 34 | 0.2% |
| Hungarian | 22 | 0.2% |
| Indian (Asian) | 101 | 0.7% |
| Inupiat | 20 | 0.1% |
| Irish | 1,955 | 13.4% |
| Italian | 324 | 2.2% |
| Jamaican | 10 | 0.1% |
| Korean | 28 | 0.2% |
| Lithuanian | 89 | 0.6% |
| Luxembourger | 19 | 0.1% |
| Menominee | 3 | 0.0% |
| Mexican | 237 | 1.6% |
| Mongolian | 35 | 0.2% |
| Nigerian | 131 | 0.9% |
| Northern European | 18 | 0.1% |
| Norwegian | 2,209 | 15.1% |
| Polish | 571 | 3.9% |
| Puerto Rican | 13 | 0.1% |
| Russian | 66 | 0.4% |
| Scandinavian | 30 | 0.2% |
| Scotch-Irish | 139 | 0.9% |
| Scottish | 274 | 1.9% |
| Sioux | 12 | 0.1% |
| Sri Lankan | 16 | 0.1% |
| Subsaharan African | 173 | 1.2% |
| Swedish | 309 | 2.1% |
| Swiss | 171 | 1.2% |
| Thai | 69 | 0.5% |
| Ukrainian | 9 | 0.1% |
| Welsh | 66 | 0.4% | View All 56 Rows |
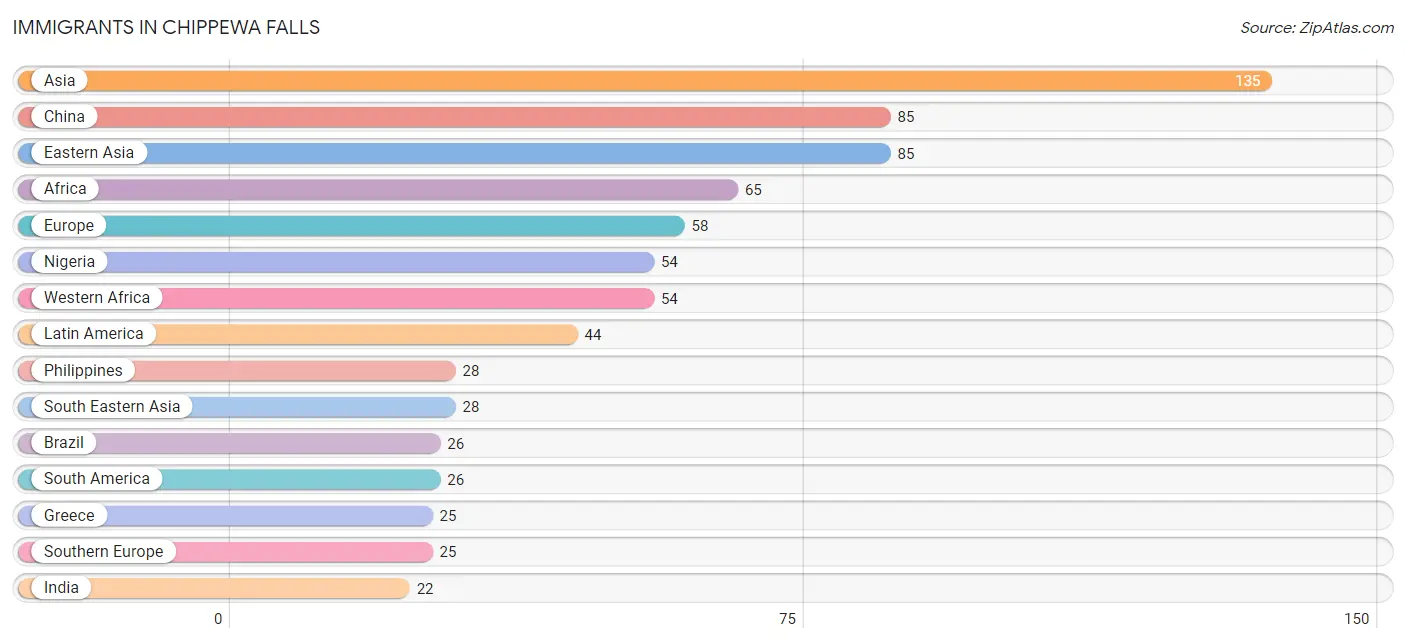
Immigrants in Chippewa Falls
The most numerous immigrant groups reported in Chippewa Falls came from Asia (135 | 0.9%), China (85 | 0.6%), Eastern Asia (85 | 0.6%), Africa (65 | 0.4%), and Europe (58 | 0.4%), together accounting for 2.9% of all Chippewa Falls residents.
| Immigration Origin | # Population | % Population |
| Africa | 65 | 0.4% |
| Asia | 135 | 0.9% |
| Brazil | 26 | 0.2% |
| Central America | 18 | 0.1% |
| China | 85 | 0.6% |
| Eastern Africa | 11 | 0.1% |
| Eastern Asia | 85 | 0.6% |
| Eastern Europe | 16 | 0.1% |
| Europe | 58 | 0.4% |
| Greece | 25 | 0.2% |
| India | 22 | 0.2% |
| Latin America | 44 | 0.3% |
| Mexico | 18 | 0.1% |
| Nigeria | 54 | 0.4% |
| North Macedonia | 5 | 0.0% |
| Northern Europe | 17 | 0.1% |
| Philippines | 28 | 0.2% |
| Russia | 2 | 0.0% |
| South America | 26 | 0.2% |
| South Central Asia | 22 | 0.2% |
| South Eastern Asia | 28 | 0.2% |
| Southern Europe | 25 | 0.2% |
| Ukraine | 9 | 0.1% |
| Western Africa | 54 | 0.4% | View All 24 Rows |
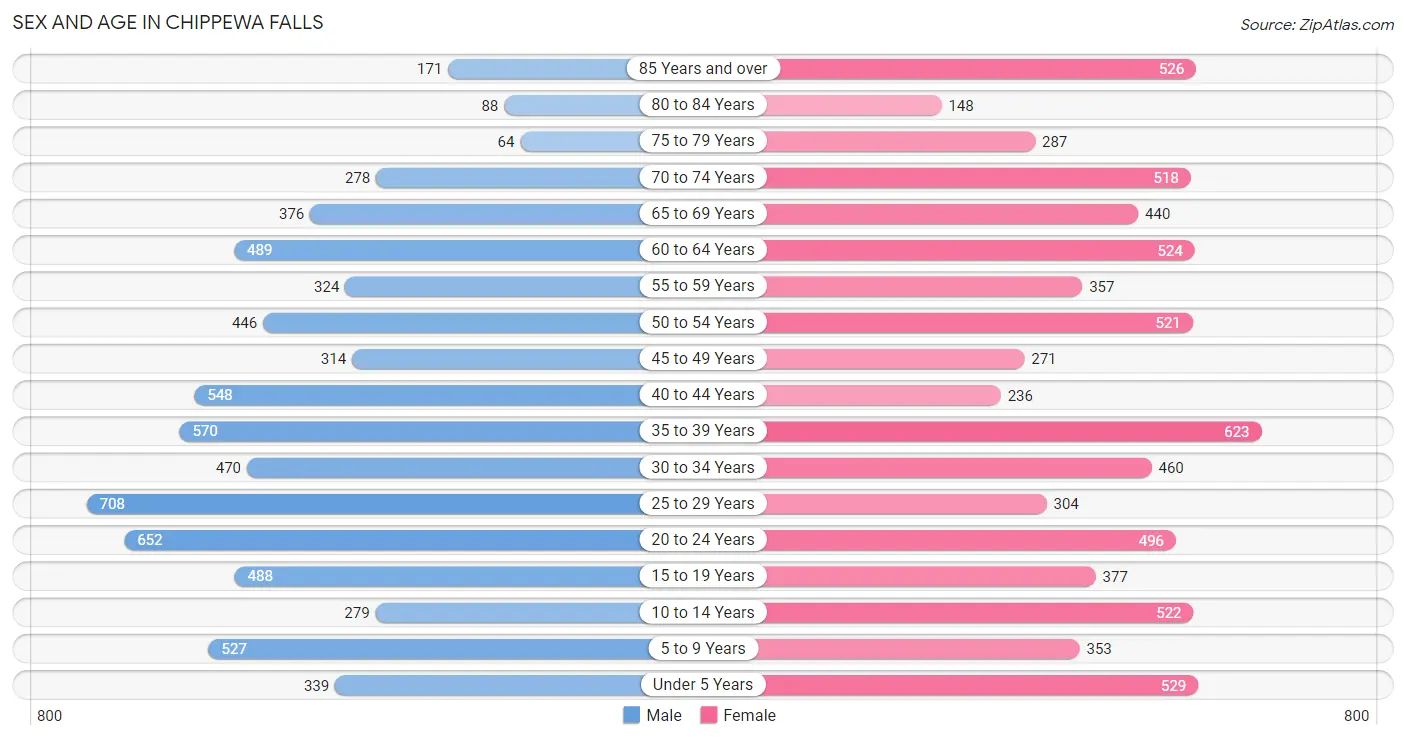
Sex and Age in Chippewa Falls
Sex and Age in Chippewa Falls
The most populous age groups in Chippewa Falls are 25 to 29 Years (708 | 9.9%) for men and 35 to 39 Years (623 | 8.3%) for women.
| Age Bracket | Male | Female |
| Under 5 Years | 339 (4.8%) | 529 (7.1%) |
| 5 to 9 Years | 527 (7.4%) | 353 (4.7%) |
| 10 to 14 Years | 279 (3.9%) | 522 (7.0%) |
| 15 to 19 Years | 488 (6.8%) | 377 (5.0%) |
| 20 to 24 Years | 652 (9.1%) | 496 (6.6%) |
| 25 to 29 Years | 708 (9.9%) | 304 (4.1%) |
| 30 to 34 Years | 470 (6.6%) | 460 (6.1%) |
| 35 to 39 Years | 570 (8.0%) | 623 (8.3%) |
| 40 to 44 Years | 548 (7.7%) | 236 (3.2%) |
| 45 to 49 Years | 314 (4.4%) | 271 (3.6%) |
| 50 to 54 Years | 446 (6.2%) | 521 (7.0%) |
| 55 to 59 Years | 324 (4.5%) | 357 (4.8%) |
| 60 to 64 Years | 489 (6.9%) | 524 (7.0%) |
| 65 to 69 Years | 376 (5.3%) | 440 (5.9%) |
| 70 to 74 Years | 278 (3.9%) | 518 (6.9%) |
| 75 to 79 Years | 64 (0.9%) | 287 (3.8%) |
| 80 to 84 Years | 88 (1.2%) | 148 (2.0%) |
| 85 Years and over | 171 (2.4%) | 526 (7.0%) |
| Total | 7,131 (100.0%) | 7,492 (100.0%) |
Families and Households in Chippewa Falls
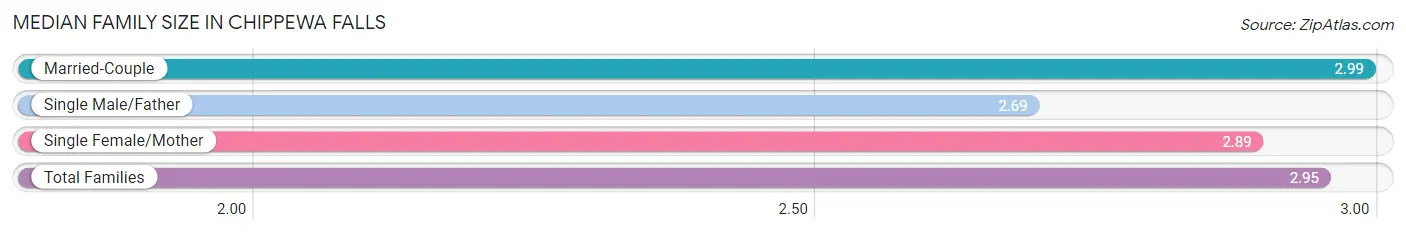
Median Family Size in Chippewa Falls
The median family size in Chippewa Falls is 2.95 persons per family, with married-couple families (2,106 | 68.3%) accounting for the largest median family size of 2.99 persons per family. On the other hand, single male/father families (170 | 5.5%) represent the smallest median family size with 2.69 persons per family.
| Family Type | # Families | Family Size |
| Married-Couple | 2,106 (68.3%) | 2.99 |
| Single Male/Father | 170 (5.5%) | 2.69 |
| Single Female/Mother | 805 (26.1%) | 2.89 |
| Total Families | 3,081 (100.0%) | 2.95 |
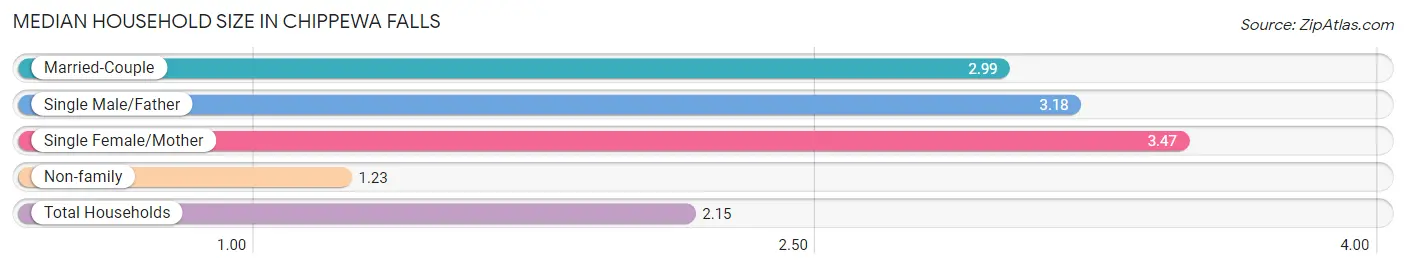
Median Household Size in Chippewa Falls
The median household size in Chippewa Falls is 2.15 persons per household, with single female/mother households (805 | 12.7%) accounting for the largest median household size of 3.47 persons per household. non-family households (3,279 | 51.6%) represent the smallest median household size with 1.23 persons per household.
| Household Type | # Households | Household Size |
| Married-Couple | 2,106 (33.1%) | 2.99 |
| Single Male/Father | 170 (2.7%) | 3.18 |
| Single Female/Mother | 805 (12.7%) | 3.47 |
| Non-family | 3,279 (51.6%) | 1.23 |
| Total Households | 6,360 (100.0%) | 2.15 |
Household Size by Marriage Status in Chippewa Falls
Out of a total of 6,360 households in Chippewa Falls, 3,081 (48.4%) are family households, while 3,279 (51.6%) are nonfamily households. The most numerous type of family households are 2-person households, comprising 1,263, and the most common type of nonfamily households are 1-person households, comprising 2,697.
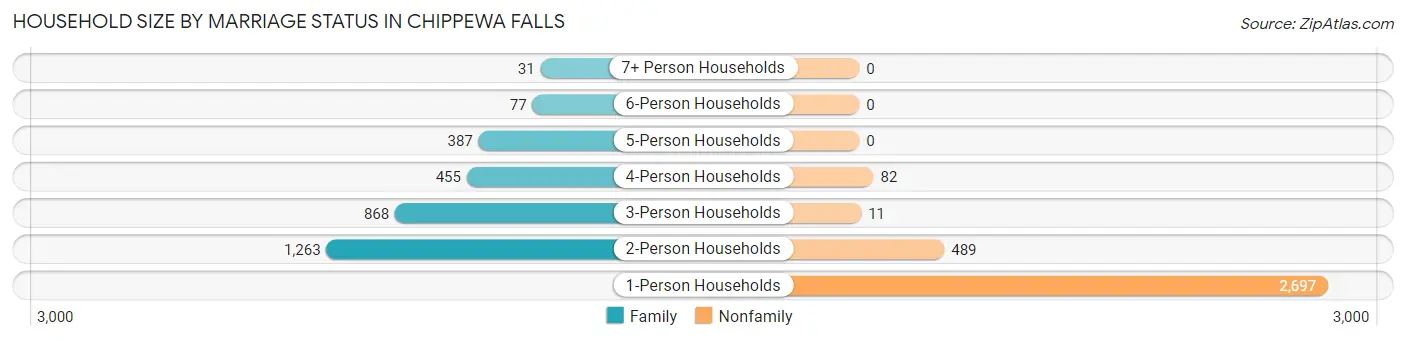
| Household Size | Family Households | Nonfamily Households |
| 1-Person Households | - | 2,697 (42.4%) |
| 2-Person Households | 1,263 (19.9%) | 489 (7.7%) |
| 3-Person Households | 868 (13.7%) | 11 (0.2%) |
| 4-Person Households | 455 (7.1%) | 82 (1.3%) |
| 5-Person Households | 387 (6.1%) | 0 (0.0%) |
| 6-Person Households | 77 (1.2%) | 0 (0.0%) |
| 7+ Person Households | 31 (0.5%) | 0 (0.0%) |
| Total | 3,081 (48.4%) | 3,279 (51.6%) |
Female Fertility in Chippewa Falls
Fertility by Age in Chippewa Falls
Average fertility rate in Chippewa Falls is 53.0 births per 1,000 women. Women in the age bracket of 20 to 34 years have the highest fertility rate with 97.0 births per 1,000 women. Women in the age bracket of 20 to 34 years acount for 79.7% of all women with births.
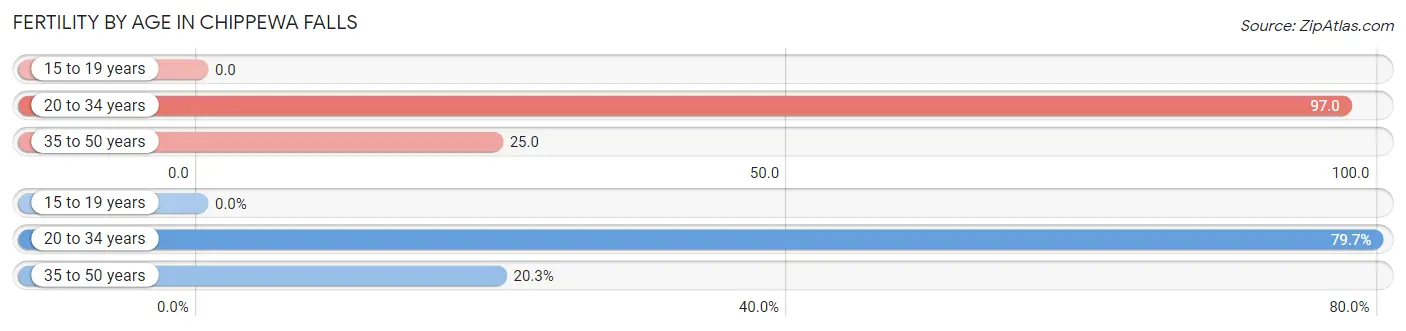
| Age Bracket | Women with Births | Births / 1,000 Women |
| 15 to 19 years | 0 (0.0%) | 0.0 |
| 20 to 34 years | 122 (79.7%) | 97.0 |
| 35 to 50 years | 31 (20.3%) | 25.0 |
| Total | 153 (100.0%) | 53.0 |
Fertility by Age by Marriage Status in Chippewa Falls
80.4% of women with births (153) in Chippewa Falls are married. The highest percentage of unmarried women with births falls into 20 to 34 years age bracket with 20.5% of them unmarried at the time of birth, while the lowest percentage of unmarried women with births belong to 35 to 50 years age bracket with 16.1% of them unmarried.

| Age Bracket | Married | Unmarried |
| 15 to 19 years | 0 (0.0%) | 0 (0.0%) |
| 20 to 34 years | 97 (79.5%) | 25 (20.5%) |
| 35 to 50 years | 26 (83.9%) | 5 (16.1%) |
| Total | 123 (80.4%) | 30 (19.6%) |
Fertility by Education in Chippewa Falls
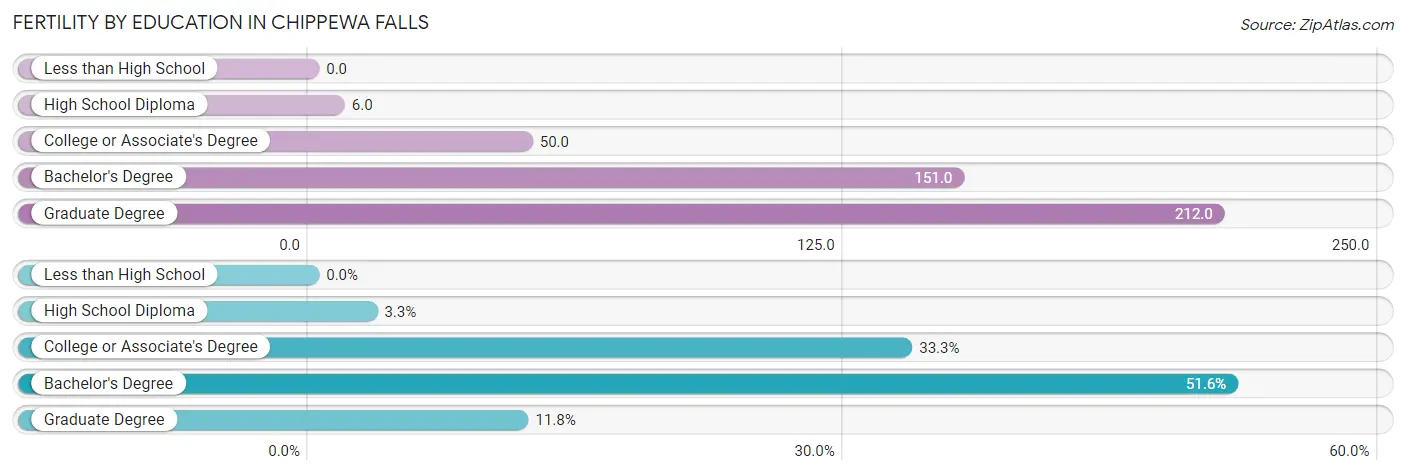
| Educational Attainment | Women with Births | Births / 1,000 Women |
| Less than High School | 0 (0.0%) | 0.0 |
| High School Diploma | 5 (3.3%) | 6.0 |
| College or Associate's Degree | 51 (33.3%) | 50.0 |
| Bachelor's Degree | 79 (51.6%) | 151.0 |
| Graduate Degree | 18 (11.8%) | 212.0 |
| Total | 153 (100.0%) | 53.0 |
Fertility by Education by Marriage Status in Chippewa Falls
19.6% of women with births in Chippewa Falls are unmarried. Women with the educational attainment of college or associate's degree are most likely to be married with 100.0% of them married at childbirth, while women with the educational attainment of high school diploma are least likely to be married with 100.0% of them unmarried at childbirth.
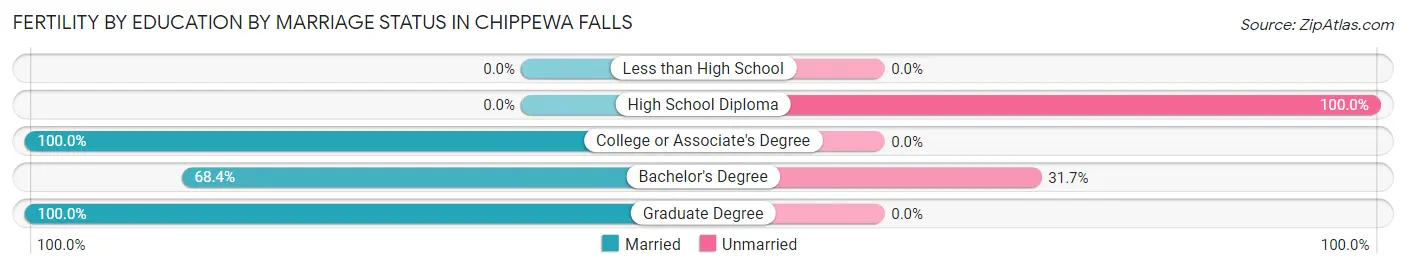
| Educational Attainment | Married | Unmarried |
| Less than High School | 0 (0.0%) | 0 (0.0%) |
| High School Diploma | 0 (0.0%) | 5 (100.0%) |
| College or Associate's Degree | 51 (100.0%) | 0 (0.0%) |
| Bachelor's Degree | 54 (68.3%) | 25 (31.7%) |
| Graduate Degree | 18 (100.0%) | 0 (0.0%) |
| Total | 123 (80.4%) | 30 (19.6%) |
Employment Characteristics in Chippewa Falls
Employment by Class of Employer in Chippewa Falls
Among the 6,822 employed individuals in Chippewa Falls, private company employees (4,963 | 72.8%), not-for-profit organizations (658 | 9.7%), and local government employees (511 | 7.5%) make up the most common classes of employment.
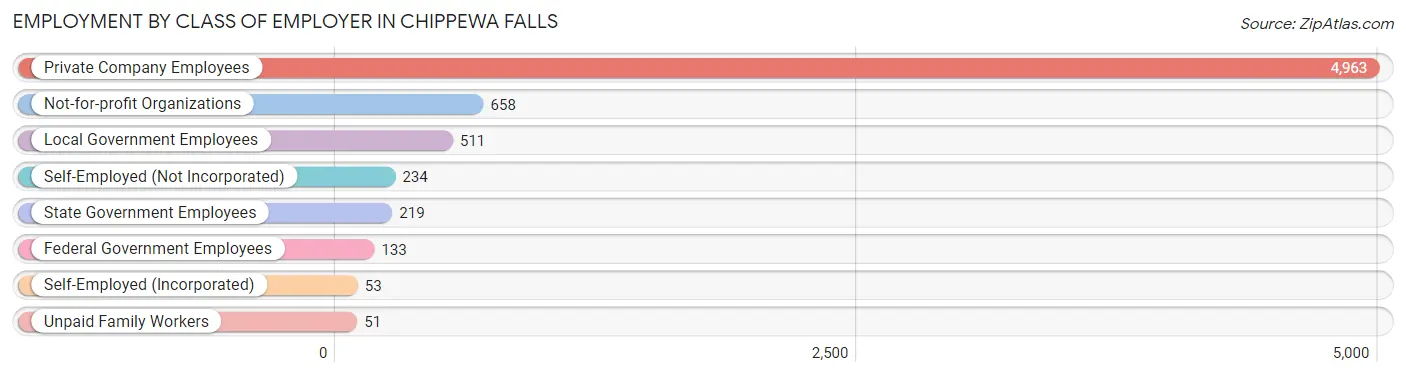
| Employer Class | # Employees | % Employees |
| Private Company Employees | 4,963 | 72.8% |
| Self-Employed (Incorporated) | 53 | 0.8% |
| Self-Employed (Not Incorporated) | 234 | 3.4% |
| Not-for-profit Organizations | 658 | 9.7% |
| Local Government Employees | 511 | 7.5% |
| State Government Employees | 219 | 3.2% |
| Federal Government Employees | 133 | 1.9% |
| Unpaid Family Workers | 51 | 0.7% |
| Total | 6,822 | 100.0% |
Employment Status by Age in Chippewa Falls
According to the labor force statistics for Chippewa Falls, out of the total population over 16 years of age (11,910), 61.4% or 7,313 individuals are in the labor force, with 5.4% or 395 of them unemployed. The age group with the highest labor force participation rate is 20 to 24 years, with 92.3% or 1,060 individuals in the labor force. Within the labor force, the 16 to 19 years age range has the highest percentage of unemployed individuals, with 20.5% or 106 of them being unemployed.
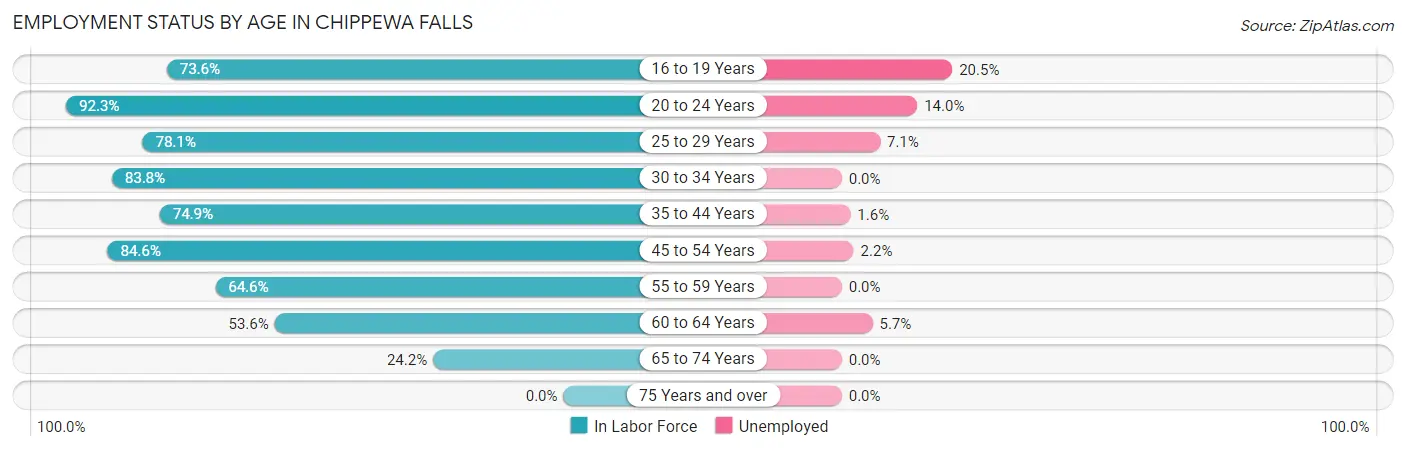
| Age Bracket | In Labor Force | Unemployed |
| 16 to 19 Years | 516 (73.6%) | 106 (20.5%) |
| 20 to 24 Years | 1,060 (92.3%) | 148 (14.0%) |
| 25 to 29 Years | 790 (78.1%) | 56 (7.1%) |
| 30 to 34 Years | 779 (83.8%) | 0 (0.0%) |
| 35 to 44 Years | 1,481 (74.9%) | 24 (1.6%) |
| 45 to 54 Years | 1,313 (84.6%) | 29 (2.2%) |
| 55 to 59 Years | 440 (64.6%) | 0 (0.0%) |
| 60 to 64 Years | 543 (53.6%) | 31 (5.7%) |
| 65 to 74 Years | 390 (24.2%) | 0 (0.0%) |
| 75 Years and over | 0 (0.0%) | 0 (0.0%) |
| Total | 7,313 (61.4%) | 395 (5.4%) |
Employment Status by Educational Attainment in Chippewa Falls
According to labor force statistics for Chippewa Falls, 74.6% of individuals (5,345) out of the total population between 25 and 64 years of age (7,165) are in the labor force, with 2.6% or 139 of them being unemployed. The group with the highest labor force participation rate are those with the educational attainment of bachelor's degree or higher, with 79.7% or 1,297 individuals in the labor force. Within the labor force, individuals with high school diploma education have the highest percentage of unemployment, with 7.2% or 103 of them being unemployed.
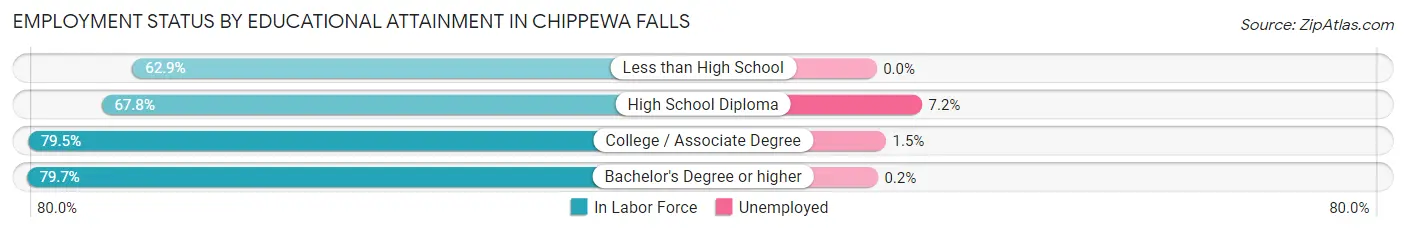
| Educational Attainment | In Labor Force | Unemployed |
| Less than High School | 412 (62.9%) | 0 (0.0%) |
| High School Diploma | 1,429 (67.8%) | 152 (7.2%) |
| College / Associate Degree | 2,207 (79.5%) | 42 (1.5%) |
| Bachelor's Degree or higher | 1,297 (79.7%) | 3 (0.2%) |
| Total | 5,345 (74.6%) | 186 (2.6%) |
Employment Occupations by Sex in Chippewa Falls
Management, Business, Science and Arts Occupations
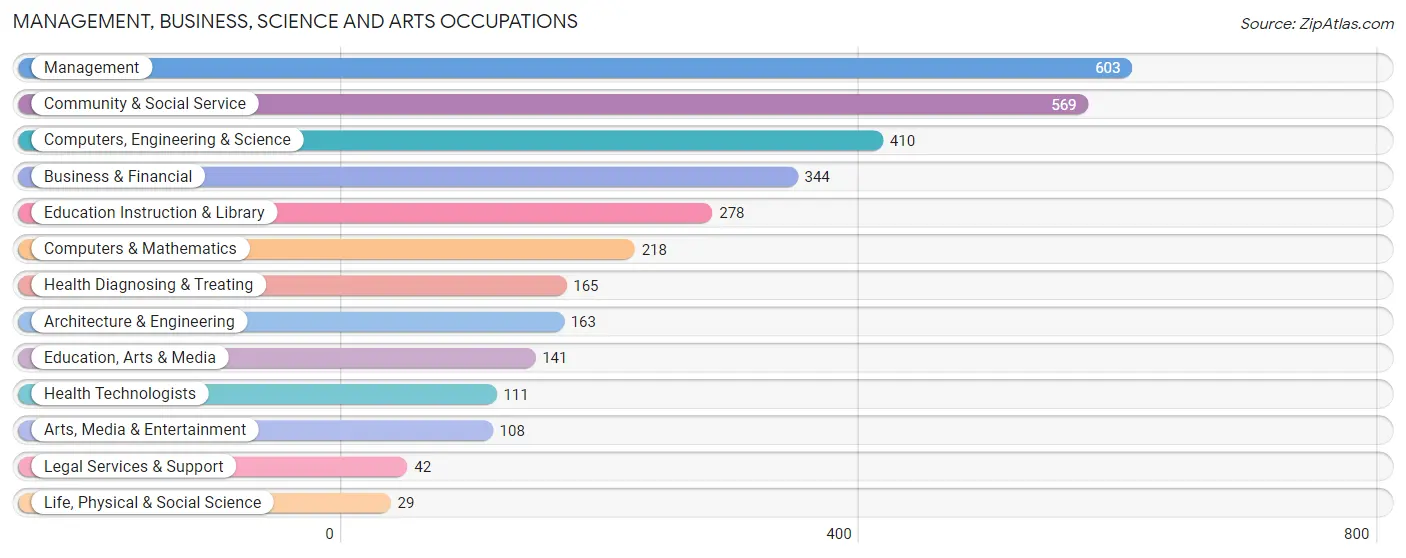
The most common Management, Business, Science and Arts occupations in Chippewa Falls are Management (603 | 8.7%), Community & Social Service (569 | 8.2%), Computers, Engineering & Science (410 | 5.9%), Business & Financial (344 | 5.0%), and Education Instruction & Library (278 | 4.0%).
Management, Business, Science and Arts Occupations by Sex
Within the Management, Business, Science and Arts occupations in Chippewa Falls, the most male-oriented occupations are Life, Physical & Social Science (100.0%), Computers, Engineering & Science (89.5%), and Computers & Mathematics (89.4%), while the most female-oriented occupations are Education, Arts & Media (93.6%), Community & Social Service (73.3%), and Education Instruction & Library (70.9%).
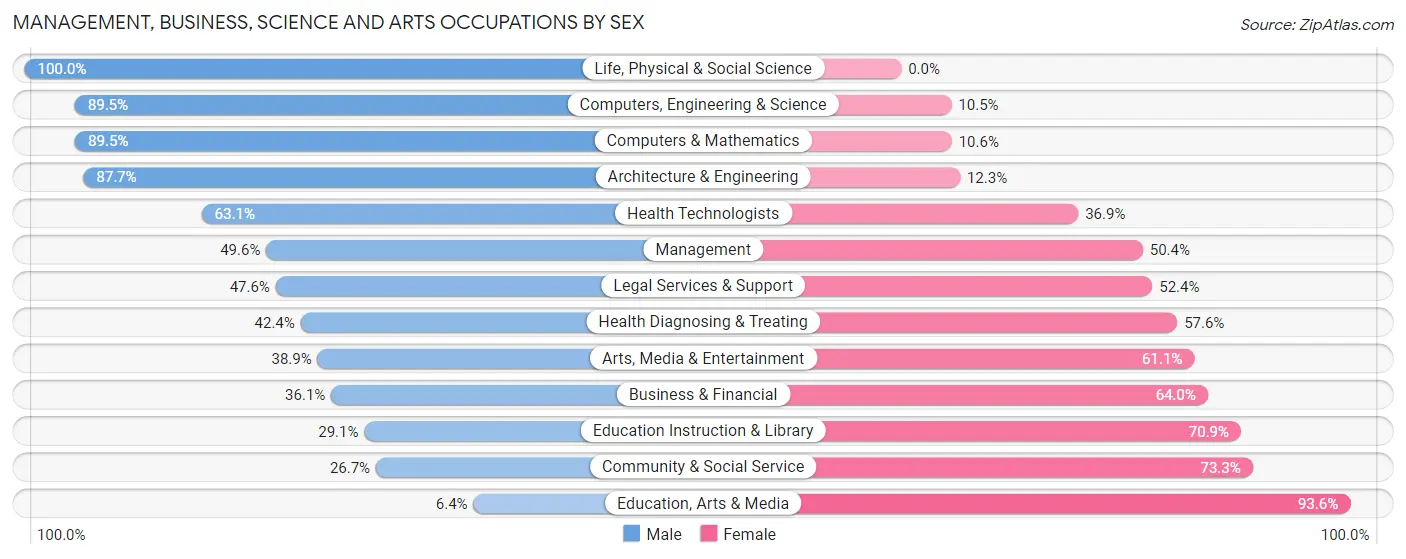
| Occupation | Male | Female |
| Management | 299 (49.6%) | 304 (50.4%) |
| Business & Financial | 124 (36.0%) | 220 (63.9%) |
| Computers, Engineering & Science | 367 (89.5%) | 43 (10.5%) |
| Computers & Mathematics | 195 (89.4%) | 23 (10.5%) |
| Architecture & Engineering | 143 (87.7%) | 20 (12.3%) |
| Life, Physical & Social Science | 29 (100.0%) | 0 (0.0%) |
| Community & Social Service | 152 (26.7%) | 417 (73.3%) |
| Education, Arts & Media | 9 (6.4%) | 132 (93.6%) |
| Legal Services & Support | 20 (47.6%) | 22 (52.4%) |
| Education Instruction & Library | 81 (29.1%) | 197 (70.9%) |
| Arts, Media & Entertainment | 42 (38.9%) | 66 (61.1%) |
| Health Diagnosing & Treating | 70 (42.4%) | 95 (57.6%) |
| Health Technologists | 70 (63.1%) | 41 (36.9%) |
| Total (Category) | 1,012 (48.4%) | 1,079 (51.6%) |
| Total (Overall) | 3,749 (54.2%) | 3,169 (45.8%) |
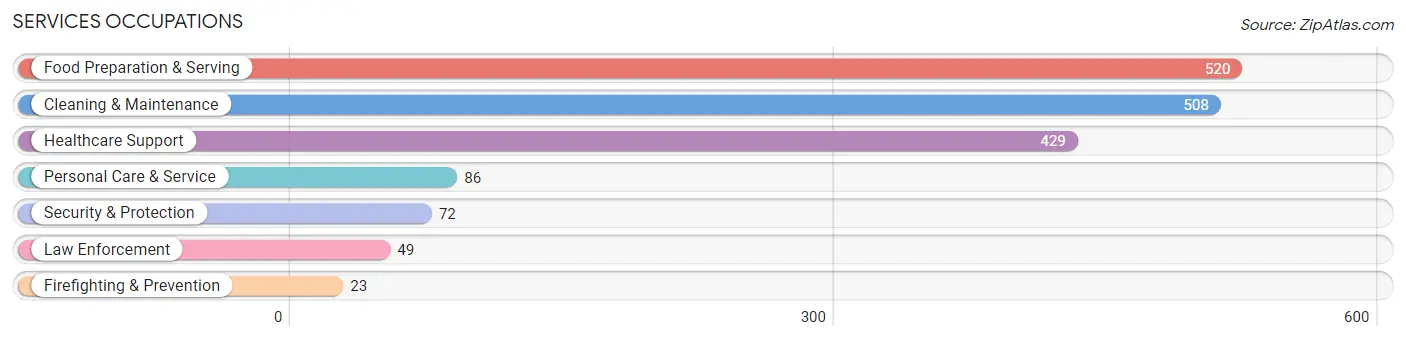
Services Occupations
The most common Services occupations in Chippewa Falls are Food Preparation & Serving (520 | 7.5%), Cleaning & Maintenance (508 | 7.3%), Healthcare Support (429 | 6.2%), Personal Care & Service (86 | 1.2%), and Security & Protection (72 | 1.0%).
Services Occupations by Sex
Within the Services occupations in Chippewa Falls, the most male-oriented occupations are Security & Protection (100.0%), Firefighting & Prevention (100.0%), and Law Enforcement (100.0%), while the most female-oriented occupations are Healthcare Support (96.5%), Personal Care & Service (72.1%), and Food Preparation & Serving (64.2%).
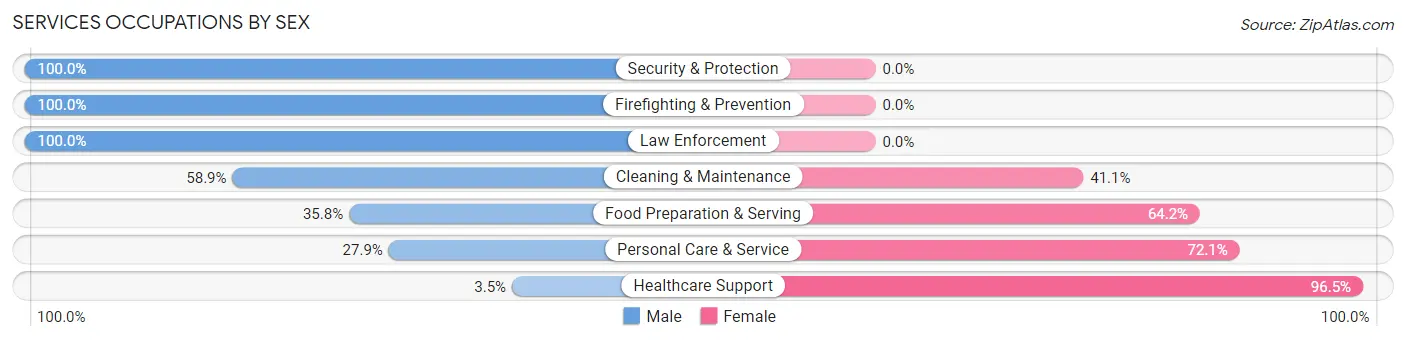
| Occupation | Male | Female |
| Healthcare Support | 15 (3.5%) | 414 (96.5%) |
| Security & Protection | 72 (100.0%) | 0 (0.0%) |
| Firefighting & Prevention | 23 (100.0%) | 0 (0.0%) |
| Law Enforcement | 49 (100.0%) | 0 (0.0%) |
| Food Preparation & Serving | 186 (35.8%) | 334 (64.2%) |
| Cleaning & Maintenance | 299 (58.9%) | 209 (41.1%) |
| Personal Care & Service | 24 (27.9%) | 62 (72.1%) |
| Total (Category) | 596 (36.9%) | 1,019 (63.1%) |
| Total (Overall) | 3,749 (54.2%) | 3,169 (45.8%) |
Sales and Office Occupations
The most common Sales and Office occupations in Chippewa Falls are Office & Administration (747 | 10.8%), and Sales & Related (429 | 6.2%).
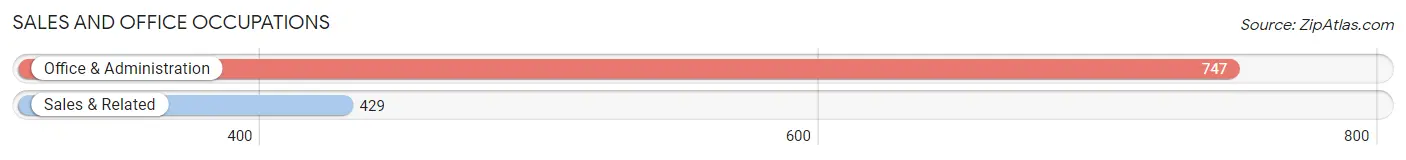
Sales and Office Occupations by Sex
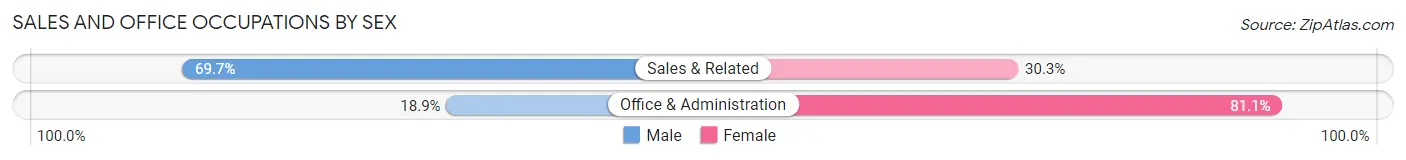
| Occupation | Male | Female |
| Sales & Related | 299 (69.7%) | 130 (30.3%) |
| Office & Administration | 141 (18.9%) | 606 (81.1%) |
| Total (Category) | 440 (37.4%) | 736 (62.6%) |
| Total (Overall) | 3,749 (54.2%) | 3,169 (45.8%) |
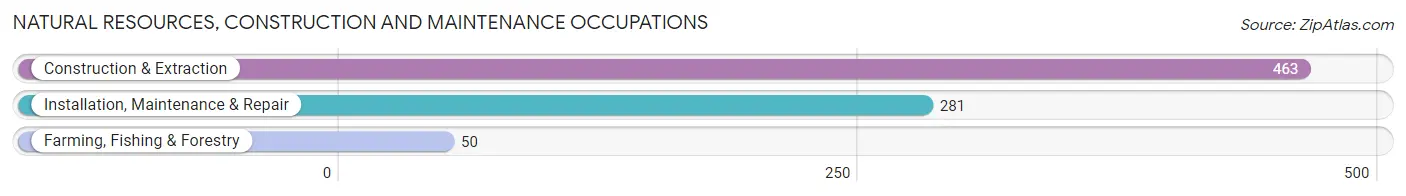
Natural Resources, Construction and Maintenance Occupations
The most common Natural Resources, Construction and Maintenance occupations in Chippewa Falls are Construction & Extraction (463 | 6.7%), Installation, Maintenance & Repair (281 | 4.1%), and Farming, Fishing & Forestry (50 | 0.7%).
Natural Resources, Construction and Maintenance Occupations by Sex
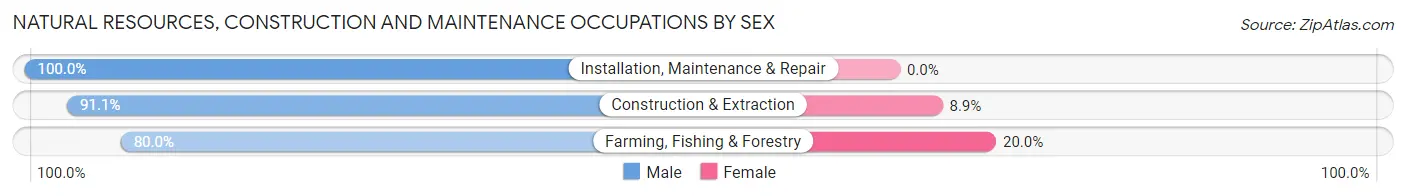
| Occupation | Male | Female |
| Farming, Fishing & Forestry | 40 (80.0%) | 10 (20.0%) |
| Construction & Extraction | 422 (91.1%) | 41 (8.9%) |
| Installation, Maintenance & Repair | 281 (100.0%) | 0 (0.0%) |
| Total (Category) | 743 (93.6%) | 51 (6.4%) |
| Total (Overall) | 3,749 (54.2%) | 3,169 (45.8%) |
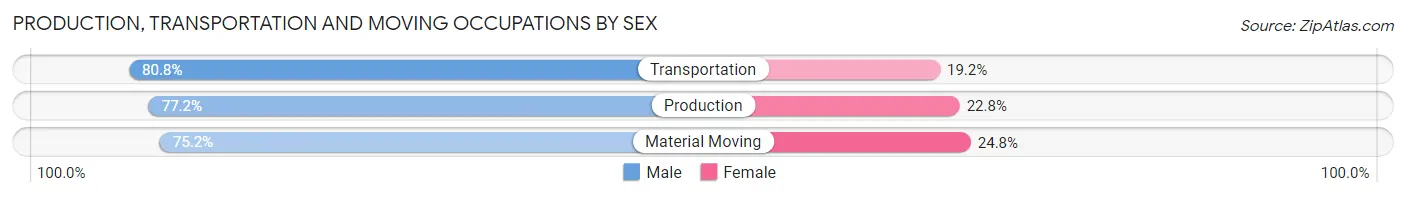
Production, Transportation and Moving Occupations
The most common Production, Transportation and Moving occupations in Chippewa Falls are Production (588 | 8.5%), Material Moving (435 | 6.3%), and Transportation (219 | 3.2%).
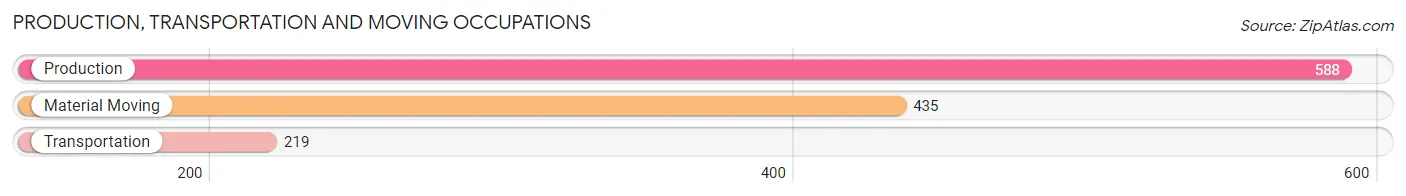
Production, Transportation and Moving Occupations by Sex
| Occupation | Male | Female |
| Production | 454 (77.2%) | 134 (22.8%) |
| Transportation | 177 (80.8%) | 42 (19.2%) |
| Material Moving | 327 (75.2%) | 108 (24.8%) |
| Total (Category) | 958 (77.1%) | 284 (22.9%) |
| Total (Overall) | 3,749 (54.2%) | 3,169 (45.8%) |
Employment Industries by Sex in Chippewa Falls
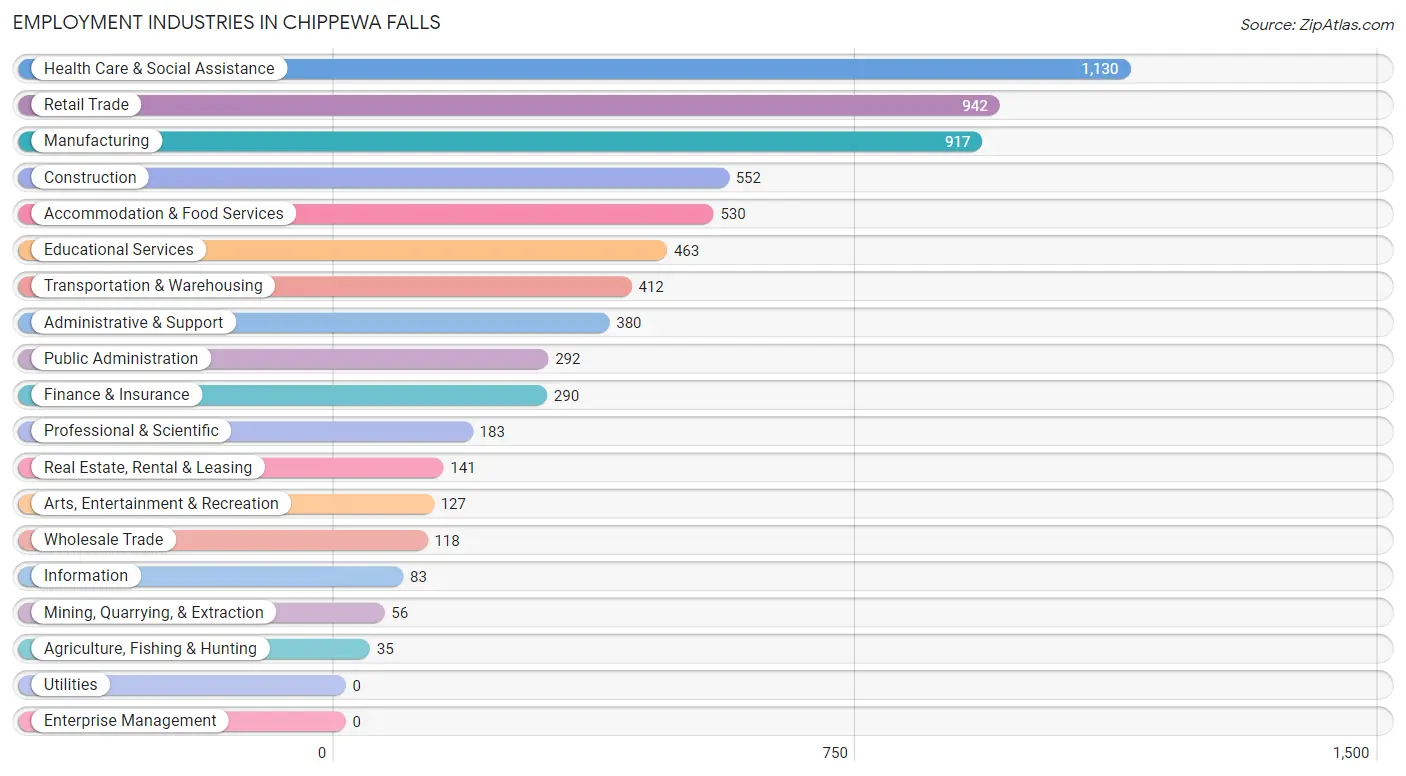
Employment Industries in Chippewa Falls
The major employment industries in Chippewa Falls include Health Care & Social Assistance (1,130 | 16.3%), Retail Trade (942 | 13.6%), Manufacturing (917 | 13.3%), Construction (552 | 8.0%), and Accommodation & Food Services (530 | 7.7%).
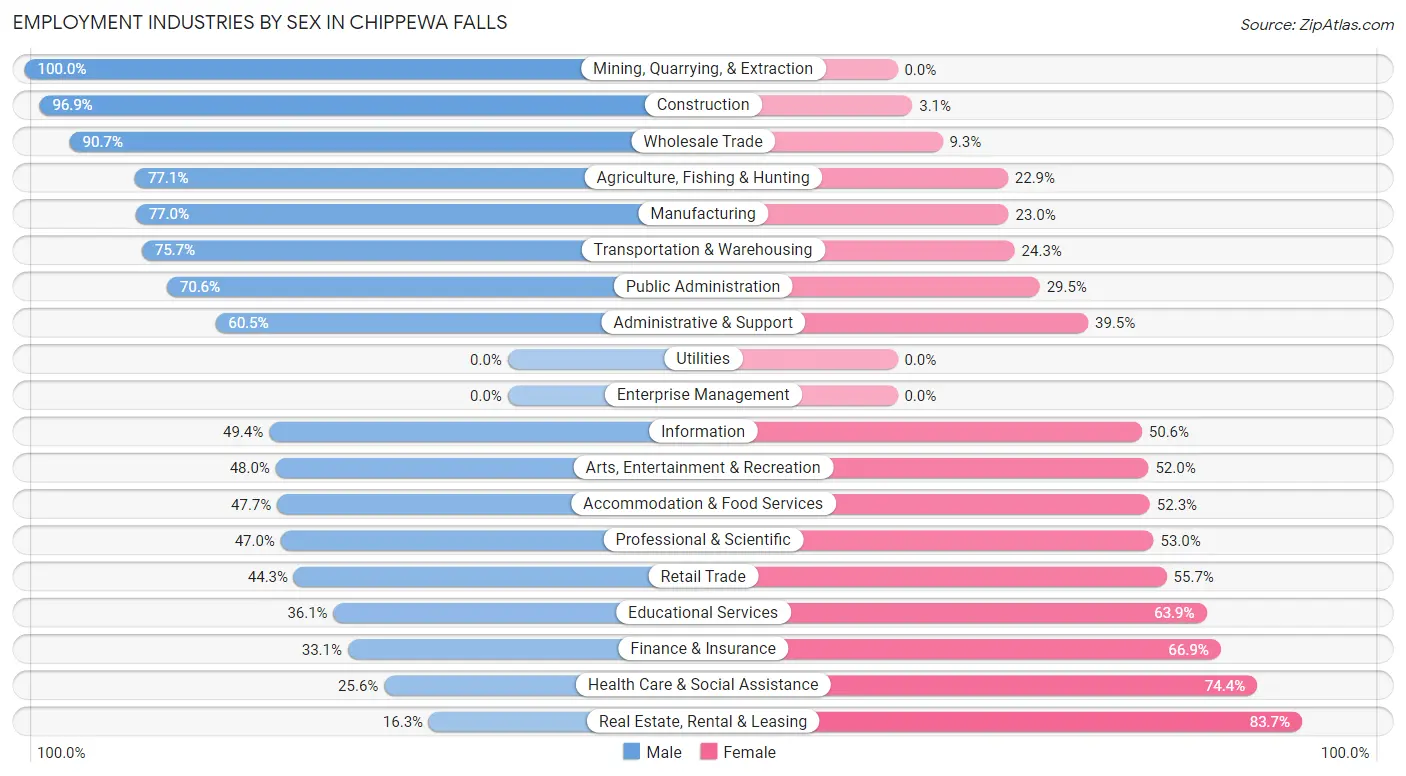
Employment Industries by Sex in Chippewa Falls
The Chippewa Falls industries that see more men than women are Mining, Quarrying, & Extraction (100.0%), Construction (96.9%), and Wholesale Trade (90.7%), whereas the industries that tend to have a higher number of women are Real Estate, Rental & Leasing (83.7%), Health Care & Social Assistance (74.4%), and Finance & Insurance (66.9%).
| Industry | Male | Female |
| Agriculture, Fishing & Hunting | 27 (77.1%) | 8 (22.9%) |
| Mining, Quarrying, & Extraction | 56 (100.0%) | 0 (0.0%) |
| Construction | 535 (96.9%) | 17 (3.1%) |
| Manufacturing | 706 (77.0%) | 211 (23.0%) |
| Wholesale Trade | 107 (90.7%) | 11 (9.3%) |
| Retail Trade | 417 (44.3%) | 525 (55.7%) |
| Transportation & Warehousing | 312 (75.7%) | 100 (24.3%) |
| Utilities | 0 (0.0%) | 0 (0.0%) |
| Information | 41 (49.4%) | 42 (50.6%) |
| Finance & Insurance | 96 (33.1%) | 194 (66.9%) |
| Real Estate, Rental & Leasing | 23 (16.3%) | 118 (83.7%) |
| Professional & Scientific | 86 (47.0%) | 97 (53.0%) |
| Enterprise Management | 0 (0.0%) | 0 (0.0%) |
| Administrative & Support | 230 (60.5%) | 150 (39.5%) |
| Educational Services | 167 (36.1%) | 296 (63.9%) |
| Health Care & Social Assistance | 289 (25.6%) | 841 (74.4%) |
| Arts, Entertainment & Recreation | 61 (48.0%) | 66 (52.0%) |
| Accommodation & Food Services | 253 (47.7%) | 277 (52.3%) |
| Public Administration | 206 (70.6%) | 86 (29.4%) |
| Total | 3,749 (54.2%) | 3,169 (45.8%) |
Education in Chippewa Falls
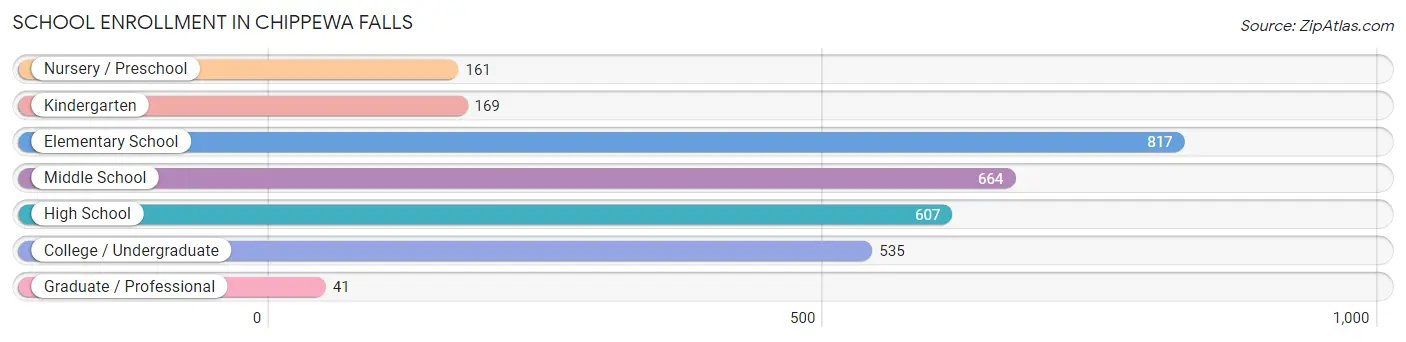
School Enrollment in Chippewa Falls
The most common levels of schooling among the 2,994 students in Chippewa Falls are elementary school (817 | 27.3%), middle school (664 | 22.2%), and high school (607 | 20.3%).
| School Level | # Students | % Students |
| Nursery / Preschool | 161 | 5.4% |
| Kindergarten | 169 | 5.6% |
| Elementary School | 817 | 27.3% |
| Middle School | 664 | 22.2% |
| High School | 607 | 20.3% |
| College / Undergraduate | 535 | 17.9% |
| Graduate / Professional | 41 | 1.4% |
| Total | 2,994 | 100.0% |
School Enrollment by Age by Funding Source in Chippewa Falls
Out of a total of 2,994 students who are enrolled in schools in Chippewa Falls, 479 (16.0%) attend a private institution, while the remaining 2,515 (84.0%) are enrolled in public schools. The age group of 18 to 19 year olds has the highest likelihood of being enrolled in private schools, with 106 (47.7% in the age bracket) enrolled. Conversely, the age group of 20 to 24 year olds has the lowest likelihood of being enrolled in a private school, with 229 (99.1% in the age bracket) attending a public institution.
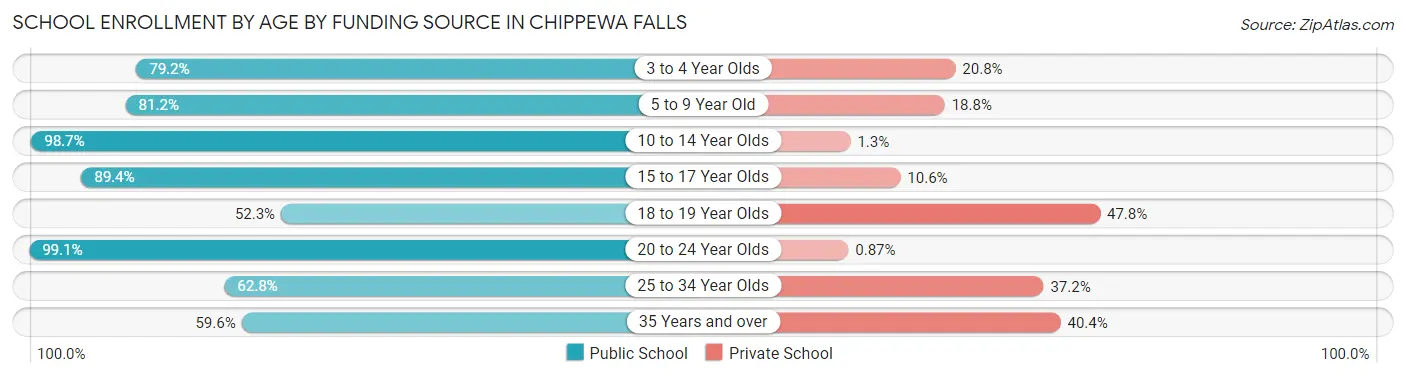
| Age Bracket | Public School | Private School |
| 3 to 4 Year Olds | 118 (79.2%) | 31 (20.8%) |
| 5 to 9 Year Old | 707 (81.2%) | 164 (18.8%) |
| 10 to 14 Year Olds | 782 (98.7%) | 10 (1.3%) |
| 15 to 17 Year Olds | 364 (89.4%) | 43 (10.6%) |
| 18 to 19 Year Olds | 116 (52.2%) | 106 (47.7%) |
| 20 to 24 Year Olds | 229 (99.1%) | 2 (0.9%) |
| 25 to 34 Year Olds | 140 (62.8%) | 83 (37.2%) |
| 35 Years and over | 59 (59.6%) | 40 (40.4%) |
| Total | 2,515 (84.0%) | 479 (16.0%) |
Educational Attainment by Field of Study in Chippewa Falls
Business (538 | 24.0%), education (328 | 14.7%), arts & humanities (223 | 10.0%), science & technology (191 | 8.5%), and bio, nature & agricultural (160 | 7.1%) are the most common fields of study among 2,237 individuals in Chippewa Falls who have obtained a bachelor's degree or higher.
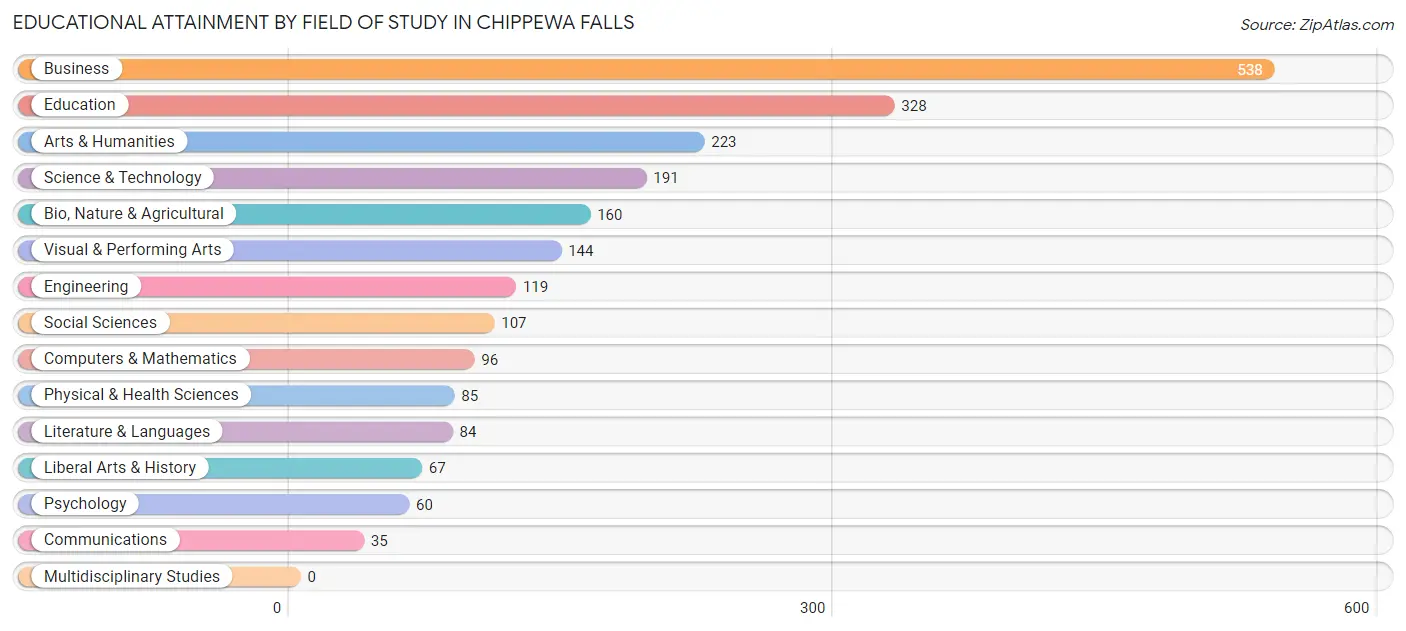
| Field of Study | # Graduates | % Graduates |
| Computers & Mathematics | 96 | 4.3% |
| Bio, Nature & Agricultural | 160 | 7.1% |
| Physical & Health Sciences | 85 | 3.8% |
| Psychology | 60 | 2.7% |
| Social Sciences | 107 | 4.8% |
| Engineering | 119 | 5.3% |
| Multidisciplinary Studies | 0 | 0.0% |
| Science & Technology | 191 | 8.5% |
| Business | 538 | 24.0% |
| Education | 328 | 14.7% |
| Literature & Languages | 84 | 3.8% |
| Liberal Arts & History | 67 | 3.0% |
| Visual & Performing Arts | 144 | 6.4% |
| Communications | 35 | 1.6% |
| Arts & Humanities | 223 | 10.0% |
| Total | 2,237 | 100.0% |
Transportation & Commute in Chippewa Falls
Vehicle Availability by Sex in Chippewa Falls
The most prevalent vehicle ownership categories in Chippewa Falls are males with 2 vehicles (1,867, accounting for 51.4%) and females with 2 vehicles (1,601, making up 59.5%).
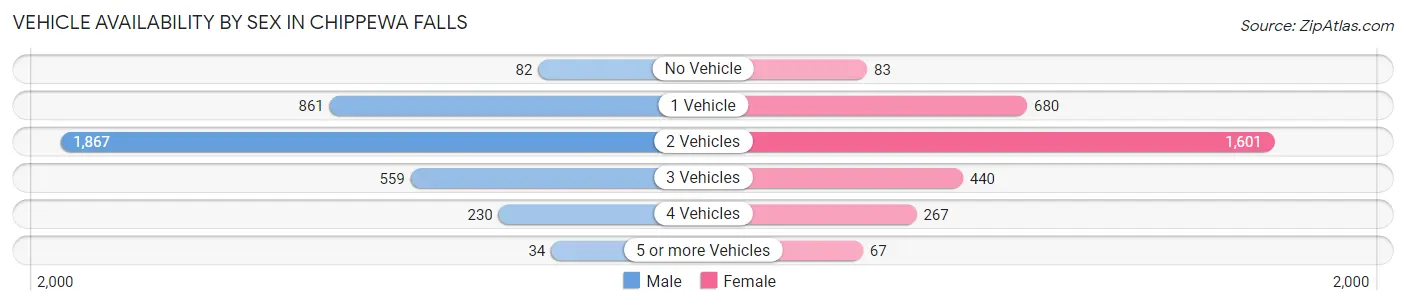
| Vehicles Available | Male | Female |
| No Vehicle | 82 (2.3%) | 83 (2.6%) |
| 1 Vehicle | 861 (23.7%) | 680 (21.7%) |
| 2 Vehicles | 1,867 (51.4%) | 1,601 (51.0%) |
| 3 Vehicles | 559 (15.4%) | 440 (14.0%) |
| 4 Vehicles | 230 (6.3%) | 267 (8.5%) |
| 5 or more Vehicles | 34 (0.9%) | 67 (2.1%) |
| Total | 3,633 (100.0%) | 3,138 (100.0%) |
Commute Time in Chippewa Falls
The most frequently occuring commute durations in Chippewa Falls are 5 to 9 minutes (1,346 commuters, 21.1%), 20 to 24 minutes (1,057 commuters, 16.5%), and 10 to 14 minutes (988 commuters, 15.5%).
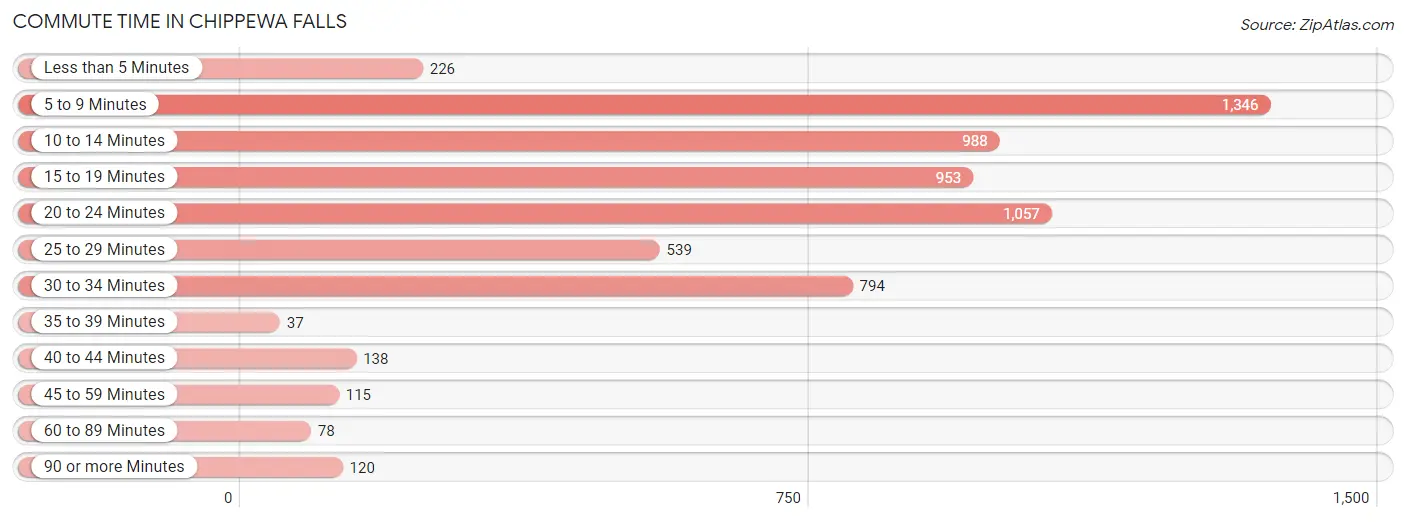
| Commute Time | # Commuters | % Commuters |
| Less than 5 Minutes | 226 | 3.5% |
| 5 to 9 Minutes | 1,346 | 21.1% |
| 10 to 14 Minutes | 988 | 15.5% |
| 15 to 19 Minutes | 953 | 14.9% |
| 20 to 24 Minutes | 1,057 | 16.5% |
| 25 to 29 Minutes | 539 | 8.4% |
| 30 to 34 Minutes | 794 | 12.4% |
| 35 to 39 Minutes | 37 | 0.6% |
| 40 to 44 Minutes | 138 | 2.2% |
| 45 to 59 Minutes | 115 | 1.8% |
| 60 to 89 Minutes | 78 | 1.2% |
| 90 or more Minutes | 120 | 1.9% |
Commute Time by Sex in Chippewa Falls
The most common commute times in Chippewa Falls are 5 to 9 minutes (826 commuters, 23.5%) for males and 5 to 9 minutes (520 commuters, 18.0%) for females.
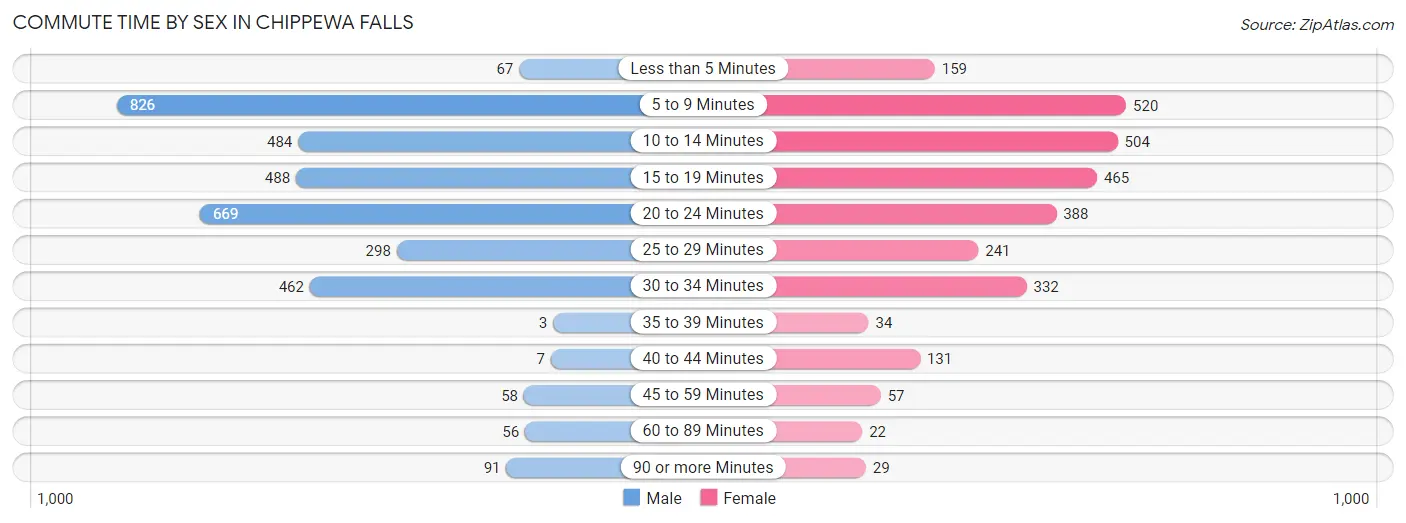
| Commute Time | Male | Female |
| Less than 5 Minutes | 67 (1.9%) | 159 (5.5%) |
| 5 to 9 Minutes | 826 (23.5%) | 520 (18.0%) |
| 10 to 14 Minutes | 484 (13.8%) | 504 (17.5%) |
| 15 to 19 Minutes | 488 (13.9%) | 465 (16.1%) |
| 20 to 24 Minutes | 669 (19.1%) | 388 (13.5%) |
| 25 to 29 Minutes | 298 (8.5%) | 241 (8.4%) |
| 30 to 34 Minutes | 462 (13.2%) | 332 (11.5%) |
| 35 to 39 Minutes | 3 (0.1%) | 34 (1.2%) |
| 40 to 44 Minutes | 7 (0.2%) | 131 (4.5%) |
| 45 to 59 Minutes | 58 (1.7%) | 57 (2.0%) |
| 60 to 89 Minutes | 56 (1.6%) | 22 (0.8%) |
| 90 or more Minutes | 91 (2.6%) | 29 (1.0%) |
Time of Departure to Work by Sex in Chippewa Falls
The most frequent times of departure to work in Chippewa Falls are 6:30 AM to 6:59 AM (708, 20.2%) for males and 7:30 AM to 7:59 AM (455, 15.8%) for females.
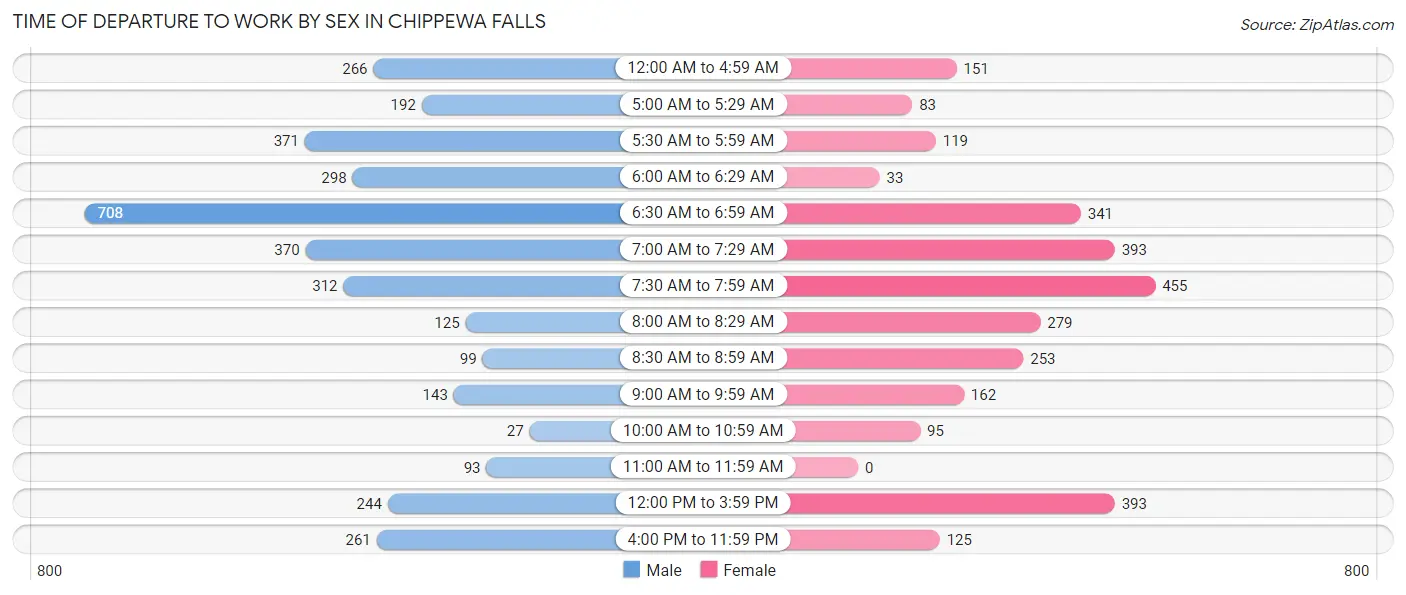
| Time of Departure | Male | Female |
| 12:00 AM to 4:59 AM | 266 (7.6%) | 151 (5.2%) |
| 5:00 AM to 5:29 AM | 192 (5.5%) | 83 (2.9%) |
| 5:30 AM to 5:59 AM | 371 (10.6%) | 119 (4.1%) |
| 6:00 AM to 6:29 AM | 298 (8.5%) | 33 (1.1%) |
| 6:30 AM to 6:59 AM | 708 (20.2%) | 341 (11.8%) |
| 7:00 AM to 7:29 AM | 370 (10.5%) | 393 (13.6%) |
| 7:30 AM to 7:59 AM | 312 (8.9%) | 455 (15.8%) |
| 8:00 AM to 8:29 AM | 125 (3.6%) | 279 (9.7%) |
| 8:30 AM to 8:59 AM | 99 (2.8%) | 253 (8.8%) |
| 9:00 AM to 9:59 AM | 143 (4.1%) | 162 (5.6%) |
| 10:00 AM to 10:59 AM | 27 (0.8%) | 95 (3.3%) |
| 11:00 AM to 11:59 AM | 93 (2.6%) | 0 (0.0%) |
| 12:00 PM to 3:59 PM | 244 (7.0%) | 393 (13.6%) |
| 4:00 PM to 11:59 PM | 261 (7.4%) | 125 (4.3%) |
| Total | 3,509 (100.0%) | 2,882 (100.0%) |
Housing Occupancy in Chippewa Falls
Occupancy by Ownership in Chippewa Falls
Of the total 6,360 dwellings in Chippewa Falls, owner-occupied units account for 3,253 (51.1%), while renter-occupied units make up 3,107 (48.8%).
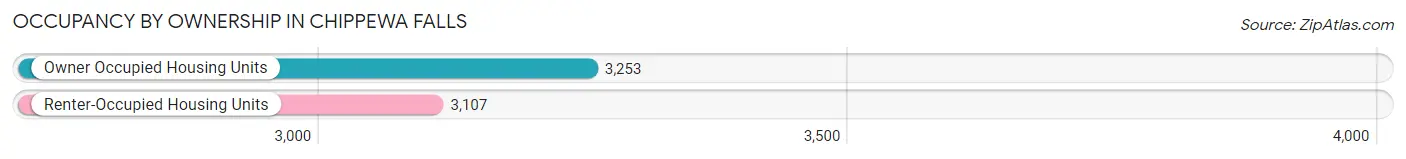
| Occupancy | # Housing Units | % Housing Units |
| Owner Occupied Housing Units | 3,253 | 51.1% |
| Renter-Occupied Housing Units | 3,107 | 48.8% |
| Total Occupied Housing Units | 6,360 | 100.0% |
Occupancy by Household Size in Chippewa Falls
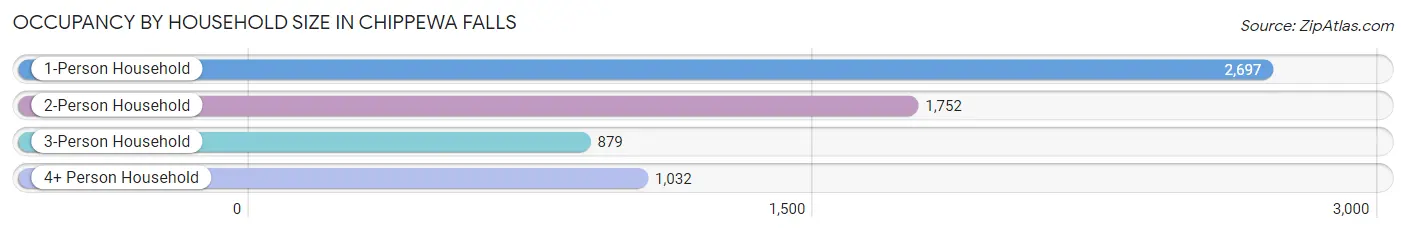
| Household Size | # Housing Units | % Housing Units |
| 1-Person Household | 2,697 | 42.4% |
| 2-Person Household | 1,752 | 27.6% |
| 3-Person Household | 879 | 13.8% |
| 4+ Person Household | 1,032 | 16.2% |
| Total Housing Units | 6,360 | 100.0% |
Occupancy by Ownership by Household Size in Chippewa Falls
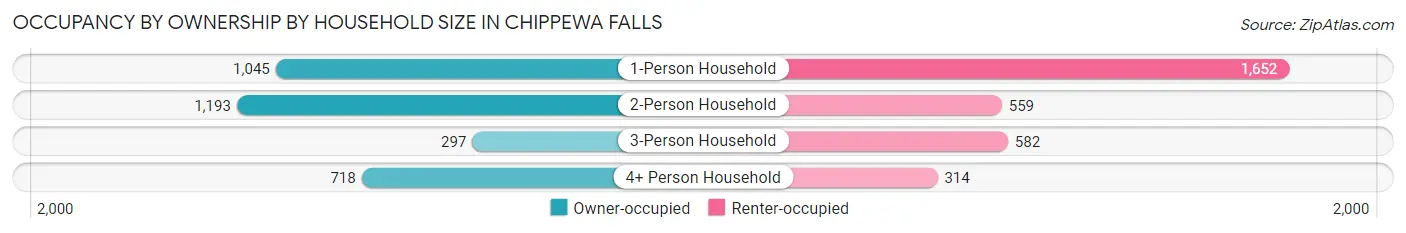
| Household Size | Owner-occupied | Renter-occupied |
| 1-Person Household | 1,045 (38.8%) | 1,652 (61.3%) |
| 2-Person Household | 1,193 (68.1%) | 559 (31.9%) |
| 3-Person Household | 297 (33.8%) | 582 (66.2%) |
| 4+ Person Household | 718 (69.6%) | 314 (30.4%) |
| Total Housing Units | 3,253 (51.1%) | 3,107 (48.8%) |
Occupancy by Educational Attainment in Chippewa Falls
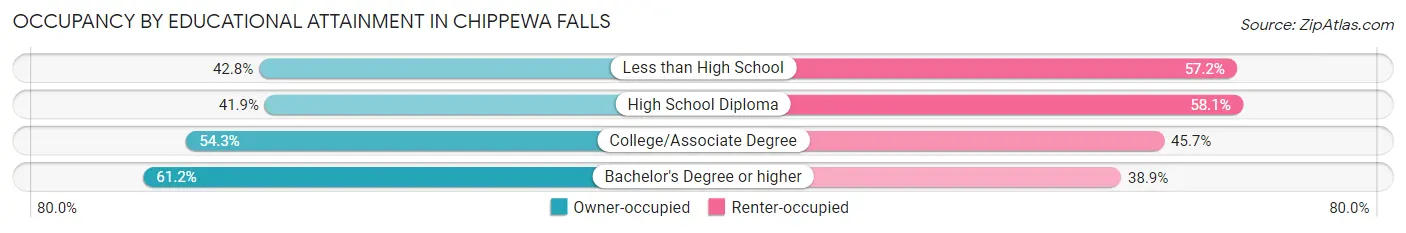
| Household Size | Owner-occupied | Renter-occupied |
| Less than High School | 170 (42.8%) | 227 (57.2%) |
| High School Diploma | 877 (41.9%) | 1,216 (58.1%) |
| College/Associate Degree | 1,279 (54.3%) | 1,075 (45.7%) |
| Bachelor's Degree or higher | 927 (61.2%) | 589 (38.9%) |
Occupancy by Age of Householder in Chippewa Falls
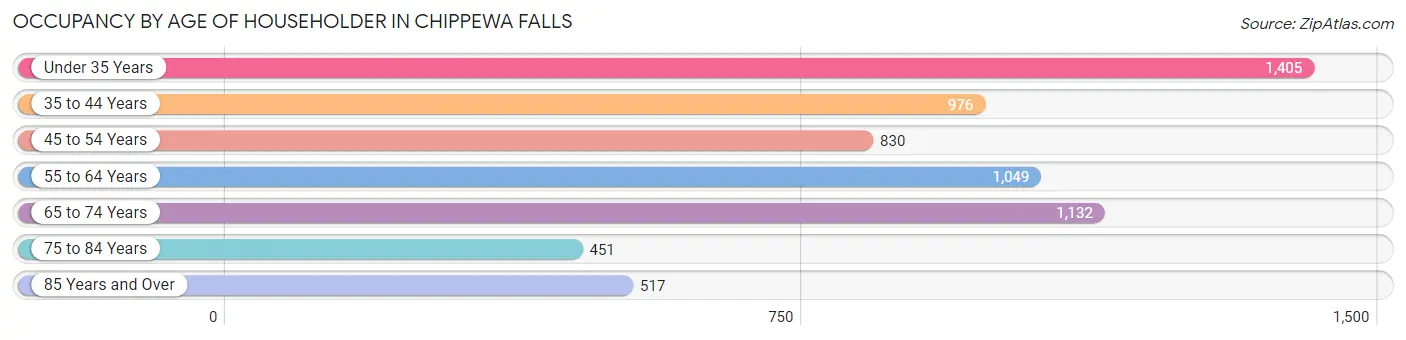
| Age Bracket | # Households | % Households |
| Under 35 Years | 1,405 | 22.1% |
| 35 to 44 Years | 976 | 15.3% |
| 45 to 54 Years | 830 | 13.1% |
| 55 to 64 Years | 1,049 | 16.5% |
| 65 to 74 Years | 1,132 | 17.8% |
| 75 to 84 Years | 451 | 7.1% |
| 85 Years and Over | 517 | 8.1% |
| Total | 6,360 | 100.0% |
Housing Finances in Chippewa Falls
Median Income by Occupancy in Chippewa Falls
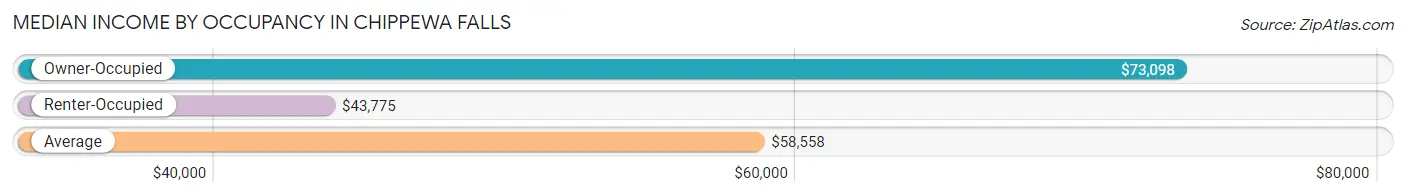
| Occupancy Type | # Households | Median Income |
| Owner-Occupied | 3,253 (51.1%) | $73,098 |
| Renter-Occupied | 3,107 (48.8%) | $43,775 |
| Average | 6,360 (100.0%) | $58,558 |
Occupancy by Householder Income Bracket in Chippewa Falls
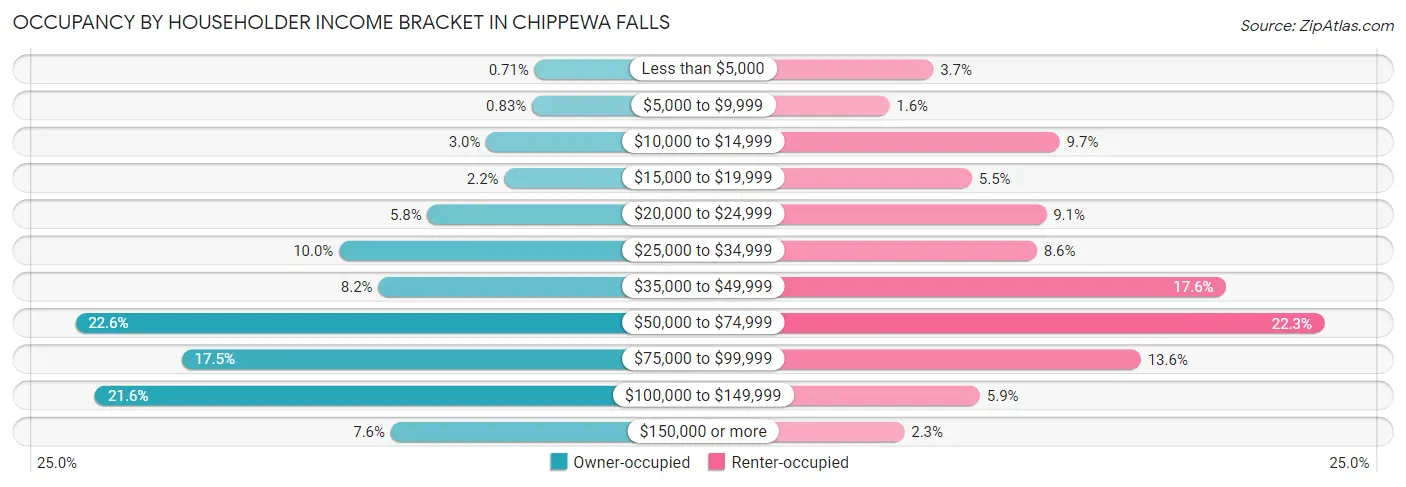
| Income Bracket | Owner-occupied | Renter-occupied |
| Less than $5,000 | 23 (0.7%) | 115 (3.7%) |
| $5,000 to $9,999 | 27 (0.8%) | 50 (1.6%) |
| $10,000 to $14,999 | 98 (3.0%) | 302 (9.7%) |
| $15,000 to $19,999 | 70 (2.1%) | 172 (5.5%) |
| $20,000 to $24,999 | 189 (5.8%) | 282 (9.1%) |
| $25,000 to $34,999 | 326 (10.0%) | 268 (8.6%) |
| $35,000 to $49,999 | 265 (8.2%) | 547 (17.6%) |
| $50,000 to $74,999 | 735 (22.6%) | 693 (22.3%) |
| $75,000 to $99,999 | 570 (17.5%) | 422 (13.6%) |
| $100,000 to $149,999 | 704 (21.6%) | 184 (5.9%) |
| $150,000 or more | 246 (7.6%) | 72 (2.3%) |
| Total | 3,253 (100.0%) | 3,107 (100.0%) |
Monthly Housing Cost Tiers in Chippewa Falls
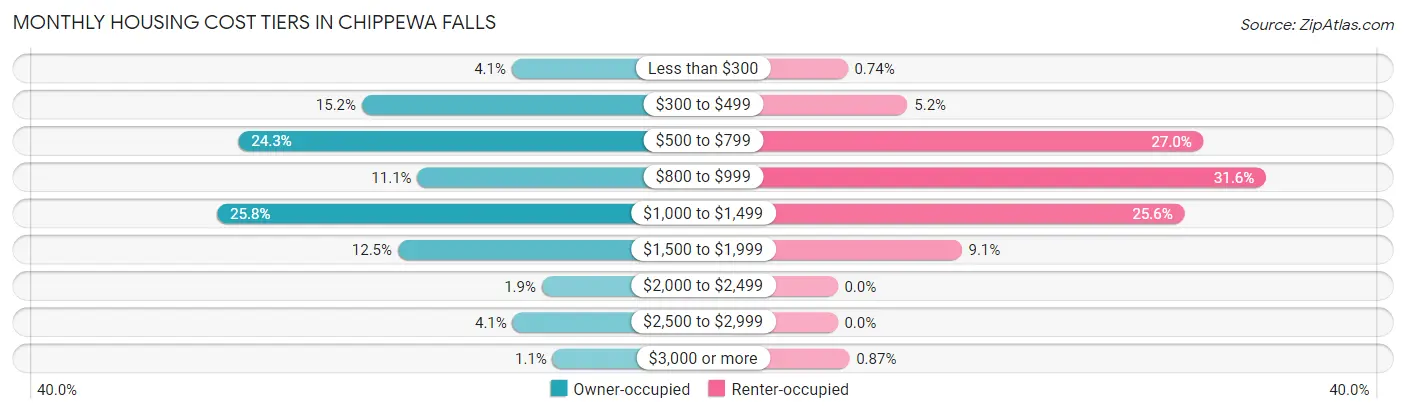
| Monthly Cost | Owner-occupied | Renter-occupied |
| Less than $300 | 134 (4.1%) | 23 (0.7%) |
| $300 to $499 | 493 (15.2%) | 160 (5.1%) |
| $500 to $799 | 789 (24.2%) | 838 (27.0%) |
| $800 to $999 | 360 (11.1%) | 981 (31.6%) |
| $1,000 to $1,499 | 840 (25.8%) | 794 (25.6%) |
| $1,500 to $1,999 | 407 (12.5%) | 284 (9.1%) |
| $2,000 to $2,499 | 62 (1.9%) | 0 (0.0%) |
| $2,500 to $2,999 | 132 (4.1%) | 0 (0.0%) |
| $3,000 or more | 36 (1.1%) | 27 (0.9%) |
| Total | 3,253 (100.0%) | 3,107 (100.0%) |
Physical Housing Characteristics in Chippewa Falls
Housing Structures in Chippewa Falls
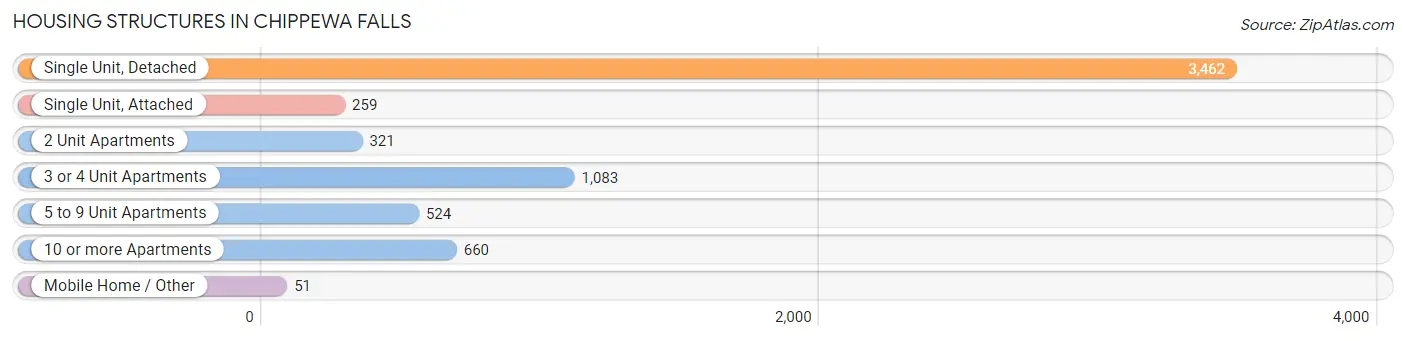
| Structure Type | # Housing Units | % Housing Units |
| Single Unit, Detached | 3,462 | 54.4% |
| Single Unit, Attached | 259 | 4.1% |
| 2 Unit Apartments | 321 | 5.1% |
| 3 or 4 Unit Apartments | 1,083 | 17.0% |
| 5 to 9 Unit Apartments | 524 | 8.2% |
| 10 or more Apartments | 660 | 10.4% |
| Mobile Home / Other | 51 | 0.8% |
| Total | 6,360 | 100.0% |
Housing Structures by Occupancy in Chippewa Falls
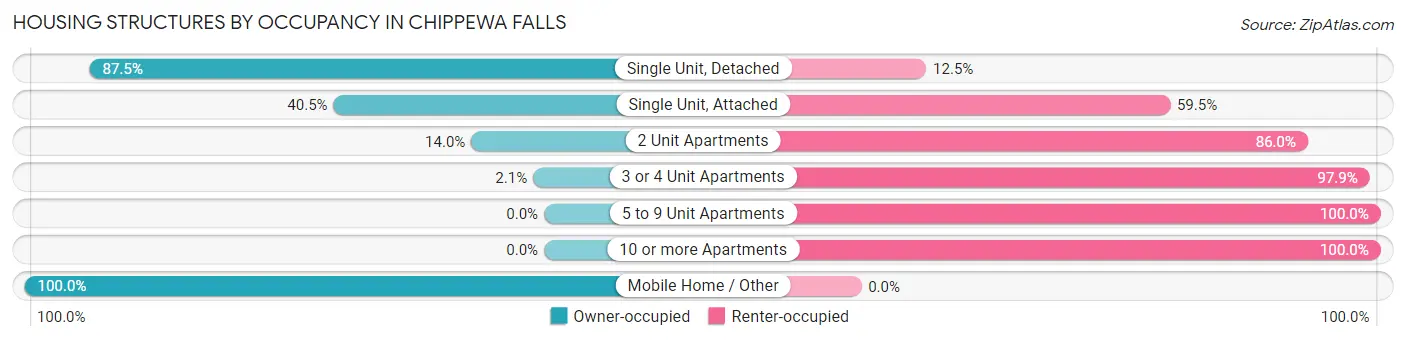
| Structure Type | Owner-occupied | Renter-occupied |
| Single Unit, Detached | 3,029 (87.5%) | 433 (12.5%) |
| Single Unit, Attached | 105 (40.5%) | 154 (59.5%) |
| 2 Unit Apartments | 45 (14.0%) | 276 (86.0%) |
| 3 or 4 Unit Apartments | 23 (2.1%) | 1,060 (97.9%) |
| 5 to 9 Unit Apartments | 0 (0.0%) | 524 (100.0%) |
| 10 or more Apartments | 0 (0.0%) | 660 (100.0%) |
| Mobile Home / Other | 51 (100.0%) | 0 (0.0%) |
| Total | 3,253 (51.1%) | 3,107 (48.8%) |
Housing Structures by Number of Rooms in Chippewa Falls
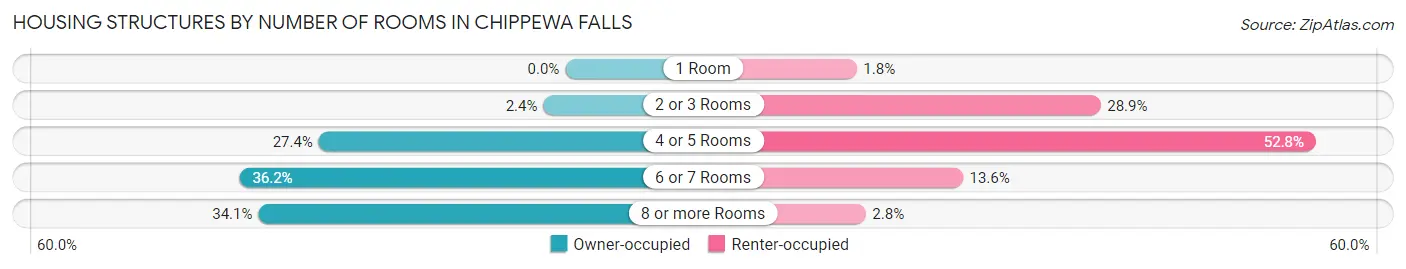
| Number of Rooms | Owner-occupied | Renter-occupied |
| 1 Room | 0 (0.0%) | 57 (1.8%) |
| 2 or 3 Rooms | 79 (2.4%) | 898 (28.9%) |
| 4 or 5 Rooms | 890 (27.4%) | 1,641 (52.8%) |
| 6 or 7 Rooms | 1,176 (36.1%) | 423 (13.6%) |
| 8 or more Rooms | 1,108 (34.1%) | 88 (2.8%) |
| Total | 3,253 (100.0%) | 3,107 (100.0%) |
Housing Structure by Heating Type in Chippewa Falls
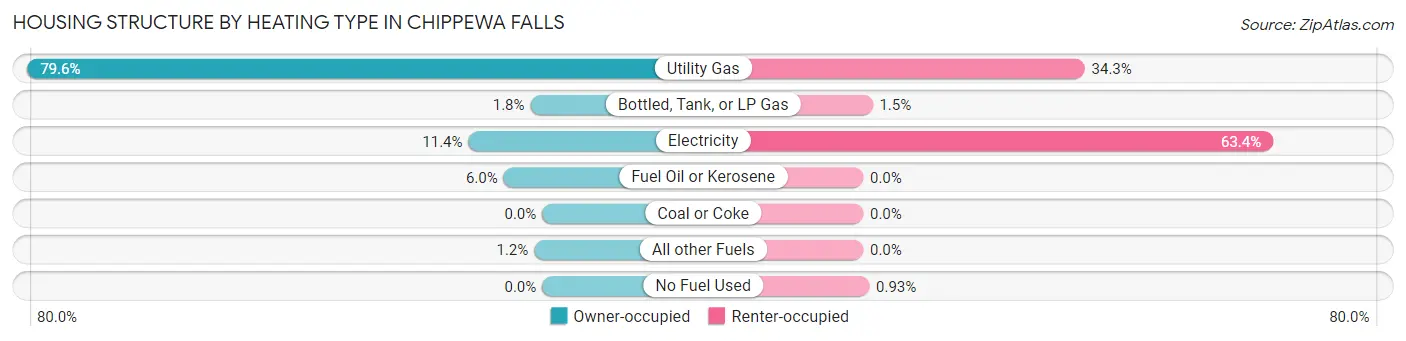
| Heating Type | Owner-occupied | Renter-occupied |
| Utility Gas | 2,589 (79.6%) | 1,064 (34.3%) |
| Bottled, Tank, or LP Gas | 59 (1.8%) | 45 (1.5%) |
| Electricity | 371 (11.4%) | 1,969 (63.4%) |
| Fuel Oil or Kerosene | 194 (6.0%) | 0 (0.0%) |
| Coal or Coke | 0 (0.0%) | 0 (0.0%) |
| All other Fuels | 40 (1.2%) | 0 (0.0%) |
| No Fuel Used | 0 (0.0%) | 29 (0.9%) |
| Total | 3,253 (100.0%) | 3,107 (100.0%) |
Household Vehicle Usage in Chippewa Falls
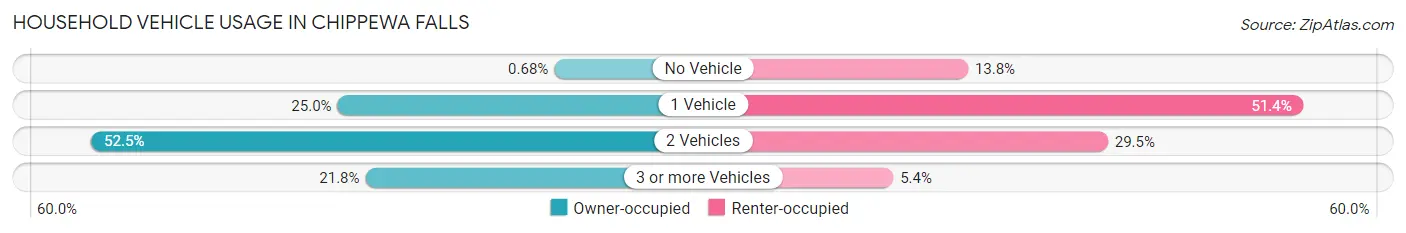
| Vehicles per Household | Owner-occupied | Renter-occupied |
| No Vehicle | 22 (0.7%) | 428 (13.8%) |
| 1 Vehicle | 812 (25.0%) | 1,596 (51.4%) |
| 2 Vehicles | 1,709 (52.5%) | 915 (29.4%) |
| 3 or more Vehicles | 710 (21.8%) | 168 (5.4%) |
| Total | 3,253 (100.0%) | 3,107 (100.0%) |
Real Estate & Mortgages in Chippewa Falls
Real Estate and Mortgage Overview in Chippewa Falls
| Characteristic | Without Mortgage | With Mortgage |
| Housing Units | 1,471 | 1,782 |
| Median Property Value | $165,800 | $181,900 |
| Median Household Income | $64,788 | $149 |
| Monthly Housing Costs | $528 | $36 |
| Real Estate Taxes | $2,468 | $16 |
Property Value by Mortgage Status in Chippewa Falls
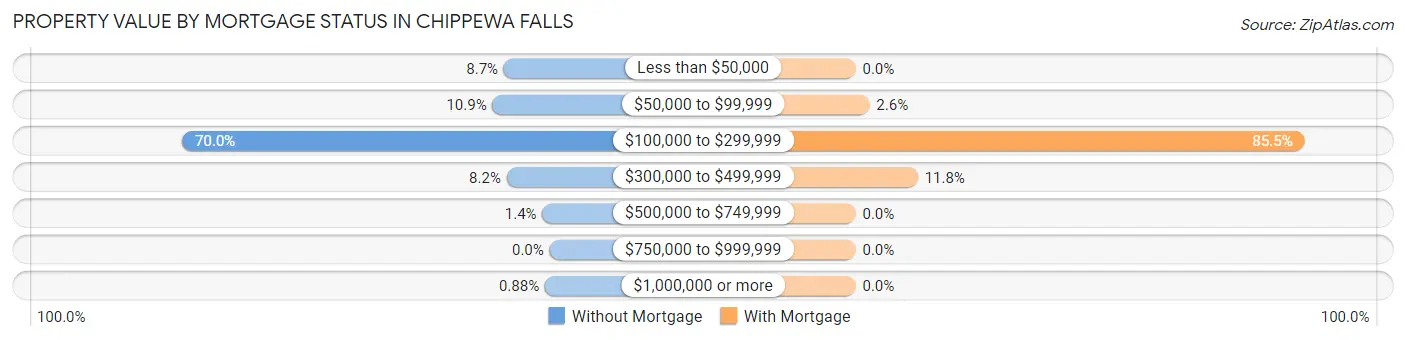
| Property Value | Without Mortgage | With Mortgage |
| Less than $50,000 | 128 (8.7%) | 0 (0.0%) |
| $50,000 to $99,999 | 160 (10.9%) | 47 (2.6%) |
| $100,000 to $299,999 | 1,030 (70.0%) | 1,524 (85.5%) |
| $300,000 to $499,999 | 120 (8.2%) | 211 (11.8%) |
| $500,000 to $749,999 | 20 (1.4%) | 0 (0.0%) |
| $750,000 to $999,999 | 0 (0.0%) | 0 (0.0%) |
| $1,000,000 or more | 13 (0.9%) | 0 (0.0%) |
| Total | 1,471 (100.0%) | 1,782 (100.0%) |
Household Income by Mortgage Status in Chippewa Falls
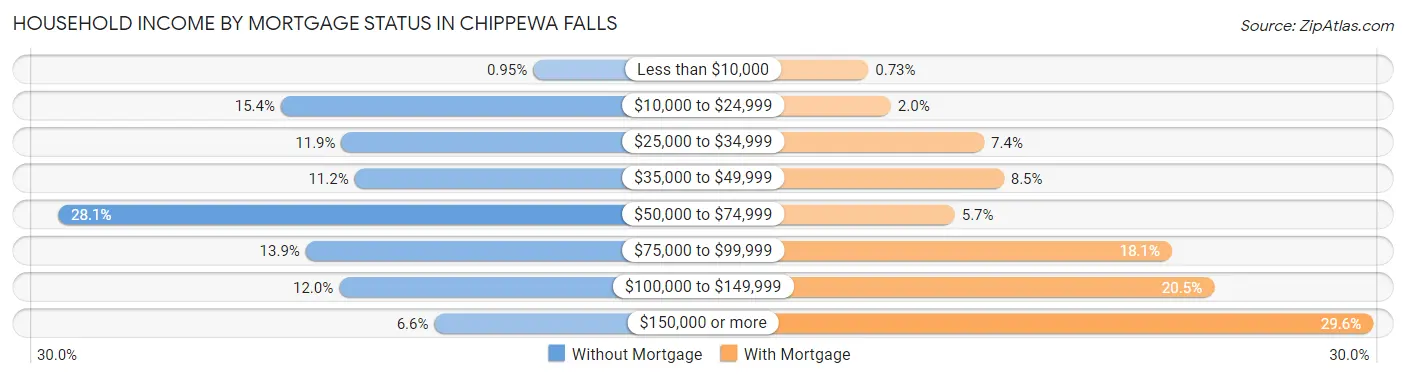
| Household Income | Without Mortgage | With Mortgage |
| Less than $10,000 | 14 (0.9%) | 13 (0.7%) |
| $10,000 to $24,999 | 226 (15.4%) | 36 (2.0%) |
| $25,000 to $34,999 | 175 (11.9%) | 131 (7.3%) |
| $35,000 to $49,999 | 164 (11.2%) | 151 (8.5%) |
| $50,000 to $74,999 | 413 (28.1%) | 101 (5.7%) |
| $75,000 to $99,999 | 205 (13.9%) | 322 (18.1%) |
| $100,000 to $149,999 | 177 (12.0%) | 365 (20.5%) |
| $150,000 or more | 97 (6.6%) | 527 (29.6%) |
| Total | 1,471 (100.0%) | 1,782 (100.0%) |
Property Value to Household Income Ratio in Chippewa Falls
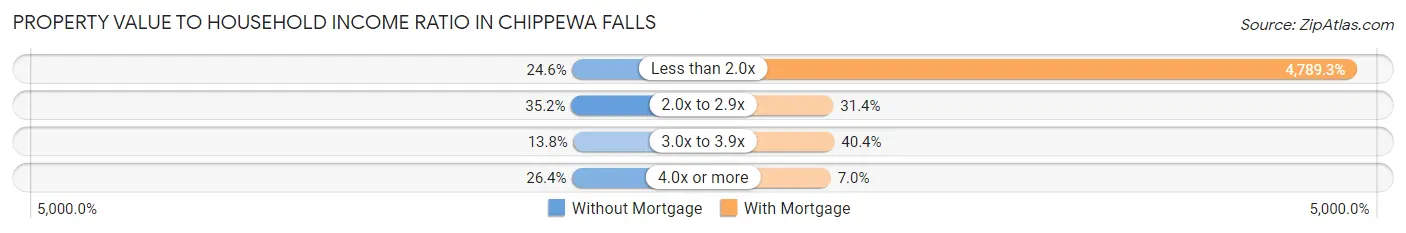
| Value-to-Income Ratio | Without Mortgage | With Mortgage |
| Less than 2.0x | 362 (24.6%) | 85,345 (4,789.3%) |
| 2.0x to 2.9x | 518 (35.2%) | 559 (31.4%) |
| 3.0x to 3.9x | 203 (13.8%) | 720 (40.4%) |
| 4.0x or more | 388 (26.4%) | 125 (7.0%) |
| Total | 1,471 (100.0%) | 1,782 (100.0%) |
Real Estate Taxes by Mortgage Status in Chippewa Falls
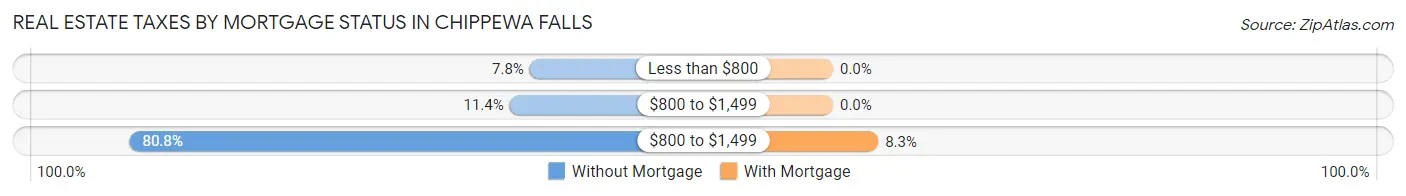
| Property Taxes | Without Mortgage | With Mortgage |
| Less than $800 | 114 (7.7%) | 0 (0.0%) |
| $800 to $1,499 | 168 (11.4%) | 0 (0.0%) |
| $800 to $1,499 | 1,189 (80.8%) | 147 (8.3%) |
| Total | 1,471 (100.0%) | 1,782 (100.0%) |
Health & Disability in Chippewa Falls
Health Insurance Coverage by Age in Chippewa Falls
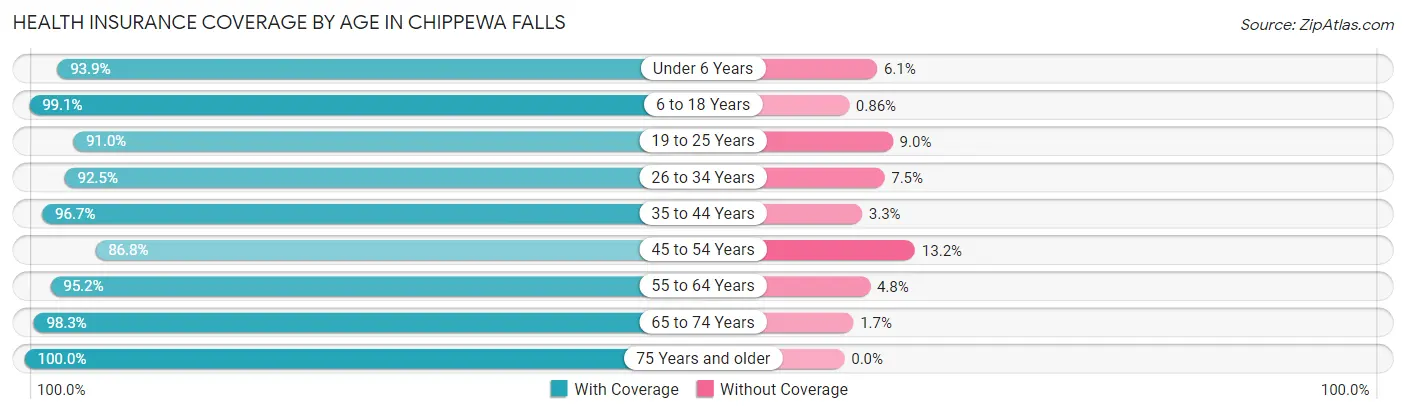
| Age Bracket | With Coverage | Without Coverage |
| Under 6 Years | 940 (93.9%) | 61 (6.1%) |
| 6 to 18 Years | 2,189 (99.1%) | 19 (0.9%) |
| 19 to 25 Years | 1,311 (91.0%) | 130 (9.0%) |
| 26 to 34 Years | 1,502 (92.5%) | 121 (7.5%) |
| 35 to 44 Years | 1,657 (96.7%) | 56 (3.3%) |
| 45 to 54 Years | 1,292 (86.8%) | 196 (13.2%) |
| 55 to 64 Years | 1,510 (95.2%) | 76 (4.8%) |
| 65 to 74 Years | 1,485 (98.3%) | 25 (1.7%) |
| 75 Years and older | 1,239 (100.0%) | 0 (0.0%) |
| Total | 13,125 (95.1%) | 684 (5.0%) |
Health Insurance Coverage by Citizenship Status in Chippewa Falls
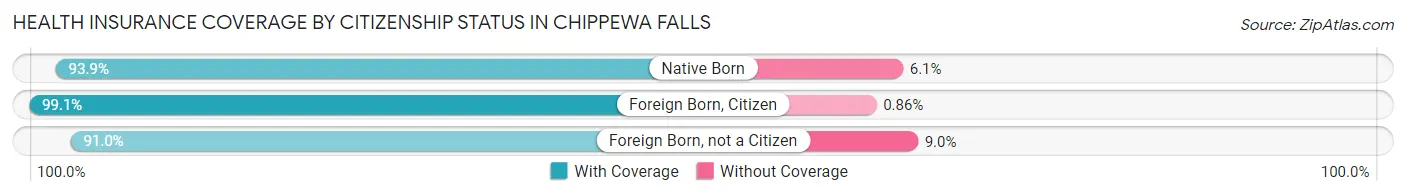
| Citizenship Status | With Coverage | Without Coverage |
| Native Born | 940 (93.9%) | 61 (6.1%) |
| Foreign Born, Citizen | 2,189 (99.1%) | 19 (0.9%) |
| Foreign Born, not a Citizen | 1,311 (91.0%) | 130 (9.0%) |
Health Insurance Coverage by Household Income in Chippewa Falls
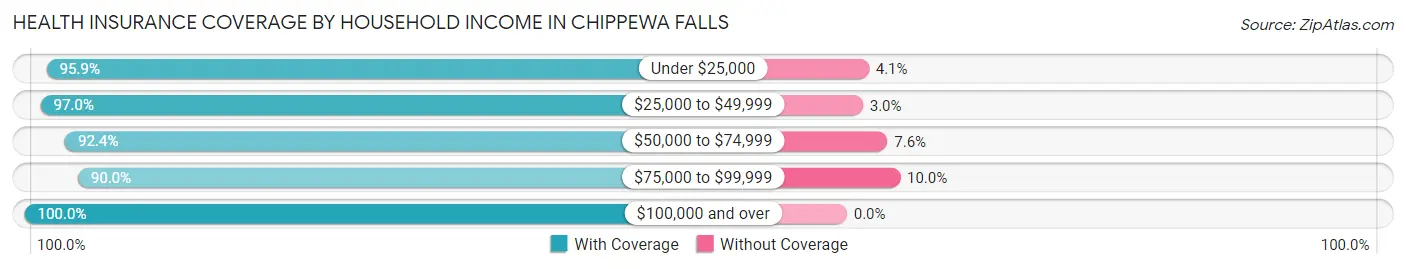
| Household Income | With Coverage | Without Coverage |
| Under $25,000 | 1,976 (95.9%) | 85 (4.1%) |
| $25,000 to $49,999 | 2,722 (97.0%) | 84 (3.0%) |
| $50,000 to $74,999 | 2,570 (92.4%) | 211 (7.6%) |
| $75,000 to $99,999 | 2,426 (90.0%) | 269 (10.0%) |
| $100,000 and over | 3,319 (100.0%) | 0 (0.0%) |
Public vs Private Health Insurance Coverage by Age in Chippewa Falls
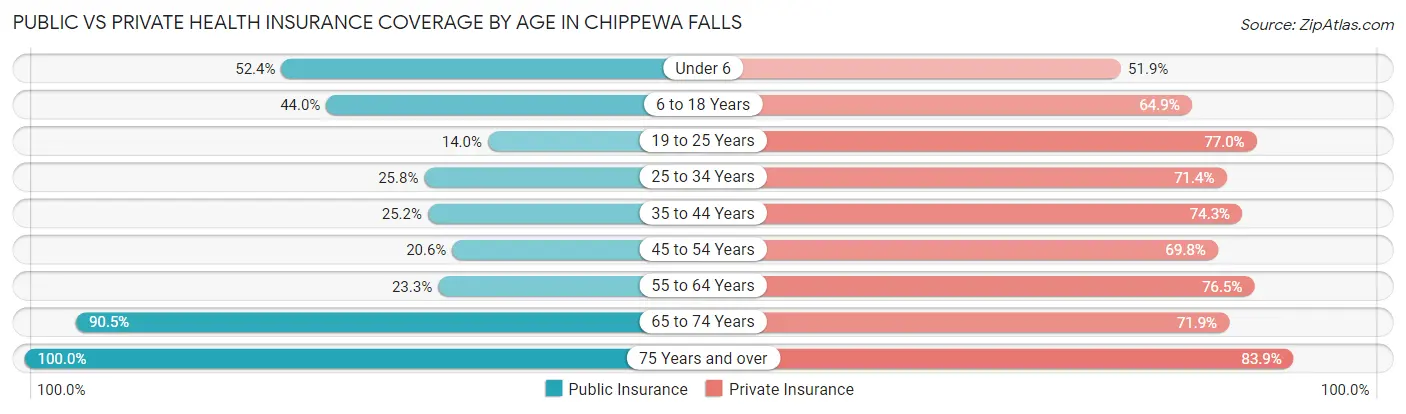
| Age Bracket | Public Insurance | Private Insurance |
| Under 6 | 524 (52.3%) | 519 (51.8%) |
| 6 to 18 Years | 972 (44.0%) | 1,433 (64.9%) |
| 19 to 25 Years | 202 (14.0%) | 1,109 (77.0%) |
| 25 to 34 Years | 419 (25.8%) | 1,158 (71.4%) |
| 35 to 44 Years | 431 (25.2%) | 1,272 (74.3%) |
| 45 to 54 Years | 307 (20.6%) | 1,038 (69.8%) |
| 55 to 64 Years | 369 (23.3%) | 1,214 (76.5%) |
| 65 to 74 Years | 1,366 (90.5%) | 1,085 (71.9%) |
| 75 Years and over | 1,239 (100.0%) | 1,039 (83.9%) |
| Total | 5,829 (42.2%) | 9,867 (71.5%) |
Disability Status by Sex by Age in Chippewa Falls
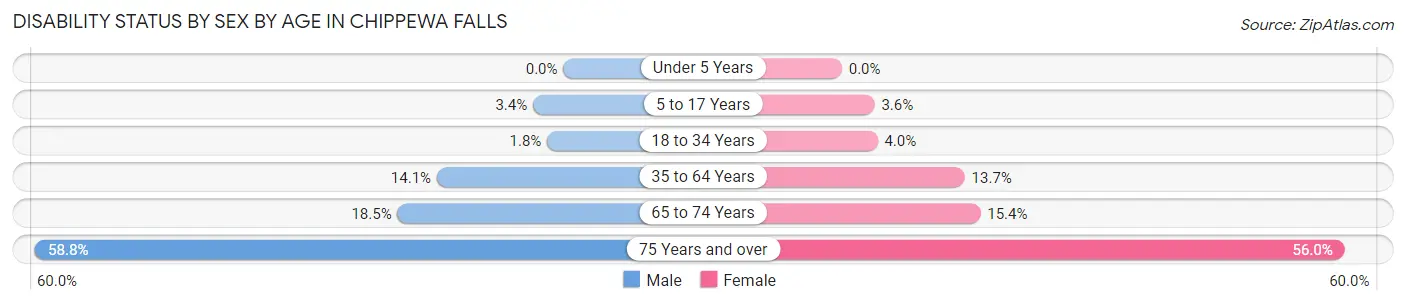
| Age Bracket | Male | Female |
| Under 5 Years | 0 (0.0%) | 0 (0.0%) |
| 5 to 17 Years | 34 (3.4%) | 39 (3.6%) |
| 18 to 34 Years | 34 (1.8%) | 57 (4.0%) |
| 35 to 64 Years | 319 (14.1%) | 345 (13.7%) |
| 65 to 74 Years | 116 (18.5%) | 136 (15.4%) |
| 75 Years and over | 190 (58.8%) | 513 (56.0%) |
Disability Class by Sex by Age in Chippewa Falls
Disability Class: Hearing Difficulty
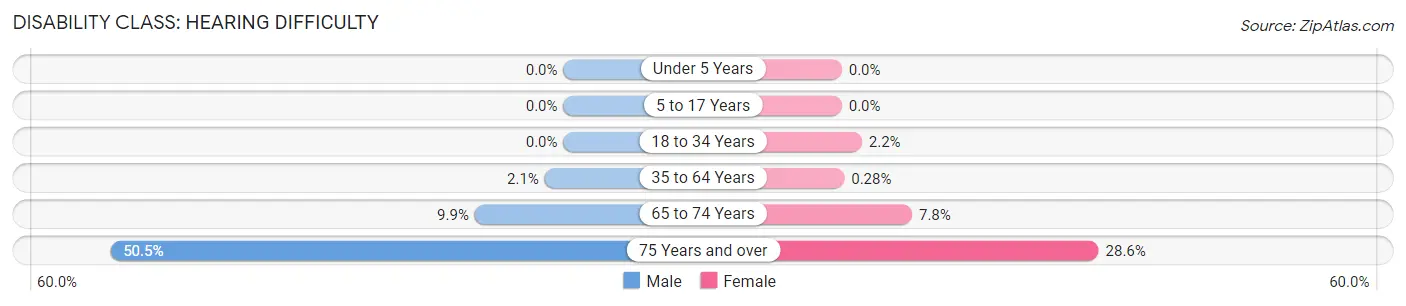
| Age Bracket | Male | Female |
| Under 5 Years | 0 (0.0%) | 0 (0.0%) |
| 5 to 17 Years | 0 (0.0%) | 0 (0.0%) |
| 18 to 34 Years | 0 (0.0%) | 32 (2.2%) |
| 35 to 64 Years | 47 (2.1%) | 7 (0.3%) |
| 65 to 74 Years | 62 (9.9%) | 69 (7.8%) |
| 75 Years and over | 163 (50.5%) | 262 (28.6%) |
Disability Class: Vision Difficulty
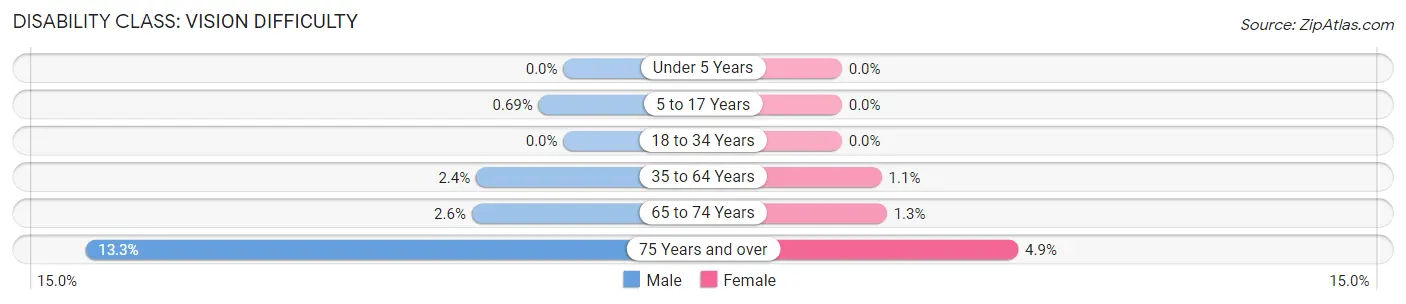
| Age Bracket | Male | Female |
| Under 5 Years | 0 (0.0%) | 0 (0.0%) |
| 5 to 17 Years | 7 (0.7%) | 0 (0.0%) |
| 18 to 34 Years | 0 (0.0%) | 0 (0.0%) |
| 35 to 64 Years | 55 (2.4%) | 28 (1.1%) |
| 65 to 74 Years | 16 (2.5%) | 11 (1.3%) |
| 75 Years and over | 43 (13.3%) | 45 (4.9%) |
Disability Class: Cognitive Difficulty
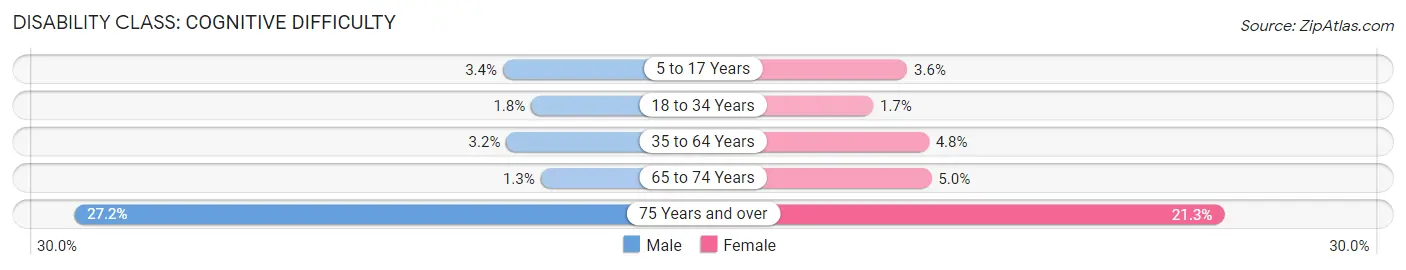
| Age Bracket | Male | Female |
| 5 to 17 Years | 34 (3.4%) | 39 (3.6%) |
| 18 to 34 Years | 34 (1.8%) | 25 (1.7%) |
| 35 to 64 Years | 72 (3.2%) | 122 (4.8%) |
| 65 to 74 Years | 8 (1.3%) | 44 (5.0%) |
| 75 Years and over | 88 (27.2%) | 195 (21.3%) |
Disability Class: Ambulatory Difficulty
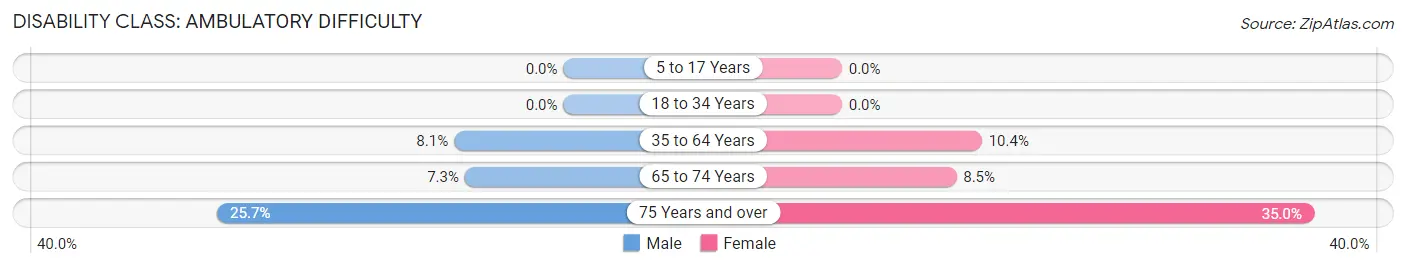
| Age Bracket | Male | Female |
| 5 to 17 Years | 0 (0.0%) | 0 (0.0%) |
| 18 to 34 Years | 0 (0.0%) | 0 (0.0%) |
| 35 to 64 Years | 184 (8.1%) | 262 (10.4%) |
| 65 to 74 Years | 46 (7.3%) | 75 (8.5%) |
| 75 Years and over | 83 (25.7%) | 321 (35.0%) |
Disability Class: Self-Care Difficulty
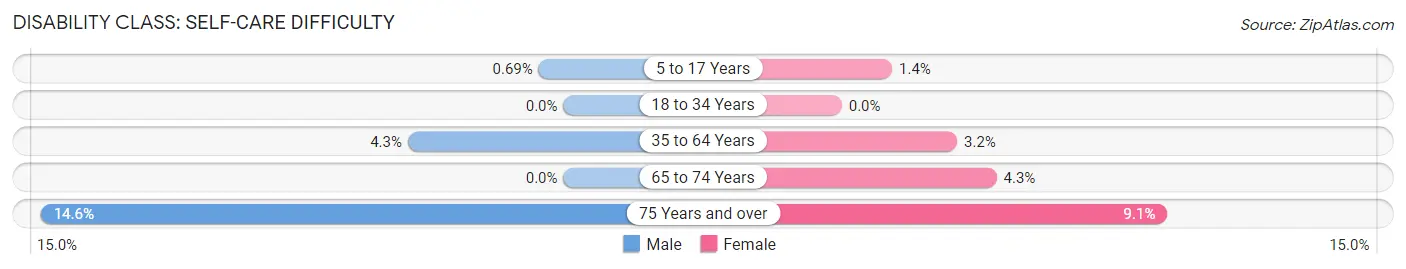
| Age Bracket | Male | Female |
| 5 to 17 Years | 7 (0.7%) | 15 (1.4%) |
| 18 to 34 Years | 0 (0.0%) | 0 (0.0%) |
| 35 to 64 Years | 98 (4.3%) | 81 (3.2%) |
| 65 to 74 Years | 0 (0.0%) | 38 (4.3%) |
| 75 Years and over | 47 (14.5%) | 83 (9.1%) |
Technology Access in Chippewa Falls
Computing Device Access in Chippewa Falls
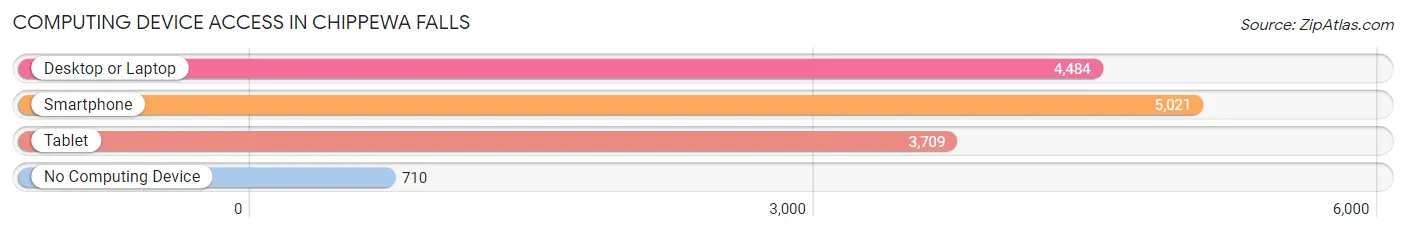
| Device Type | # Households | % Households |
| Desktop or Laptop | 4,484 | 70.5% |
| Smartphone | 5,021 | 78.9% |
| Tablet | 3,709 | 58.3% |
| No Computing Device | 710 | 11.2% |
| Total | 6,360 | 100.0% |
Internet Access in Chippewa Falls
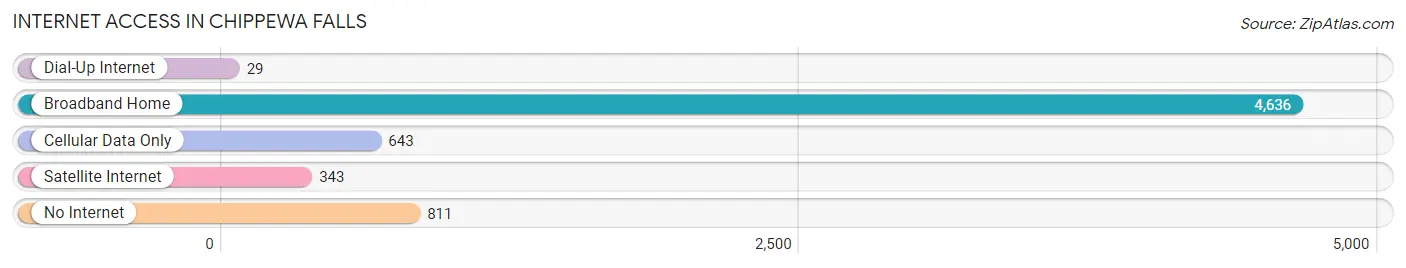
| Internet Type | # Households | % Households |
| Dial-Up Internet | 29 | 0.5% |
| Broadband Home | 4,636 | 72.9% |
| Cellular Data Only | 643 | 10.1% |
| Satellite Internet | 343 | 5.4% |
| No Internet | 811 | 12.8% |
| Total | 6,360 | 100.0% |
Chippewa Falls Summary
Chippewa Falls, Wisconsin is a city located in Chippewa County, Wisconsin, United States. The population was 13,661 at the 2010 census. It is the county seat of Chippewa County. The city's name originated from its location on the Chippewa River, which flows through the city.
History
The area that is now Chippewa Falls was originally inhabited by the Ojibwe people. The first white settlers arrived in the area in the early 1800s. The first permanent settlement was established in 1845 by a group of settlers from New York. The settlement was named Chippewa Falls after the Chippewa River, which flows through the city.
In 1854, the city was incorporated as a village. The city grew rapidly in the late 19th century, and by 1900, it had a population of over 5,000. The city continued to grow in the 20th century, and by the 2010 census, the population had grown to over 13,000.
Geography
Chippewa Falls is located at 44°55'N 91°22'W (44.914, -91.367). The city is situated on the Chippewa River, which flows through the city. The city is located in the northwest corner of Wisconsin, near the Minnesota border.
The city has a total area of 8.2 square miles, of which 8.1 square miles is land and 0.1 square miles is water. The city is located in a hilly region, with the highest point being 1,000 feet above sea level.
Economy
Chippewa Falls is a major economic center in the region. The city is home to several large employers, including the Chippewa Valley Regional Airport, the Chippewa Valley Technical College, and the Chippewa Valley Hospital. The city is also home to several manufacturing companies, including the Chippewa Valley Ethanol Company, the Chippewa Valley Cheese Company, and the Chippewa Valley Paper Company.
The city is also home to several retail stores, restaurants, and other businesses. The city is a popular tourist destination, and is home to several attractions, including the Chippewa Falls Museum of Industry and Technology, the Chippewa Falls Public Library, and the Chippewa Falls Water Park.
Demographics
As of the 2010 census, the population of Chippewa Falls was 13,661. The racial makeup of the city was 94.2% White, 0.7% African American, 0.4% Native American, 0.7% Asian, 0.1% Pacific Islander, 2.2% from other races, and 1.7% from two or more races. Hispanic or Latino of any race were 4.2% of the population.
The median income for a household in the city was $41,945, and the median income for a family was $51,945. The per capita income for the city was $20,945. About 8.2% of families and 11.2% of the population were below the poverty line, including 16.2% of those under age 18 and 8.2% of those age 65 or over.
Common Questions
What is Per Capita Income in Chippewa Falls?
Per Capita income in Chippewa Falls is $29,967.
What is the Median Family Income in Chippewa Falls?
Median Family Income in Chippewa Falls is $70,581.
What is the Median Household income in Chippewa Falls?
Median Household Income in Chippewa Falls is $58,558.
What is Income or Wage Gap in Chippewa Falls?
Income or Wage Gap in Chippewa Falls is 24.4%.
Women in Chippewa Falls earn 75.6 cents for every dollar earned by a man.
What is Family Income Deficit in Chippewa Falls?
Family Income Deficit in Chippewa Falls is $12,214.
Families that are below poverty line in Chippewa Falls earn $12,214 less on average than the poverty threshold level.
What is Inequality or Gini Index in Chippewa Falls?
Inequality or Gini Index in Chippewa Falls is 0.40.
What is the Total Population of Chippewa Falls?
Total Population of Chippewa Falls is 14,623.
What is the Total Male Population of Chippewa Falls?
Total Male Population of Chippewa Falls is 7,131.
What is the Total Female Population of Chippewa Falls?
Total Female Population of Chippewa Falls is 7,492.
What is the Ratio of Males per 100 Females in Chippewa Falls?
There are 95.18 Males per 100 Females in Chippewa Falls.
What is the Ratio of Females per 100 Males in Chippewa Falls?
There are 105.06 Females per 100 Males in Chippewa Falls.
What is the Median Population Age in Chippewa Falls?
Median Population Age in Chippewa Falls is 38.2 Years.
What is the Average Family Size in Chippewa Falls
Average Family Size in Chippewa Falls is 3.0 People.
What is the Average Household Size in Chippewa Falls
Average Household Size in Chippewa Falls is 2.1 People.
How Large is the Labor Force in Chippewa Falls?
There are 7,313 People in the Labor Forcein in Chippewa Falls.
What is the Percentage of People in the Labor Force in Chippewa Falls?
61.4% of People are in the Labor Force in Chippewa Falls.
What is the Unemployment Rate in Chippewa Falls?
Unemployment Rate in Chippewa Falls is 5.4%.