Delafield, WI Map & Demographics
Delafield Map
Delafield Overview
$71,470
PER CAPITA INCOME
$123,113
AVG FAMILY INCOME
$99,239
AVG HOUSEHOLD INCOME
44.8%
WAGE / INCOME GAP [ % ]
55.2¢/ $1
WAGE / INCOME GAP [ $ ]
0.52
INEQUALITY / GINI INDEX
7,181
TOTAL POPULATION
3,550
MALE POPULATION
3,631
FEMALE POPULATION
97.77
MALES / 100 FEMALES
102.28
FEMALES / 100 MALES
49.2
MEDIAN AGE
2.8
AVG FAMILY SIZE
2.2
AVG HOUSEHOLD SIZE
3,836
LABOR FORCE [ PEOPLE ]
64.8%
PERCENT IN LABOR FORCE
1.5%
UNEMPLOYMENT RATE
Delafield Zip Codes
Delafield Area Codes
Income in Delafield
Income Overview in Delafield
Per Capita Income in Delafield is $71,470, while median incomes of families and households are $123,113 and $99,239 respectively.
| Characteristic | Number | Measure |
| Per Capita Income | 7,181 | $71,470 |
| Median Family Income | 2,055 | $123,113 |
| Mean Family Income | 2,055 | $187,399 |
| Median Household Income | 3,182 | $99,239 |
| Mean Household Income | 3,182 | $159,518 |
| Income Deficit | 2,055 | $0 |
| Wage / Income Gap (%) | 7,181 | 44.79% |
| Wage / Income Gap ($) | 7,181 | 55.21¢ per $1 |
| Gini / Inequality Index | 7,181 | 0.52 |
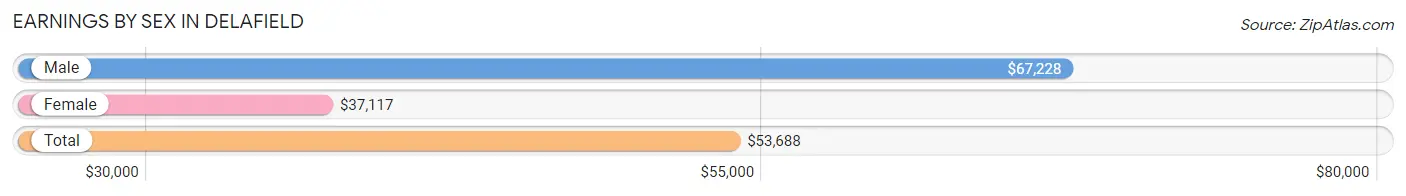
Earnings by Sex in Delafield
Average Earnings in Delafield are $53,688, $67,228 for men and $37,117 for women, a difference of 44.8%.
| Sex | Number | Average Earnings |
| Male | 2,168 (51.4%) | $67,228 |
| Female | 2,048 (48.6%) | $37,117 |
| Total | 4,216 (100.0%) | $53,688 |
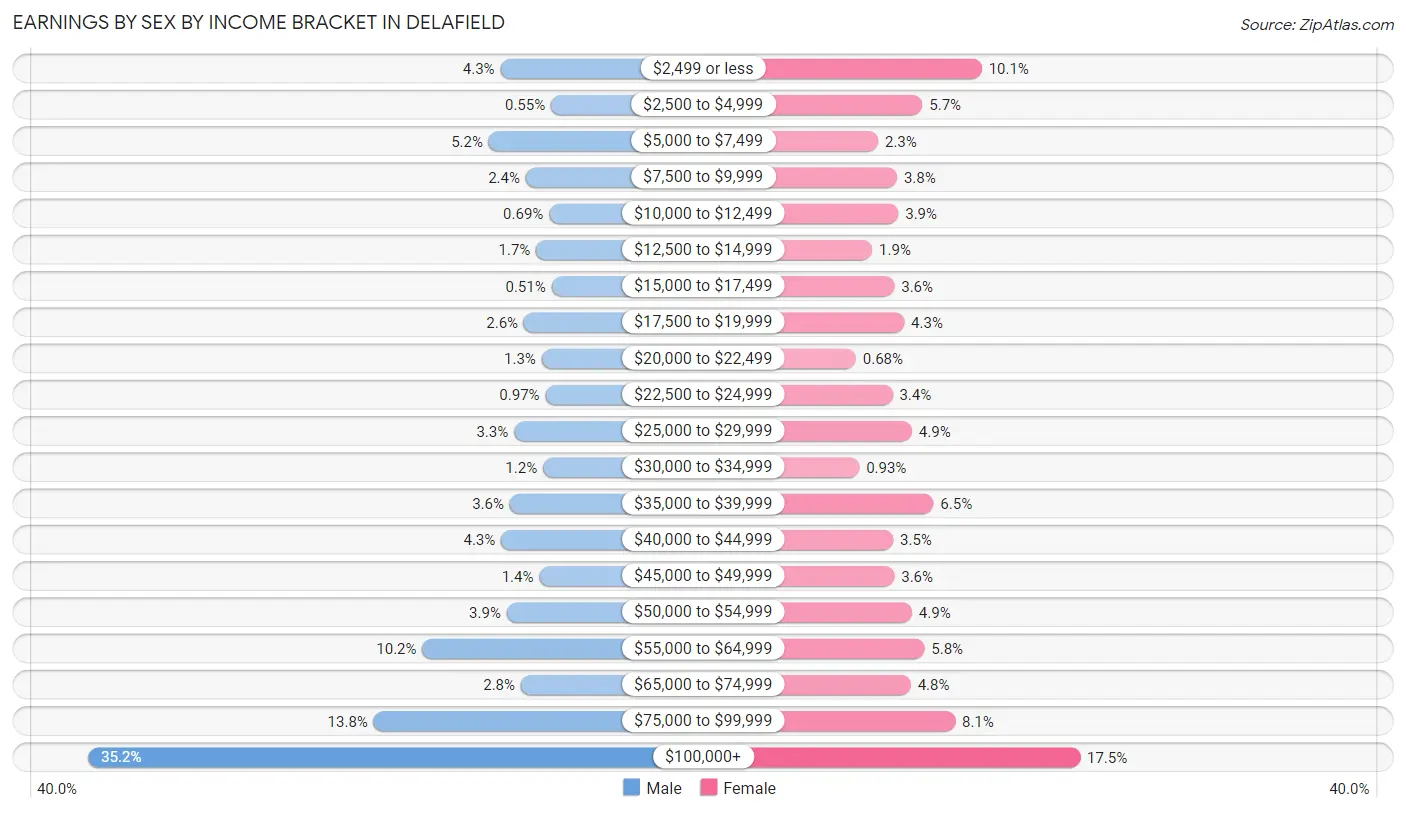
Earnings by Sex by Income Bracket in Delafield
The most common earnings brackets in Delafield are $100,000+ for men (764 | 35.2%) and $100,000+ for women (358 | 17.5%).
| Income | Male | Female |
| $2,499 or less | 94 (4.3%) | 207 (10.1%) |
| $2,500 to $4,999 | 12 (0.5%) | 116 (5.7%) |
| $5,000 to $7,499 | 113 (5.2%) | 48 (2.3%) |
| $7,500 to $9,999 | 53 (2.4%) | 77 (3.8%) |
| $10,000 to $12,499 | 15 (0.7%) | 79 (3.9%) |
| $12,500 to $14,999 | 36 (1.7%) | 39 (1.9%) |
| $15,000 to $17,499 | 11 (0.5%) | 73 (3.6%) |
| $17,500 to $19,999 | 56 (2.6%) | 88 (4.3%) |
| $20,000 to $22,499 | 27 (1.3%) | 14 (0.7%) |
| $22,500 to $24,999 | 21 (1.0%) | 70 (3.4%) |
| $25,000 to $29,999 | 72 (3.3%) | 100 (4.9%) |
| $30,000 to $34,999 | 25 (1.1%) | 19 (0.9%) |
| $35,000 to $39,999 | 79 (3.6%) | 133 (6.5%) |
| $40,000 to $44,999 | 93 (4.3%) | 71 (3.5%) |
| $45,000 to $49,999 | 31 (1.4%) | 73 (3.6%) |
| $50,000 to $54,999 | 84 (3.9%) | 100 (4.9%) |
| $55,000 to $64,999 | 221 (10.2%) | 119 (5.8%) |
| $65,000 to $74,999 | 61 (2.8%) | 98 (4.8%) |
| $75,000 to $99,999 | 300 (13.8%) | 166 (8.1%) |
| $100,000+ | 764 (35.2%) | 358 (17.5%) |
| Total | 2,168 (100.0%) | 2,048 (100.0%) |
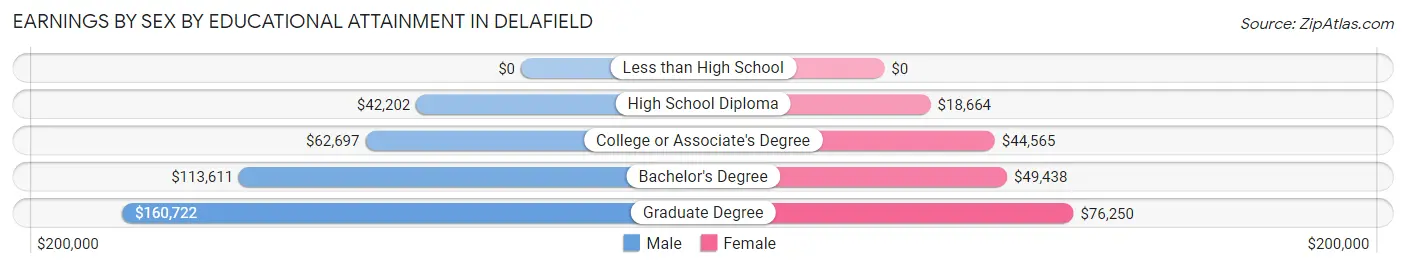
Earnings by Sex by Educational Attainment in Delafield
Average earnings in Delafield are $82,381 for men and $46,176 for women, a difference of 44.0%. Men with an educational attainment of graduate degree enjoy the highest average annual earnings of $160,722, while those with high school diploma education earn the least with $42,202. Women with an educational attainment of graduate degree earn the most with the average annual earnings of $76,250, while those with high school diploma education have the smallest earnings of $18,664.
| Educational Attainment | Male Income | Female Income |
| Less than High School | - | - |
| High School Diploma | $42,202 | $18,664 |
| College or Associate's Degree | $62,697 | $44,565 |
| Bachelor's Degree | $113,611 | $49,438 |
| Graduate Degree | $160,722 | $76,250 |
| Total | $82,381 | $46,176 |
Family Income in Delafield
Family Income Brackets in Delafield
According to the Delafield family income data, there are 596 families falling into the $200,000+ income range, which is the most common income bracket and makes up 29.0% of all families. Conversely, the $10,000 to $14,999 income bracket is the least frequent group with only 16 families (0.8%) belonging to this category.
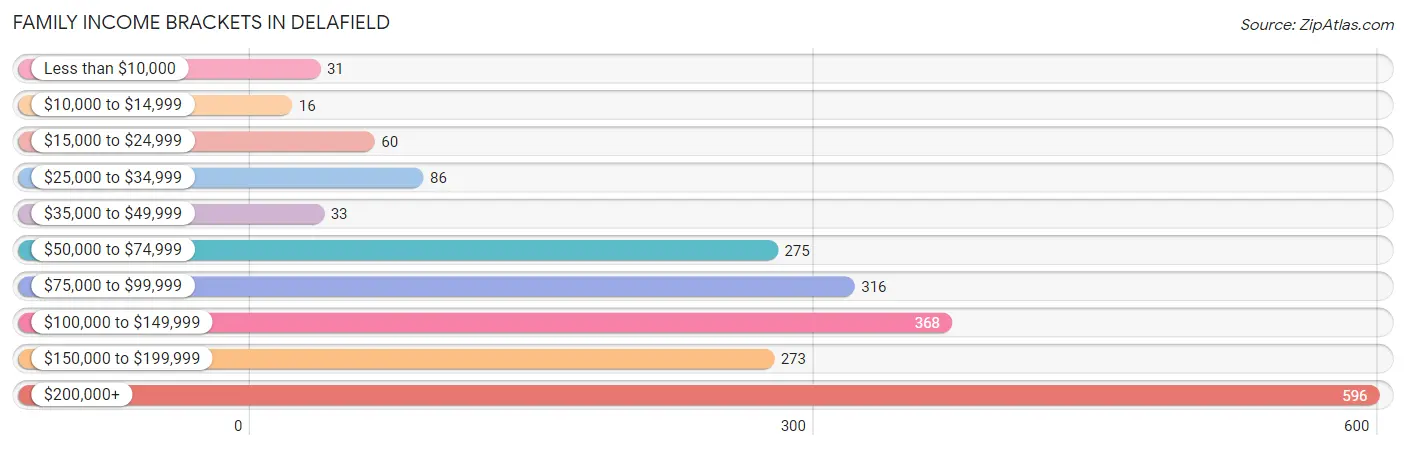
| Income Bracket | # Families | % Families |
| Less than $10,000 | 31 | 1.5% |
| $10,000 to $14,999 | 16 | 0.8% |
| $15,000 to $24,999 | 60 | 2.9% |
| $25,000 to $34,999 | 86 | 4.2% |
| $35,000 to $49,999 | 33 | 1.6% |
| $50,000 to $74,999 | 275 | 13.4% |
| $75,000 to $99,999 | 316 | 15.4% |
| $100,000 to $149,999 | 368 | 17.9% |
| $150,000 to $199,999 | 273 | 13.3% |
| $200,000+ | 596 | 29.0% |
Family Income by Famaliy Size in Delafield
5-person families (113 | 5.5%) account for the highest median family income in Delafield with $223,490 per family, while 2-person families (1,209 | 58.8%) have the highest median income of $49,914 per family member.
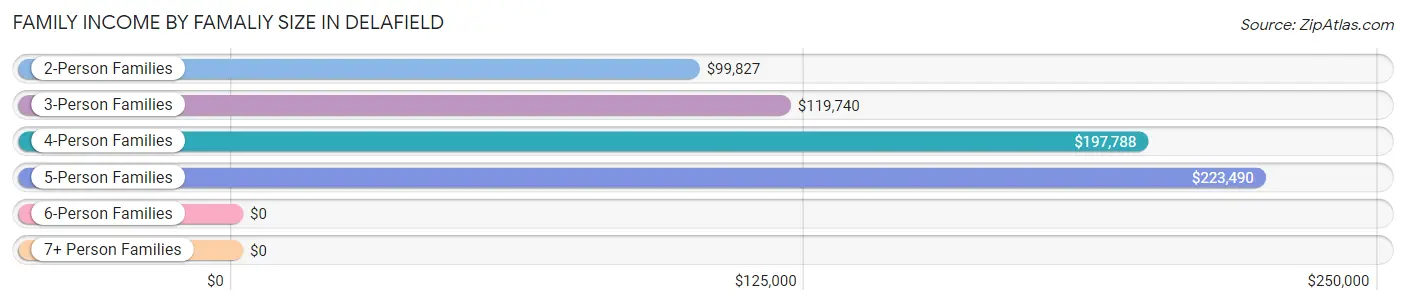
| Income Bracket | # Families | Median Income |
| 2-Person Families | 1,209 (58.8%) | $99,827 |
| 3-Person Families | 393 (19.1%) | $119,740 |
| 4-Person Families | 297 (14.4%) | $197,788 |
| 5-Person Families | 113 (5.5%) | $223,490 |
| 6-Person Families | 43 (2.1%) | $0 |
| 7+ Person Families | 0 (0.0%) | $0 |
| Total | 2,055 (100.0%) | $123,113 |
Family Income by Number of Earners in Delafield
The median family income in Delafield is $123,113, with families comprising 3+ earners (233) having the highest median family income of $223,281, while families with no earners (363) have the lowest median family income of $71,406, accounting for 11.3% and 17.7% of families, respectively.
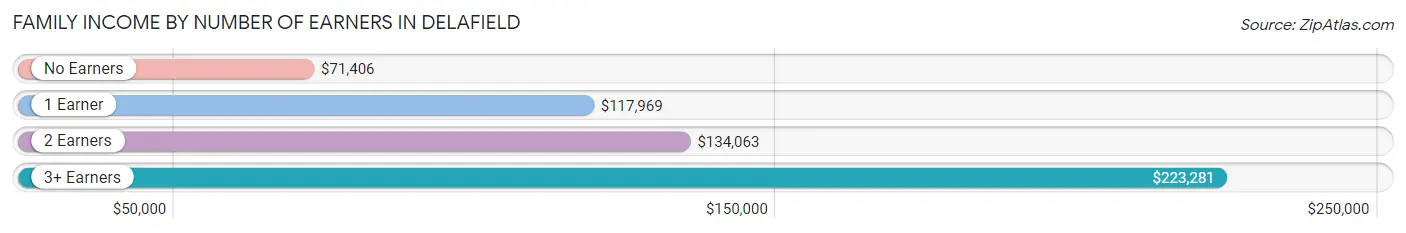
| Number of Earners | # Families | Median Income |
| No Earners | 363 (17.7%) | $71,406 |
| 1 Earner | 538 (26.2%) | $117,969 |
| 2 Earners | 921 (44.8%) | $134,063 |
| 3+ Earners | 233 (11.3%) | $223,281 |
| Total | 2,055 (100.0%) | $123,113 |
Household Income in Delafield
Household Income Brackets in Delafield
With 703 households falling in the category, the $200,000+ income range is the most frequent in Delafield, accounting for 22.1% of all households. In contrast, only 64 households (2.0%) fall into the less than $10,000 income bracket, making it the least populous group.
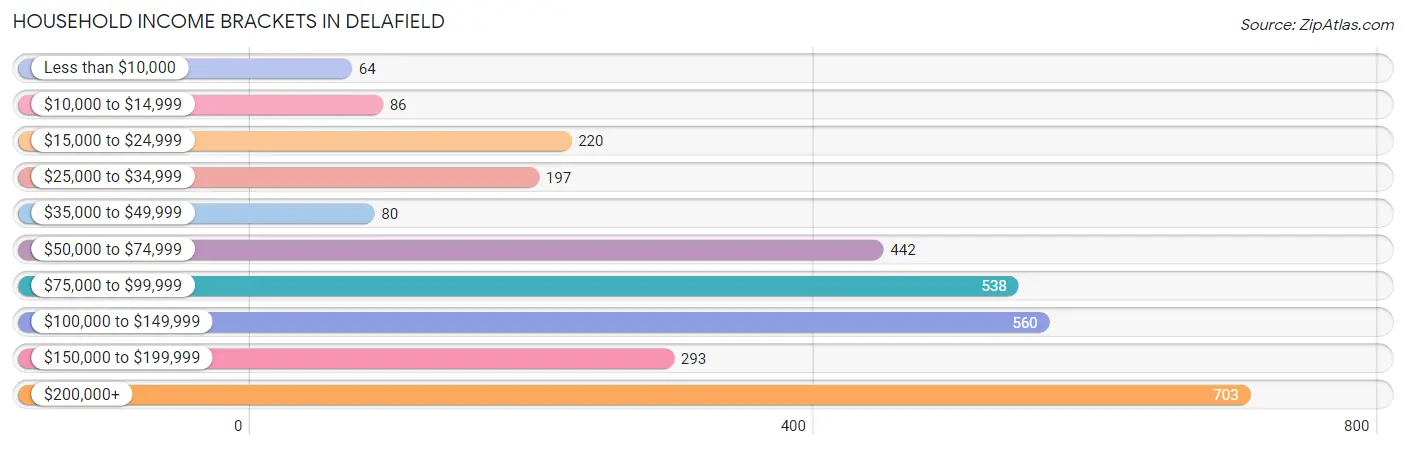
| Income Bracket | # Households | % Households |
| Less than $10,000 | 64 | 2.0% |
| $10,000 to $14,999 | 86 | 2.7% |
| $15,000 to $24,999 | 220 | 6.9% |
| $25,000 to $34,999 | 197 | 6.2% |
| $35,000 to $49,999 | 80 | 2.5% |
| $50,000 to $74,999 | 442 | 13.9% |
| $75,000 to $99,999 | 538 | 16.9% |
| $100,000 to $149,999 | 560 | 17.6% |
| $150,000 to $199,999 | 293 | 9.2% |
| $200,000+ | 703 | 22.1% |
Household Income by Householder Age in Delafield
The median household income in Delafield is $99,239, with the highest median household income of $144,079 found in the 45 to 64 years age bracket for the primary householder. A total of 1,154 households (36.3%) fall into this category. Meanwhile, the 15 to 24 years age bracket for the primary householder has the lowest median household income of $0, with 130 households (4.1%) in this group.
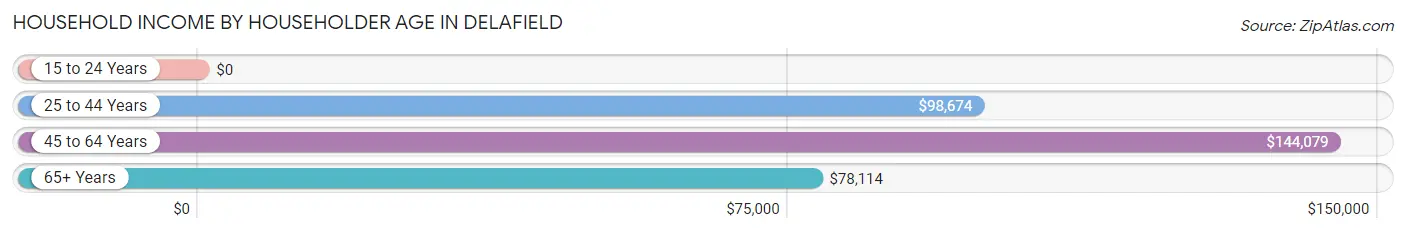
| Income Bracket | # Households | Median Income |
| 15 to 24 Years | 130 (4.1%) | $0 |
| 25 to 44 Years | 711 (22.3%) | $98,674 |
| 45 to 64 Years | 1,154 (36.3%) | $144,079 |
| 65+ Years | 1,187 (37.3%) | $78,114 |
| Total | 3,182 (100.0%) | $99,239 |
Poverty in Delafield
Income Below Poverty by Sex and Age in Delafield
With 6.4% poverty level for males and 6.9% for females among the residents of Delafield, 12 to 14 year old males and under 5 year old females are the most vulnerable to poverty, with 32 males (28.3%) and 37 females (24.0%) in their respective age groups living below the poverty level.
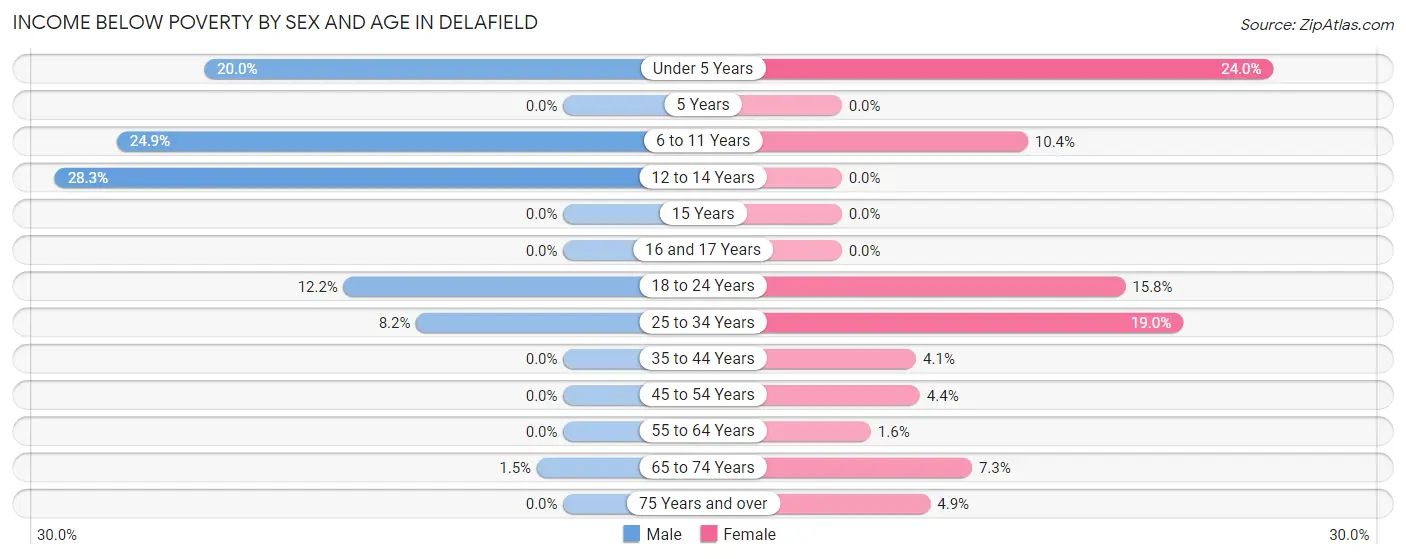
| Age Bracket | Male | Female |
| Under 5 Years | 40 (20.0%) | 37 (24.0%) |
| 5 Years | 0 (0.0%) | 0 (0.0%) |
| 6 to 11 Years | 92 (24.9%) | 20 (10.4%) |
| 12 to 14 Years | 32 (28.3%) | 0 (0.0%) |
| 15 Years | 0 (0.0%) | 0 (0.0%) |
| 16 and 17 Years | 0 (0.0%) | 0 (0.0%) |
| 18 to 24 Years | 23 (12.2%) | 30 (15.8%) |
| 25 to 34 Years | 28 (8.2%) | 53 (19.0%) |
| 35 to 44 Years | 0 (0.0%) | 15 (4.1%) |
| 45 to 54 Years | 0 (0.0%) | 22 (4.3%) |
| 55 to 64 Years | 0 (0.0%) | 10 (1.6%) |
| 65 to 74 Years | 8 (1.5%) | 40 (7.2%) |
| 75 Years and over | 0 (0.0%) | 20 (4.9%) |
| Total | 223 (6.4%) | 247 (6.9%) |
Income Above Poverty by Sex and Age in Delafield
According to the poverty statistics in Delafield, males aged 15 years and females aged 5 years are the age groups that are most secure financially, with 100.0% of males and 100.0% of females in these age groups living above the poverty line.
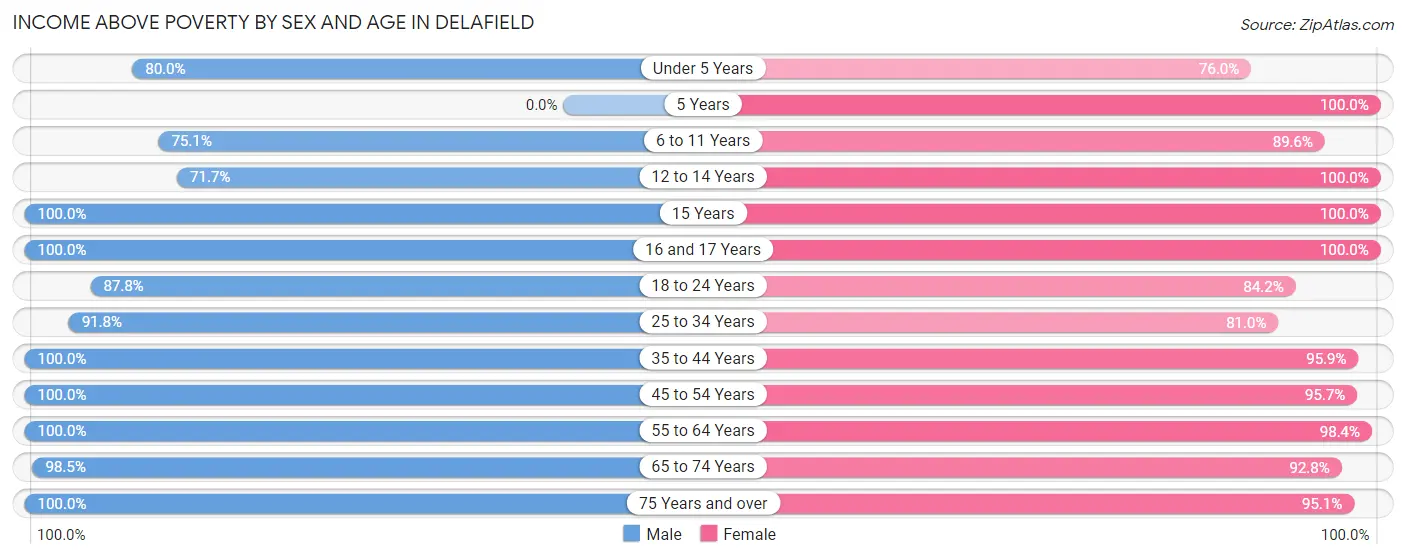
| Age Bracket | Male | Female |
| Under 5 Years | 160 (80.0%) | 117 (76.0%) |
| 5 Years | 0 (0.0%) | 10 (100.0%) |
| 6 to 11 Years | 278 (75.1%) | 173 (89.6%) |
| 12 to 14 Years | 81 (71.7%) | 174 (100.0%) |
| 15 Years | 16 (100.0%) | 15 (100.0%) |
| 16 and 17 Years | 45 (100.0%) | 118 (100.0%) |
| 18 to 24 Years | 165 (87.8%) | 160 (84.2%) |
| 25 to 34 Years | 314 (91.8%) | 226 (81.0%) |
| 35 to 44 Years | 411 (100.0%) | 347 (95.9%) |
| 45 to 54 Years | 398 (100.0%) | 484 (95.7%) |
| 55 to 64 Years | 638 (100.0%) | 607 (98.4%) |
| 65 to 74 Years | 536 (98.5%) | 512 (92.7%) |
| 75 Years and over | 231 (100.0%) | 386 (95.1%) |
| Total | 3,273 (93.6%) | 3,329 (93.1%) |
Income Below Poverty Among Married-Couple Families in Delafield
The poverty statistics for married-couple families in Delafield show that 1.7% or 28 of the total 1,663 families live below the poverty line. Families with 3 or 4 children have the highest poverty rate of 21.7%, comprising of 28 families. On the other hand, families with no children have the lowest poverty rate of 0.0%, which includes 0 families.
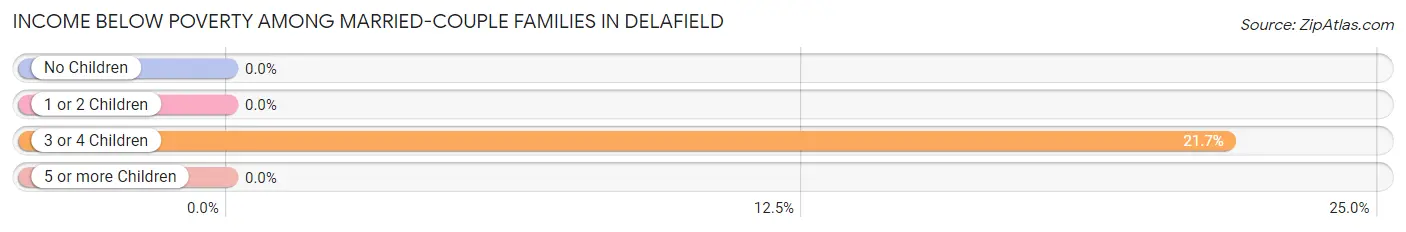
| Children | Above Poverty | Below Poverty |
| No Children | 1,111 (100.0%) | 0 (0.0%) |
| 1 or 2 Children | 423 (100.0%) | 0 (0.0%) |
| 3 or 4 Children | 101 (78.3%) | 28 (21.7%) |
| 5 or more Children | 0 (0.0%) | 0 (0.0%) |
| Total | 1,635 (98.3%) | 28 (1.7%) |
Income Below Poverty Among Single-Parent Households in Delafield
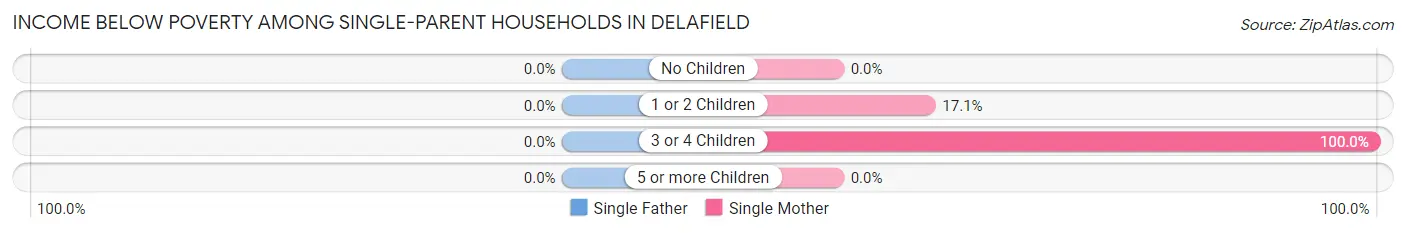
| Children | Single Father | Single Mother |
| No Children | 0 (0.0%) | 0 (0.0%) |
| 1 or 2 Children | 0 (0.0%) | 27 (17.1%) |
| 3 or 4 Children | 0 (0.0%) | 31 (100.0%) |
| 5 or more Children | 0 (0.0%) | 0 (0.0%) |
| Total | 0 (0.0%) | 58 (22.7%) |
Income Below Poverty Among Married-Couple vs Single-Parent Households in Delafield
The poverty data for Delafield shows that 28 of the married-couple family households (1.7%) and 58 of the single-parent households (14.8%) are living below the poverty level. Within the married-couple family households, those with 3 or 4 children have the highest poverty rate, with 28 households (21.7%) falling below the poverty line. Among the single-parent households, those with 3 or 4 children have the highest poverty rate, with 31 household (100.0%) living below poverty.
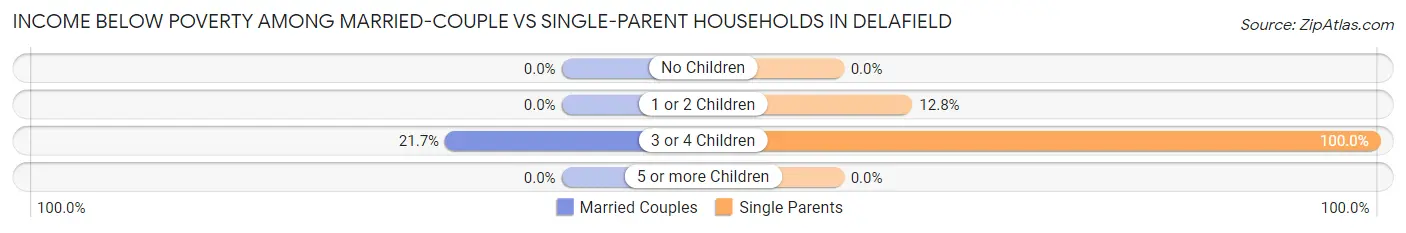
| Children | Married-Couple Families | Single-Parent Households |
| No Children | 0 (0.0%) | 0 (0.0%) |
| 1 or 2 Children | 0 (0.0%) | 27 (12.8%) |
| 3 or 4 Children | 28 (21.7%) | 31 (100.0%) |
| 5 or more Children | 0 (0.0%) | 0 (0.0%) |
| Total | 28 (1.7%) | 58 (14.8%) |
Race in Delafield
The most populous races in Delafield are White / Caucasian (6,701 | 93.3%), Hispanic or Latino (337 | 4.7%), and Two or more Races (201 | 2.8%).
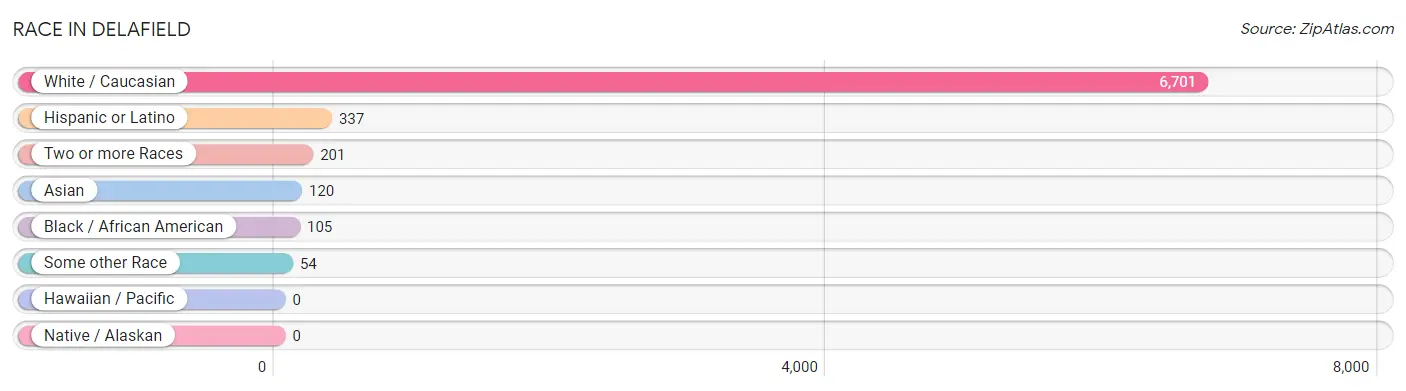
| Race | # Population | % Population |
| Asian | 120 | 1.7% |
| Black / African American | 105 | 1.5% |
| Hawaiian / Pacific | 0 | 0.0% |
| Hispanic or Latino | 337 | 4.7% |
| Native / Alaskan | 0 | 0.0% |
| White / Caucasian | 6,701 | 93.3% |
| Two or more Races | 201 | 2.8% |
| Some other Race | 54 | 0.7% |
| Total | 7,181 | 100.0% |
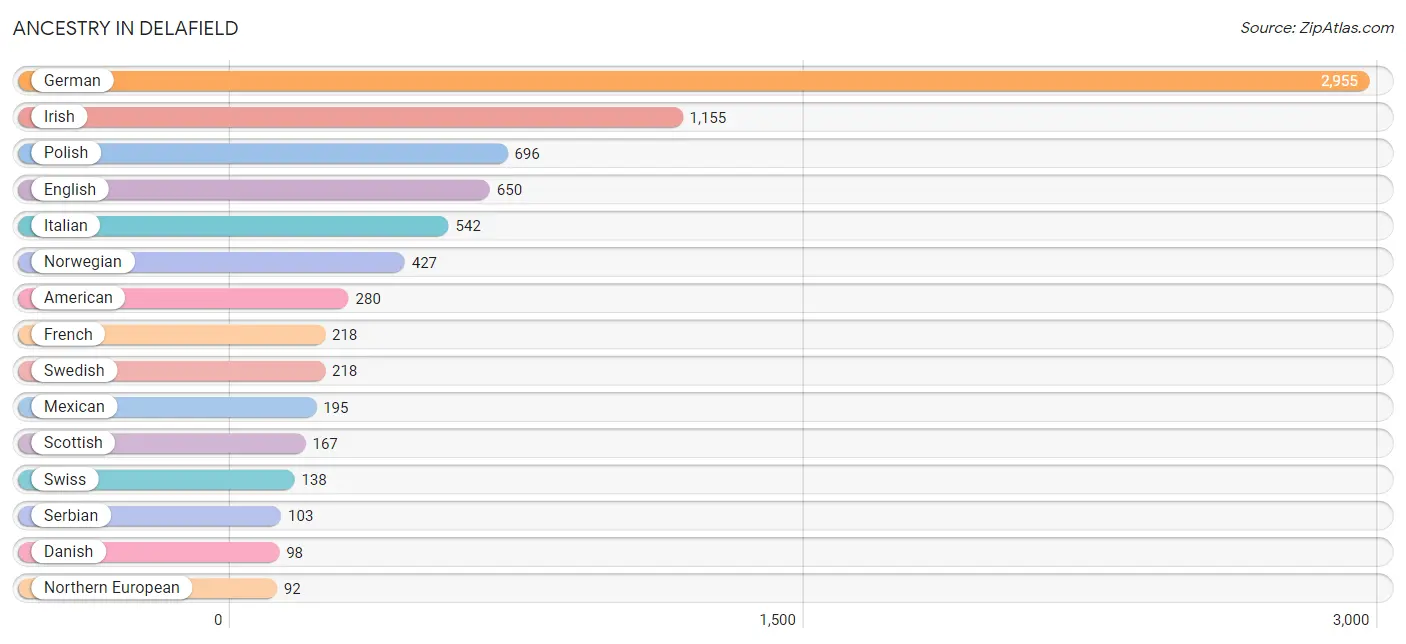
Ancestry in Delafield
The most populous ancestries reported in Delafield are German (2,955 | 41.1%), Irish (1,155 | 16.1%), Polish (696 | 9.7%), English (650 | 9.0%), and Italian (542 | 7.5%), together accounting for 83.5% of all Delafield residents.
| Ancestry | # Population | % Population |
| American | 280 | 3.9% |
| Arab | 20 | 0.3% |
| Austrian | 64 | 0.9% |
| Belgian | 13 | 0.2% |
| Bhutanese | 58 | 0.8% |
| British | 26 | 0.4% |
| Burmese | 48 | 0.7% |
| Cherokee | 4 | 0.1% |
| Colombian | 58 | 0.8% |
| Cuban | 3 | 0.0% |
| Czech | 73 | 1.0% |
| Czechoslovakian | 11 | 0.2% |
| Danish | 98 | 1.4% |
| Dutch | 86 | 1.2% |
| Eastern European | 19 | 0.3% |
| English | 650 | 9.0% |
| Ethiopian | 1 | 0.0% |
| European | 12 | 0.2% |
| French | 218 | 3.0% |
| French Canadian | 15 | 0.2% |
| German | 2,955 | 41.1% |
| Greek | 24 | 0.3% |
| Hungarian | 56 | 0.8% |
| Indian (Asian) | 4 | 0.1% |
| Irish | 1,155 | 16.1% |
| Italian | 542 | 7.5% |
| Korean | 59 | 0.8% |
| Lebanese | 12 | 0.2% |
| Lithuanian | 61 | 0.9% |
| Luxembourger | 4 | 0.1% |
| Mexican | 195 | 2.7% |
| Northern European | 92 | 1.3% |
| Norwegian | 427 | 5.9% |
| Polish | 696 | 9.7% |
| Puerto Rican | 65 | 0.9% |
| Russian | 11 | 0.2% |
| Scandinavian | 11 | 0.2% |
| Scottish | 167 | 2.3% |
| Serbian | 103 | 1.4% |
| Slavic | 21 | 0.3% |
| Slovak | 16 | 0.2% |
| Slovene | 11 | 0.2% |
| South American | 58 | 0.8% |
| Spaniard | 9 | 0.1% |
| Subsaharan African | 1 | 0.0% |
| Swedish | 218 | 3.0% |
| Swiss | 138 | 1.9% |
| Thai | 15 | 0.2% |
| Welsh | 1 | 0.0% |
| West Indian | 10 | 0.1% |
| Yugoslavian | 11 | 0.2% | View All 51 Rows |
Immigrants in Delafield
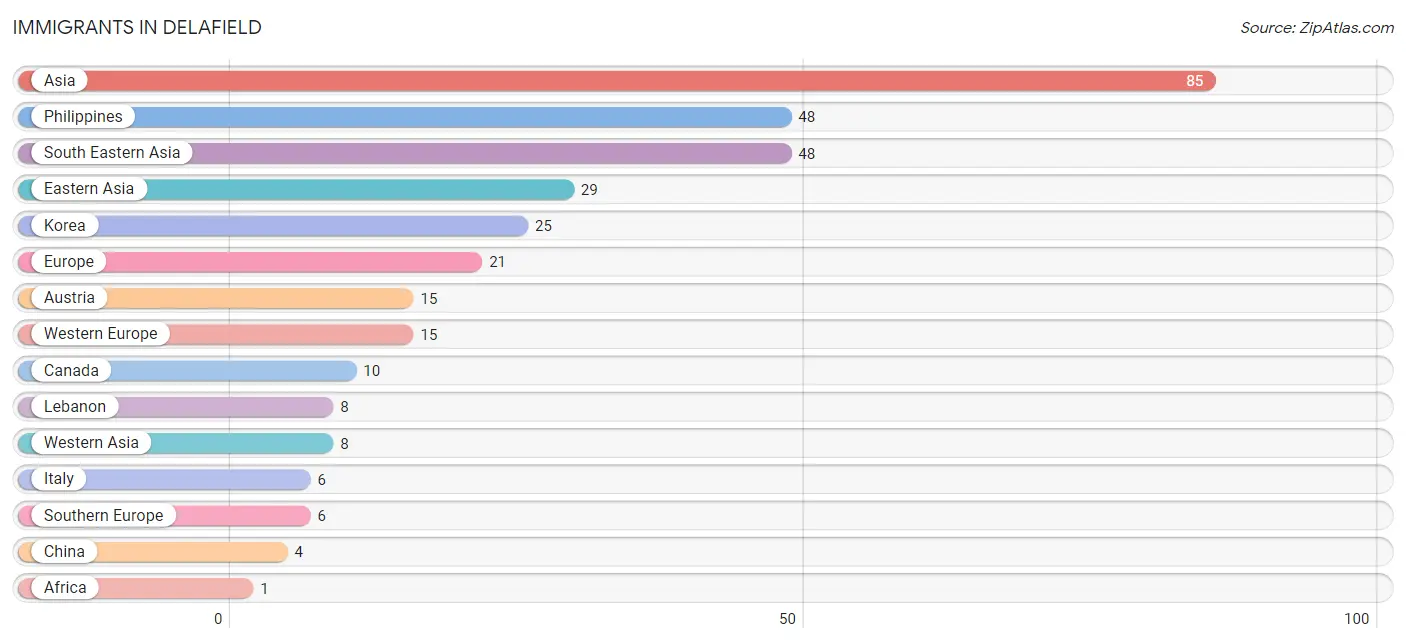
The most numerous immigrant groups reported in Delafield came from Asia (85 | 1.2%), Philippines (48 | 0.7%), South Eastern Asia (48 | 0.7%), Eastern Asia (29 | 0.4%), and Korea (25 | 0.4%), together accounting for 3.3% of all Delafield residents.
| Immigration Origin | # Population | % Population |
| Africa | 1 | 0.0% |
| Asia | 85 | 1.2% |
| Austria | 15 | 0.2% |
| Canada | 10 | 0.1% |
| China | 4 | 0.1% |
| Eastern Africa | 1 | 0.0% |
| Eastern Asia | 29 | 0.4% |
| Ethiopia | 1 | 0.0% |
| Europe | 21 | 0.3% |
| Italy | 6 | 0.1% |
| Korea | 25 | 0.4% |
| Lebanon | 8 | 0.1% |
| Philippines | 48 | 0.7% |
| South Eastern Asia | 48 | 0.7% |
| Southern Europe | 6 | 0.1% |
| Western Asia | 8 | 0.1% |
| Western Europe | 15 | 0.2% | View All 17 Rows |
Sex and Age in Delafield
Sex and Age in Delafield
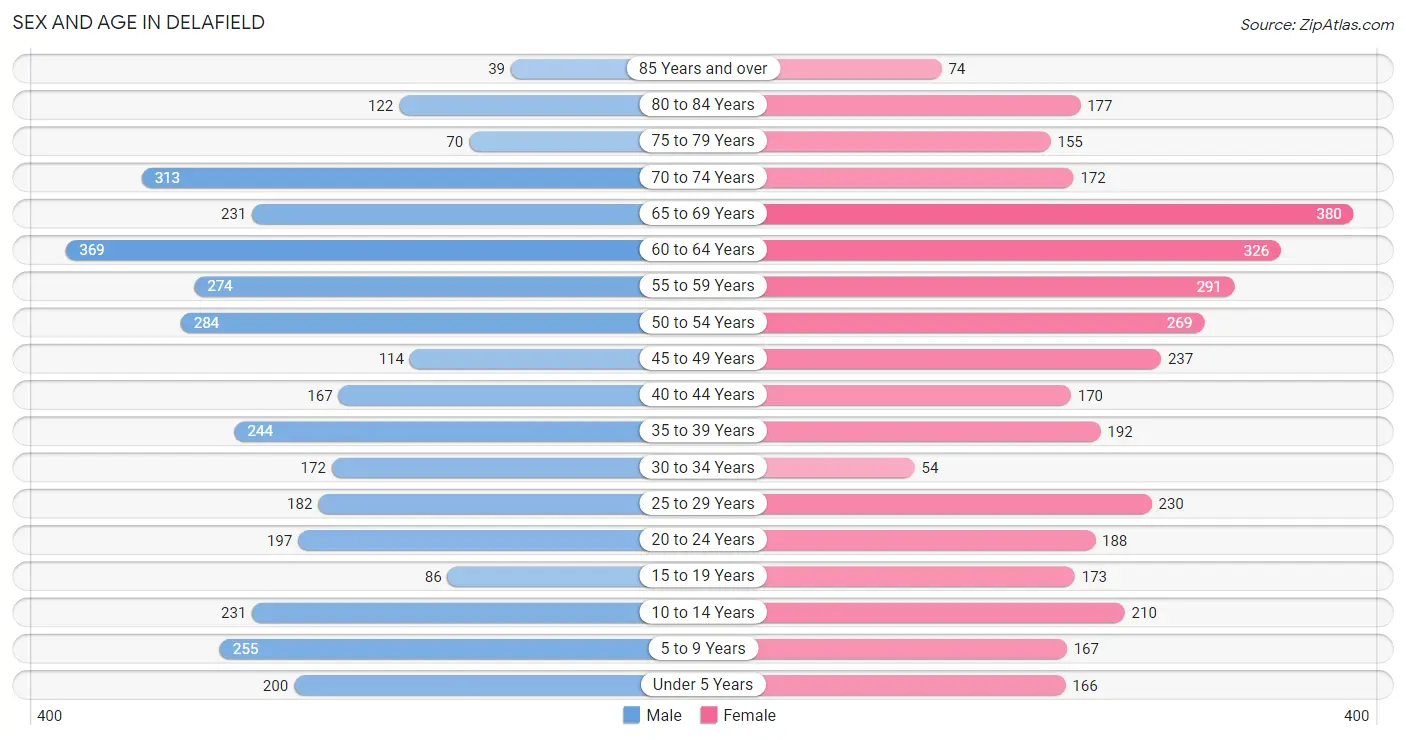
The most populous age groups in Delafield are 60 to 64 Years (369 | 10.4%) for men and 65 to 69 Years (380 | 10.5%) for women.
| Age Bracket | Male | Female |
| Under 5 Years | 200 (5.6%) | 166 (4.6%) |
| 5 to 9 Years | 255 (7.2%) | 167 (4.6%) |
| 10 to 14 Years | 231 (6.5%) | 210 (5.8%) |
| 15 to 19 Years | 86 (2.4%) | 173 (4.8%) |
| 20 to 24 Years | 197 (5.6%) | 188 (5.2%) |
| 25 to 29 Years | 182 (5.1%) | 230 (6.3%) |
| 30 to 34 Years | 172 (4.9%) | 54 (1.5%) |
| 35 to 39 Years | 244 (6.9%) | 192 (5.3%) |
| 40 to 44 Years | 167 (4.7%) | 170 (4.7%) |
| 45 to 49 Years | 114 (3.2%) | 237 (6.5%) |
| 50 to 54 Years | 284 (8.0%) | 269 (7.4%) |
| 55 to 59 Years | 274 (7.7%) | 291 (8.0%) |
| 60 to 64 Years | 369 (10.4%) | 326 (9.0%) |
| 65 to 69 Years | 231 (6.5%) | 380 (10.5%) |
| 70 to 74 Years | 313 (8.8%) | 172 (4.7%) |
| 75 to 79 Years | 70 (2.0%) | 155 (4.3%) |
| 80 to 84 Years | 122 (3.4%) | 177 (4.9%) |
| 85 Years and over | 39 (1.1%) | 74 (2.0%) |
| Total | 3,550 (100.0%) | 3,631 (100.0%) |
Families and Households in Delafield
Median Family Size in Delafield
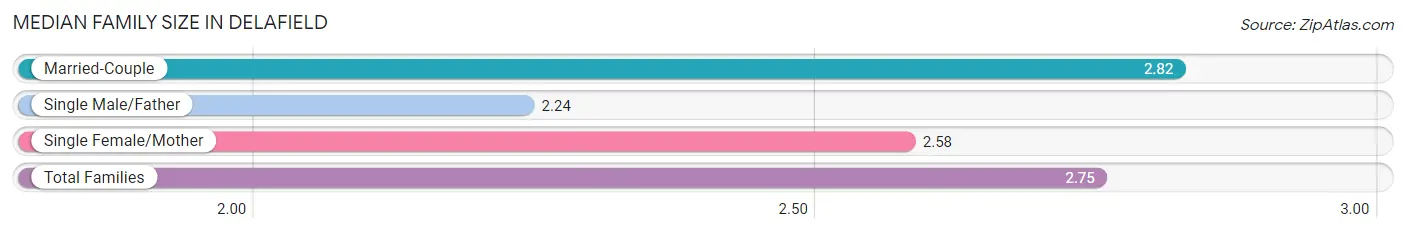
The median family size in Delafield is 2.75 persons per family, with married-couple families (1,663 | 80.9%) accounting for the largest median family size of 2.82 persons per family. On the other hand, single male/father families (136 | 6.6%) represent the smallest median family size with 2.24 persons per family.
| Family Type | # Families | Family Size |
| Married-Couple | 1,663 (80.9%) | 2.82 |
| Single Male/Father | 136 (6.6%) | 2.24 |
| Single Female/Mother | 256 (12.5%) | 2.58 |
| Total Families | 2,055 (100.0%) | 2.75 |
Median Household Size in Delafield
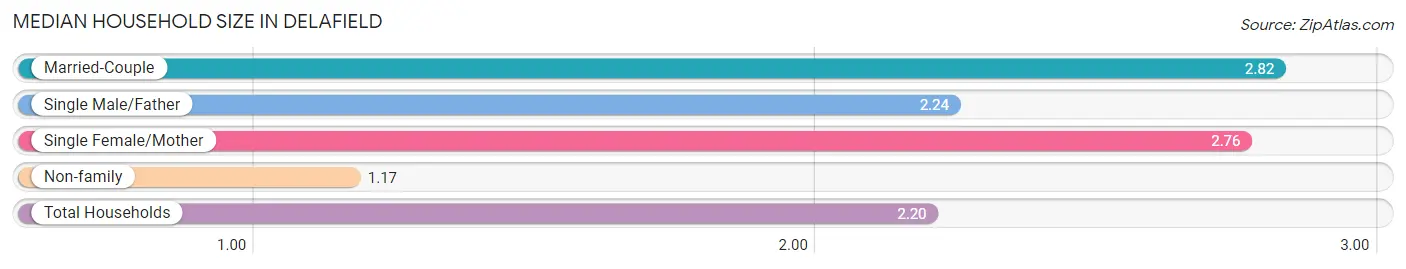
The median household size in Delafield is 2.20 persons per household, with married-couple households (1,663 | 52.3%) accounting for the largest median household size of 2.82 persons per household. non-family households (1,127 | 35.4%) represent the smallest median household size with 1.17 persons per household.
| Household Type | # Households | Household Size |
| Married-Couple | 1,663 (52.3%) | 2.82 |
| Single Male/Father | 136 (4.3%) | 2.24 |
| Single Female/Mother | 256 (8.1%) | 2.76 |
| Non-family | 1,127 (35.4%) | 1.17 |
| Total Households | 3,182 (100.0%) | 2.20 |
Household Size by Marriage Status in Delafield
Out of a total of 3,182 households in Delafield, 2,055 (64.6%) are family households, while 1,127 (35.4%) are nonfamily households. The most numerous type of family households are 2-person households, comprising 1,172, and the most common type of nonfamily households are 1-person households, comprising 956.
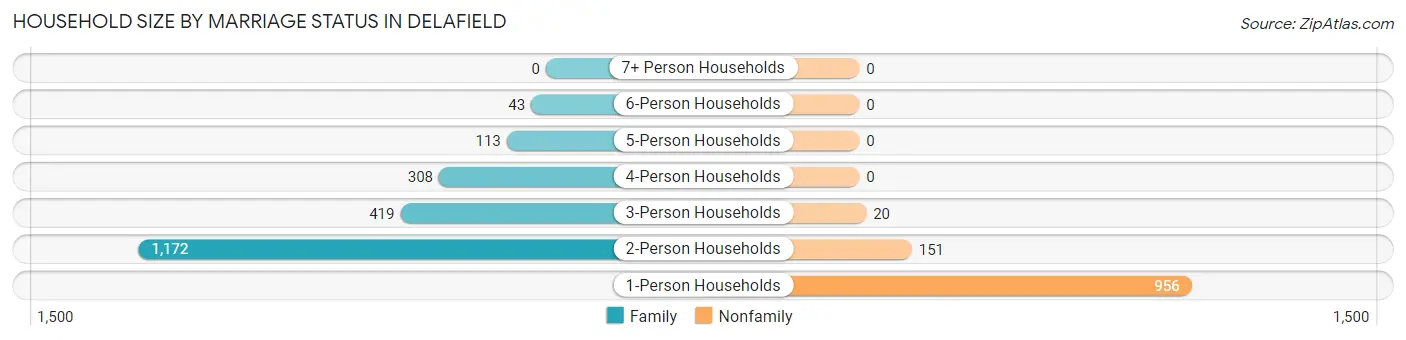
| Household Size | Family Households | Nonfamily Households |
| 1-Person Households | - | 956 (30.0%) |
| 2-Person Households | 1,172 (36.8%) | 151 (4.8%) |
| 3-Person Households | 419 (13.2%) | 20 (0.6%) |
| 4-Person Households | 308 (9.7%) | 0 (0.0%) |
| 5-Person Households | 113 (3.5%) | 0 (0.0%) |
| 6-Person Households | 43 (1.3%) | 0 (0.0%) |
| 7+ Person Households | 0 (0.0%) | 0 (0.0%) |
| Total | 2,055 (64.6%) | 1,127 (35.4%) |
Female Fertility in Delafield
Fertility by Age in Delafield
Average fertility rate in Delafield is 35.0 births per 1,000 women. Women in the age bracket of 20 to 34 years have the highest fertility rate with 76.0 births per 1,000 women. Women in the age bracket of 20 to 34 years acount for 76.6% of all women with births.
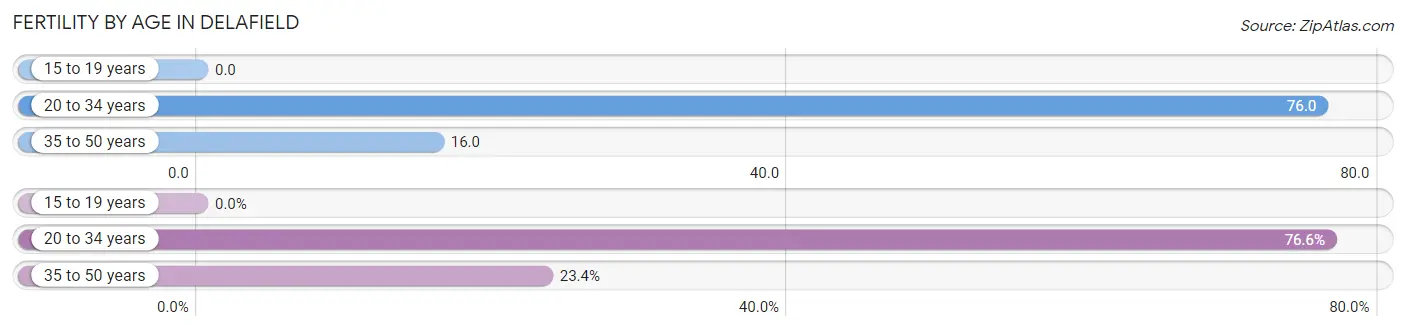
| Age Bracket | Women with Births | Births / 1,000 Women |
| 15 to 19 years | 0 (0.0%) | 0.0 |
| 20 to 34 years | 36 (76.6%) | 76.0 |
| 35 to 50 years | 11 (23.4%) | 16.0 |
| Total | 47 (100.0%) | 35.0 |
Fertility by Age by Marriage Status in Delafield
76.6% of women with births (47) in Delafield are married. The highest percentage of unmarried women with births falls into 35 to 50 years age bracket with 100.0% of them unmarried at the time of birth, while the lowest percentage of unmarried women with births belong to 20 to 34 years age bracket with 0.0% of them unmarried.
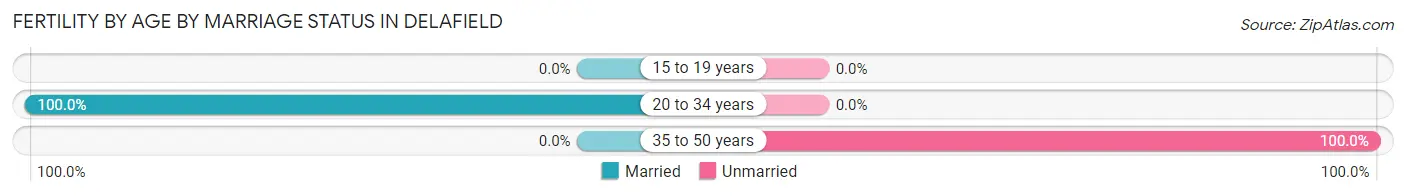
| Age Bracket | Married | Unmarried |
| 15 to 19 years | 0 (0.0%) | 0 (0.0%) |
| 20 to 34 years | 36 (100.0%) | 0 (0.0%) |
| 35 to 50 years | 0 (0.0%) | 11 (100.0%) |
| Total | 36 (76.6%) | 11 (23.4%) |
Fertility by Education in Delafield
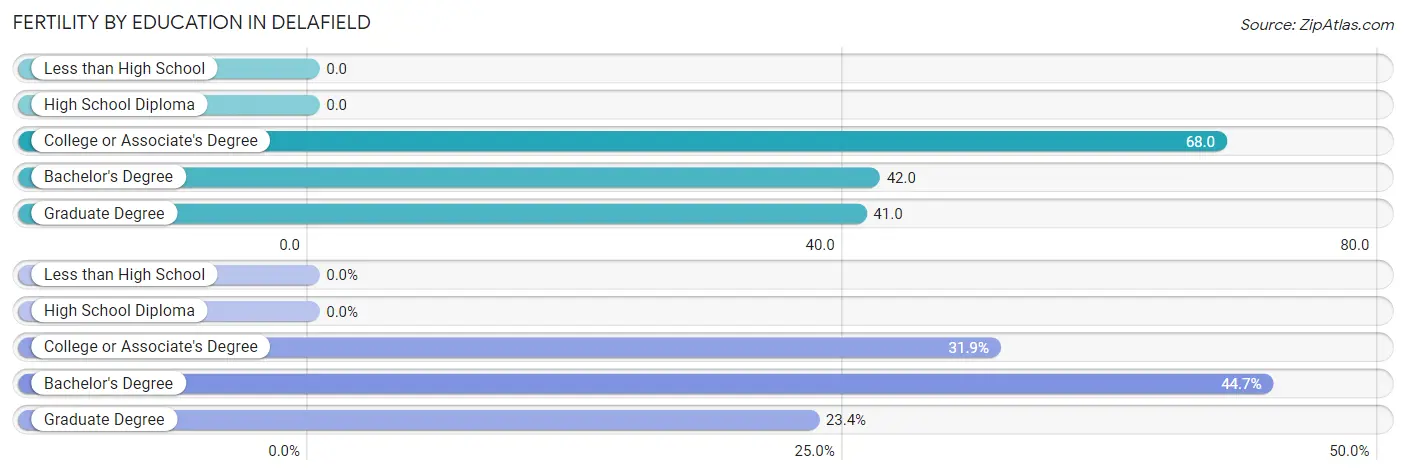
| Educational Attainment | Women with Births | Births / 1,000 Women |
| Less than High School | 0 (0.0%) | 0.0 |
| High School Diploma | 0 (0.0%) | 0.0 |
| College or Associate's Degree | 15 (31.9%) | 68.0 |
| Bachelor's Degree | 21 (44.7%) | 42.0 |
| Graduate Degree | 11 (23.4%) | 41.0 |
| Total | 47 (100.0%) | 35.0 |
Fertility by Education by Marriage Status in Delafield
23.4% of women with births in Delafield are unmarried. Women with the educational attainment of college or associate's degree are most likely to be married with 100.0% of them married at childbirth, while women with the educational attainment of graduate degree are least likely to be married with 100.0% of them unmarried at childbirth.
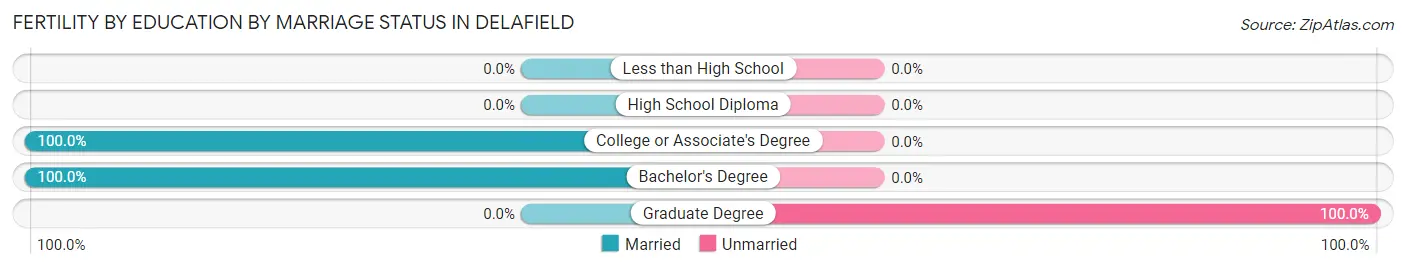
| Educational Attainment | Married | Unmarried |
| Less than High School | 0 (0.0%) | 0 (0.0%) |
| High School Diploma | 0 (0.0%) | 0 (0.0%) |
| College or Associate's Degree | 15 (100.0%) | 0 (0.0%) |
| Bachelor's Degree | 21 (100.0%) | 0 (0.0%) |
| Graduate Degree | 0 (0.0%) | 11 (100.0%) |
| Total | 36 (76.6%) | 11 (23.4%) |
Employment Characteristics in Delafield
Employment by Class of Employer in Delafield
Among the 3,762 employed individuals in Delafield, private company employees (2,427 | 64.5%), not-for-profit organizations (481 | 12.8%), and local government employees (285 | 7.6%) make up the most common classes of employment.
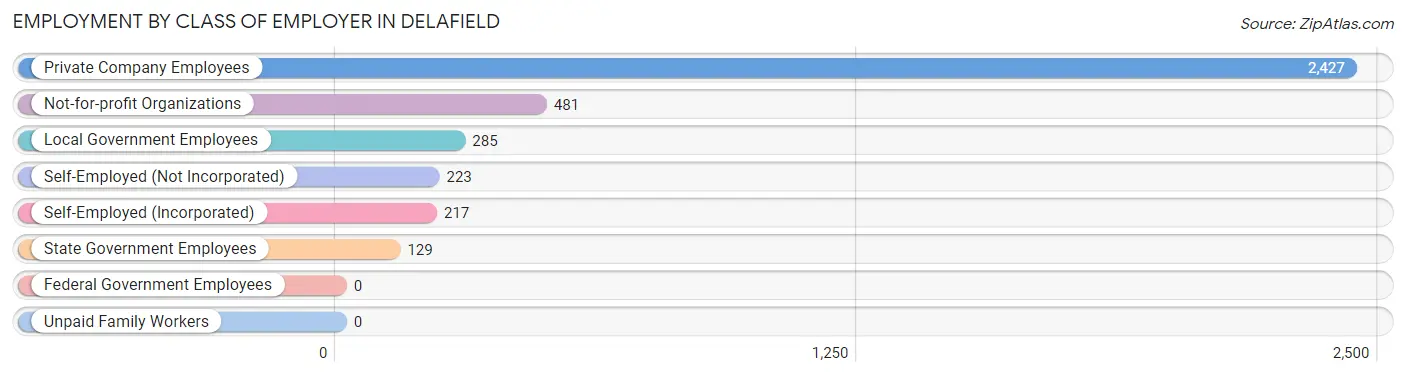
| Employer Class | # Employees | % Employees |
| Private Company Employees | 2,427 | 64.5% |
| Self-Employed (Incorporated) | 217 | 5.8% |
| Self-Employed (Not Incorporated) | 223 | 5.9% |
| Not-for-profit Organizations | 481 | 12.8% |
| Local Government Employees | 285 | 7.6% |
| State Government Employees | 129 | 3.4% |
| Federal Government Employees | 0 | 0.0% |
| Unpaid Family Workers | 0 | 0.0% |
| Total | 3,762 | 100.0% |
Employment Status by Age in Delafield
According to the labor force statistics for Delafield, out of the total population over 16 years of age (5,919), 64.8% or 3,836 individuals are in the labor force, with 1.5% or 58 of them unemployed. The age group with the highest labor force participation rate is 45 to 54 years, with 94.2% or 852 individuals in the labor force. Within the labor force, the 20 to 24 years age range has the highest percentage of unemployed individuals, with 5.8% or 20 of them being unemployed.
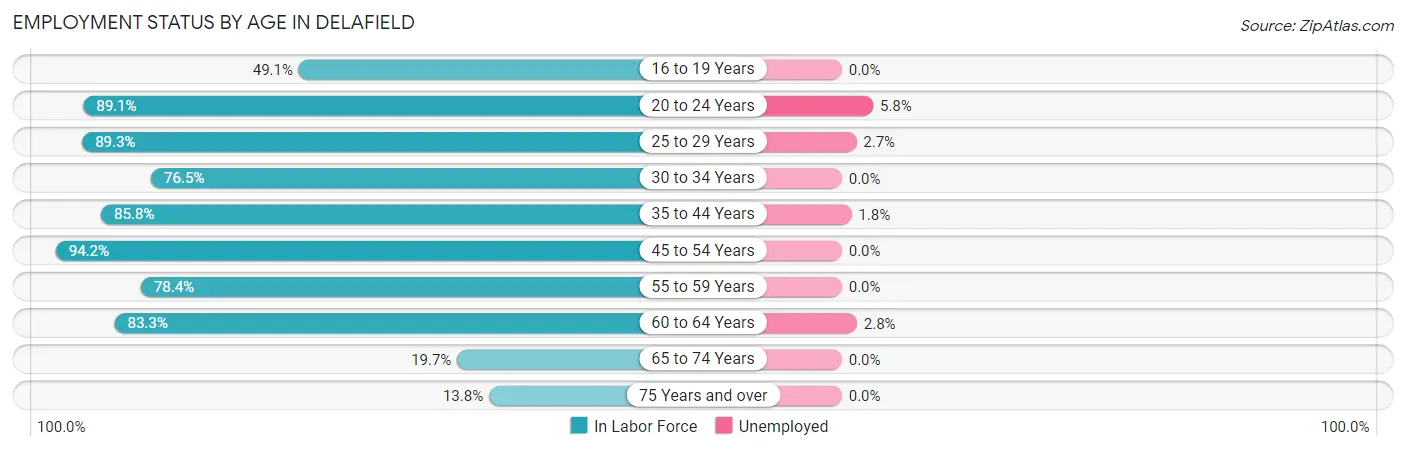
| Age Bracket | In Labor Force | Unemployed |
| 16 to 19 Years | 111 (49.1%) | 0 (0.0%) |
| 20 to 24 Years | 343 (89.1%) | 20 (5.8%) |
| 25 to 29 Years | 368 (89.3%) | 10 (2.7%) |
| 30 to 34 Years | 173 (76.5%) | 0 (0.0%) |
| 35 to 44 Years | 663 (85.8%) | 12 (1.8%) |
| 45 to 54 Years | 852 (94.2%) | 0 (0.0%) |
| 55 to 59 Years | 443 (78.4%) | 0 (0.0%) |
| 60 to 64 Years | 579 (83.3%) | 16 (2.8%) |
| 65 to 74 Years | 216 (19.7%) | 0 (0.0%) |
| 75 Years and over | 88 (13.8%) | 0 (0.0%) |
| Total | 3,836 (64.8%) | 58 (1.5%) |
Employment Status by Educational Attainment in Delafield
According to labor force statistics for Delafield, 86.1% of individuals (3,078) out of the total population between 25 and 64 years of age (3,575) are in the labor force, with 1.2% or 37 of them being unemployed. The group with the highest labor force participation rate are those with the educational attainment of college / associate degree, with 93.6% or 827 individuals in the labor force. Within the labor force, individuals with college / associate degree education have the highest percentage of unemployment, with 2.7% or 22 of them being unemployed.
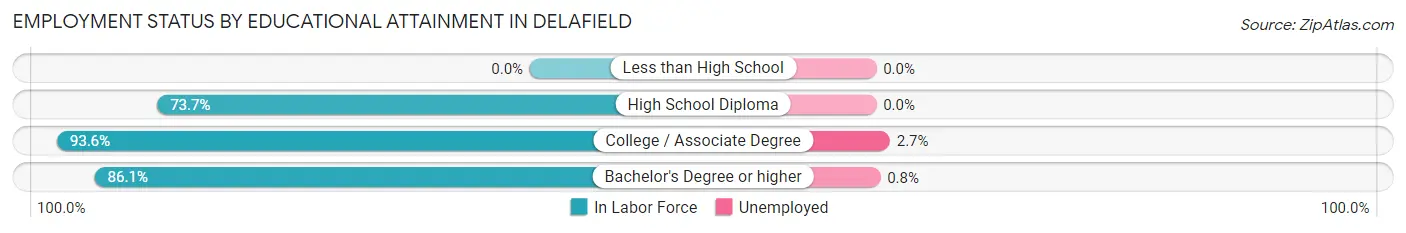
| Educational Attainment | In Labor Force | Unemployed |
| Less than High School | 0 (0.0%) | 0 (0.0%) |
| High School Diploma | 342 (73.7%) | 0 (0.0%) |
| College / Associate Degree | 827 (93.6%) | 24 (2.7%) |
| Bachelor's Degree or higher | 1,908 (86.1%) | 18 (0.8%) |
| Total | 3,078 (86.1%) | 43 (1.2%) |
Employment Occupations by Sex in Delafield
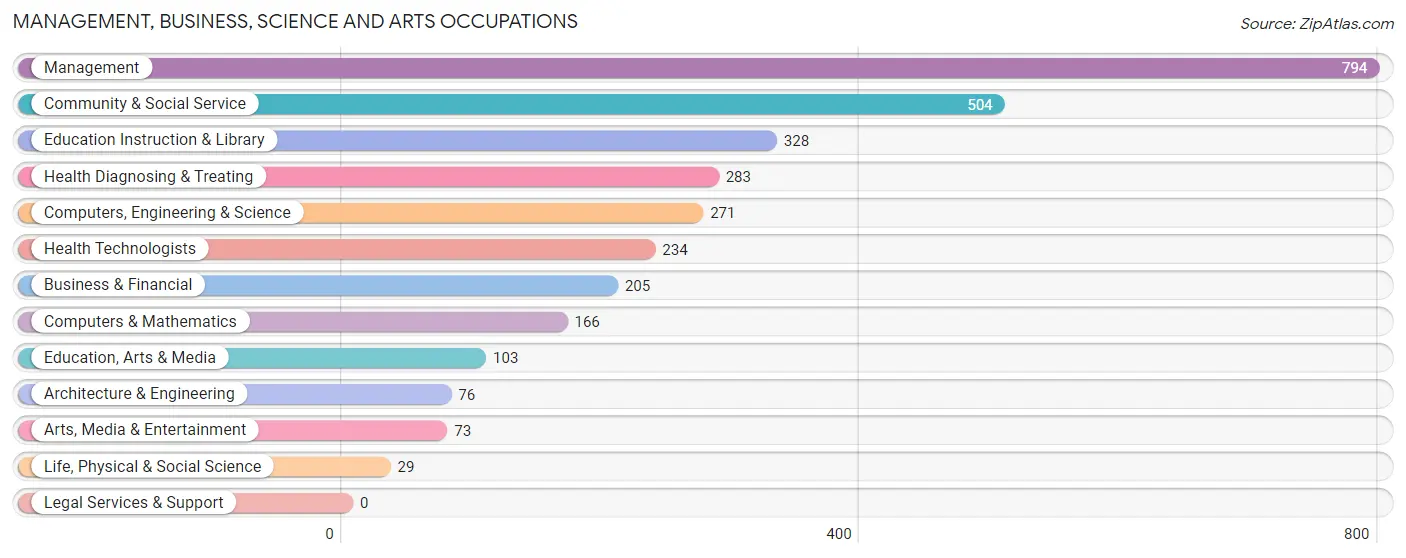
Management, Business, Science and Arts Occupations
The most common Management, Business, Science and Arts occupations in Delafield are Management (794 | 21.0%), Community & Social Service (504 | 13.3%), Education Instruction & Library (328 | 8.7%), Health Diagnosing & Treating (283 | 7.5%), and Computers, Engineering & Science (271 | 7.2%).
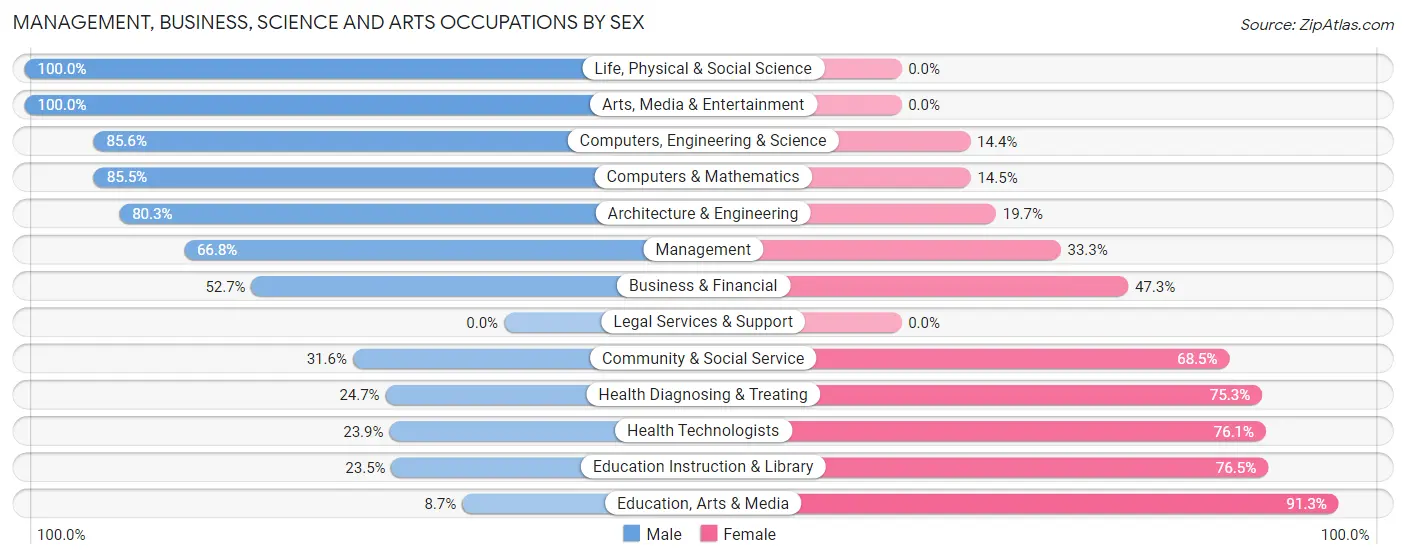
Management, Business, Science and Arts Occupations by Sex
Within the Management, Business, Science and Arts occupations in Delafield, the most male-oriented occupations are Life, Physical & Social Science (100.0%), Arts, Media & Entertainment (100.0%), and Computers, Engineering & Science (85.6%), while the most female-oriented occupations are Education, Arts & Media (91.3%), Education Instruction & Library (76.5%), and Health Technologists (76.1%).
| Occupation | Male | Female |
| Management | 530 (66.7%) | 264 (33.3%) |
| Business & Financial | 108 (52.7%) | 97 (47.3%) |
| Computers, Engineering & Science | 232 (85.6%) | 39 (14.4%) |
| Computers & Mathematics | 142 (85.5%) | 24 (14.5%) |
| Architecture & Engineering | 61 (80.3%) | 15 (19.7%) |
| Life, Physical & Social Science | 29 (100.0%) | 0 (0.0%) |
| Community & Social Service | 159 (31.6%) | 345 (68.4%) |
| Education, Arts & Media | 9 (8.7%) | 94 (91.3%) |
| Legal Services & Support | 0 (0.0%) | 0 (0.0%) |
| Education Instruction & Library | 77 (23.5%) | 251 (76.5%) |
| Arts, Media & Entertainment | 73 (100.0%) | 0 (0.0%) |
| Health Diagnosing & Treating | 70 (24.7%) | 213 (75.3%) |
| Health Technologists | 56 (23.9%) | 178 (76.1%) |
| Total (Category) | 1,099 (53.4%) | 958 (46.6%) |
| Total (Overall) | 1,934 (51.2%) | 1,844 (48.8%) |
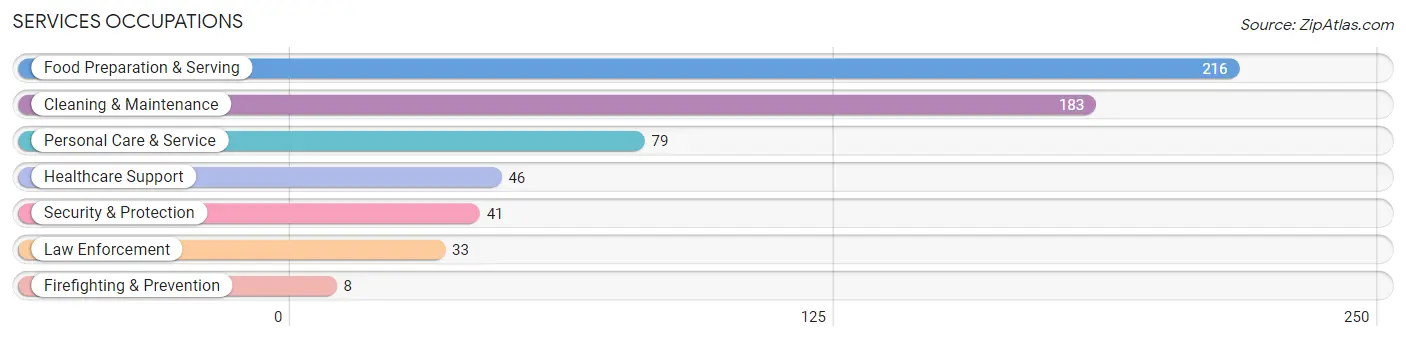
Services Occupations
The most common Services occupations in Delafield are Food Preparation & Serving (216 | 5.7%), Cleaning & Maintenance (183 | 4.8%), Personal Care & Service (79 | 2.1%), Healthcare Support (46 | 1.2%), and Security & Protection (41 | 1.1%).
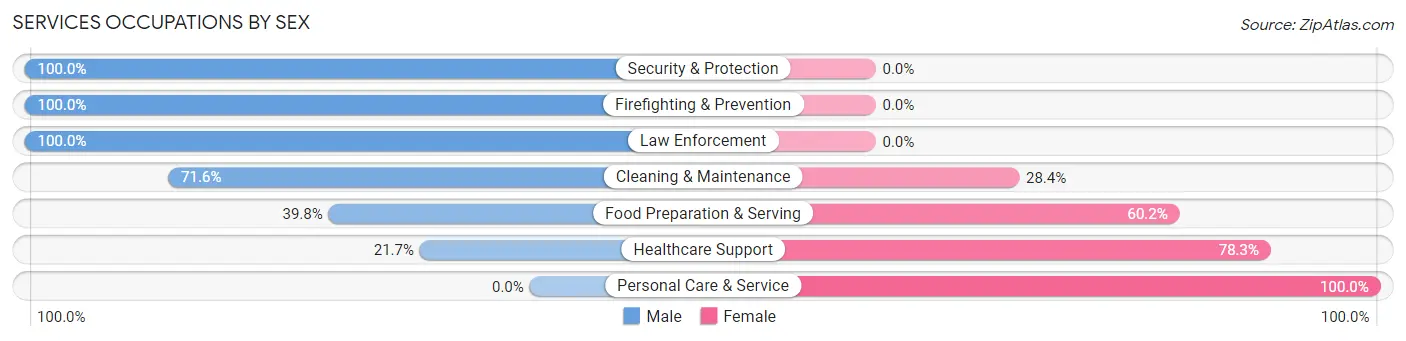
Services Occupations by Sex
Within the Services occupations in Delafield, the most male-oriented occupations are Security & Protection (100.0%), Firefighting & Prevention (100.0%), and Law Enforcement (100.0%), while the most female-oriented occupations are Personal Care & Service (100.0%), Healthcare Support (78.3%), and Food Preparation & Serving (60.2%).
| Occupation | Male | Female |
| Healthcare Support | 10 (21.7%) | 36 (78.3%) |
| Security & Protection | 41 (100.0%) | 0 (0.0%) |
| Firefighting & Prevention | 8 (100.0%) | 0 (0.0%) |
| Law Enforcement | 33 (100.0%) | 0 (0.0%) |
| Food Preparation & Serving | 86 (39.8%) | 130 (60.2%) |
| Cleaning & Maintenance | 131 (71.6%) | 52 (28.4%) |
| Personal Care & Service | 0 (0.0%) | 79 (100.0%) |
| Total (Category) | 268 (47.4%) | 297 (52.6%) |
| Total (Overall) | 1,934 (51.2%) | 1,844 (48.8%) |
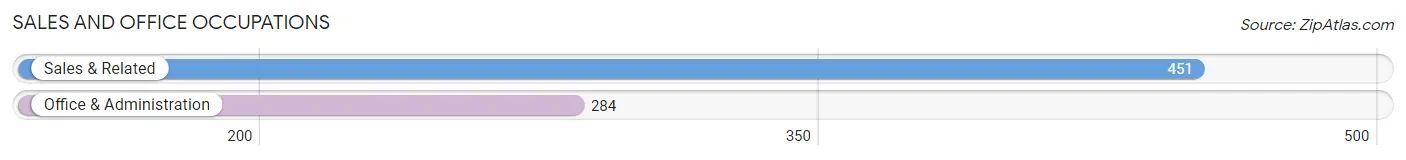
Sales and Office Occupations
The most common Sales and Office occupations in Delafield are Sales & Related (451 | 11.9%), and Office & Administration (284 | 7.5%).
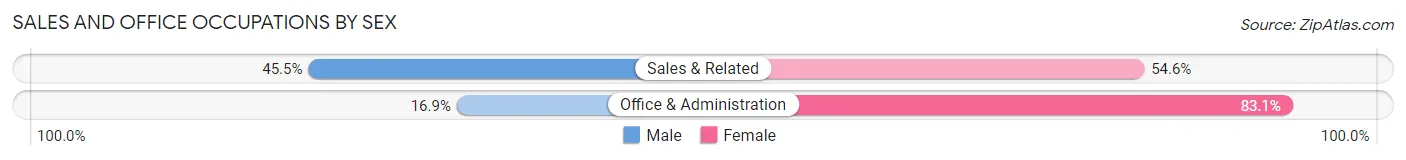
Sales and Office Occupations by Sex
| Occupation | Male | Female |
| Sales & Related | 205 (45.5%) | 246 (54.5%) |
| Office & Administration | 48 (16.9%) | 236 (83.1%) |
| Total (Category) | 253 (34.4%) | 482 (65.6%) |
| Total (Overall) | 1,934 (51.2%) | 1,844 (48.8%) |
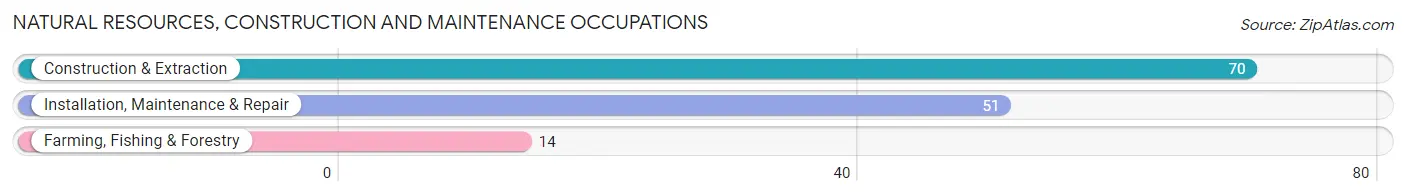
Natural Resources, Construction and Maintenance Occupations
The most common Natural Resources, Construction and Maintenance occupations in Delafield are Construction & Extraction (70 | 1.8%), Installation, Maintenance & Repair (51 | 1.3%), and Farming, Fishing & Forestry (14 | 0.4%).
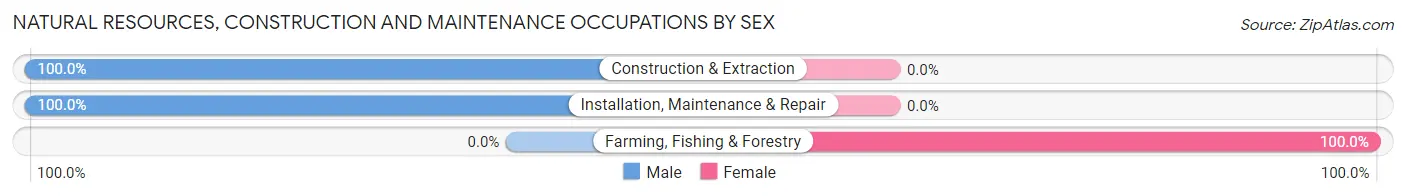
Natural Resources, Construction and Maintenance Occupations by Sex
| Occupation | Male | Female |
| Farming, Fishing & Forestry | 0 (0.0%) | 14 (100.0%) |
| Construction & Extraction | 70 (100.0%) | 0 (0.0%) |
| Installation, Maintenance & Repair | 51 (100.0%) | 0 (0.0%) |
| Total (Category) | 121 (89.6%) | 14 (10.4%) |
| Total (Overall) | 1,934 (51.2%) | 1,844 (48.8%) |
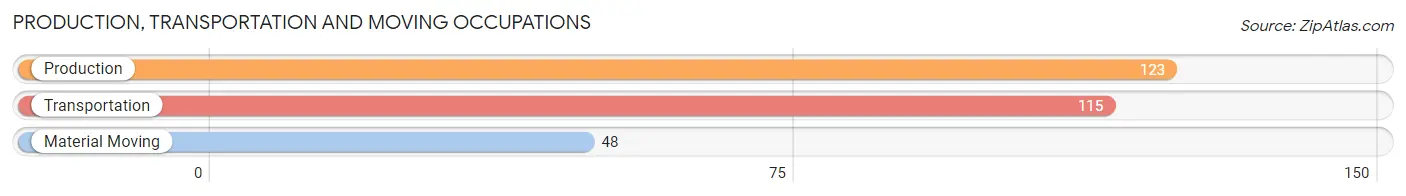
Production, Transportation and Moving Occupations
The most common Production, Transportation and Moving occupations in Delafield are Production (123 | 3.3%), Transportation (115 | 3.0%), and Material Moving (48 | 1.3%).
Production, Transportation and Moving Occupations by Sex
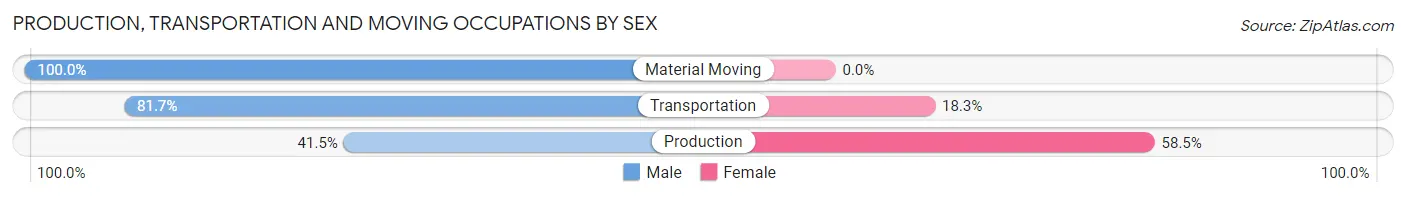
| Occupation | Male | Female |
| Production | 51 (41.5%) | 72 (58.5%) |
| Transportation | 94 (81.7%) | 21 (18.3%) |
| Material Moving | 48 (100.0%) | 0 (0.0%) |
| Total (Category) | 193 (67.5%) | 93 (32.5%) |
| Total (Overall) | 1,934 (51.2%) | 1,844 (48.8%) |
Employment Industries by Sex in Delafield
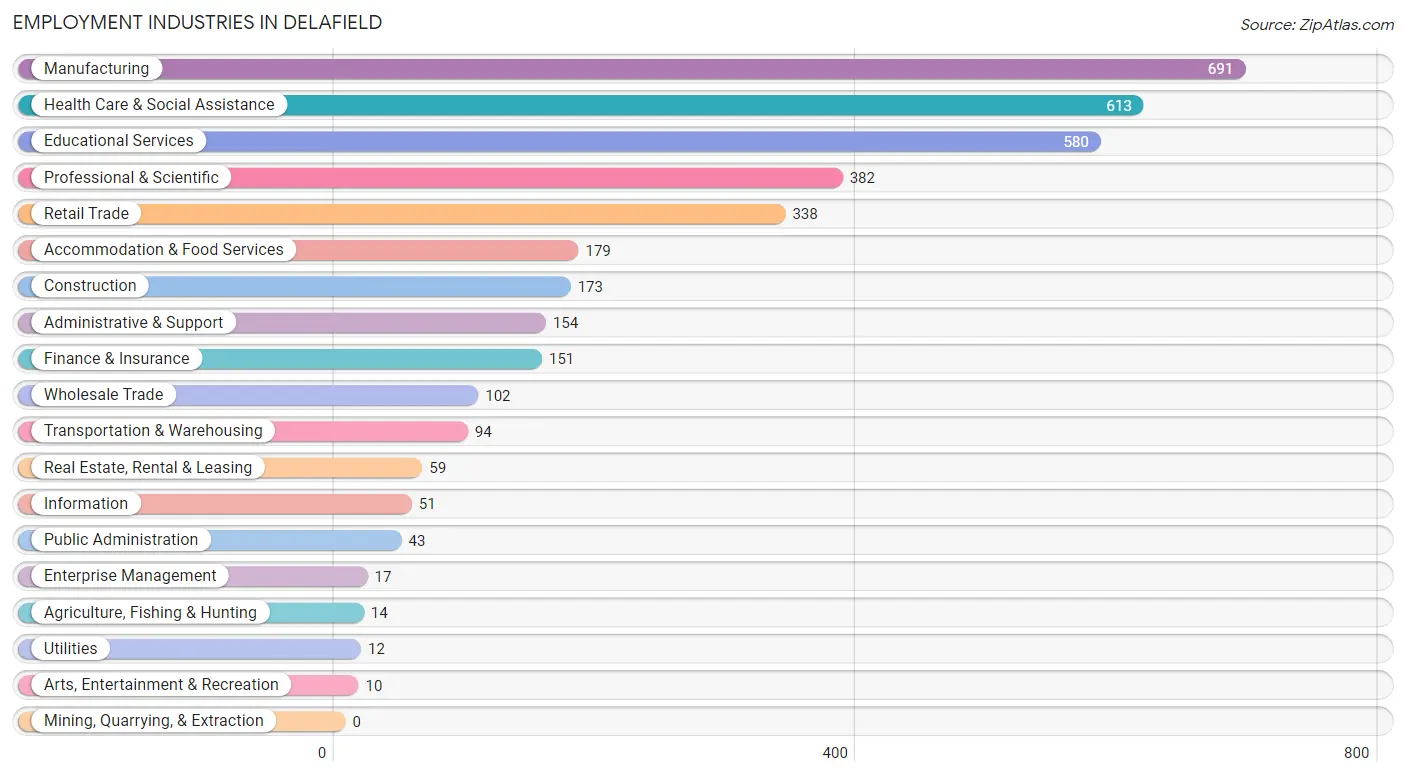
Employment Industries in Delafield
The major employment industries in Delafield include Manufacturing (691 | 18.3%), Health Care & Social Assistance (613 | 16.2%), Educational Services (580 | 15.3%), Professional & Scientific (382 | 10.1%), and Retail Trade (338 | 8.9%).
Employment Industries by Sex in Delafield
The Delafield industries that see more men than women are Transportation & Warehousing (100.0%), Utilities (100.0%), and Arts, Entertainment & Recreation (100.0%), whereas the industries that tend to have a higher number of women are Agriculture, Fishing & Hunting (100.0%), Enterprise Management (100.0%), and Health Care & Social Assistance (73.6%).
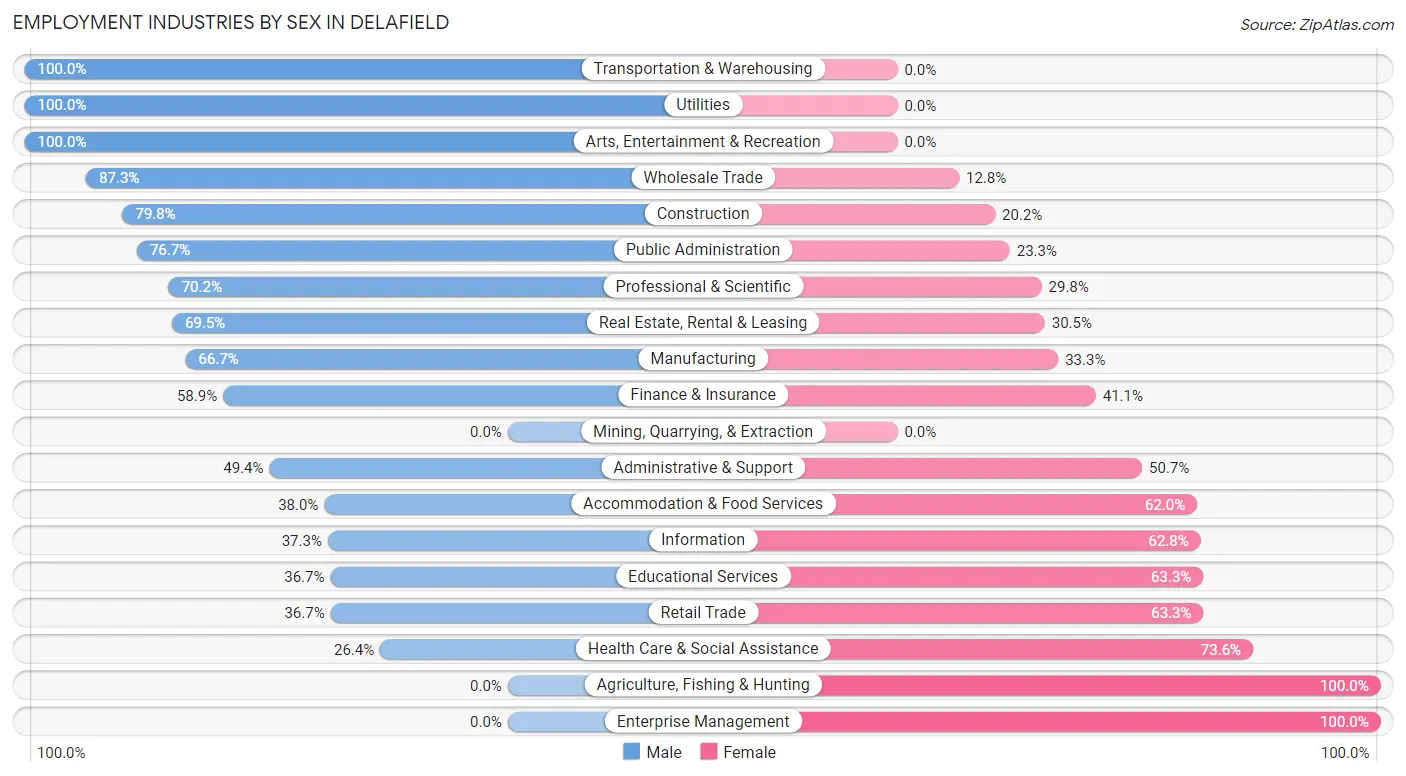
| Industry | Male | Female |
| Agriculture, Fishing & Hunting | 0 (0.0%) | 14 (100.0%) |
| Mining, Quarrying, & Extraction | 0 (0.0%) | 0 (0.0%) |
| Construction | 138 (79.8%) | 35 (20.2%) |
| Manufacturing | 461 (66.7%) | 230 (33.3%) |
| Wholesale Trade | 89 (87.3%) | 13 (12.8%) |
| Retail Trade | 124 (36.7%) | 214 (63.3%) |
| Transportation & Warehousing | 94 (100.0%) | 0 (0.0%) |
| Utilities | 12 (100.0%) | 0 (0.0%) |
| Information | 19 (37.2%) | 32 (62.7%) |
| Finance & Insurance | 89 (58.9%) | 62 (41.1%) |
| Real Estate, Rental & Leasing | 41 (69.5%) | 18 (30.5%) |
| Professional & Scientific | 268 (70.2%) | 114 (29.8%) |
| Enterprise Management | 0 (0.0%) | 17 (100.0%) |
| Administrative & Support | 76 (49.3%) | 78 (50.6%) |
| Educational Services | 213 (36.7%) | 367 (63.3%) |
| Health Care & Social Assistance | 162 (26.4%) | 451 (73.6%) |
| Arts, Entertainment & Recreation | 10 (100.0%) | 0 (0.0%) |
| Accommodation & Food Services | 68 (38.0%) | 111 (62.0%) |
| Public Administration | 33 (76.7%) | 10 (23.3%) |
| Total | 1,934 (51.2%) | 1,844 (48.8%) |
Education in Delafield
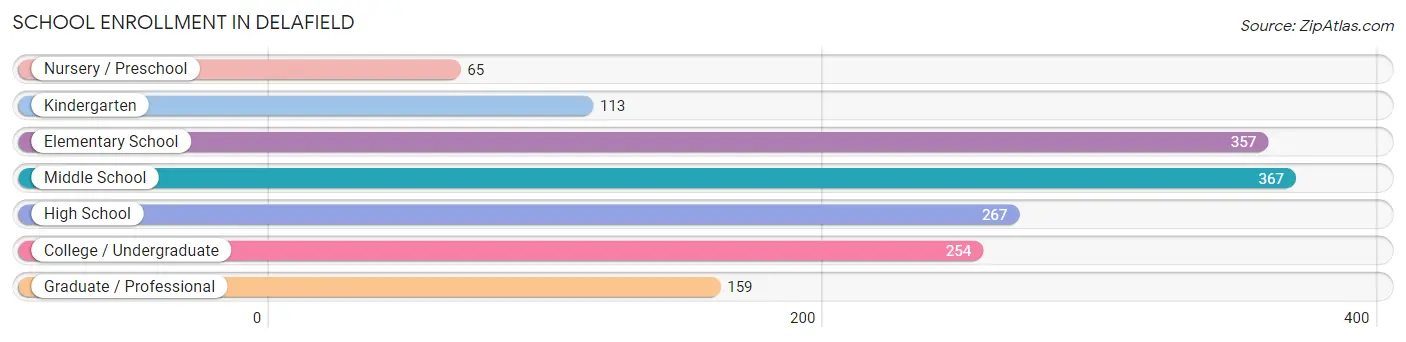
School Enrollment in Delafield
The most common levels of schooling among the 1,582 students in Delafield are middle school (367 | 23.2%), elementary school (357 | 22.6%), and high school (267 | 16.9%).
| School Level | # Students | % Students |
| Nursery / Preschool | 65 | 4.1% |
| Kindergarten | 113 | 7.1% |
| Elementary School | 357 | 22.6% |
| Middle School | 367 | 23.2% |
| High School | 267 | 16.9% |
| College / Undergraduate | 254 | 16.1% |
| Graduate / Professional | 159 | 10.1% |
| Total | 1,582 | 100.0% |
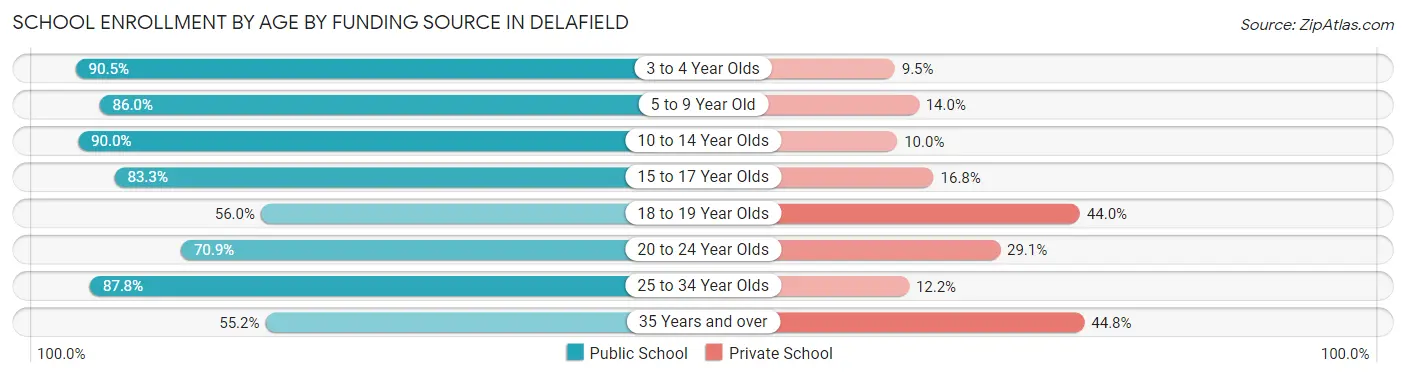
School Enrollment by Age by Funding Source in Delafield
Out of a total of 1,582 students who are enrolled in schools in Delafield, 275 (17.4%) attend a private institution, while the remaining 1,307 (82.6%) are enrolled in public schools. The age group of 35 years and over has the highest likelihood of being enrolled in private schools, with 39 (44.8% in the age bracket) enrolled. Conversely, the age group of 3 to 4 year olds has the lowest likelihood of being enrolled in a private school, with 95 (90.5% in the age bracket) attending a public institution.
| Age Bracket | Public School | Private School |
| 3 to 4 Year Olds | 95 (90.5%) | 10 (9.5%) |
| 5 to 9 Year Old | 363 (86.0%) | 59 (14.0%) |
| 10 to 14 Year Olds | 397 (90.0%) | 44 (10.0%) |
| 15 to 17 Year Olds | 164 (83.3%) | 33 (16.8%) |
| 18 to 19 Year Olds | 28 (56.0%) | 22 (44.0%) |
| 20 to 24 Year Olds | 146 (70.9%) | 60 (29.1%) |
| 25 to 34 Year Olds | 65 (87.8%) | 9 (12.2%) |
| 35 Years and over | 48 (55.2%) | 39 (44.8%) |
| Total | 1,307 (82.6%) | 275 (17.4%) |
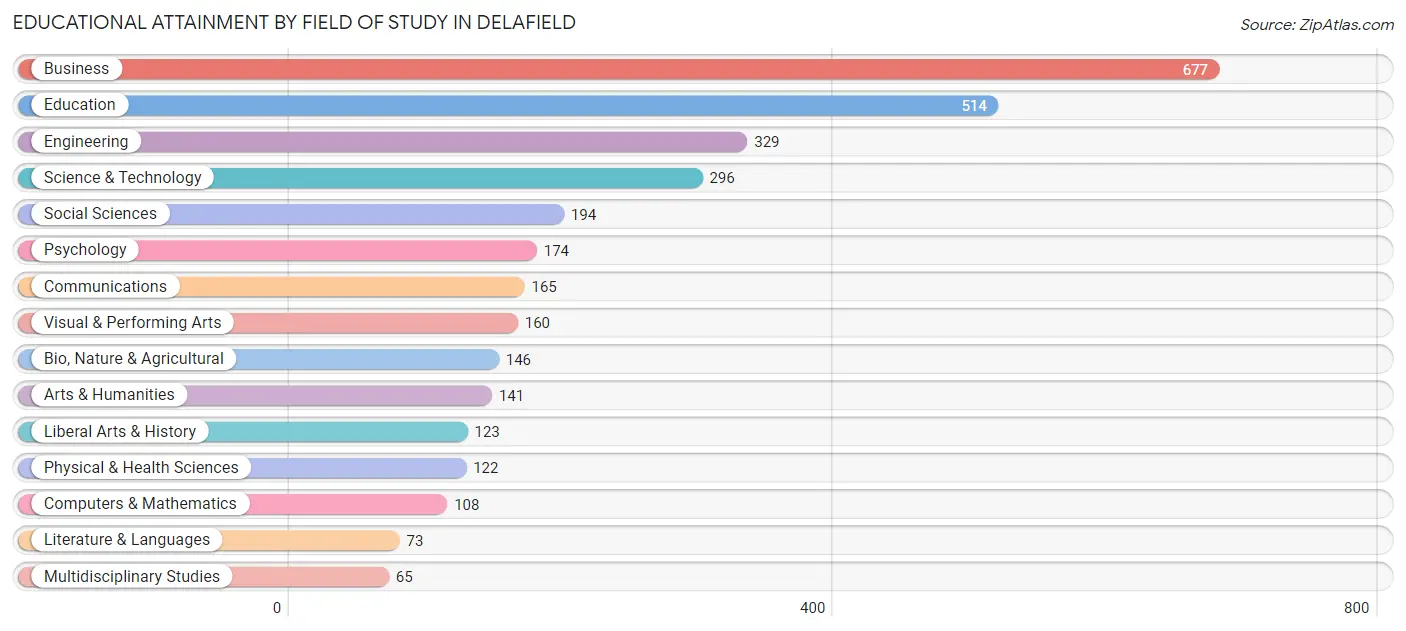
Educational Attainment by Field of Study in Delafield
Business (677 | 20.6%), education (514 | 15.6%), engineering (329 | 10.0%), science & technology (296 | 9.0%), and social sciences (194 | 5.9%) are the most common fields of study among 3,287 individuals in Delafield who have obtained a bachelor's degree or higher.
| Field of Study | # Graduates | % Graduates |
| Computers & Mathematics | 108 | 3.3% |
| Bio, Nature & Agricultural | 146 | 4.4% |
| Physical & Health Sciences | 122 | 3.7% |
| Psychology | 174 | 5.3% |
| Social Sciences | 194 | 5.9% |
| Engineering | 329 | 10.0% |
| Multidisciplinary Studies | 65 | 2.0% |
| Science & Technology | 296 | 9.0% |
| Business | 677 | 20.6% |
| Education | 514 | 15.6% |
| Literature & Languages | 73 | 2.2% |
| Liberal Arts & History | 123 | 3.7% |
| Visual & Performing Arts | 160 | 4.9% |
| Communications | 165 | 5.0% |
| Arts & Humanities | 141 | 4.3% |
| Total | 3,287 | 100.0% |
Transportation & Commute in Delafield
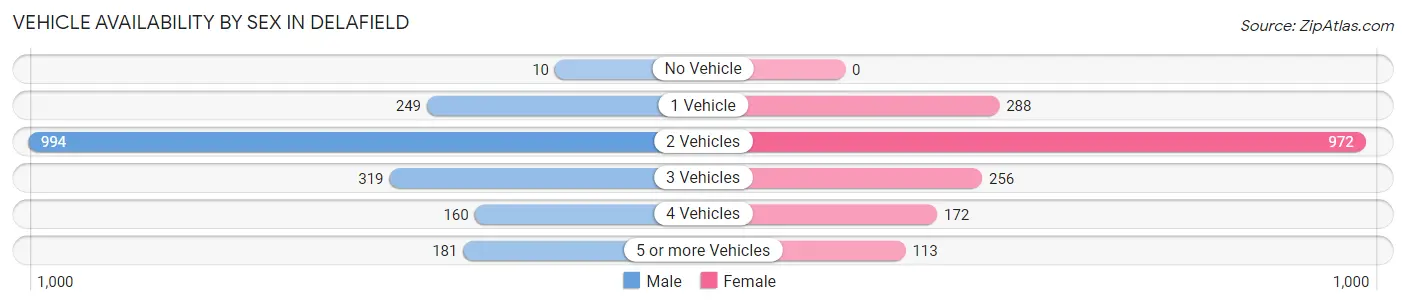
Vehicle Availability by Sex in Delafield
The most prevalent vehicle ownership categories in Delafield are males with 2 vehicles (994, accounting for 52.0%) and females with 2 vehicles (972, making up 55.2%).
| Vehicles Available | Male | Female |
| No Vehicle | 10 (0.5%) | 0 (0.0%) |
| 1 Vehicle | 249 (13.0%) | 288 (16.0%) |
| 2 Vehicles | 994 (52.0%) | 972 (54.0%) |
| 3 Vehicles | 319 (16.7%) | 256 (14.2%) |
| 4 Vehicles | 160 (8.4%) | 172 (9.6%) |
| 5 or more Vehicles | 181 (9.5%) | 113 (6.3%) |
| Total | 1,913 (100.0%) | 1,801 (100.0%) |
Commute Time in Delafield
The most frequently occuring commute durations in Delafield are 20 to 24 minutes (485 commuters, 15.1%), 10 to 14 minutes (430 commuters, 13.4%), and 5 to 9 minutes (360 commuters, 11.2%).
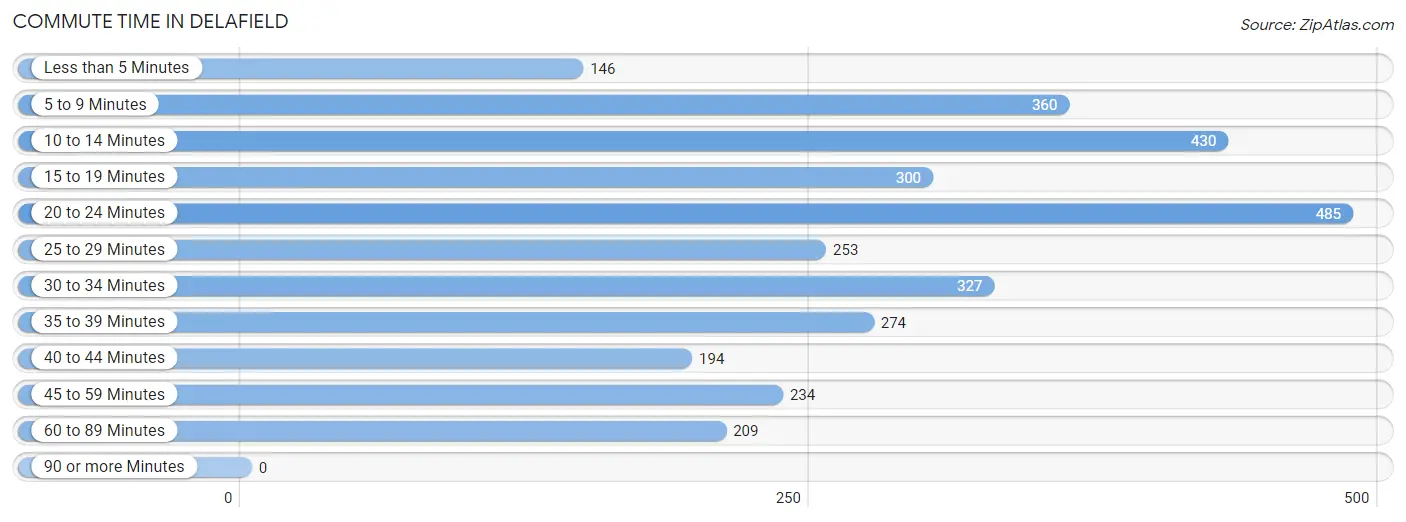
| Commute Time | # Commuters | % Commuters |
| Less than 5 Minutes | 146 | 4.5% |
| 5 to 9 Minutes | 360 | 11.2% |
| 10 to 14 Minutes | 430 | 13.4% |
| 15 to 19 Minutes | 300 | 9.3% |
| 20 to 24 Minutes | 485 | 15.1% |
| 25 to 29 Minutes | 253 | 7.9% |
| 30 to 34 Minutes | 327 | 10.2% |
| 35 to 39 Minutes | 274 | 8.5% |
| 40 to 44 Minutes | 194 | 6.0% |
| 45 to 59 Minutes | 234 | 7.3% |
| 60 to 89 Minutes | 209 | 6.5% |
| 90 or more Minutes | 0 | 0.0% |
Commute Time by Sex in Delafield
The most common commute times in Delafield are 20 to 24 minutes (279 commuters, 16.6%) for males and 10 to 14 minutes (232 commuters, 15.2%) for females.
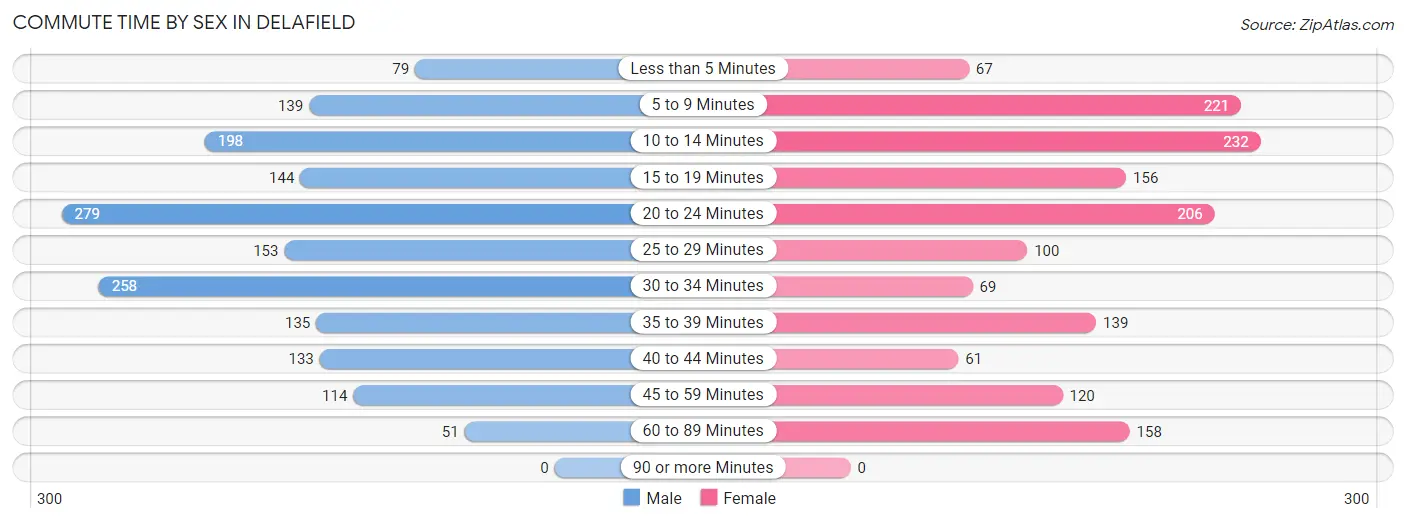
| Commute Time | Male | Female |
| Less than 5 Minutes | 79 (4.7%) | 67 (4.4%) |
| 5 to 9 Minutes | 139 (8.3%) | 221 (14.4%) |
| 10 to 14 Minutes | 198 (11.8%) | 232 (15.2%) |
| 15 to 19 Minutes | 144 (8.6%) | 156 (10.2%) |
| 20 to 24 Minutes | 279 (16.6%) | 206 (13.5%) |
| 25 to 29 Minutes | 153 (9.1%) | 100 (6.5%) |
| 30 to 34 Minutes | 258 (15.3%) | 69 (4.5%) |
| 35 to 39 Minutes | 135 (8.0%) | 139 (9.1%) |
| 40 to 44 Minutes | 133 (7.9%) | 61 (4.0%) |
| 45 to 59 Minutes | 114 (6.8%) | 120 (7.9%) |
| 60 to 89 Minutes | 51 (3.0%) | 158 (10.3%) |
| 90 or more Minutes | 0 (0.0%) | 0 (0.0%) |
Time of Departure to Work by Sex in Delafield
The most frequent times of departure to work in Delafield are 7:00 AM to 7:29 AM (411, 24.4%) for males and 7:30 AM to 7:59 AM (292, 19.1%) for females.
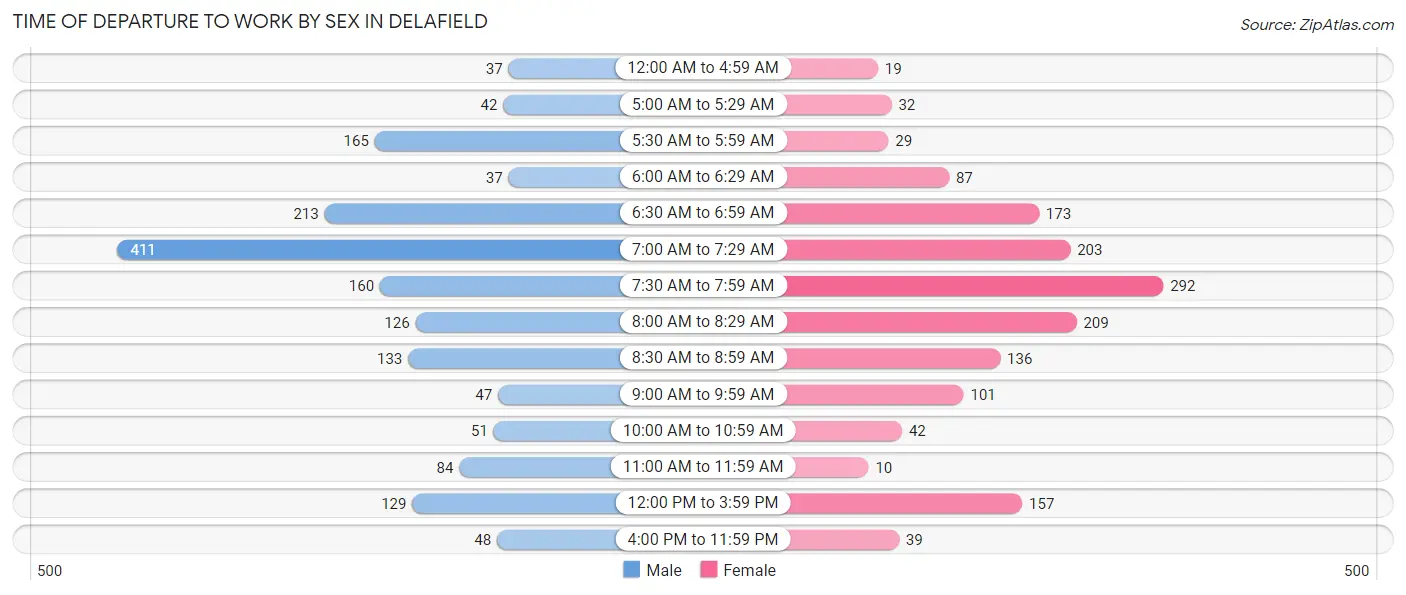
| Time of Departure | Male | Female |
| 12:00 AM to 4:59 AM | 37 (2.2%) | 19 (1.2%) |
| 5:00 AM to 5:29 AM | 42 (2.5%) | 32 (2.1%) |
| 5:30 AM to 5:59 AM | 165 (9.8%) | 29 (1.9%) |
| 6:00 AM to 6:29 AM | 37 (2.2%) | 87 (5.7%) |
| 6:30 AM to 6:59 AM | 213 (12.7%) | 173 (11.3%) |
| 7:00 AM to 7:29 AM | 411 (24.4%) | 203 (13.3%) |
| 7:30 AM to 7:59 AM | 160 (9.5%) | 292 (19.1%) |
| 8:00 AM to 8:29 AM | 126 (7.5%) | 209 (13.7%) |
| 8:30 AM to 8:59 AM | 133 (7.9%) | 136 (8.9%) |
| 9:00 AM to 9:59 AM | 47 (2.8%) | 101 (6.6%) |
| 10:00 AM to 10:59 AM | 51 (3.0%) | 42 (2.8%) |
| 11:00 AM to 11:59 AM | 84 (5.0%) | 10 (0.6%) |
| 12:00 PM to 3:59 PM | 129 (7.7%) | 157 (10.3%) |
| 4:00 PM to 11:59 PM | 48 (2.9%) | 39 (2.5%) |
| Total | 1,683 (100.0%) | 1,529 (100.0%) |
Housing Occupancy in Delafield
Occupancy by Ownership in Delafield
Of the total 3,182 dwellings in Delafield, owner-occupied units account for 2,103 (66.1%), while renter-occupied units make up 1,079 (33.9%).
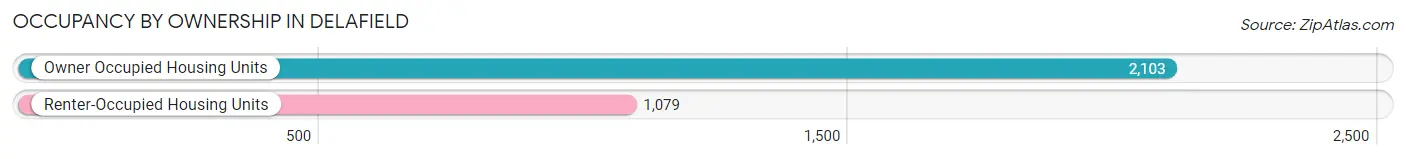
| Occupancy | # Housing Units | % Housing Units |
| Owner Occupied Housing Units | 2,103 | 66.1% |
| Renter-Occupied Housing Units | 1,079 | 33.9% |
| Total Occupied Housing Units | 3,182 | 100.0% |
Occupancy by Household Size in Delafield
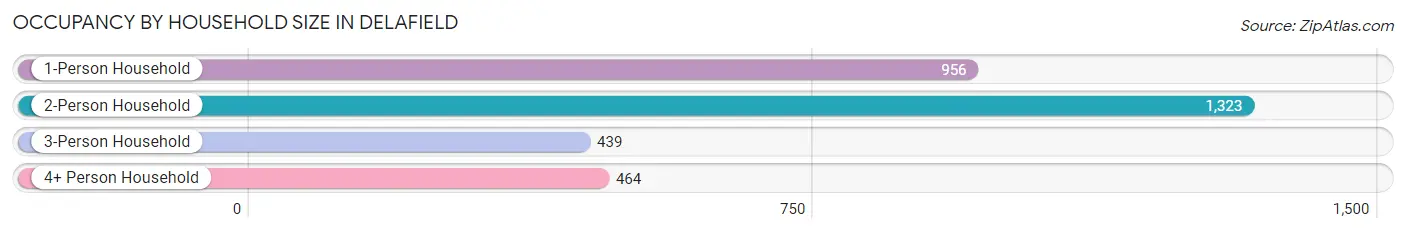
| Household Size | # Housing Units | % Housing Units |
| 1-Person Household | 956 | 30.0% |
| 2-Person Household | 1,323 | 41.6% |
| 3-Person Household | 439 | 13.8% |
| 4+ Person Household | 464 | 14.6% |
| Total Housing Units | 3,182 | 100.0% |
Occupancy by Ownership by Household Size in Delafield
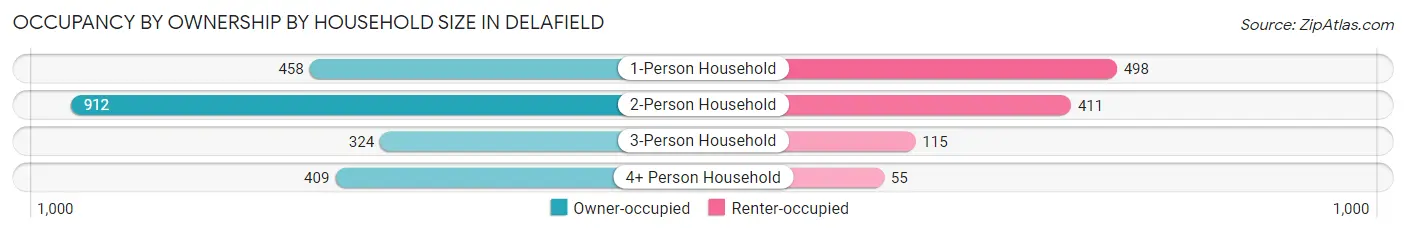
| Household Size | Owner-occupied | Renter-occupied |
| 1-Person Household | 458 (47.9%) | 498 (52.1%) |
| 2-Person Household | 912 (68.9%) | 411 (31.1%) |
| 3-Person Household | 324 (73.8%) | 115 (26.2%) |
| 4+ Person Household | 409 (88.1%) | 55 (11.8%) |
| Total Housing Units | 2,103 (66.1%) | 1,079 (33.9%) |
Occupancy by Educational Attainment in Delafield
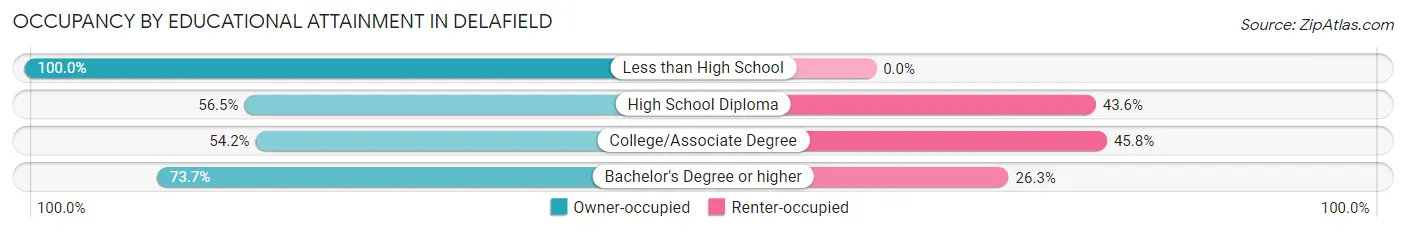
| Household Size | Owner-occupied | Renter-occupied |
| Less than High School | 29 (100.0%) | 0 (0.0%) |
| High School Diploma | 293 (56.5%) | 226 (43.5%) |
| College/Associate Degree | 448 (54.2%) | 378 (45.8%) |
| Bachelor's Degree or higher | 1,333 (73.7%) | 475 (26.3%) |
Occupancy by Age of Householder in Delafield
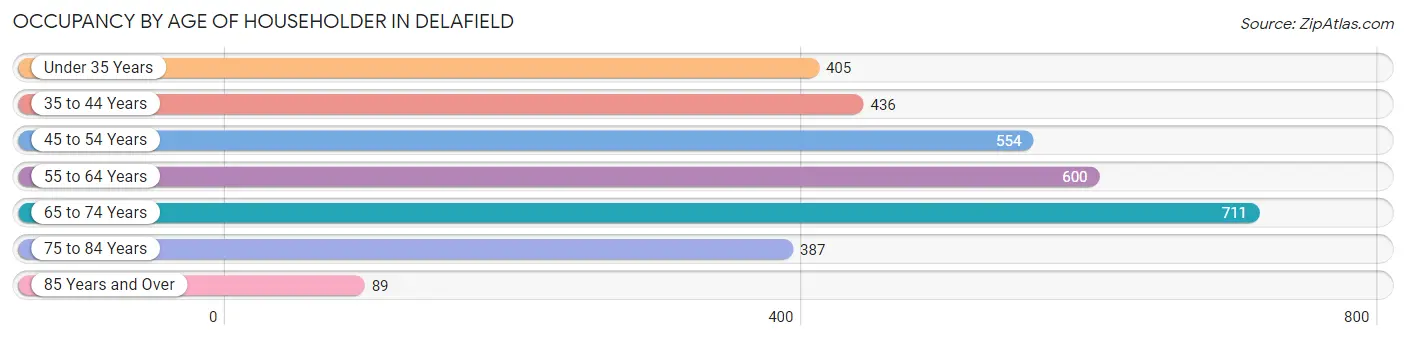
| Age Bracket | # Households | % Households |
| Under 35 Years | 405 | 12.7% |
| 35 to 44 Years | 436 | 13.7% |
| 45 to 54 Years | 554 | 17.4% |
| 55 to 64 Years | 600 | 18.9% |
| 65 to 74 Years | 711 | 22.3% |
| 75 to 84 Years | 387 | 12.2% |
| 85 Years and Over | 89 | 2.8% |
| Total | 3,182 | 100.0% |
Housing Finances in Delafield
Median Income by Occupancy in Delafield
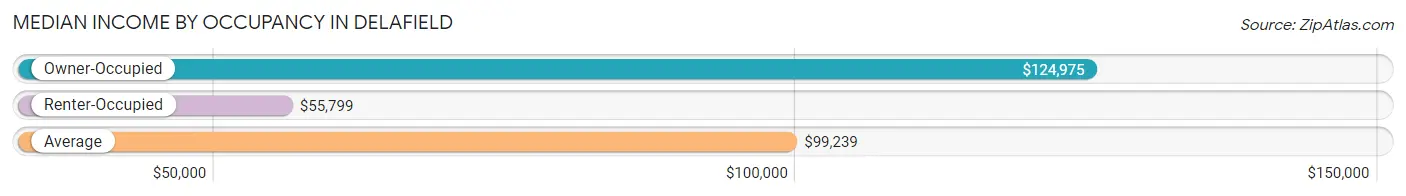
| Occupancy Type | # Households | Median Income |
| Owner-Occupied | 2,103 (66.1%) | $124,975 |
| Renter-Occupied | 1,079 (33.9%) | $55,799 |
| Average | 3,182 (100.0%) | $99,239 |
Occupancy by Householder Income Bracket in Delafield
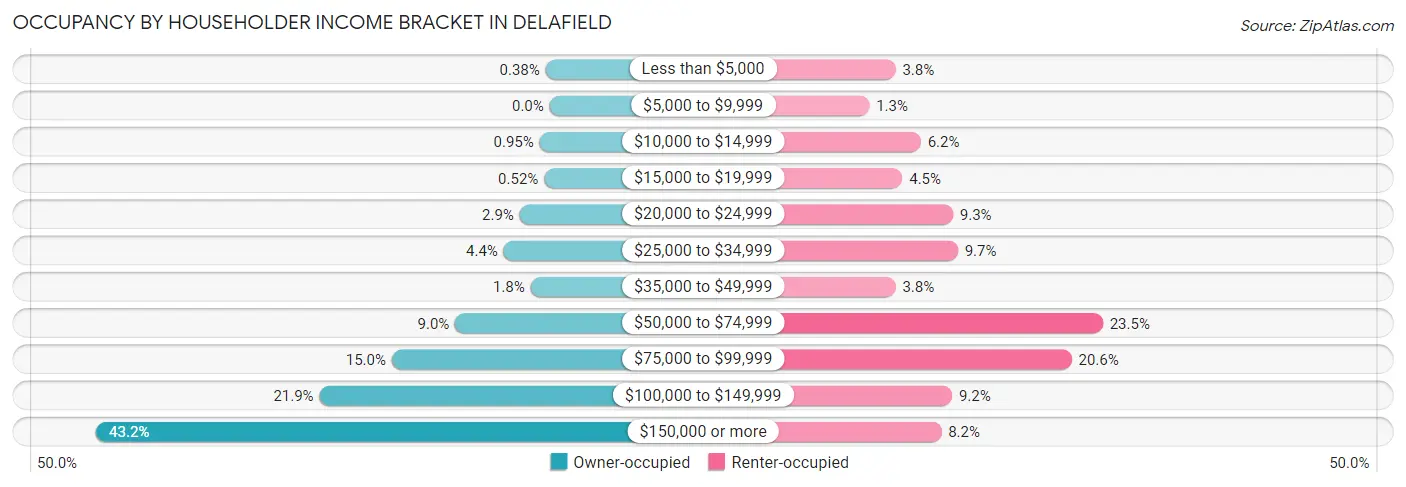
| Income Bracket | Owner-occupied | Renter-occupied |
| Less than $5,000 | 8 (0.4%) | 41 (3.8%) |
| $5,000 to $9,999 | 0 (0.0%) | 14 (1.3%) |
| $10,000 to $14,999 | 20 (0.9%) | 67 (6.2%) |
| $15,000 to $19,999 | 11 (0.5%) | 48 (4.4%) |
| $20,000 to $24,999 | 60 (2.9%) | 100 (9.3%) |
| $25,000 to $34,999 | 92 (4.4%) | 105 (9.7%) |
| $35,000 to $49,999 | 38 (1.8%) | 41 (3.8%) |
| $50,000 to $74,999 | 189 (9.0%) | 254 (23.5%) |
| $75,000 to $99,999 | 316 (15.0%) | 222 (20.6%) |
| $100,000 to $149,999 | 461 (21.9%) | 99 (9.2%) |
| $150,000 or more | 908 (43.2%) | 88 (8.2%) |
| Total | 2,103 (100.0%) | 1,079 (100.0%) |
Monthly Housing Cost Tiers in Delafield
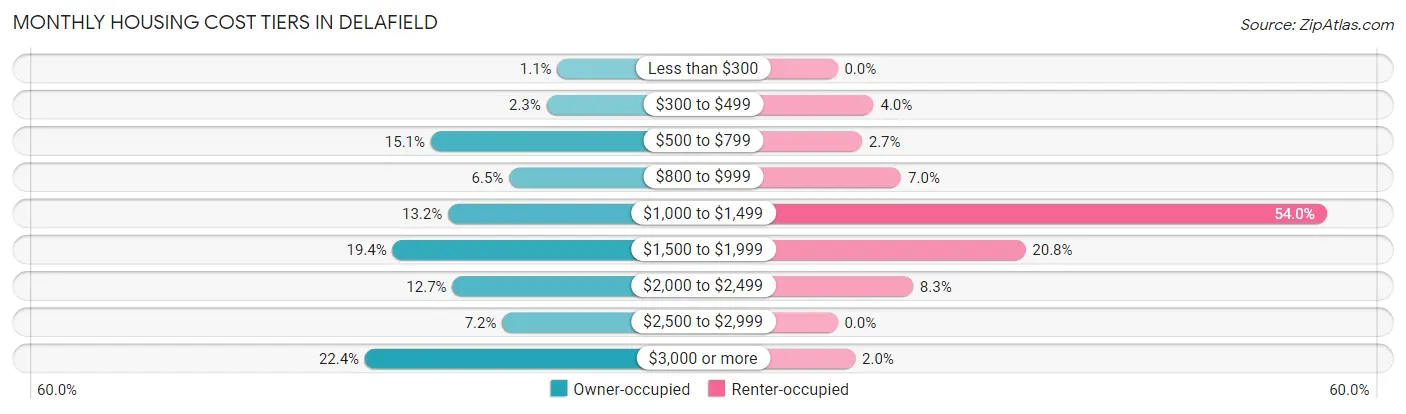
| Monthly Cost | Owner-occupied | Renter-occupied |
| Less than $300 | 24 (1.1%) | 0 (0.0%) |
| $300 to $499 | 49 (2.3%) | 43 (4.0%) |
| $500 to $799 | 318 (15.1%) | 29 (2.7%) |
| $800 to $999 | 136 (6.5%) | 76 (7.0%) |
| $1,000 to $1,499 | 278 (13.2%) | 583 (54.0%) |
| $1,500 to $1,999 | 407 (19.4%) | 224 (20.8%) |
| $2,000 to $2,499 | 268 (12.7%) | 90 (8.3%) |
| $2,500 to $2,999 | 152 (7.2%) | 0 (0.0%) |
| $3,000 or more | 471 (22.4%) | 21 (1.9%) |
| Total | 2,103 (100.0%) | 1,079 (100.0%) |
Physical Housing Characteristics in Delafield
Housing Structures in Delafield
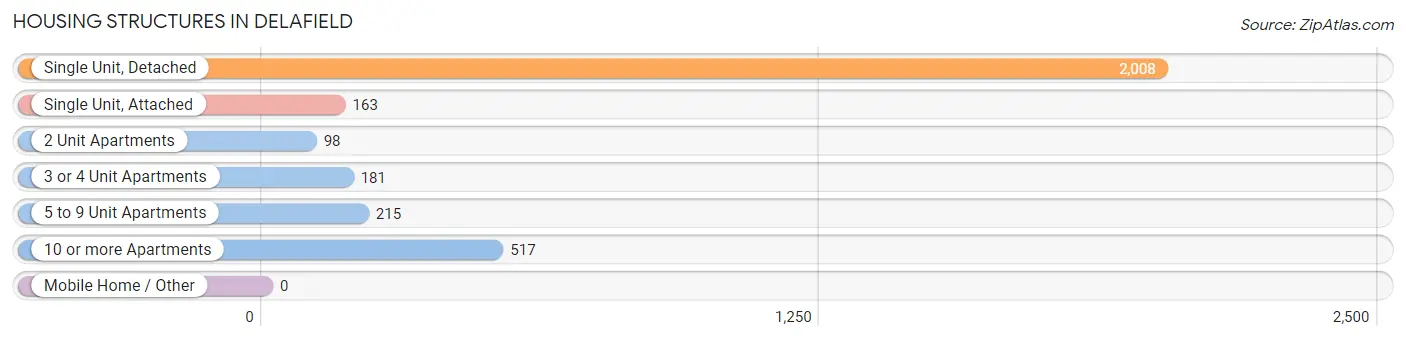
| Structure Type | # Housing Units | % Housing Units |
| Single Unit, Detached | 2,008 | 63.1% |
| Single Unit, Attached | 163 | 5.1% |
| 2 Unit Apartments | 98 | 3.1% |
| 3 or 4 Unit Apartments | 181 | 5.7% |
| 5 to 9 Unit Apartments | 215 | 6.8% |
| 10 or more Apartments | 517 | 16.3% |
| Mobile Home / Other | 0 | 0.0% |
| Total | 3,182 | 100.0% |
Housing Structures by Occupancy in Delafield
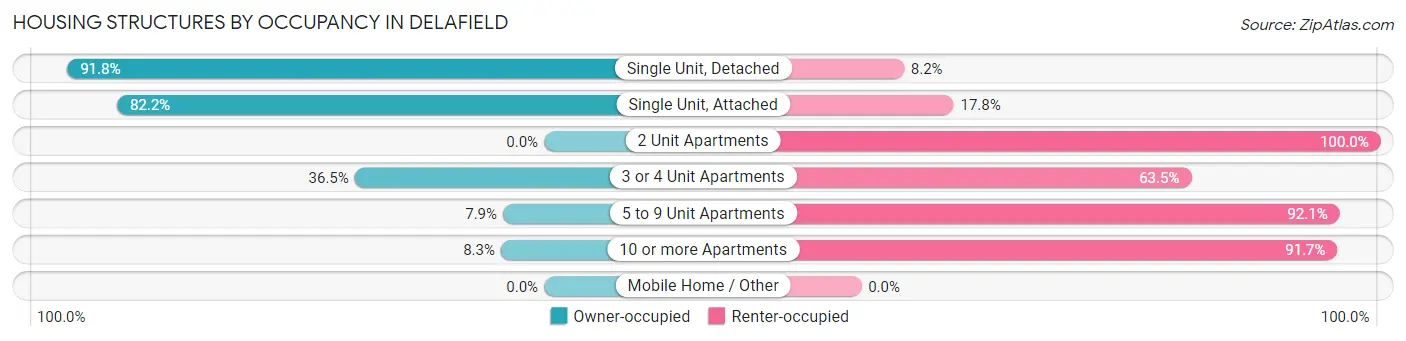
| Structure Type | Owner-occupied | Renter-occupied |
| Single Unit, Detached | 1,843 (91.8%) | 165 (8.2%) |
| Single Unit, Attached | 134 (82.2%) | 29 (17.8%) |
| 2 Unit Apartments | 0 (0.0%) | 98 (100.0%) |
| 3 or 4 Unit Apartments | 66 (36.5%) | 115 (63.5%) |
| 5 to 9 Unit Apartments | 17 (7.9%) | 198 (92.1%) |
| 10 or more Apartments | 43 (8.3%) | 474 (91.7%) |
| Mobile Home / Other | 0 (0.0%) | 0 (0.0%) |
| Total | 2,103 (66.1%) | 1,079 (33.9%) |
Housing Structures by Number of Rooms in Delafield
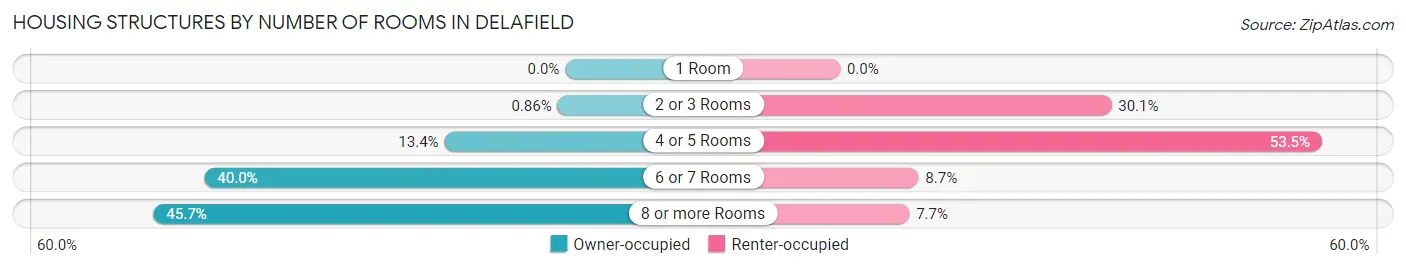
| Number of Rooms | Owner-occupied | Renter-occupied |
| 1 Room | 0 (0.0%) | 0 (0.0%) |
| 2 or 3 Rooms | 18 (0.9%) | 325 (30.1%) |
| 4 or 5 Rooms | 282 (13.4%) | 577 (53.5%) |
| 6 or 7 Rooms | 842 (40.0%) | 94 (8.7%) |
| 8 or more Rooms | 961 (45.7%) | 83 (7.7%) |
| Total | 2,103 (100.0%) | 1,079 (100.0%) |
Housing Structure by Heating Type in Delafield
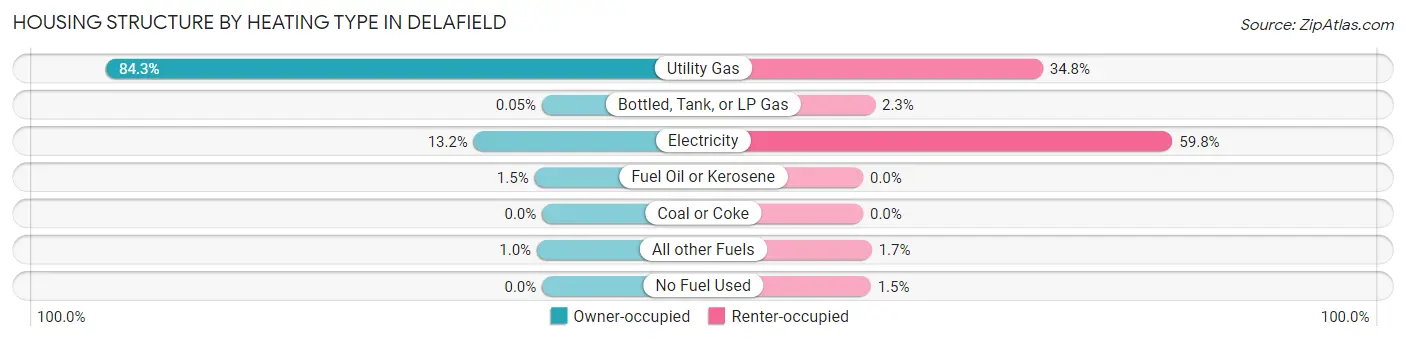
| Heating Type | Owner-occupied | Renter-occupied |
| Utility Gas | 1,772 (84.3%) | 375 (34.7%) |
| Bottled, Tank, or LP Gas | 1 (0.1%) | 25 (2.3%) |
| Electricity | 278 (13.2%) | 645 (59.8%) |
| Fuel Oil or Kerosene | 31 (1.5%) | 0 (0.0%) |
| Coal or Coke | 0 (0.0%) | 0 (0.0%) |
| All other Fuels | 21 (1.0%) | 18 (1.7%) |
| No Fuel Used | 0 (0.0%) | 16 (1.5%) |
| Total | 2,103 (100.0%) | 1,079 (100.0%) |
Household Vehicle Usage in Delafield
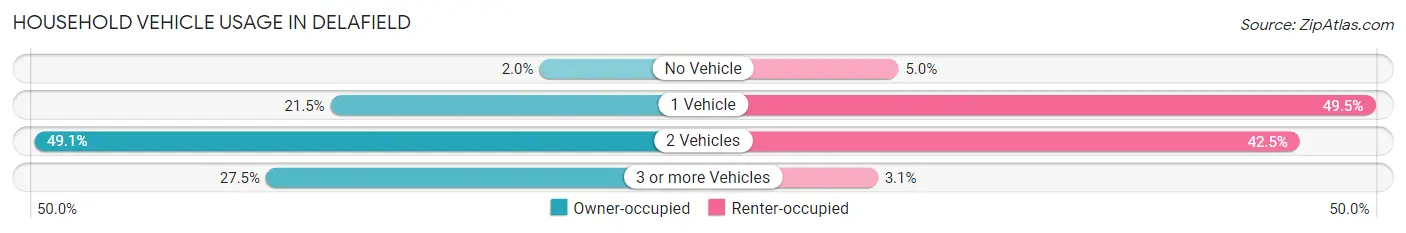
| Vehicles per Household | Owner-occupied | Renter-occupied |
| No Vehicle | 41 (1.9%) | 54 (5.0%) |
| 1 Vehicle | 451 (21.4%) | 534 (49.5%) |
| 2 Vehicles | 1,033 (49.1%) | 458 (42.4%) |
| 3 or more Vehicles | 578 (27.5%) | 33 (3.1%) |
| Total | 2,103 (100.0%) | 1,079 (100.0%) |
Real Estate & Mortgages in Delafield
Real Estate and Mortgage Overview in Delafield
| Characteristic | Without Mortgage | With Mortgage |
| Housing Units | 738 | 1,365 |
| Median Property Value | $430,000 | $468,100 |
| Median Household Income | $110,500 | $644 |
| Monthly Housing Costs | $840 | $456 |
| Real Estate Taxes | $5,895 | $0 |
Property Value by Mortgage Status in Delafield
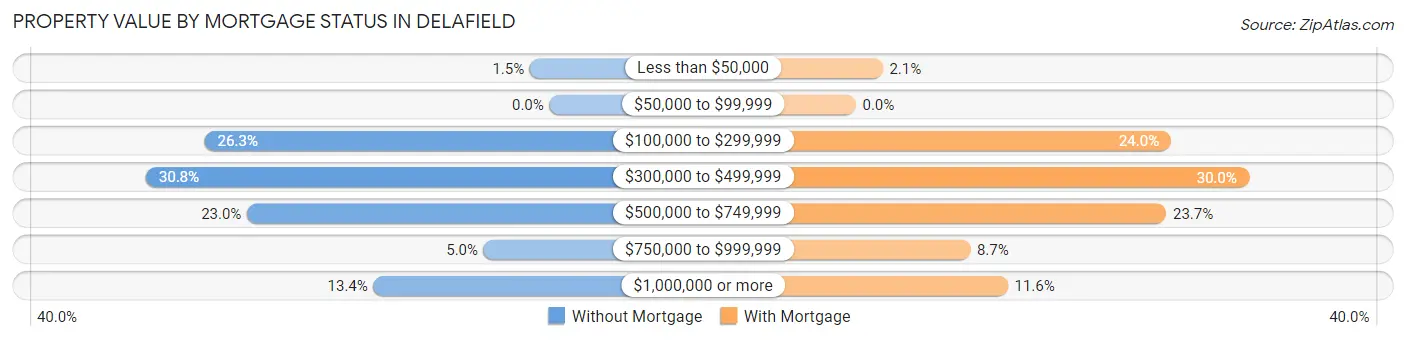
| Property Value | Without Mortgage | With Mortgage |
| Less than $50,000 | 11 (1.5%) | 28 (2.1%) |
| $50,000 to $99,999 | 0 (0.0%) | 0 (0.0%) |
| $100,000 to $299,999 | 194 (26.3%) | 328 (24.0%) |
| $300,000 to $499,999 | 227 (30.8%) | 409 (30.0%) |
| $500,000 to $749,999 | 170 (23.0%) | 323 (23.7%) |
| $750,000 to $999,999 | 37 (5.0%) | 119 (8.7%) |
| $1,000,000 or more | 99 (13.4%) | 158 (11.6%) |
| Total | 738 (100.0%) | 1,365 (100.0%) |
Household Income by Mortgage Status in Delafield
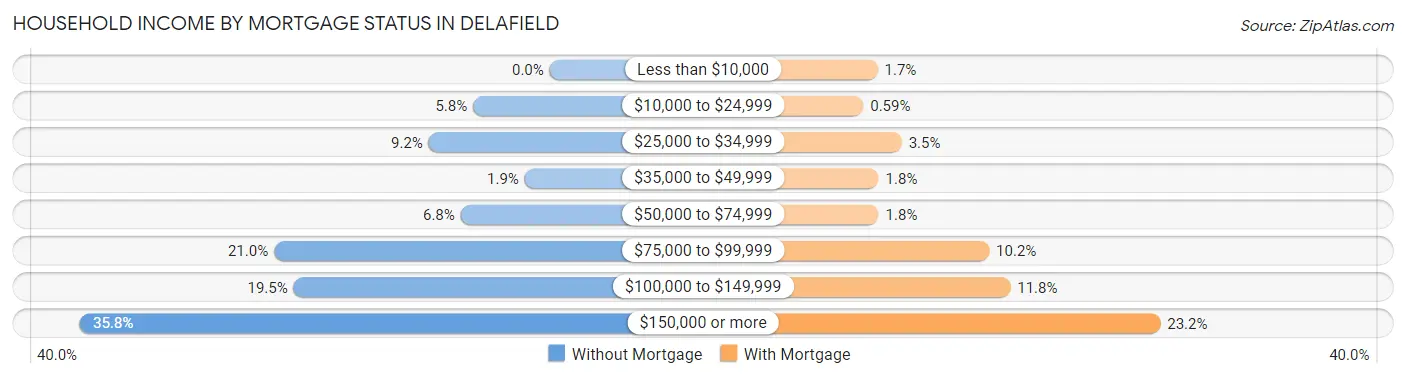
| Household Income | Without Mortgage | With Mortgage |
| Less than $10,000 | 0 (0.0%) | 23 (1.7%) |
| $10,000 to $24,999 | 43 (5.8%) | 8 (0.6%) |
| $25,000 to $34,999 | 68 (9.2%) | 48 (3.5%) |
| $35,000 to $49,999 | 14 (1.9%) | 24 (1.8%) |
| $50,000 to $74,999 | 50 (6.8%) | 24 (1.8%) |
| $75,000 to $99,999 | 155 (21.0%) | 139 (10.2%) |
| $100,000 to $149,999 | 144 (19.5%) | 161 (11.8%) |
| $150,000 or more | 264 (35.8%) | 317 (23.2%) |
| Total | 738 (100.0%) | 1,365 (100.0%) |
Property Value to Household Income Ratio in Delafield
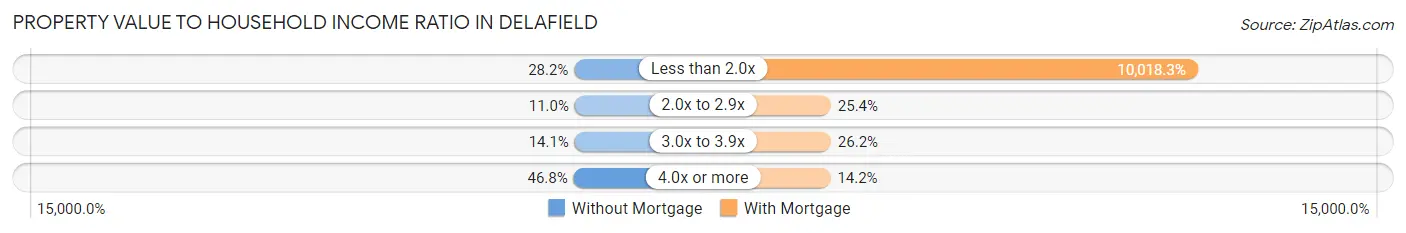
| Value-to-Income Ratio | Without Mortgage | With Mortgage |
| Less than 2.0x | 208 (28.2%) | 136,750 (10,018.3%) |
| 2.0x to 2.9x | 81 (11.0%) | 346 (25.4%) |
| 3.0x to 3.9x | 104 (14.1%) | 357 (26.2%) |
| 4.0x or more | 345 (46.8%) | 194 (14.2%) |
| Total | 738 (100.0%) | 1,365 (100.0%) |
Real Estate Taxes by Mortgage Status in Delafield
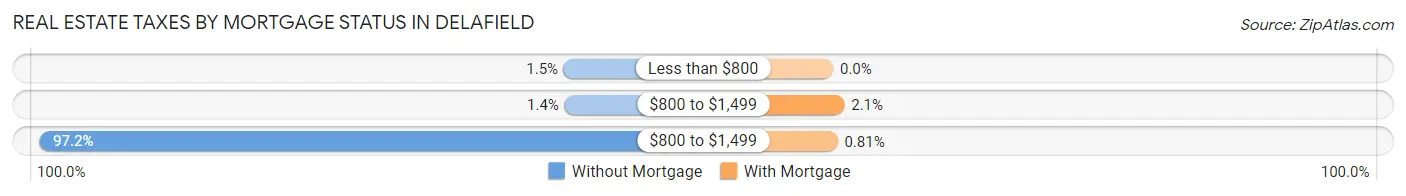
| Property Taxes | Without Mortgage | With Mortgage |
| Less than $800 | 11 (1.5%) | 0 (0.0%) |
| $800 to $1,499 | 10 (1.4%) | 28 (2.1%) |
| $800 to $1,499 | 717 (97.2%) | 11 (0.8%) |
| Total | 738 (100.0%) | 1,365 (100.0%) |
Health & Disability in Delafield
Health Insurance Coverage by Age in Delafield
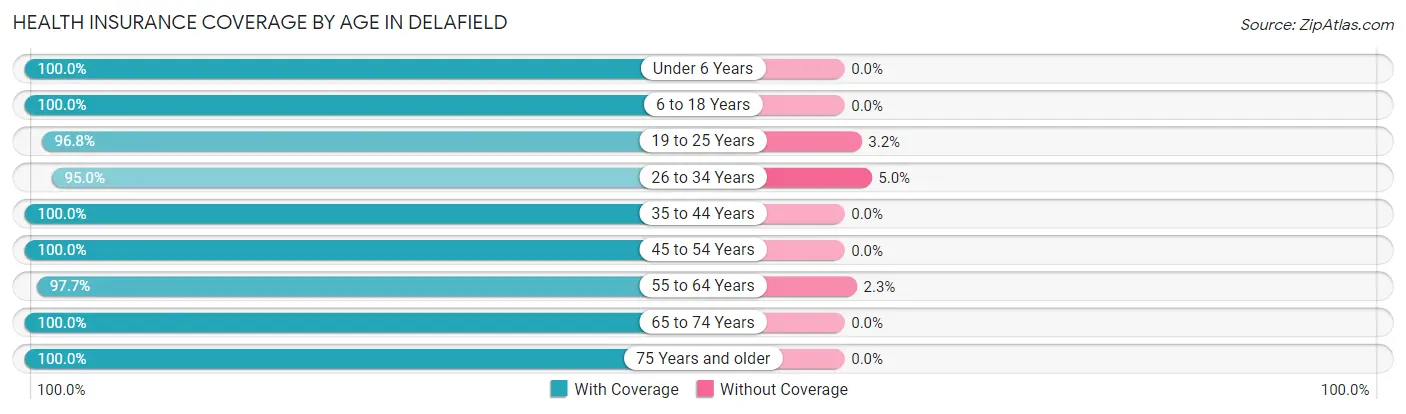
| Age Bracket | With Coverage | Without Coverage |
| Under 6 Years | 376 (100.0%) | 0 (0.0%) |
| 6 to 18 Years | 1,055 (100.0%) | 0 (0.0%) |
| 19 to 25 Years | 579 (96.8%) | 19 (3.2%) |
| 26 to 34 Years | 452 (95.0%) | 24 (5.0%) |
| 35 to 44 Years | 773 (100.0%) | 0 (0.0%) |
| 45 to 54 Years | 904 (100.0%) | 0 (0.0%) |
| 55 to 64 Years | 1,231 (97.7%) | 29 (2.3%) |
| 65 to 74 Years | 1,096 (100.0%) | 0 (0.0%) |
| 75 Years and older | 637 (100.0%) | 0 (0.0%) |
| Total | 7,103 (99.0%) | 72 (1.0%) |
Health Insurance Coverage by Citizenship Status in Delafield

| Citizenship Status | With Coverage | Without Coverage |
| Native Born | 376 (100.0%) | 0 (0.0%) |
| Foreign Born, Citizen | 1,055 (100.0%) | 0 (0.0%) |
| Foreign Born, not a Citizen | 579 (96.8%) | 19 (3.2%) |
Health Insurance Coverage by Household Income in Delafield
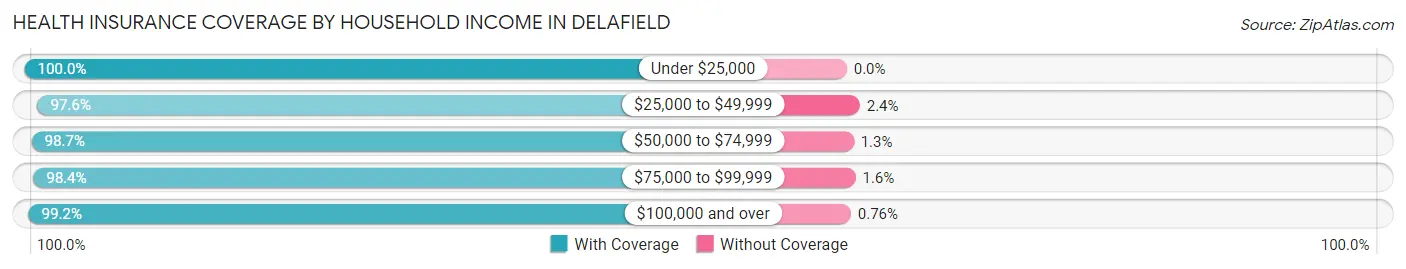
| Household Income | With Coverage | Without Coverage |
| Under $25,000 | 630 (100.0%) | 0 (0.0%) |
| $25,000 to $49,999 | 401 (97.6%) | 10 (2.4%) |
| $50,000 to $74,999 | 838 (98.7%) | 11 (1.3%) |
| $75,000 to $99,999 | 1,022 (98.4%) | 17 (1.6%) |
| $100,000 and over | 4,056 (99.2%) | 31 (0.8%) |
Public vs Private Health Insurance Coverage by Age in Delafield
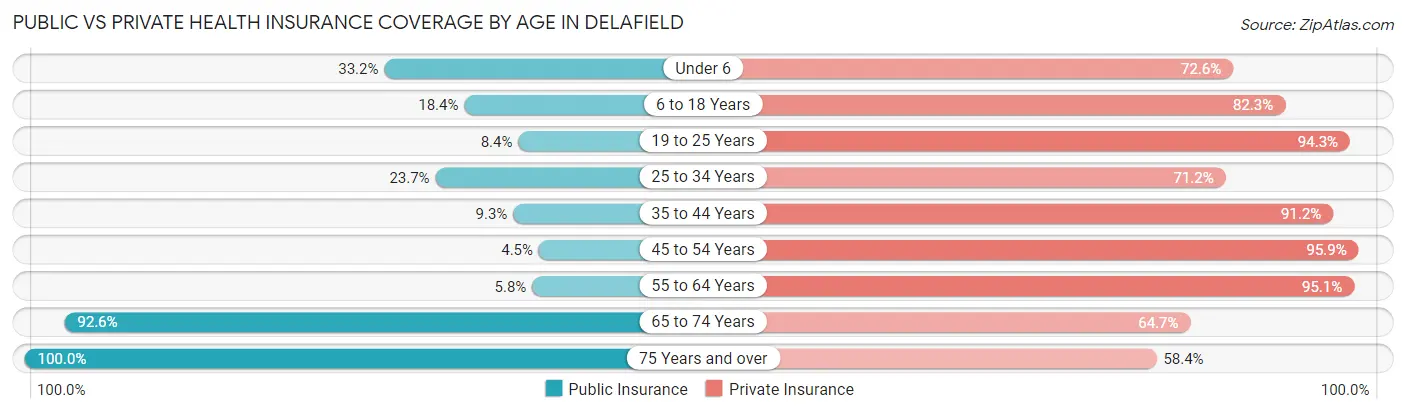
| Age Bracket | Public Insurance | Private Insurance |
| Under 6 | 125 (33.2%) | 273 (72.6%) |
| 6 to 18 Years | 194 (18.4%) | 868 (82.3%) |
| 19 to 25 Years | 50 (8.4%) | 564 (94.3%) |
| 25 to 34 Years | 113 (23.7%) | 339 (71.2%) |
| 35 to 44 Years | 72 (9.3%) | 705 (91.2%) |
| 45 to 54 Years | 41 (4.5%) | 867 (95.9%) |
| 55 to 64 Years | 73 (5.8%) | 1,198 (95.1%) |
| 65 to 74 Years | 1,015 (92.6%) | 709 (64.7%) |
| 75 Years and over | 637 (100.0%) | 372 (58.4%) |
| Total | 2,320 (32.3%) | 5,895 (82.2%) |
Disability Status by Sex by Age in Delafield
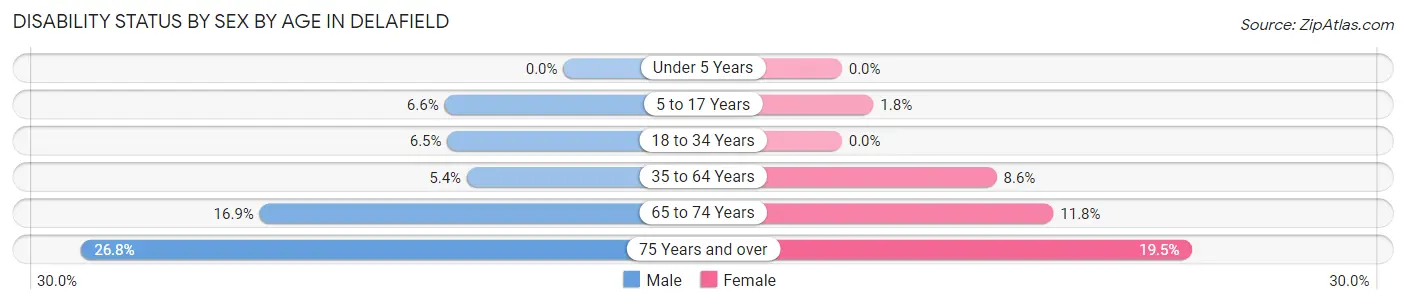
| Age Bracket | Male | Female |
| Under 5 Years | 0 (0.0%) | 0 (0.0%) |
| 5 to 17 Years | 36 (6.6%) | 9 (1.8%) |
| 18 to 34 Years | 37 (6.5%) | 0 (0.0%) |
| 35 to 64 Years | 78 (5.4%) | 128 (8.6%) |
| 65 to 74 Years | 92 (16.9%) | 65 (11.8%) |
| 75 Years and over | 62 (26.8%) | 79 (19.5%) |
Disability Class by Sex by Age in Delafield
Disability Class: Hearing Difficulty
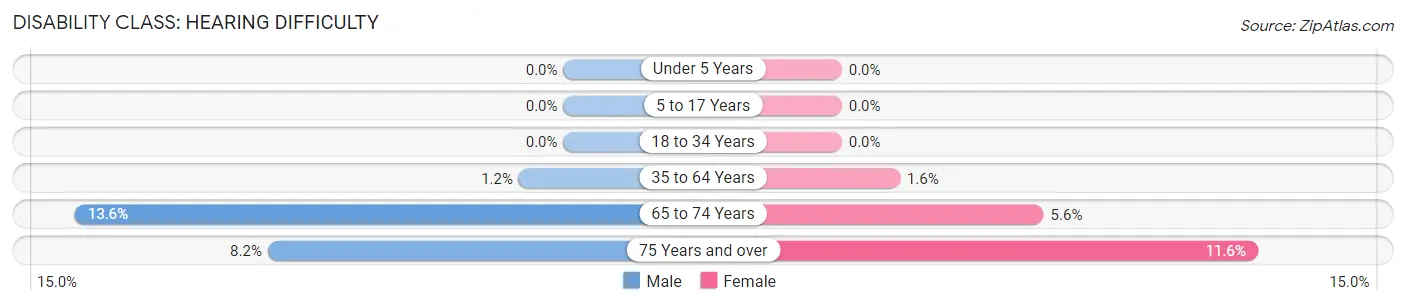
| Age Bracket | Male | Female |
| Under 5 Years | 0 (0.0%) | 0 (0.0%) |
| 5 to 17 Years | 0 (0.0%) | 0 (0.0%) |
| 18 to 34 Years | 0 (0.0%) | 0 (0.0%) |
| 35 to 64 Years | 18 (1.2%) | 24 (1.6%) |
| 65 to 74 Years | 74 (13.6%) | 31 (5.6%) |
| 75 Years and over | 19 (8.2%) | 47 (11.6%) |
Disability Class: Vision Difficulty
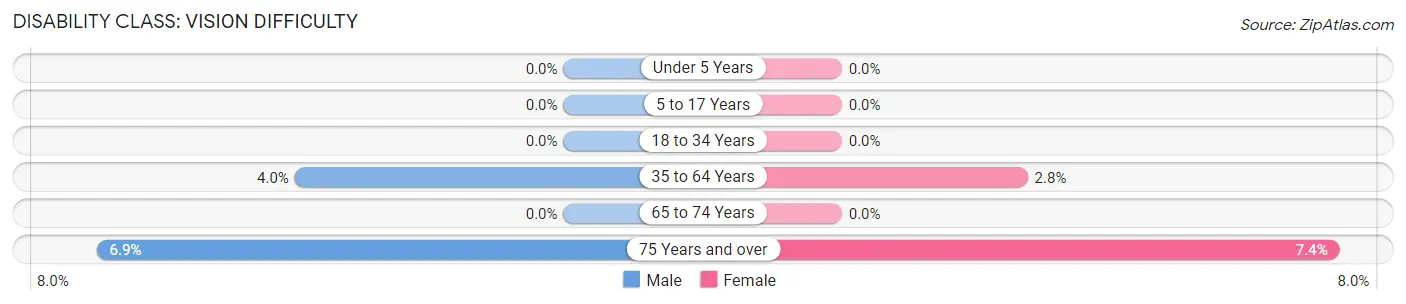
| Age Bracket | Male | Female |
| Under 5 Years | 0 (0.0%) | 0 (0.0%) |
| 5 to 17 Years | 0 (0.0%) | 0 (0.0%) |
| 18 to 34 Years | 0 (0.0%) | 0 (0.0%) |
| 35 to 64 Years | 58 (4.0%) | 41 (2.8%) |
| 65 to 74 Years | 0 (0.0%) | 0 (0.0%) |
| 75 Years and over | 16 (6.9%) | 30 (7.4%) |
Disability Class: Cognitive Difficulty
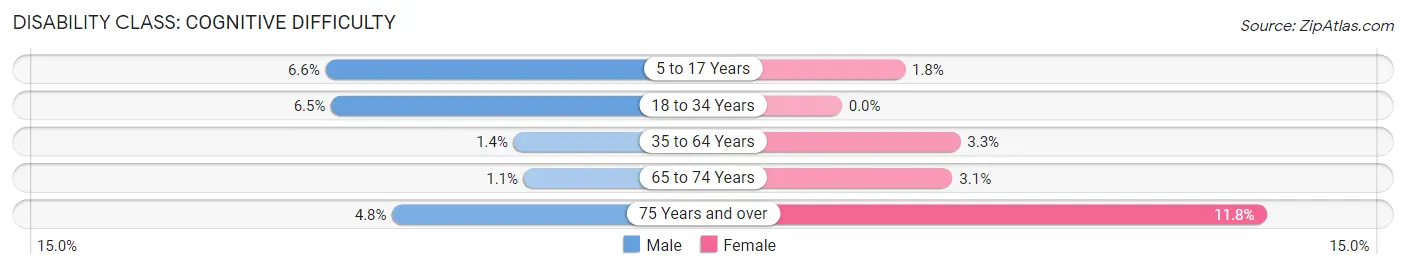
| Age Bracket | Male | Female |
| 5 to 17 Years | 36 (6.6%) | 9 (1.8%) |
| 18 to 34 Years | 37 (6.5%) | 0 (0.0%) |
| 35 to 64 Years | 20 (1.4%) | 49 (3.3%) |
| 65 to 74 Years | 6 (1.1%) | 17 (3.1%) |
| 75 Years and over | 11 (4.8%) | 48 (11.8%) |
Disability Class: Ambulatory Difficulty
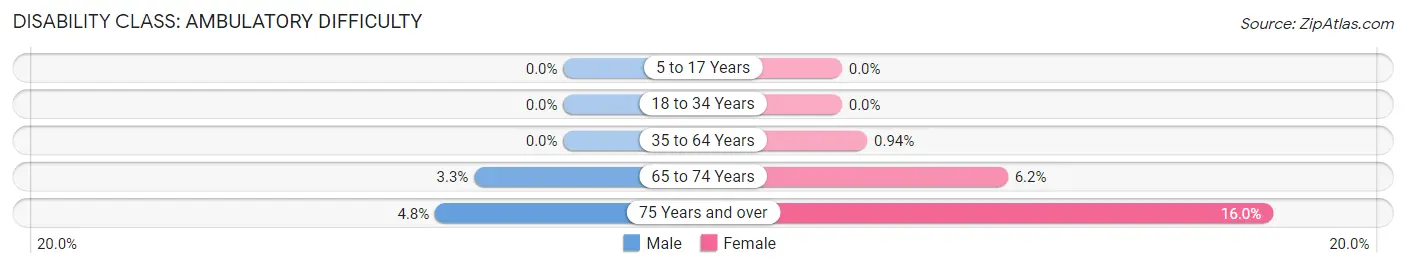
| Age Bracket | Male | Female |
| 5 to 17 Years | 0 (0.0%) | 0 (0.0%) |
| 18 to 34 Years | 0 (0.0%) | 0 (0.0%) |
| 35 to 64 Years | 0 (0.0%) | 14 (0.9%) |
| 65 to 74 Years | 18 (3.3%) | 34 (6.2%) |
| 75 Years and over | 11 (4.8%) | 65 (16.0%) |
Disability Class: Self-Care Difficulty
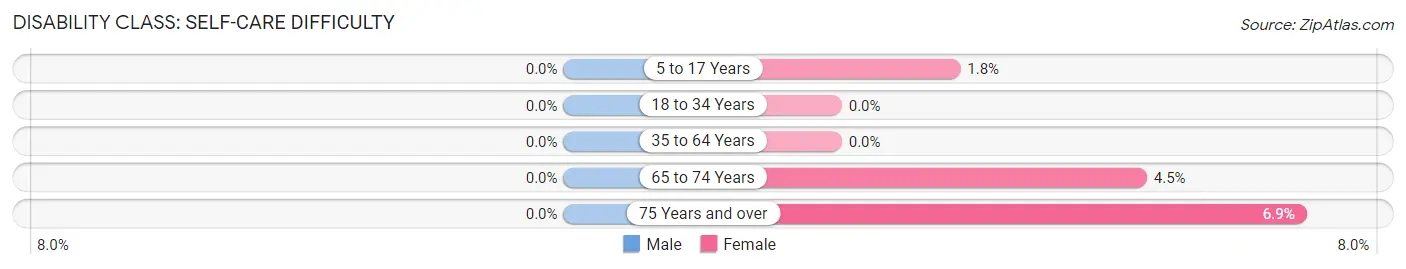
| Age Bracket | Male | Female |
| 5 to 17 Years | 0 (0.0%) | 9 (1.8%) |
| 18 to 34 Years | 0 (0.0%) | 0 (0.0%) |
| 35 to 64 Years | 0 (0.0%) | 0 (0.0%) |
| 65 to 74 Years | 0 (0.0%) | 25 (4.5%) |
| 75 Years and over | 0 (0.0%) | 28 (6.9%) |
Technology Access in Delafield
Computing Device Access in Delafield
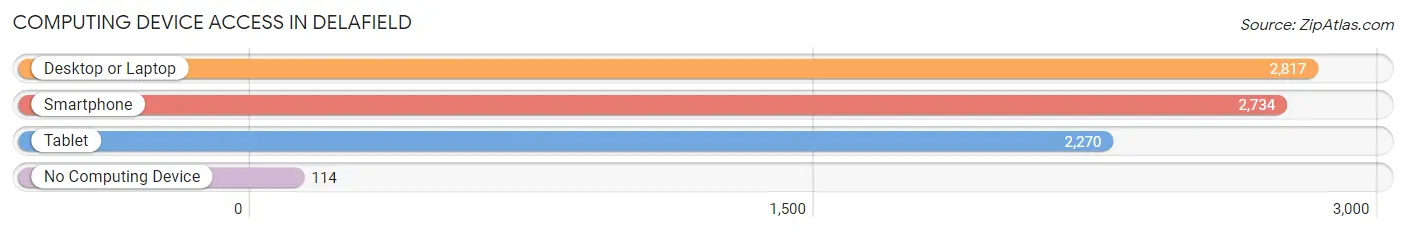
| Device Type | # Households | % Households |
| Desktop or Laptop | 2,817 | 88.5% |
| Smartphone | 2,734 | 85.9% |
| Tablet | 2,270 | 71.3% |
| No Computing Device | 114 | 3.6% |
| Total | 3,182 | 100.0% |
Internet Access in Delafield
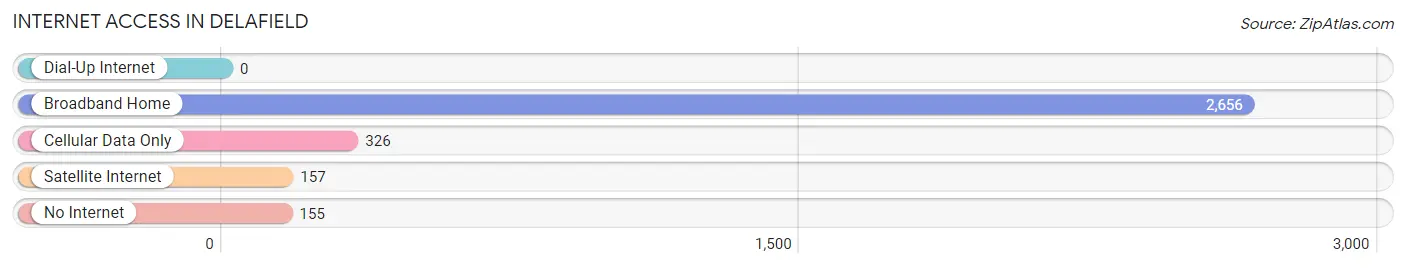
| Internet Type | # Households | % Households |
| Dial-Up Internet | 0 | 0.0% |
| Broadband Home | 2,656 | 83.5% |
| Cellular Data Only | 326 | 10.2% |
| Satellite Internet | 157 | 4.9% |
| No Internet | 155 | 4.9% |
| Total | 3,182 | 100.0% |
Delafield Summary
Delafield, Wisconsin is a small city located in Waukesha County, Wisconsin. It is situated on the western shore of Lake Nagawicka, about 25 miles west of Milwaukee. The city has a population of approximately 7,000 people and is part of the Milwaukee metropolitan area.
History
Delafield was first settled in 1836 by a group of settlers from New York. The city was named after the Delafield family, who were prominent in the area. The city was incorporated in 1839 and was the first city in Waukesha County.
In the late 19th century, Delafield was a popular summer resort destination for wealthy Milwaukeeans. The city was home to several grand hotels, including the Delafield Hotel, which was built in 1891 and is now a National Historic Landmark.
In the early 20th century, Delafield became a popular destination for wealthy Chicagoans. The city was home to several grand estates, including the estate of the late Chicago industrialist, John D. Rockefeller.
Geography
Delafield is located in southeastern Wisconsin, about 25 miles west of Milwaukee. The city is situated on the western shore of Lake Nagawicka, which is part of the Kettle Moraine State Forest. The city is surrounded by rolling hills and is home to several parks and nature preserves.
The city has a total area of 4.6 square miles, of which 4.3 square miles is land and 0.3 square miles is water. The city is located at an elevation of 830 feet above sea level.
Economy
Delafield’s economy is largely based on tourism and retail. The city is home to several popular tourist attractions, including the Delafield Hotel, the John D. Rockefeller estate, and the Kettle Moraine State Forest. The city is also home to several retail stores, restaurants, and other businesses.
The city is also home to several manufacturing companies, including Briggs & Stratton, which produces small engines, and Waukesha Engine, which produces industrial engines.
Demographics
As of the 2010 census, Delafield had a population of 7,085 people. The racial makeup of the city was 94.3% White, 1.2% African American, 0.3% Native American, 1.7% Asian, 0.1% Pacific Islander, 1.2% from other races, and 1.4% from two or more races. Hispanic or Latino of any race were 3.2% of the population.
The median household income in Delafield was $76,944, and the median family income was $90,917. The per capita income for the city was $37,945. About 4.2% of families and 5.7% of the population were below the poverty line, including 6.3% of those under age 18 and 4.2% of those age 65 or over.
Common Questions
What is Per Capita Income in Delafield?
Per Capita income in Delafield is $71,470.
What is the Median Family Income in Delafield?
Median Family Income in Delafield is $123,113.
What is the Median Household income in Delafield?
Median Household Income in Delafield is $99,239.
What is Income or Wage Gap in Delafield?
Income or Wage Gap in Delafield is 44.8%.
Women in Delafield earn 55.2 cents for every dollar earned by a man.
What is Inequality or Gini Index in Delafield?
Inequality or Gini Index in Delafield is 0.52.
What is the Total Population of Delafield?
Total Population of Delafield is 7,181.
What is the Total Male Population of Delafield?
Total Male Population of Delafield is 3,550.
What is the Total Female Population of Delafield?
Total Female Population of Delafield is 3,631.
What is the Ratio of Males per 100 Females in Delafield?
There are 97.77 Males per 100 Females in Delafield.
What is the Ratio of Females per 100 Males in Delafield?
There are 102.28 Females per 100 Males in Delafield.
What is the Median Population Age in Delafield?
Median Population Age in Delafield is 49.2 Years.
What is the Average Family Size in Delafield
Average Family Size in Delafield is 2.8 People.
What is the Average Household Size in Delafield
Average Household Size in Delafield is 2.2 People.
How Large is the Labor Force in Delafield?
There are 3,836 People in the Labor Forcein in Delafield.
What is the Percentage of People in the Labor Force in Delafield?
64.8% of People are in the Labor Force in Delafield.
What is the Unemployment Rate in Delafield?
Unemployment Rate in Delafield is 1.5%.