Prentice, WI Map & Demographics
Prentice Map
Prentice Overview
$30,443
PER CAPITA INCOME
$63,125
AVG FAMILY INCOME
$50,357
AVG HOUSEHOLD INCOME
36.2%
WAGE / INCOME GAP [ % ]
63.8¢/ $1
WAGE / INCOME GAP [ $ ]
0.45
INEQUALITY / GINI INDEX
465
TOTAL POPULATION
222
MALE POPULATION
243
FEMALE POPULATION
91.36
MALES / 100 FEMALES
109.46
FEMALES / 100 MALES
45.6
MEDIAN AGE
2.8
AVG FAMILY SIZE
2.2
AVG HOUSEHOLD SIZE
207
LABOR FORCE [ PEOPLE ]
53.9%
PERCENT IN LABOR FORCE
2.9%
UNEMPLOYMENT RATE
Prentice Zip Codes
Prentice Area Codes
Income in Prentice
Income Overview in Prentice
Per Capita Income in Prentice is $30,443, while median incomes of families and households are $63,125 and $50,357 respectively.
| Characteristic | Number | Measure |
| Per Capita Income | 465 | $30,443 |
| Median Family Income | 117 | $63,125 |
| Mean Family Income | 117 | $86,135 |
| Median Household Income | 214 | $50,357 |
| Mean Household Income | 214 | $65,947 |
| Income Deficit | 117 | $0 |
| Wage / Income Gap (%) | 465 | 36.20% |
| Wage / Income Gap ($) | 465 | 63.80¢ per $1 |
| Gini / Inequality Index | 465 | 0.45 |
Earnings by Sex in Prentice
Average Earnings in Prentice are $39,167, $49,375 for men and $31,500 for women, a difference of 36.2%.
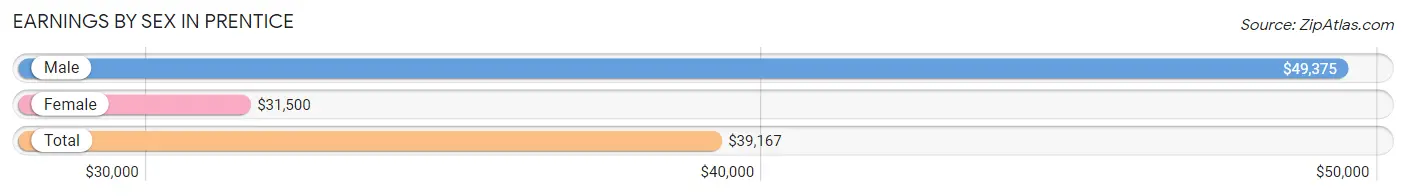
| Sex | Number | Average Earnings |
| Male | 112 (52.3%) | $49,375 |
| Female | 102 (47.7%) | $31,500 |
| Total | 214 (100.0%) | $39,167 |
Earnings by Sex by Income Bracket in Prentice
The most common earnings brackets in Prentice are $50,000 to $54,999 for men (22 | 19.6%) and $2,499 or less for women (12 | 11.8%).
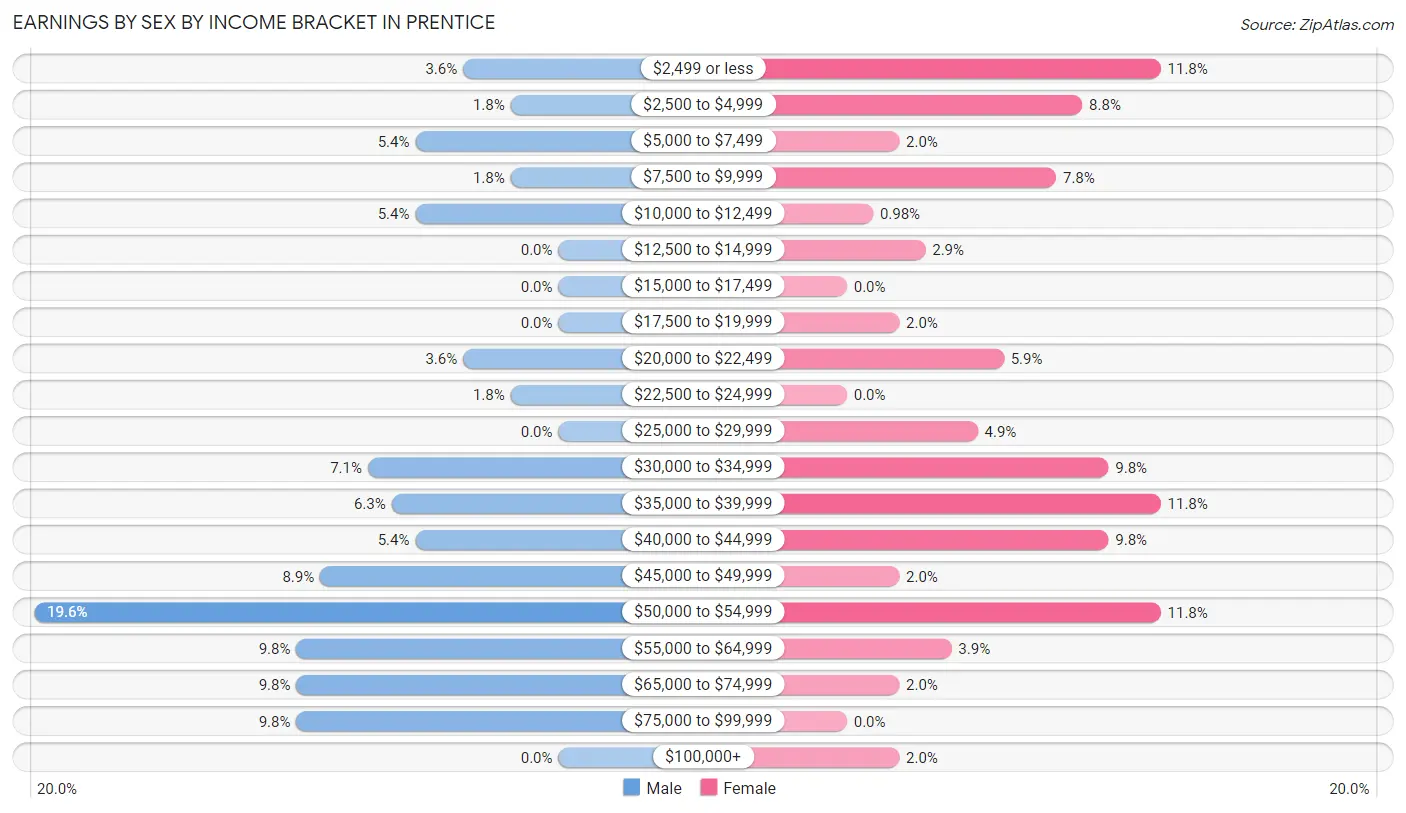
| Income | Male | Female |
| $2,499 or less | 4 (3.6%) | 12 (11.8%) |
| $2,500 to $4,999 | 2 (1.8%) | 9 (8.8%) |
| $5,000 to $7,499 | 6 (5.4%) | 2 (2.0%) |
| $7,500 to $9,999 | 2 (1.8%) | 8 (7.8%) |
| $10,000 to $12,499 | 6 (5.4%) | 1 (1.0%) |
| $12,500 to $14,999 | 0 (0.0%) | 3 (2.9%) |
| $15,000 to $17,499 | 0 (0.0%) | 0 (0.0%) |
| $17,500 to $19,999 | 0 (0.0%) | 2 (2.0%) |
| $20,000 to $22,499 | 4 (3.6%) | 6 (5.9%) |
| $22,500 to $24,999 | 2 (1.8%) | 0 (0.0%) |
| $25,000 to $29,999 | 0 (0.0%) | 5 (4.9%) |
| $30,000 to $34,999 | 8 (7.1%) | 10 (9.8%) |
| $35,000 to $39,999 | 7 (6.2%) | 12 (11.8%) |
| $40,000 to $44,999 | 6 (5.4%) | 10 (9.8%) |
| $45,000 to $49,999 | 10 (8.9%) | 2 (2.0%) |
| $50,000 to $54,999 | 22 (19.6%) | 12 (11.8%) |
| $55,000 to $64,999 | 11 (9.8%) | 4 (3.9%) |
| $65,000 to $74,999 | 11 (9.8%) | 2 (2.0%) |
| $75,000 to $99,999 | 11 (9.8%) | 0 (0.0%) |
| $100,000+ | 0 (0.0%) | 2 (2.0%) |
| Total | 112 (100.0%) | 102 (100.0%) |
Earnings by Sex by Educational Attainment in Prentice
Average earnings in Prentice are $50,673 for men and $35,500 for women, a difference of 29.9%. Men with an educational attainment of bachelor's degree enjoy the highest average annual earnings of $52,083, while those with high school diploma education earn the least with $51,250. Women with an educational attainment of bachelor's degree earn the most with the average annual earnings of $50,417, while those with high school diploma education have the smallest earnings of $31,667.
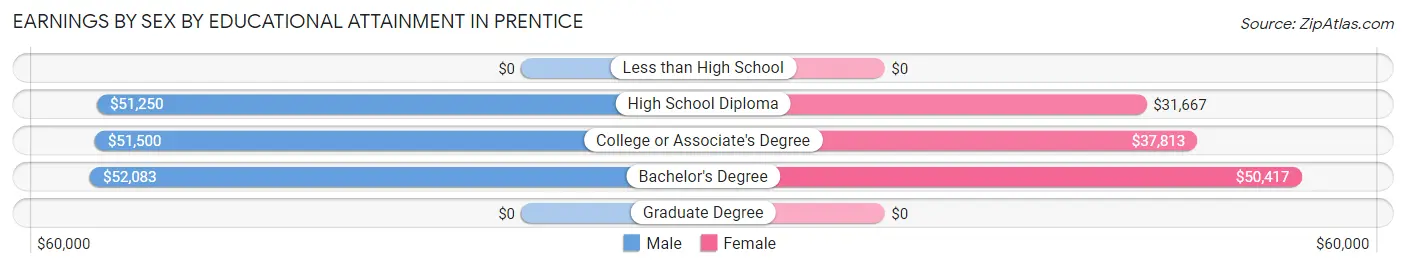
| Educational Attainment | Male Income | Female Income |
| Less than High School | - | - |
| High School Diploma | $51,250 | $31,667 |
| College or Associate's Degree | $51,500 | $37,813 |
| Bachelor's Degree | $52,083 | $50,417 |
| Graduate Degree | - | - |
| Total | $50,673 | $35,500 |
Family Income in Prentice
Family Income Brackets in Prentice
According to the Prentice family income data, there are 36 families falling into the $50,000 to $74,999 income range, which is the most common income bracket and makes up 30.8% of all families.
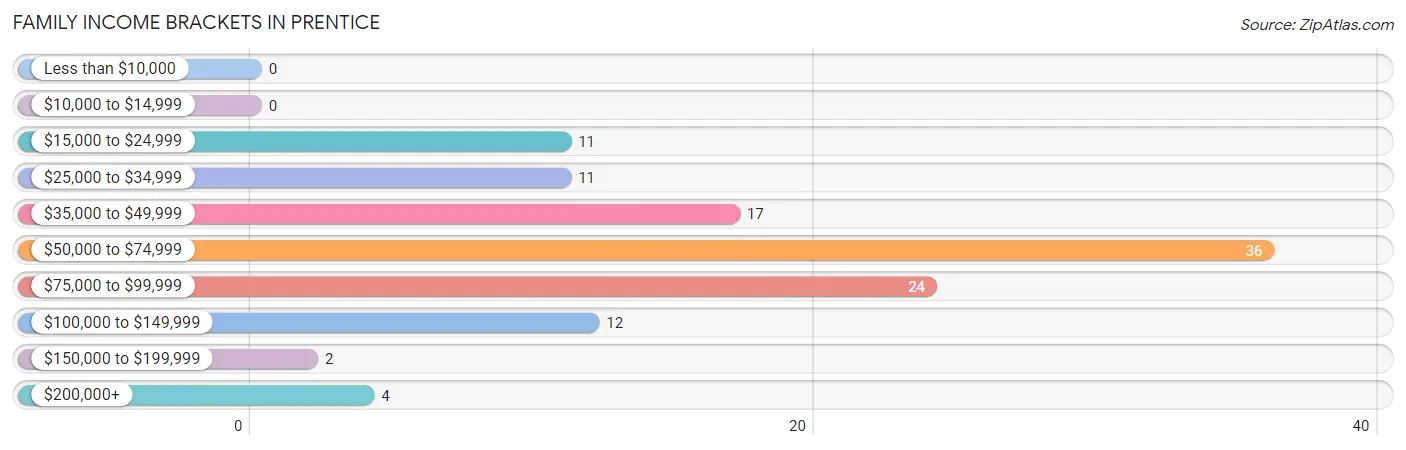
| Income Bracket | # Families | % Families |
| Less than $10,000 | 0 | 0.0% |
| $10,000 to $14,999 | 0 | 0.0% |
| $15,000 to $24,999 | 11 | 9.4% |
| $25,000 to $34,999 | 11 | 9.4% |
| $35,000 to $49,999 | 17 | 14.5% |
| $50,000 to $74,999 | 36 | 30.8% |
| $75,000 to $99,999 | 24 | 20.5% |
| $100,000 to $149,999 | 12 | 10.3% |
| $150,000 to $199,999 | 2 | 1.7% |
| $200,000+ | 4 | 3.4% |
Family Income by Famaliy Size in Prentice
4-person families (15 | 12.8%) account for the highest median family income in Prentice with $76,875 per family, while 2-person families (66 | 56.4%) have the highest median income of $28,750 per family member.
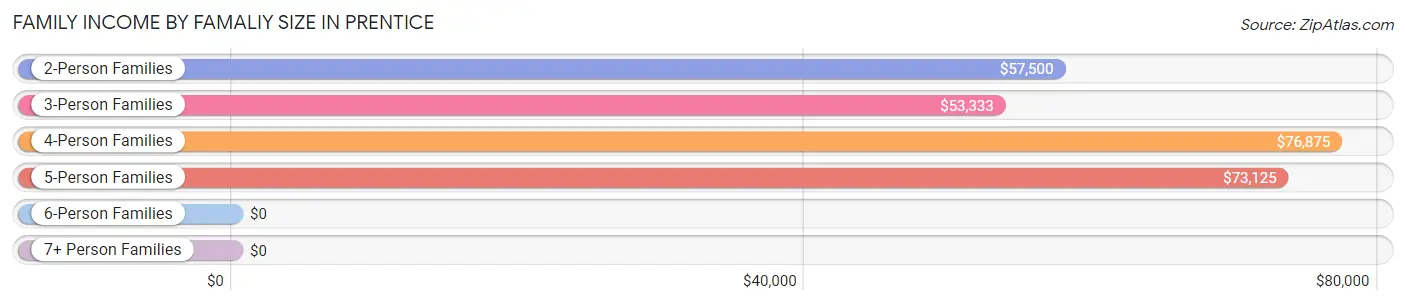
| Income Bracket | # Families | Median Income |
| 2-Person Families | 66 (56.4%) | $57,500 |
| 3-Person Families | 20 (17.1%) | $53,333 |
| 4-Person Families | 15 (12.8%) | $76,875 |
| 5-Person Families | 11 (9.4%) | $73,125 |
| 6-Person Families | 3 (2.6%) | $0 |
| 7+ Person Families | 2 (1.7%) | $0 |
| Total | 117 (100.0%) | $63,125 |
Family Income by Number of Earners in Prentice
The median family income in Prentice is $63,125, with families comprising 3+ earners (9) having the highest median family income of $92,083, while families with no earners (30) have the lowest median family income of $33,750, accounting for 7.7% and 25.6% of families, respectively.
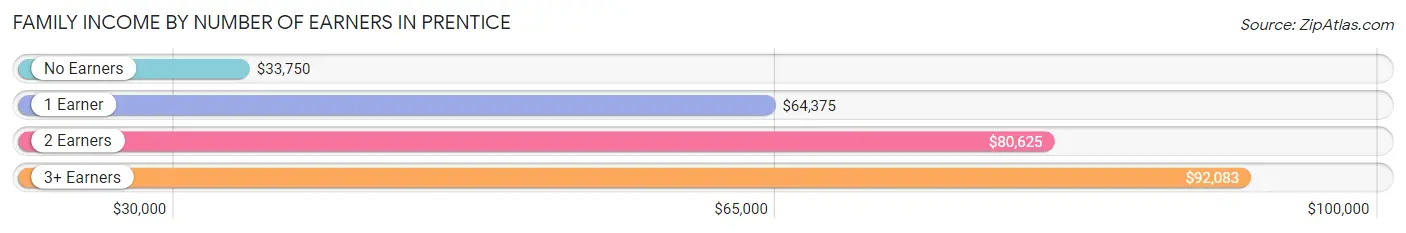
| Number of Earners | # Families | Median Income |
| No Earners | 30 (25.6%) | $33,750 |
| 1 Earner | 39 (33.3%) | $64,375 |
| 2 Earners | 39 (33.3%) | $80,625 |
| 3+ Earners | 9 (7.7%) | $92,083 |
| Total | 117 (100.0%) | $63,125 |
Household Income in Prentice
Household Income Brackets in Prentice
With 53 households falling in the category, the $50,000 to $74,999 income range is the most frequent in Prentice, accounting for 24.8% of all households. In contrast, only 2 households (0.9%) fall into the $150,000 to $199,999 income bracket, making it the least populous group.
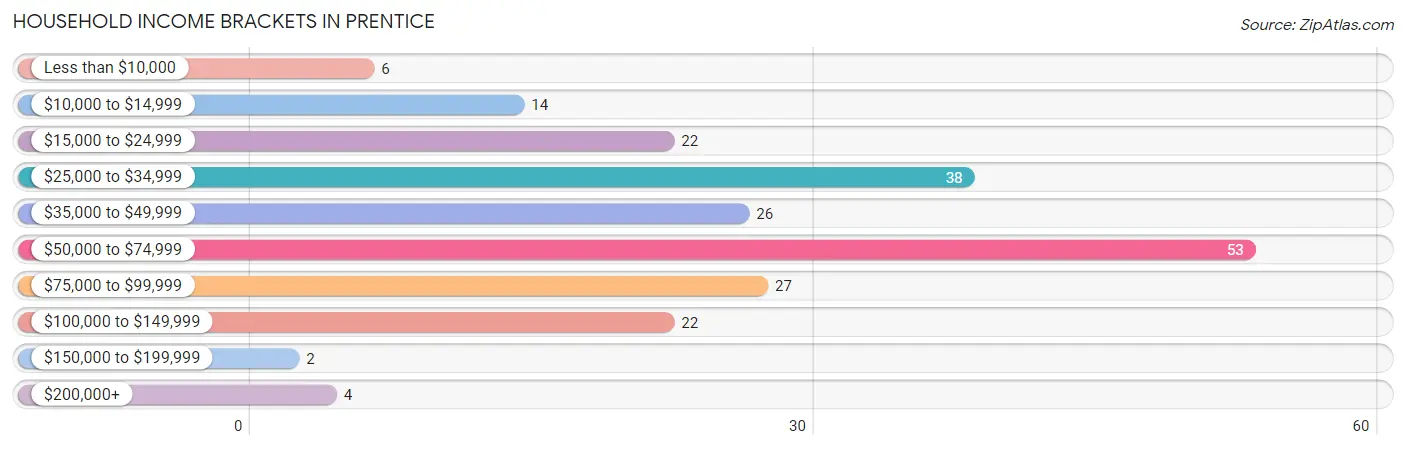
| Income Bracket | # Households | % Households |
| Less than $10,000 | 6 | 2.8% |
| $10,000 to $14,999 | 14 | 6.5% |
| $15,000 to $24,999 | 22 | 10.3% |
| $25,000 to $34,999 | 38 | 17.8% |
| $35,000 to $49,999 | 26 | 12.1% |
| $50,000 to $74,999 | 53 | 24.8% |
| $75,000 to $99,999 | 27 | 12.6% |
| $100,000 to $149,999 | 22 | 10.3% |
| $150,000 to $199,999 | 2 | 0.9% |
| $200,000+ | 4 | 1.9% |
Household Income by Householder Age in Prentice
The median household income in Prentice is $50,357, with the highest median household income of $70,972 found in the 45 to 64 years age bracket for the primary householder. A total of 65 households (30.4%) fall into this category. Meanwhile, the 65+ years age bracket for the primary householder has the lowest median household income of $30,469, with 85 households (39.7%) in this group.
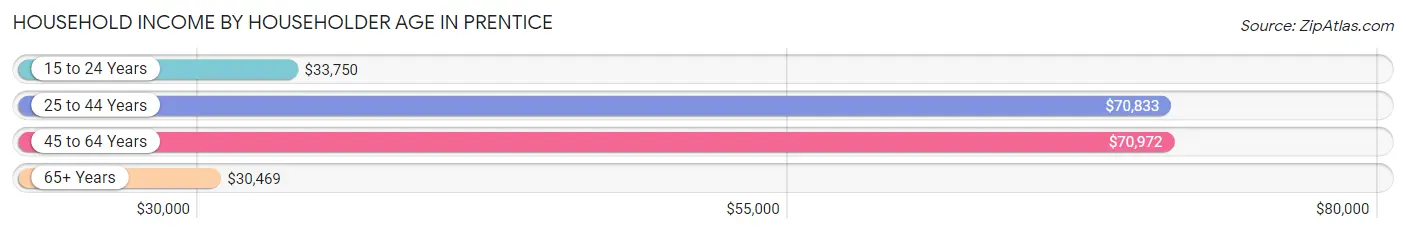
| Income Bracket | # Households | Median Income |
| 15 to 24 Years | 16 (7.5%) | $33,750 |
| 25 to 44 Years | 48 (22.4%) | $70,833 |
| 45 to 64 Years | 65 (30.4%) | $70,972 |
| 65+ Years | 85 (39.7%) | $30,469 |
| Total | 214 (100.0%) | $50,357 |
Poverty in Prentice
Income Below Poverty by Sex and Age in Prentice
With 4.5% poverty level for males and 11.1% for females among the residents of Prentice, 65 to 74 year old males and 18 to 24 year old females are the most vulnerable to poverty, with 7 males (18.4%) and 7 females (41.2%) in their respective age groups living below the poverty level.
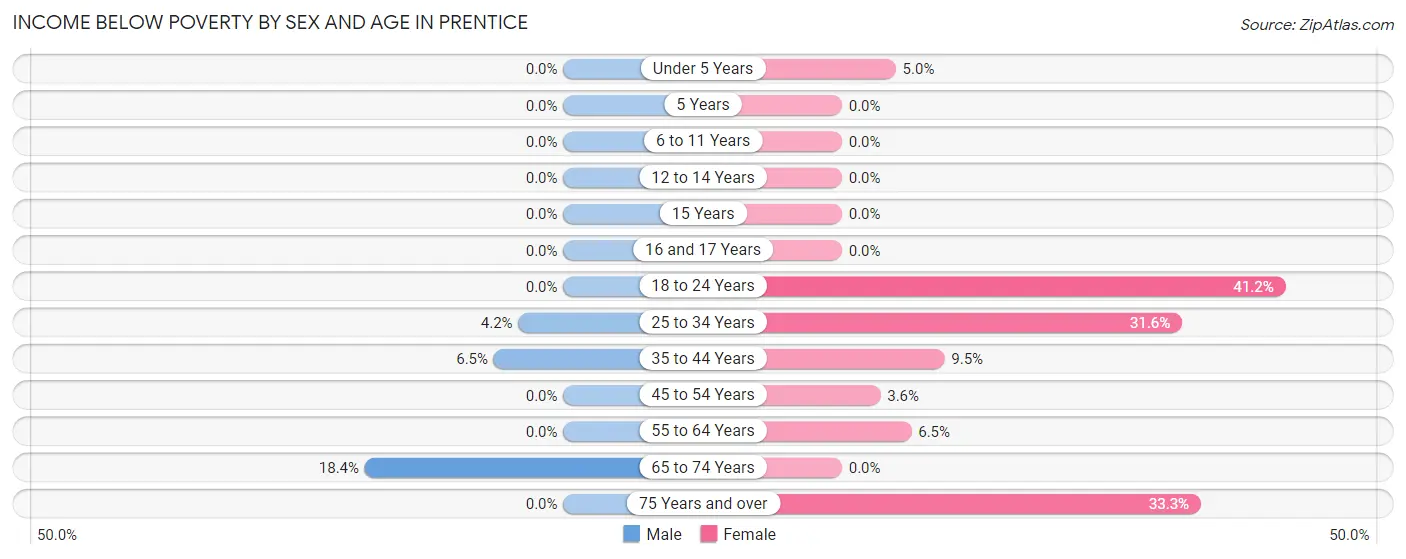
| Age Bracket | Male | Female |
| Under 5 Years | 0 (0.0%) | 1 (5.0%) |
| 5 Years | 0 (0.0%) | 0 (0.0%) |
| 6 to 11 Years | 0 (0.0%) | 0 (0.0%) |
| 12 to 14 Years | 0 (0.0%) | 0 (0.0%) |
| 15 Years | 0 (0.0%) | 0 (0.0%) |
| 16 and 17 Years | 0 (0.0%) | 0 (0.0%) |
| 18 to 24 Years | 0 (0.0%) | 7 (41.2%) |
| 25 to 34 Years | 1 (4.2%) | 6 (31.6%) |
| 35 to 44 Years | 2 (6.5%) | 2 (9.5%) |
| 45 to 54 Years | 0 (0.0%) | 1 (3.6%) |
| 55 to 64 Years | 0 (0.0%) | 2 (6.5%) |
| 65 to 74 Years | 7 (18.4%) | 0 (0.0%) |
| 75 Years and over | 0 (0.0%) | 8 (33.3%) |
| Total | 10 (4.5%) | 27 (11.1%) |
Income Above Poverty by Sex and Age in Prentice
According to the poverty statistics in Prentice, males aged under 5 years and females aged 5 years are the age groups that are most secure financially, with 100.0% of males and 100.0% of females in these age groups living above the poverty line.
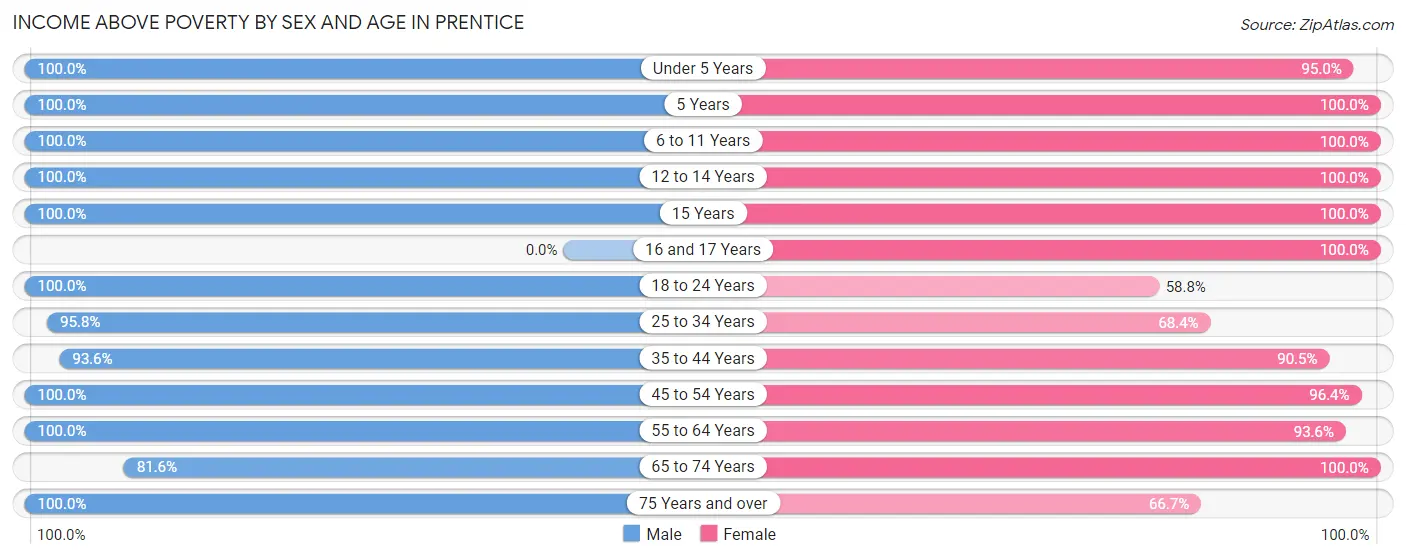
| Age Bracket | Male | Female |
| Under 5 Years | 4 (100.0%) | 19 (95.0%) |
| 5 Years | 5 (100.0%) | 1 (100.0%) |
| 6 to 11 Years | 9 (100.0%) | 14 (100.0%) |
| 12 to 14 Years | 7 (100.0%) | 15 (100.0%) |
| 15 Years | 3 (100.0%) | 3 (100.0%) |
| 16 and 17 Years | 0 (0.0%) | 12 (100.0%) |
| 18 to 24 Years | 23 (100.0%) | 10 (58.8%) |
| 25 to 34 Years | 23 (95.8%) | 13 (68.4%) |
| 35 to 44 Years | 29 (93.5%) | 19 (90.5%) |
| 45 to 54 Years | 27 (100.0%) | 27 (96.4%) |
| 55 to 64 Years | 35 (100.0%) | 29 (93.5%) |
| 65 to 74 Years | 31 (81.6%) | 38 (100.0%) |
| 75 Years and over | 16 (100.0%) | 16 (66.7%) |
| Total | 212 (95.5%) | 216 (88.9%) |
Income Below Poverty Among Married-Couple Families in Prentice
The poverty statistics for married-couple families in Prentice show that 1.1% or 1 of the total 95 families live below the poverty line. Families with 1 or 2 children have the highest poverty rate of 5.9%, comprising of 1 families. On the other hand, families with no children have the lowest poverty rate of 0.0%, which includes 0 families.
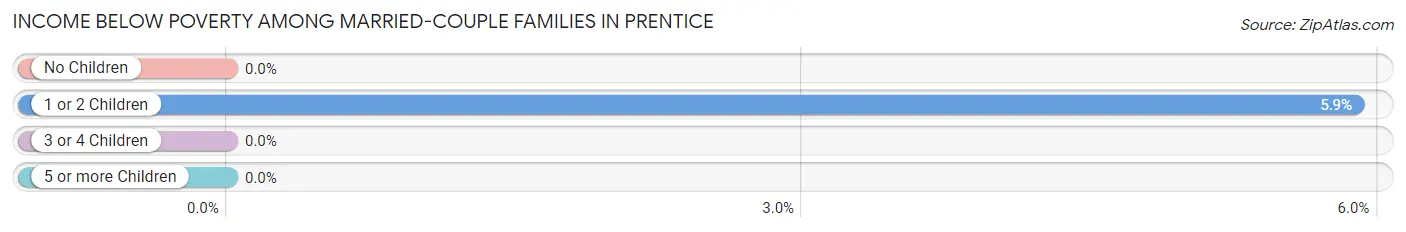
| Children | Above Poverty | Below Poverty |
| No Children | 65 (100.0%) | 0 (0.0%) |
| 1 or 2 Children | 16 (94.1%) | 1 (5.9%) |
| 3 or 4 Children | 13 (100.0%) | 0 (0.0%) |
| 5 or more Children | 0 (0.0%) | 0 (0.0%) |
| Total | 94 (99.0%) | 1 (1.1%) |
Income Below Poverty Among Single-Parent Households in Prentice
| Children | Single Father | Single Mother |
| No Children | 0 (0.0%) | 0 (0.0%) |
| 1 or 2 Children | 0 (0.0%) | 0 (0.0%) |
| 3 or 4 Children | 0 (0.0%) | 0 (0.0%) |
| 5 or more Children | 0 (0.0%) | 0 (0.0%) |
| Total | 0 (0.0%) | 0 (0.0%) |
Income Below Poverty Among Married-Couple vs Single-Parent Households in Prentice
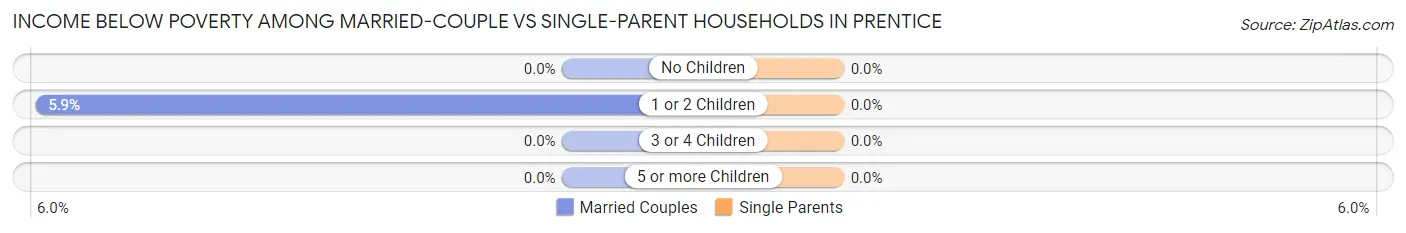
| Children | Married-Couple Families | Single-Parent Households |
| No Children | 0 (0.0%) | 0 (0.0%) |
| 1 or 2 Children | 1 (5.9%) | 0 (0.0%) |
| 3 or 4 Children | 0 (0.0%) | 0 (0.0%) |
| 5 or more Children | 0 (0.0%) | 0 (0.0%) |
| Total | 1 (1.1%) | 0 (0.0%) |
Race in Prentice
The most populous races in Prentice are White / Caucasian (448 | 96.3%), Hispanic or Latino (12 | 2.6%), and Black / African American (8 | 1.7%).
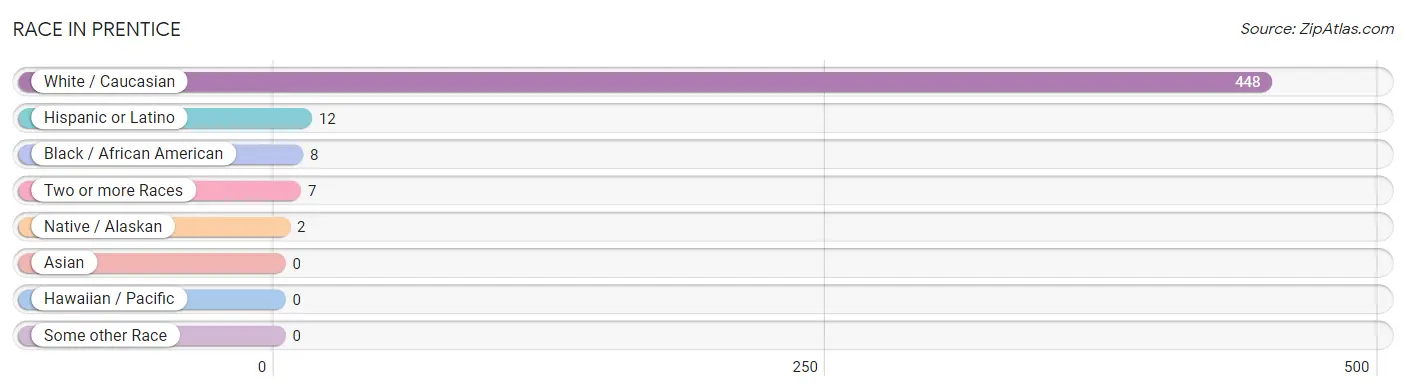
| Race | # Population | % Population |
| Asian | 0 | 0.0% |
| Black / African American | 8 | 1.7% |
| Hawaiian / Pacific | 0 | 0.0% |
| Hispanic or Latino | 12 | 2.6% |
| Native / Alaskan | 2 | 0.4% |
| White / Caucasian | 448 | 96.3% |
| Two or more Races | 7 | 1.5% |
| Some other Race | 0 | 0.0% |
| Total | 465 | 100.0% |
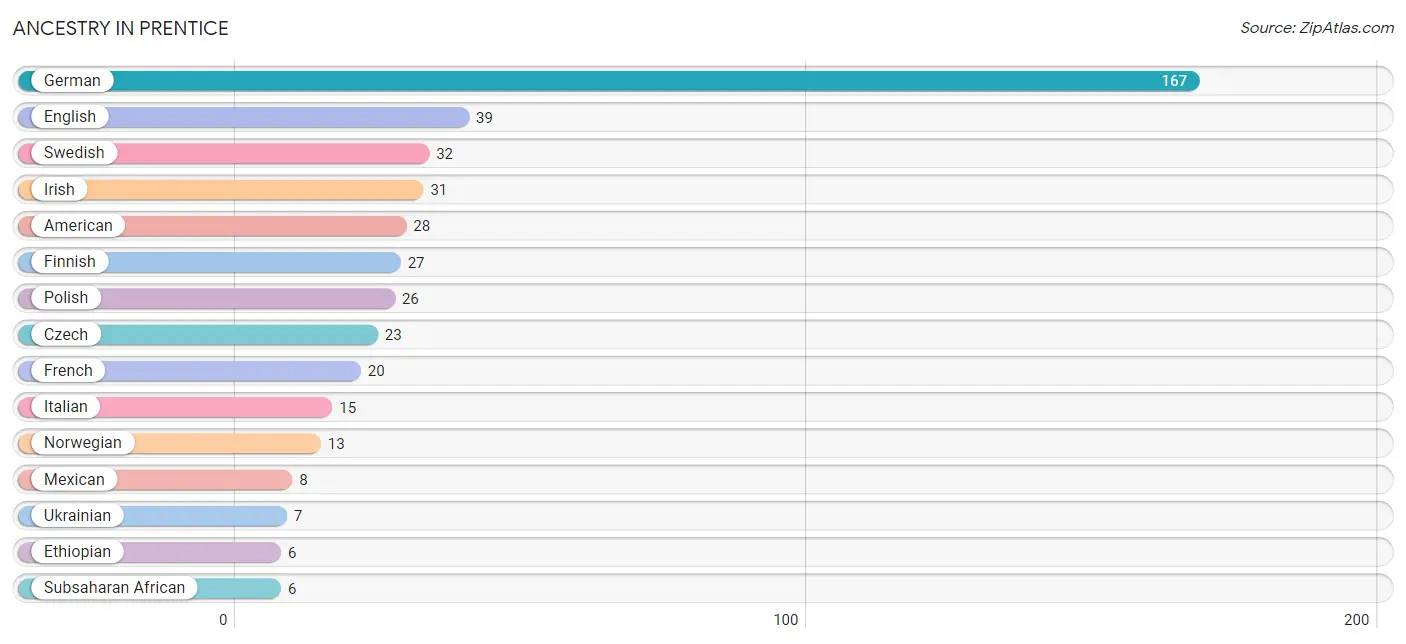
Ancestry in Prentice
The most populous ancestries reported in Prentice are German (167 | 35.9%), English (39 | 8.4%), Swedish (32 | 6.9%), Irish (31 | 6.7%), and American (28 | 6.0%), together accounting for 63.9% of all Prentice residents.
| Ancestry | # Population | % Population |
| American | 28 | 6.0% |
| Canadian | 1 | 0.2% |
| Chippewa | 1 | 0.2% |
| Czech | 23 | 5.0% |
| Czechoslovakian | 5 | 1.1% |
| Dutch | 5 | 1.1% |
| English | 39 | 8.4% |
| Ethiopian | 6 | 1.3% |
| Finnish | 27 | 5.8% |
| French | 20 | 4.3% |
| French American Indian | 1 | 0.2% |
| French Canadian | 1 | 0.2% |
| German | 167 | 35.9% |
| Hungarian | 2 | 0.4% |
| Irish | 31 | 6.7% |
| Italian | 15 | 3.2% |
| Mexican | 8 | 1.7% |
| Norwegian | 13 | 2.8% |
| Polish | 26 | 5.6% |
| Puerto Rican | 4 | 0.9% |
| Russian | 4 | 0.9% |
| Scandinavian | 2 | 0.4% |
| Scottish | 2 | 0.4% |
| Subsaharan African | 6 | 1.3% |
| Swedish | 32 | 6.9% |
| Swiss | 2 | 0.4% |
| Ukrainian | 7 | 1.5% |
| Welsh | 2 | 0.4% | View All 28 Rows |
Immigrants in Prentice
The most numerous immigrant groups reported in Prentice came from Africa (6 | 1.3%), Eastern Africa (6 | 1.3%), Ethiopia (6 | 1.3%), Canada (2 | 0.4%), and England (2 | 0.4%), together accounting for 4.7% of all Prentice residents.
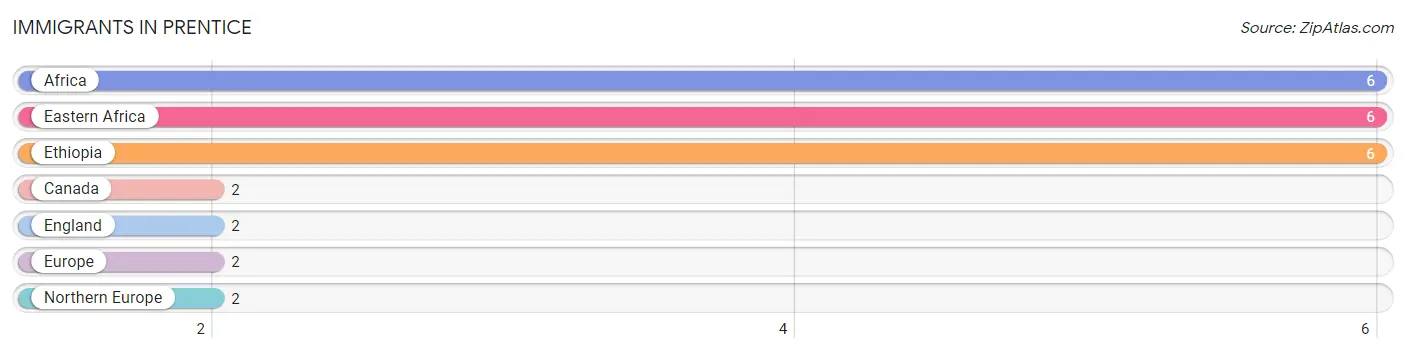
| Immigration Origin | # Population | % Population |
| Africa | 6 | 1.3% |
| Canada | 2 | 0.4% |
| Eastern Africa | 6 | 1.3% |
| England | 2 | 0.4% |
| Ethiopia | 6 | 1.3% |
| Europe | 2 | 0.4% |
| Northern Europe | 2 | 0.4% | View All 7 Rows |
Sex and Age in Prentice
Sex and Age in Prentice
The most populous age groups in Prentice are 60 to 64 Years (23 | 10.4%) for men and 55 to 59 Years (26 | 10.7%) for women.

| Age Bracket | Male | Female |
| Under 5 Years | 4 (1.8%) | 20 (8.2%) |
| 5 to 9 Years | 10 (4.5%) | 8 (3.3%) |
| 10 to 14 Years | 11 (5.0%) | 22 (9.0%) |
| 15 to 19 Years | 13 (5.9%) | 22 (9.0%) |
| 20 to 24 Years | 13 (5.9%) | 10 (4.1%) |
| 25 to 29 Years | 11 (5.0%) | 7 (2.9%) |
| 30 to 34 Years | 13 (5.9%) | 12 (4.9%) |
| 35 to 39 Years | 15 (6.8%) | 13 (5.3%) |
| 40 to 44 Years | 16 (7.2%) | 8 (3.3%) |
| 45 to 49 Years | 14 (6.3%) | 21 (8.6%) |
| 50 to 54 Years | 13 (5.9%) | 7 (2.9%) |
| 55 to 59 Years | 12 (5.4%) | 26 (10.7%) |
| 60 to 64 Years | 23 (10.4%) | 5 (2.1%) |
| 65 to 69 Years | 23 (10.4%) | 18 (7.4%) |
| 70 to 74 Years | 15 (6.8%) | 20 (8.2%) |
| 75 to 79 Years | 5 (2.2%) | 10 (4.1%) |
| 80 to 84 Years | 9 (4.1%) | 5 (2.1%) |
| 85 Years and over | 2 (0.9%) | 9 (3.7%) |
| Total | 222 (100.0%) | 243 (100.0%) |
Families and Households in Prentice
Median Family Size in Prentice
The median family size in Prentice is 2.84 persons per family, with married-couple families (95 | 81.2%) accounting for the largest median family size of 2.93 persons per family. On the other hand, single female/mother families (6 | 5.1%) represent the smallest median family size with 2.33 persons per family.
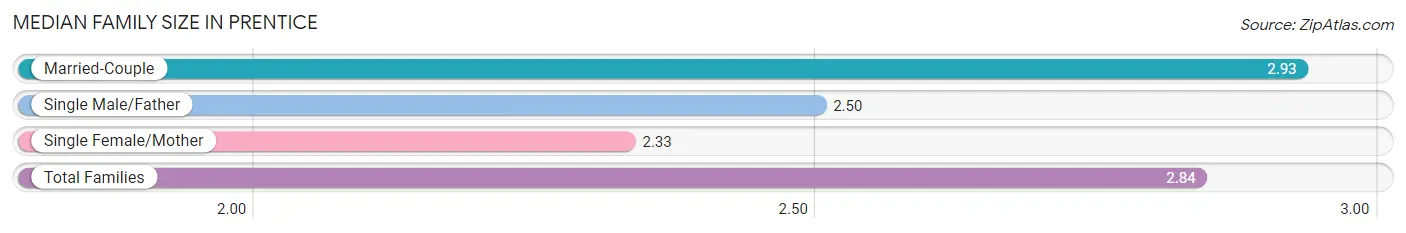
| Family Type | # Families | Family Size |
| Married-Couple | 95 (81.2%) | 2.93 |
| Single Male/Father | 16 (13.7%) | 2.50 |
| Single Female/Mother | 6 (5.1%) | 2.33 |
| Total Families | 117 (100.0%) | 2.84 |
Median Household Size in Prentice
The median household size in Prentice is 2.17 persons per household, with married-couple households (95 | 44.4%) accounting for the largest median household size of 2.93 persons per household. non-family households (97 | 45.3%) represent the smallest median household size with 1.32 persons per household.
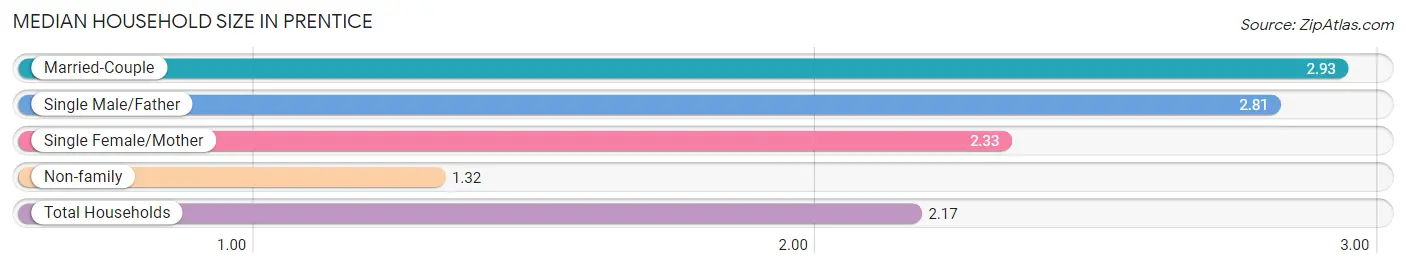
| Household Type | # Households | Household Size |
| Married-Couple | 95 (44.4%) | 2.93 |
| Single Male/Father | 16 (7.5%) | 2.81 |
| Single Female/Mother | 6 (2.8%) | 2.33 |
| Non-family | 97 (45.3%) | 1.32 |
| Total Households | 214 (100.0%) | 2.17 |
Household Size by Marriage Status in Prentice
Out of a total of 214 households in Prentice, 117 (54.7%) are family households, while 97 (45.3%) are nonfamily households. The most numerous type of family households are 2-person households, comprising 63, and the most common type of nonfamily households are 1-person households, comprising 69.
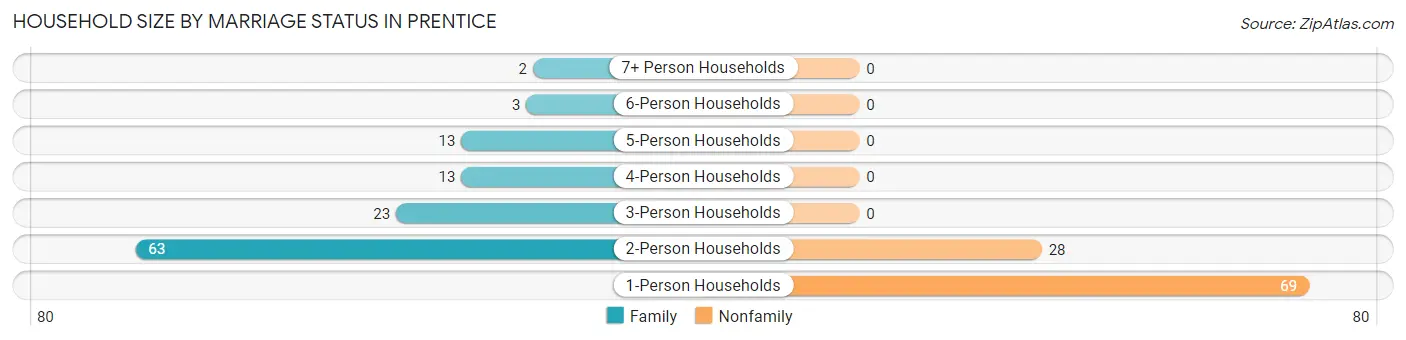
| Household Size | Family Households | Nonfamily Households |
| 1-Person Households | - | 69 (32.2%) |
| 2-Person Households | 63 (29.4%) | 28 (13.1%) |
| 3-Person Households | 23 (10.7%) | 0 (0.0%) |
| 4-Person Households | 13 (6.1%) | 0 (0.0%) |
| 5-Person Households | 13 (6.1%) | 0 (0.0%) |
| 6-Person Households | 3 (1.4%) | 0 (0.0%) |
| 7+ Person Households | 2 (0.9%) | 0 (0.0%) |
| Total | 117 (54.7%) | 97 (45.3%) |
Female Fertility in Prentice
Fertility by Age in Prentice
Average fertility rate in Prentice is 63.0 births per 1,000 women. Women in the age bracket of 20 to 34 years have the highest fertility rate with 207.0 births per 1,000 women. Women in the age bracket of 20 to 34 years acount for 100.0% of all women with births.
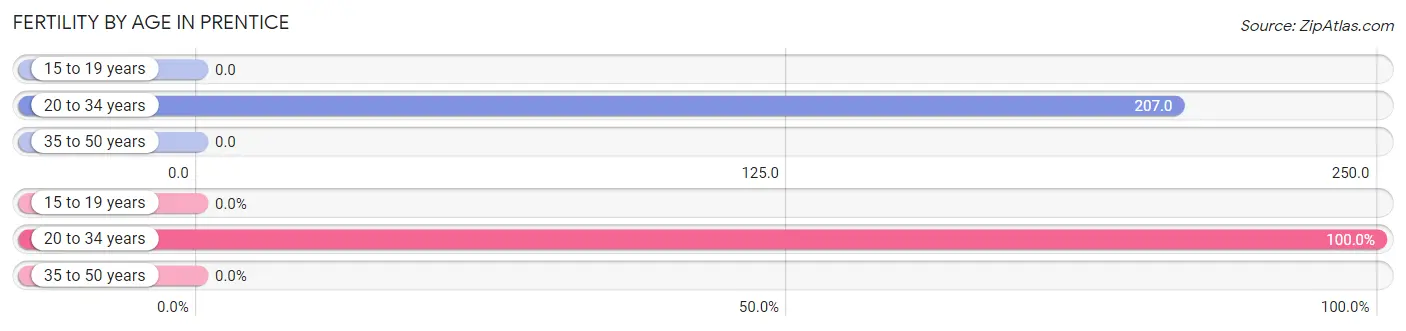
| Age Bracket | Women with Births | Births / 1,000 Women |
| 15 to 19 years | 0 (0.0%) | 0.0 |
| 20 to 34 years | 6 (100.0%) | 207.0 |
| 35 to 50 years | 0 (0.0%) | 0.0 |
| Total | 6 (100.0%) | 63.0 |
Fertility by Age by Marriage Status in Prentice
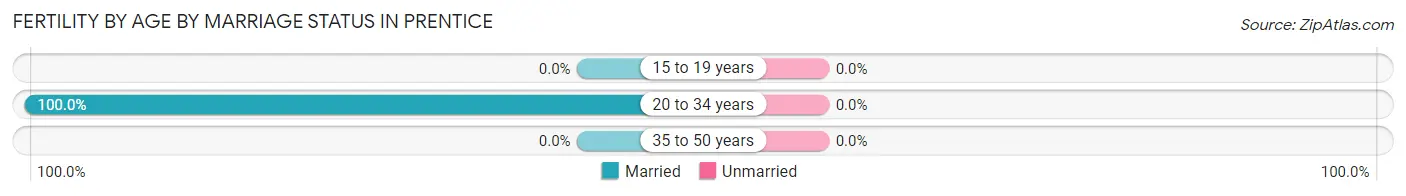
| Age Bracket | Married | Unmarried |
| 15 to 19 years | 0 (0.0%) | 0 (0.0%) |
| 20 to 34 years | 6 (100.0%) | 0 (0.0%) |
| 35 to 50 years | 0 (0.0%) | 0 (0.0%) |
| Total | 6 (100.0%) | 0 (0.0%) |
Fertility by Education in Prentice
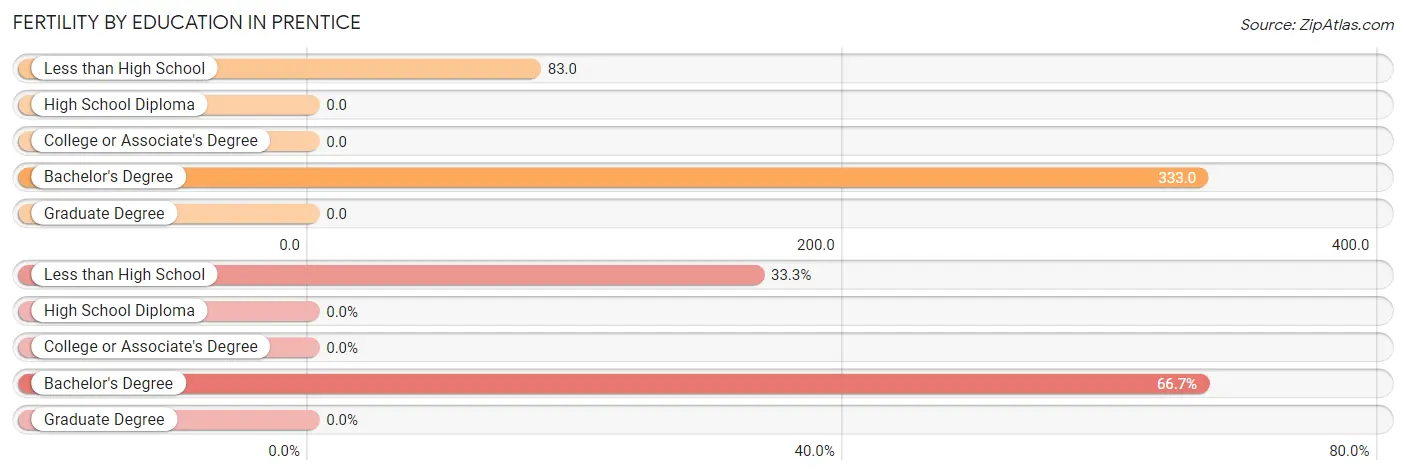
| Educational Attainment | Women with Births | Births / 1,000 Women |
| Less than High School | 2 (33.3%) | 83.0 |
| High School Diploma | 0 (0.0%) | 0.0 |
| College or Associate's Degree | 0 (0.0%) | 0.0 |
| Bachelor's Degree | 4 (66.7%) | 333.0 |
| Graduate Degree | 0 (0.0%) | 0.0 |
| Total | 6 (100.0%) | 63.0 |
Fertility by Education by Marriage Status in Prentice
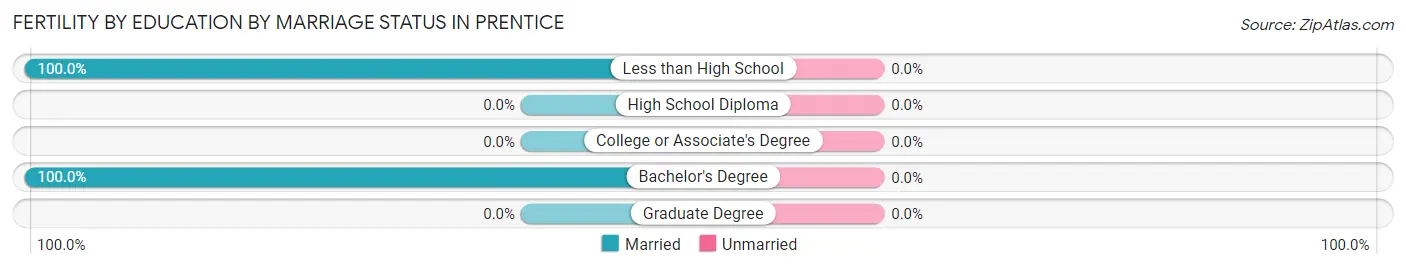
| Educational Attainment | Married | Unmarried |
| Less than High School | 2 (100.0%) | 0 (0.0%) |
| High School Diploma | 0 (0.0%) | 0 (0.0%) |
| College or Associate's Degree | 0 (0.0%) | 0 (0.0%) |
| Bachelor's Degree | 4 (100.0%) | 0 (0.0%) |
| Graduate Degree | 0 (0.0%) | 0 (0.0%) |
| Total | 6 (100.0%) | 0 (0.0%) |
Employment Characteristics in Prentice
Employment by Class of Employer in Prentice
Among the 201 employed individuals in Prentice, private company employees (151 | 75.1%), local government employees (25 | 12.4%), and self-employed (not incorporated) (10 | 5.0%) make up the most common classes of employment.
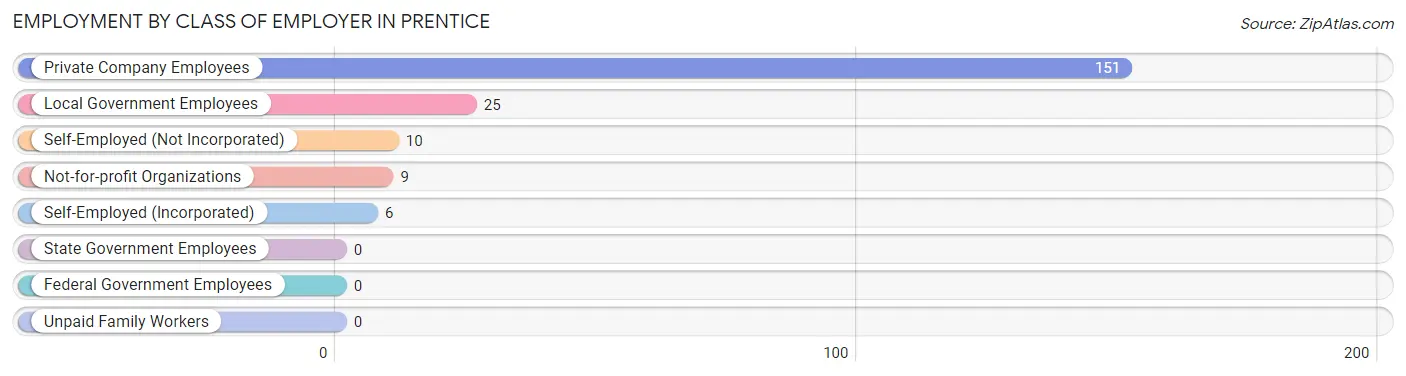
| Employer Class | # Employees | % Employees |
| Private Company Employees | 151 | 75.1% |
| Self-Employed (Incorporated) | 6 | 3.0% |
| Self-Employed (Not Incorporated) | 10 | 5.0% |
| Not-for-profit Organizations | 9 | 4.5% |
| Local Government Employees | 25 | 12.4% |
| State Government Employees | 0 | 0.0% |
| Federal Government Employees | 0 | 0.0% |
| Unpaid Family Workers | 0 | 0.0% |
| Total | 201 | 100.0% |
Employment Status by Age in Prentice
According to the labor force statistics for Prentice, out of the total population over 16 years of age (384), 53.9% or 207 individuals are in the labor force, with 2.9% or 6 of them unemployed. The age group with the highest labor force participation rate is 30 to 34 years, with 84.0% or 21 individuals in the labor force. Within the labor force, the 20 to 24 years age range has the highest percentage of unemployed individuals, with 28.6% or 4 of them being unemployed.
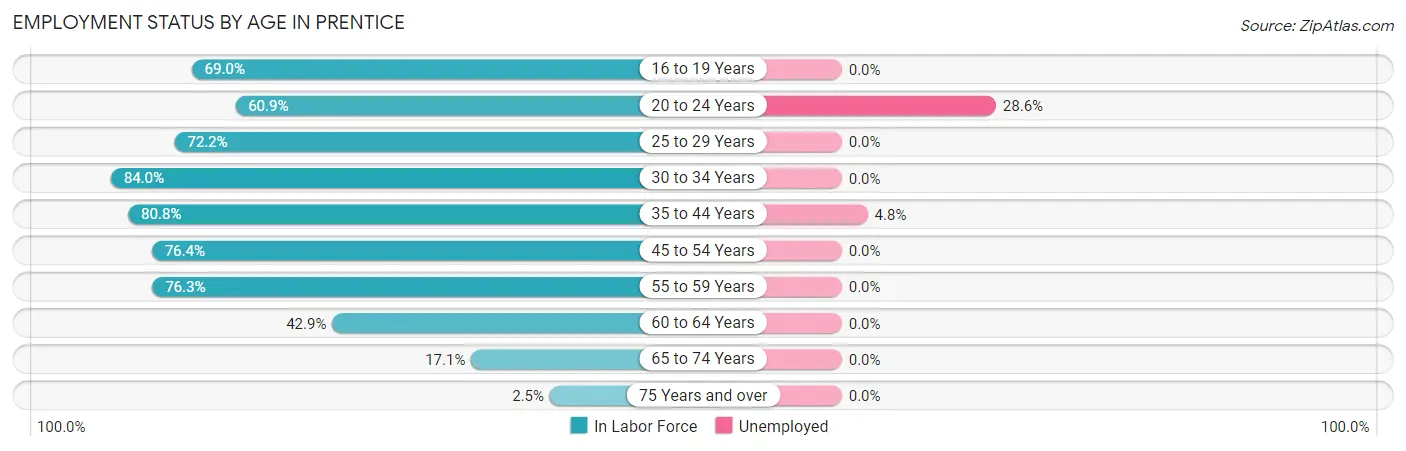
| Age Bracket | In Labor Force | Unemployed |
| 16 to 19 Years | 20 (69.0%) | 0 (0.0%) |
| 20 to 24 Years | 14 (60.9%) | 4 (28.6%) |
| 25 to 29 Years | 13 (72.2%) | 0 (0.0%) |
| 30 to 34 Years | 21 (84.0%) | 0 (0.0%) |
| 35 to 44 Years | 42 (80.8%) | 2 (4.8%) |
| 45 to 54 Years | 42 (76.4%) | 0 (0.0%) |
| 55 to 59 Years | 29 (76.3%) | 0 (0.0%) |
| 60 to 64 Years | 12 (42.9%) | 0 (0.0%) |
| 65 to 74 Years | 13 (17.1%) | 0 (0.0%) |
| 75 Years and over | 1 (2.5%) | 0 (0.0%) |
| Total | 207 (53.9%) | 6 (2.9%) |
Employment Status by Educational Attainment in Prentice
According to labor force statistics for Prentice, 73.6% of individuals (159) out of the total population between 25 and 64 years of age (216) are in the labor force, with 1.3% or 2 of them being unemployed. The group with the highest labor force participation rate are those with the educational attainment of bachelor's degree or higher, with 79.1% or 34 individuals in the labor force. Within the labor force, individuals with high school diploma education have the highest percentage of unemployment, with 3.3% or 2 of them being unemployed.
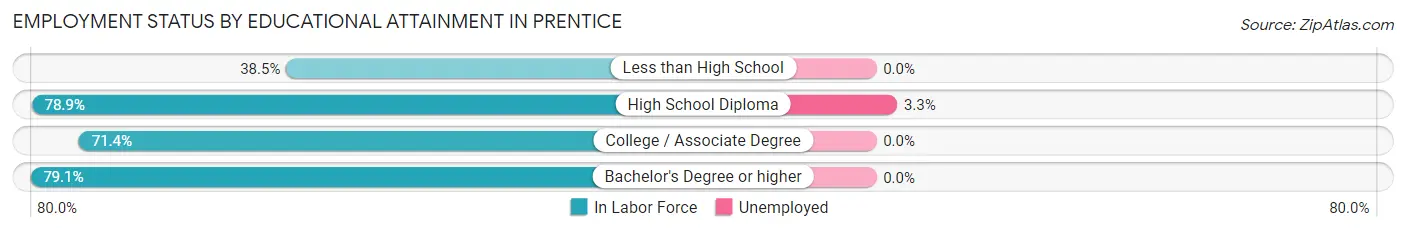
| Educational Attainment | In Labor Force | Unemployed |
| Less than High School | 5 (38.5%) | 0 (0.0%) |
| High School Diploma | 60 (78.9%) | 3 (3.3%) |
| College / Associate Degree | 60 (71.4%) | 0 (0.0%) |
| Bachelor's Degree or higher | 34 (79.1%) | 0 (0.0%) |
| Total | 159 (73.6%) | 3 (1.3%) |
Employment Occupations by Sex in Prentice
Management, Business, Science and Arts Occupations
The most common Management, Business, Science and Arts occupations in Prentice are Management (14 | 7.0%), Community & Social Service (14 | 7.0%), Business & Financial (12 | 6.0%), Health Diagnosing & Treating (7 | 3.5%), and Health Technologists (7 | 3.5%).
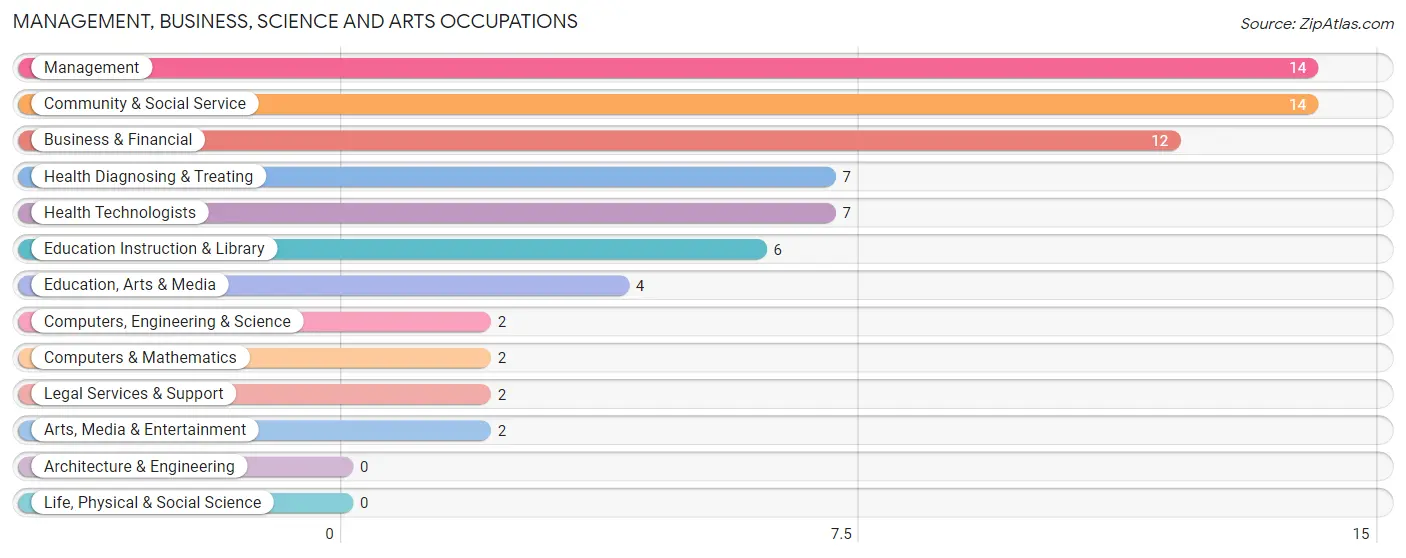
Management, Business, Science and Arts Occupations by Sex
Within the Management, Business, Science and Arts occupations in Prentice, the most male-oriented occupations are Computers, Engineering & Science (100.0%), Computers & Mathematics (100.0%), and Management (64.3%), while the most female-oriented occupations are Business & Financial (100.0%), Legal Services & Support (100.0%), and Arts, Media & Entertainment (100.0%).
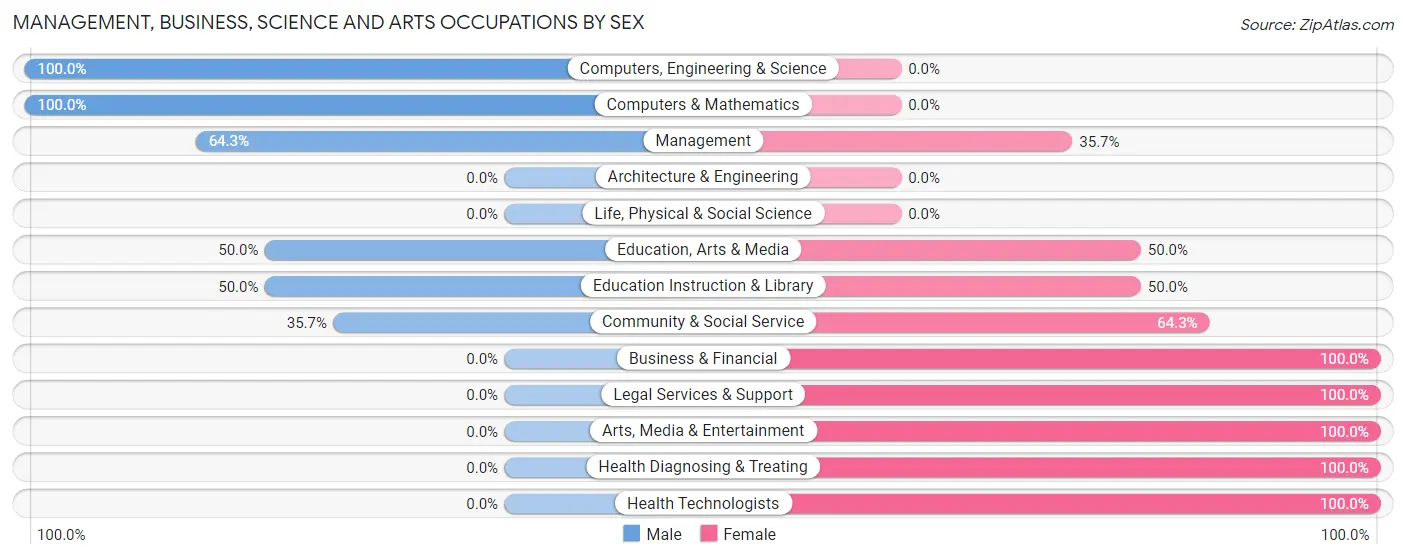
| Occupation | Male | Female |
| Management | 9 (64.3%) | 5 (35.7%) |
| Business & Financial | 0 (0.0%) | 12 (100.0%) |
| Computers, Engineering & Science | 2 (100.0%) | 0 (0.0%) |
| Computers & Mathematics | 2 (100.0%) | 0 (0.0%) |
| Architecture & Engineering | 0 (0.0%) | 0 (0.0%) |
| Life, Physical & Social Science | 0 (0.0%) | 0 (0.0%) |
| Community & Social Service | 5 (35.7%) | 9 (64.3%) |
| Education, Arts & Media | 2 (50.0%) | 2 (50.0%) |
| Legal Services & Support | 0 (0.0%) | 2 (100.0%) |
| Education Instruction & Library | 3 (50.0%) | 3 (50.0%) |
| Arts, Media & Entertainment | 0 (0.0%) | 2 (100.0%) |
| Health Diagnosing & Treating | 0 (0.0%) | 7 (100.0%) |
| Health Technologists | 0 (0.0%) | 7 (100.0%) |
| Total (Category) | 16 (32.7%) | 33 (67.3%) |
| Total (Overall) | 104 (51.7%) | 97 (48.3%) |
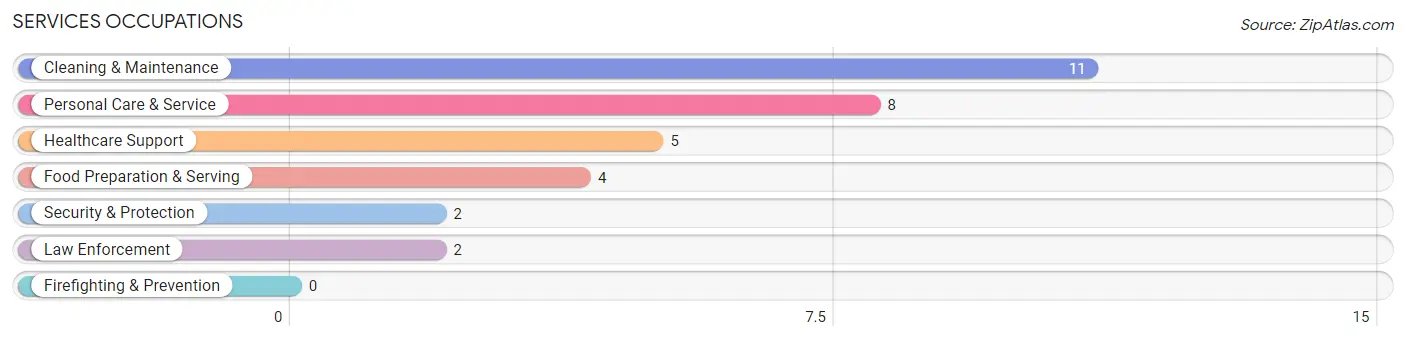
Services Occupations
The most common Services occupations in Prentice are Cleaning & Maintenance (11 | 5.5%), Personal Care & Service (8 | 4.0%), Healthcare Support (5 | 2.5%), Food Preparation & Serving (4 | 2.0%), and Security & Protection (2 | 1.0%).
Services Occupations by Sex
Within the Services occupations in Prentice, the most male-oriented occupations are Security & Protection (100.0%), Law Enforcement (100.0%), and Cleaning & Maintenance (63.6%), while the most female-oriented occupations are Healthcare Support (100.0%), Food Preparation & Serving (100.0%), and Personal Care & Service (100.0%).
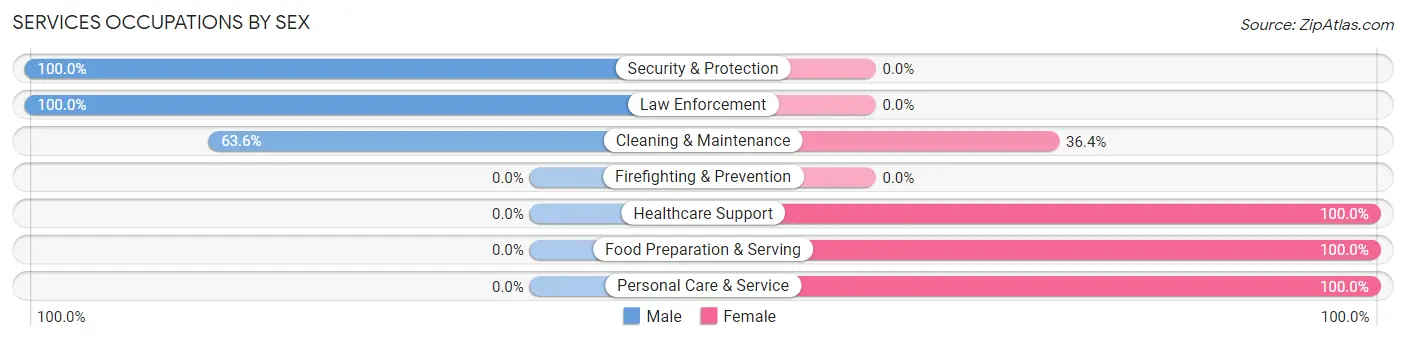
| Occupation | Male | Female |
| Healthcare Support | 0 (0.0%) | 5 (100.0%) |
| Security & Protection | 2 (100.0%) | 0 (0.0%) |
| Firefighting & Prevention | 0 (0.0%) | 0 (0.0%) |
| Law Enforcement | 2 (100.0%) | 0 (0.0%) |
| Food Preparation & Serving | 0 (0.0%) | 4 (100.0%) |
| Cleaning & Maintenance | 7 (63.6%) | 4 (36.4%) |
| Personal Care & Service | 0 (0.0%) | 8 (100.0%) |
| Total (Category) | 9 (30.0%) | 21 (70.0%) |
| Total (Overall) | 104 (51.7%) | 97 (48.3%) |
Sales and Office Occupations
The most common Sales and Office occupations in Prentice are Office & Administration (29 | 14.4%), and Sales & Related (12 | 6.0%).
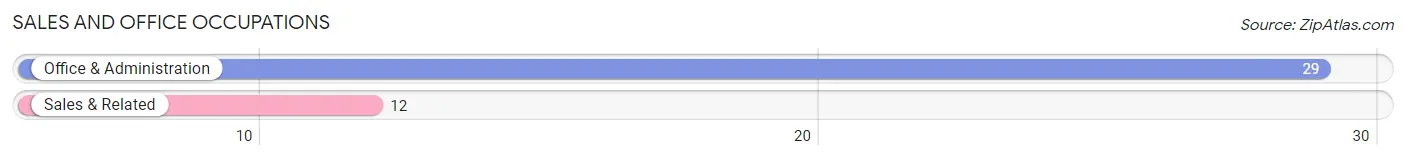
Sales and Office Occupations by Sex
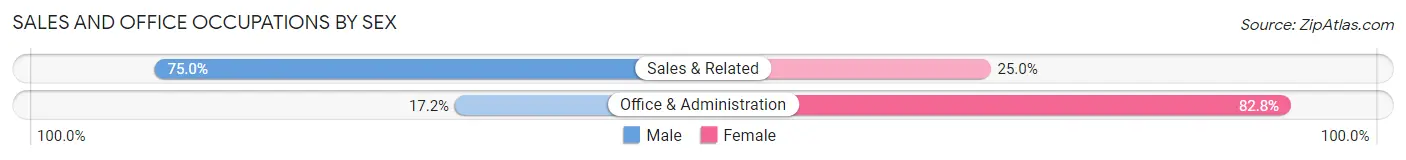
| Occupation | Male | Female |
| Sales & Related | 9 (75.0%) | 3 (25.0%) |
| Office & Administration | 5 (17.2%) | 24 (82.8%) |
| Total (Category) | 14 (34.2%) | 27 (65.8%) |
| Total (Overall) | 104 (51.7%) | 97 (48.3%) |
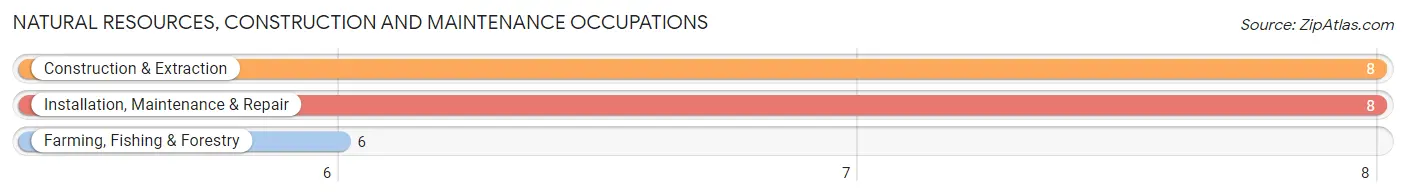
Natural Resources, Construction and Maintenance Occupations
The most common Natural Resources, Construction and Maintenance occupations in Prentice are Construction & Extraction (8 | 4.0%), Installation, Maintenance & Repair (8 | 4.0%), and Farming, Fishing & Forestry (6 | 3.0%).
Natural Resources, Construction and Maintenance Occupations by Sex
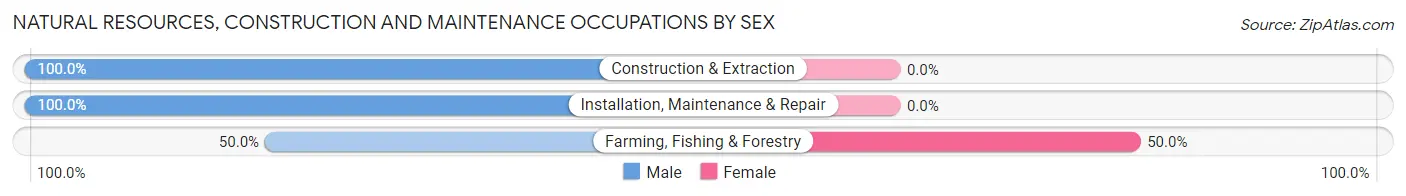
| Occupation | Male | Female |
| Farming, Fishing & Forestry | 3 (50.0%) | 3 (50.0%) |
| Construction & Extraction | 8 (100.0%) | 0 (0.0%) |
| Installation, Maintenance & Repair | 8 (100.0%) | 0 (0.0%) |
| Total (Category) | 19 (86.4%) | 3 (13.6%) |
| Total (Overall) | 104 (51.7%) | 97 (48.3%) |
Production, Transportation and Moving Occupations
The most common Production, Transportation and Moving occupations in Prentice are Production (40 | 19.9%), Material Moving (10 | 5.0%), and Transportation (9 | 4.5%).
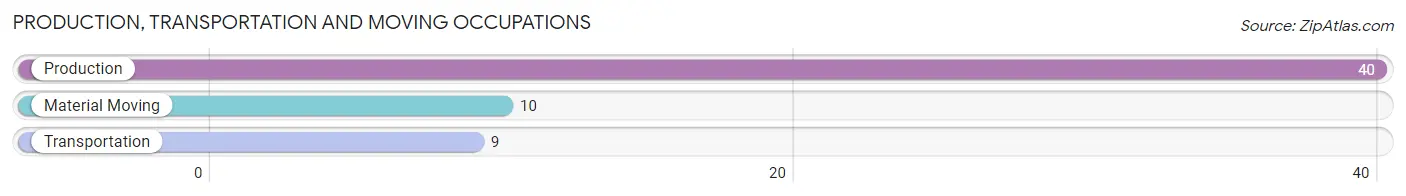
Production, Transportation and Moving Occupations by Sex
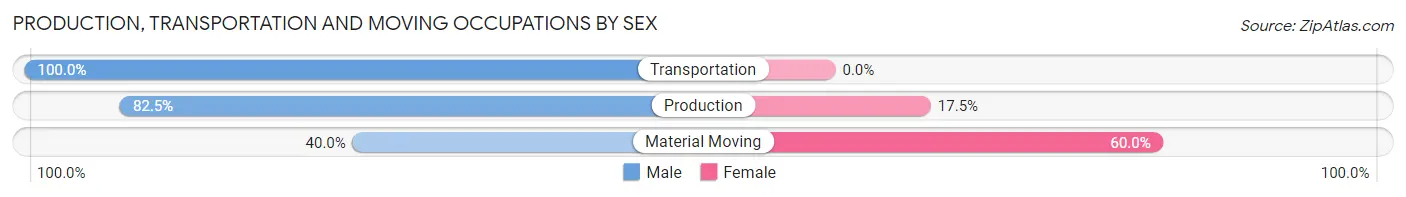
| Occupation | Male | Female |
| Production | 33 (82.5%) | 7 (17.5%) |
| Transportation | 9 (100.0%) | 0 (0.0%) |
| Material Moving | 4 (40.0%) | 6 (60.0%) |
| Total (Category) | 46 (78.0%) | 13 (22.0%) |
| Total (Overall) | 104 (51.7%) | 97 (48.3%) |
Employment Industries by Sex in Prentice
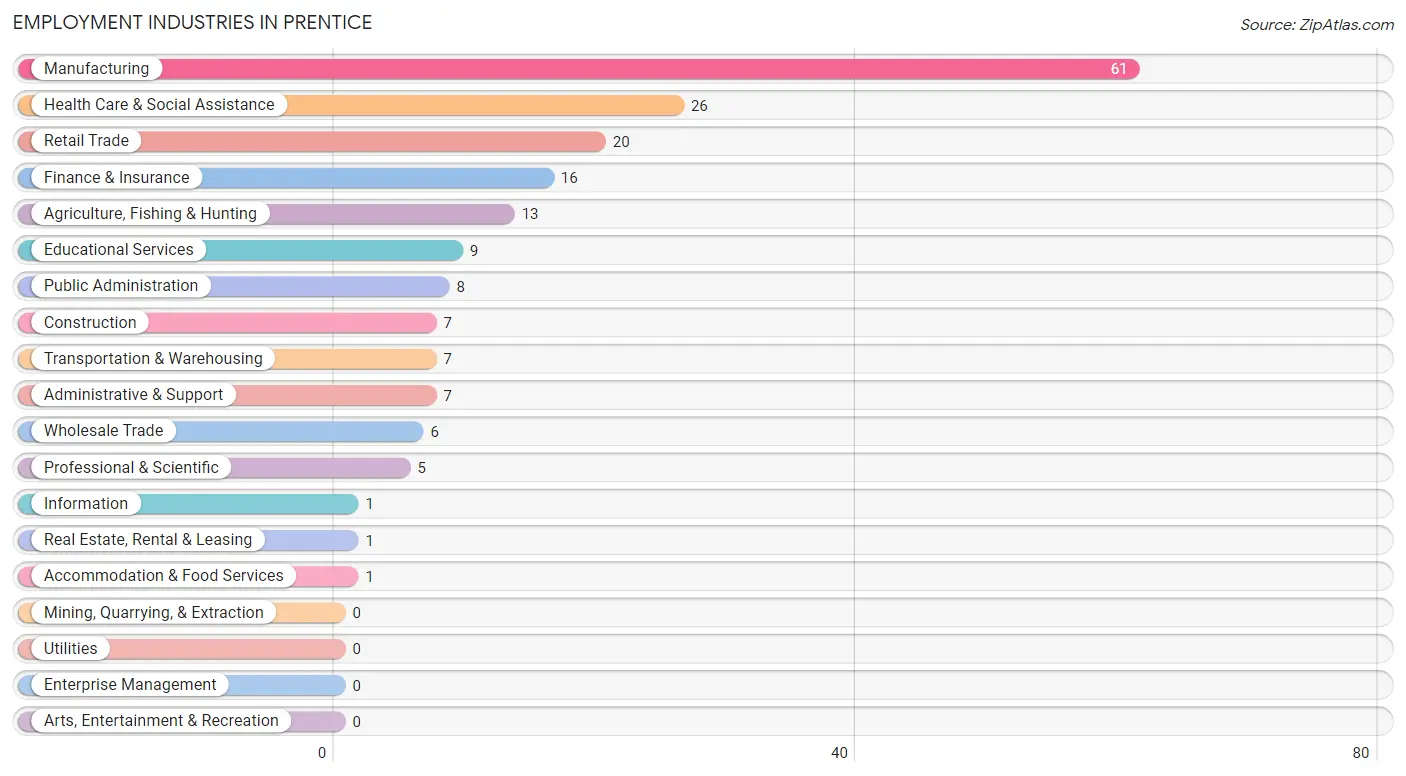
Employment Industries in Prentice
The major employment industries in Prentice include Manufacturing (61 | 30.3%), Health Care & Social Assistance (26 | 12.9%), Retail Trade (20 | 10.0%), Finance & Insurance (16 | 8.0%), and Agriculture, Fishing & Hunting (13 | 6.5%).
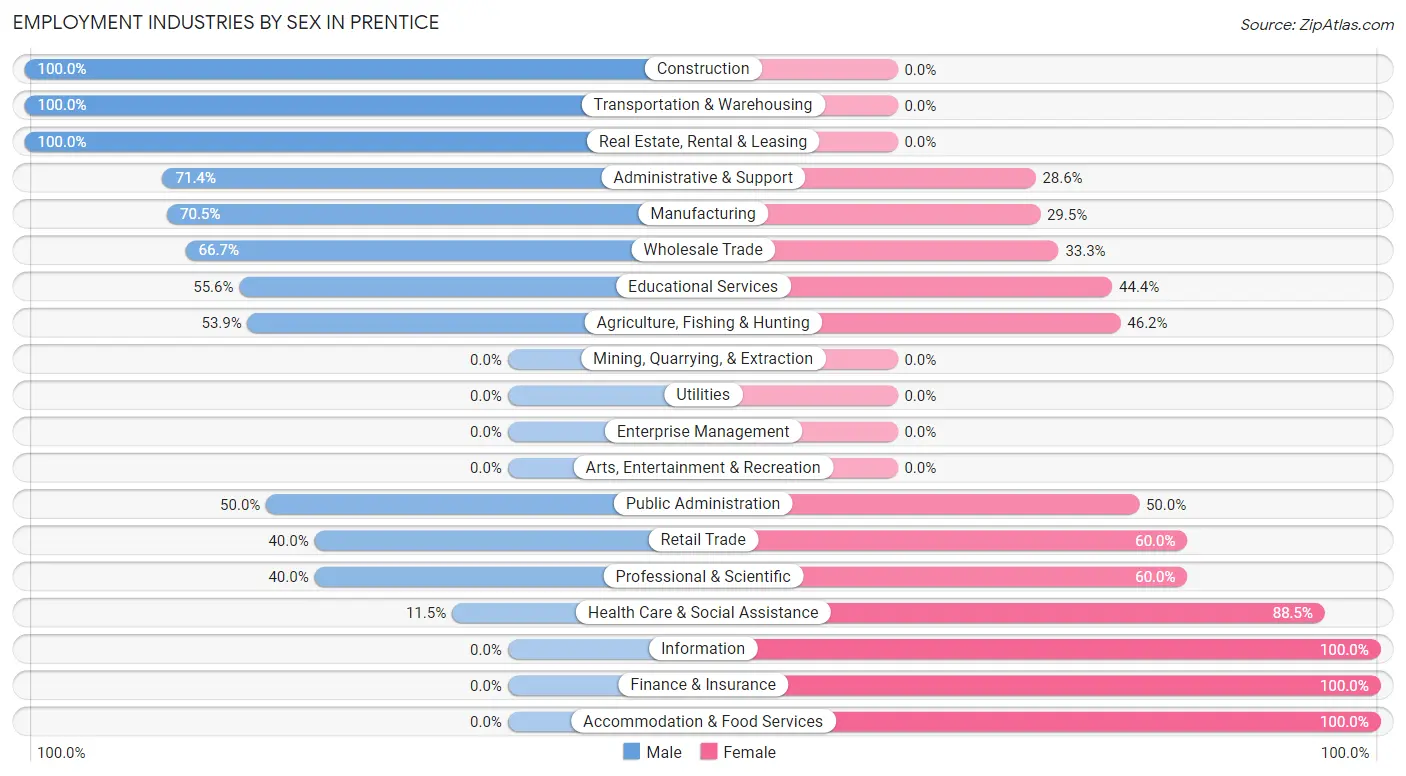
Employment Industries by Sex in Prentice
The Prentice industries that see more men than women are Construction (100.0%), Transportation & Warehousing (100.0%), and Real Estate, Rental & Leasing (100.0%), whereas the industries that tend to have a higher number of women are Information (100.0%), Finance & Insurance (100.0%), and Accommodation & Food Services (100.0%).
| Industry | Male | Female |
| Agriculture, Fishing & Hunting | 7 (53.8%) | 6 (46.2%) |
| Mining, Quarrying, & Extraction | 0 (0.0%) | 0 (0.0%) |
| Construction | 7 (100.0%) | 0 (0.0%) |
| Manufacturing | 43 (70.5%) | 18 (29.5%) |
| Wholesale Trade | 4 (66.7%) | 2 (33.3%) |
| Retail Trade | 8 (40.0%) | 12 (60.0%) |
| Transportation & Warehousing | 7 (100.0%) | 0 (0.0%) |
| Utilities | 0 (0.0%) | 0 (0.0%) |
| Information | 0 (0.0%) | 1 (100.0%) |
| Finance & Insurance | 0 (0.0%) | 16 (100.0%) |
| Real Estate, Rental & Leasing | 1 (100.0%) | 0 (0.0%) |
| Professional & Scientific | 2 (40.0%) | 3 (60.0%) |
| Enterprise Management | 0 (0.0%) | 0 (0.0%) |
| Administrative & Support | 5 (71.4%) | 2 (28.6%) |
| Educational Services | 5 (55.6%) | 4 (44.4%) |
| Health Care & Social Assistance | 3 (11.5%) | 23 (88.5%) |
| Arts, Entertainment & Recreation | 0 (0.0%) | 0 (0.0%) |
| Accommodation & Food Services | 0 (0.0%) | 1 (100.0%) |
| Public Administration | 4 (50.0%) | 4 (50.0%) |
| Total | 104 (51.7%) | 97 (48.3%) |
Education in Prentice
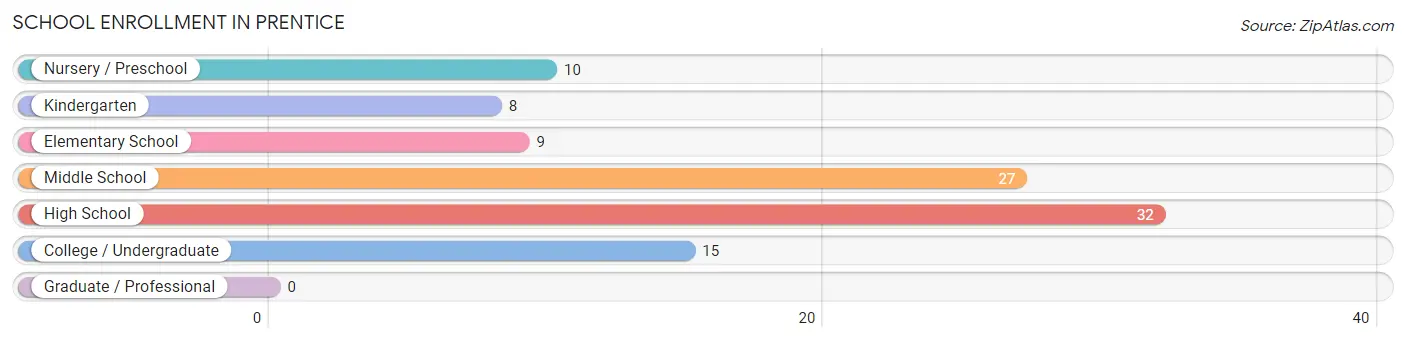
School Enrollment in Prentice
The most common levels of schooling among the 101 students in Prentice are high school (32 | 31.7%), middle school (27 | 26.7%), and college / undergraduate (15 | 14.8%).
| School Level | # Students | % Students |
| Nursery / Preschool | 10 | 9.9% |
| Kindergarten | 8 | 7.9% |
| Elementary School | 9 | 8.9% |
| Middle School | 27 | 26.7% |
| High School | 32 | 31.7% |
| College / Undergraduate | 15 | 14.8% |
| Graduate / Professional | 0 | 0.0% |
| Total | 101 | 100.0% |
School Enrollment by Age by Funding Source in Prentice
Out of a total of 101 students who are enrolled in schools in Prentice, 15 (14.9%) attend a private institution, while the remaining 86 (85.1%) are enrolled in public schools. The age group of 20 to 24 year olds has the highest likelihood of being enrolled in private schools, with 5 (50.0% in the age bracket) enrolled. Conversely, the age group of 5 to 9 year old has the lowest likelihood of being enrolled in a private school, with 18 (100.0% in the age bracket) attending a public institution.
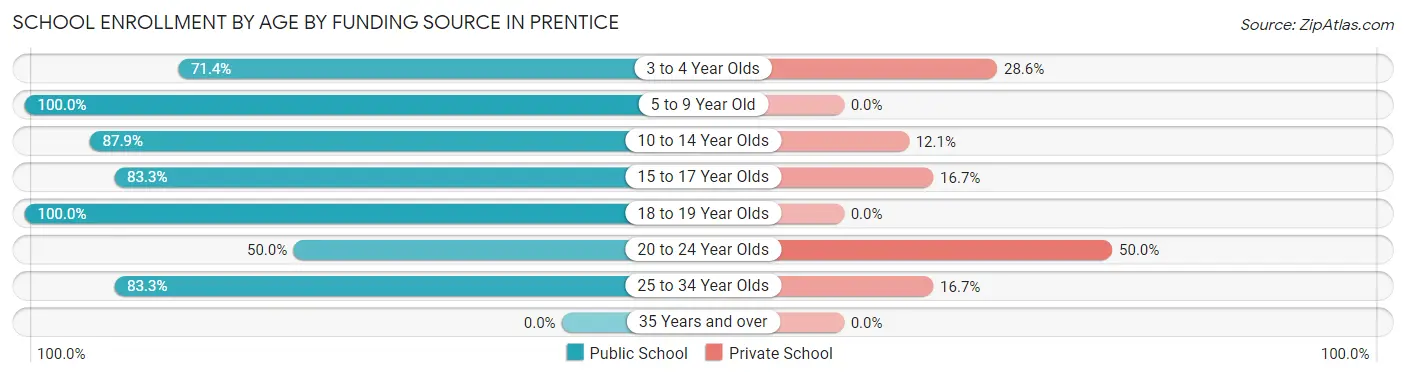
| Age Bracket | Public School | Private School |
| 3 to 4 Year Olds | 5 (71.4%) | 2 (28.6%) |
| 5 to 9 Year Old | 18 (100.0%) | 0 (0.0%) |
| 10 to 14 Year Olds | 29 (87.9%) | 4 (12.1%) |
| 15 to 17 Year Olds | 15 (83.3%) | 3 (16.7%) |
| 18 to 19 Year Olds | 9 (100.0%) | 0 (0.0%) |
| 20 to 24 Year Olds | 5 (50.0%) | 5 (50.0%) |
| 25 to 34 Year Olds | 5 (83.3%) | 1 (16.7%) |
| 35 Years and over | 0 (0.0%) | 0 (0.0%) |
| Total | 86 (85.1%) | 15 (14.9%) |
Educational Attainment by Field of Study in Prentice
Business (22 | 40.0%), engineering (7 | 12.7%), arts & humanities (6 | 10.9%), education (5 | 9.1%), and psychology (3 | 5.4%) are the most common fields of study among 55 individuals in Prentice who have obtained a bachelor's degree or higher.
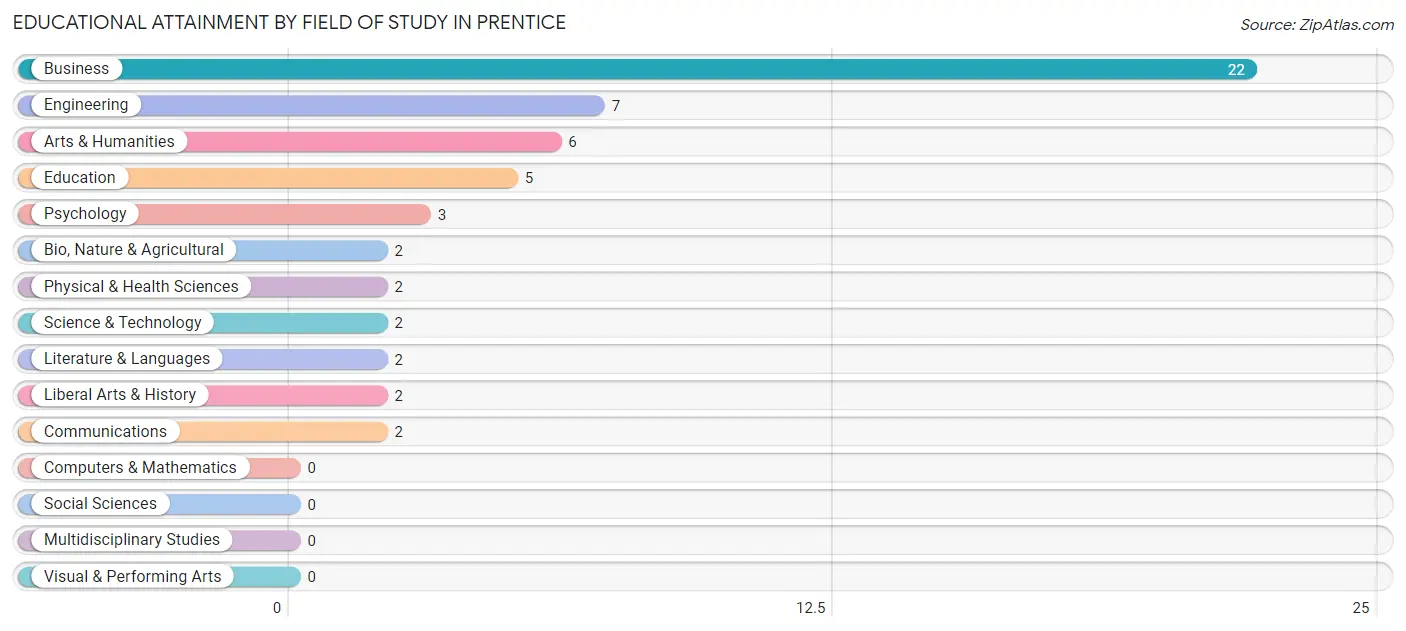
| Field of Study | # Graduates | % Graduates |
| Computers & Mathematics | 0 | 0.0% |
| Bio, Nature & Agricultural | 2 | 3.6% |
| Physical & Health Sciences | 2 | 3.6% |
| Psychology | 3 | 5.4% |
| Social Sciences | 0 | 0.0% |
| Engineering | 7 | 12.7% |
| Multidisciplinary Studies | 0 | 0.0% |
| Science & Technology | 2 | 3.6% |
| Business | 22 | 40.0% |
| Education | 5 | 9.1% |
| Literature & Languages | 2 | 3.6% |
| Liberal Arts & History | 2 | 3.6% |
| Visual & Performing Arts | 0 | 0.0% |
| Communications | 2 | 3.6% |
| Arts & Humanities | 6 | 10.9% |
| Total | 55 | 100.0% |
Transportation & Commute in Prentice
Vehicle Availability by Sex in Prentice
The most prevalent vehicle ownership categories in Prentice are males with 2 vehicles (57, accounting for 54.8%) and females with 2 vehicles (43, making up 58.8%).
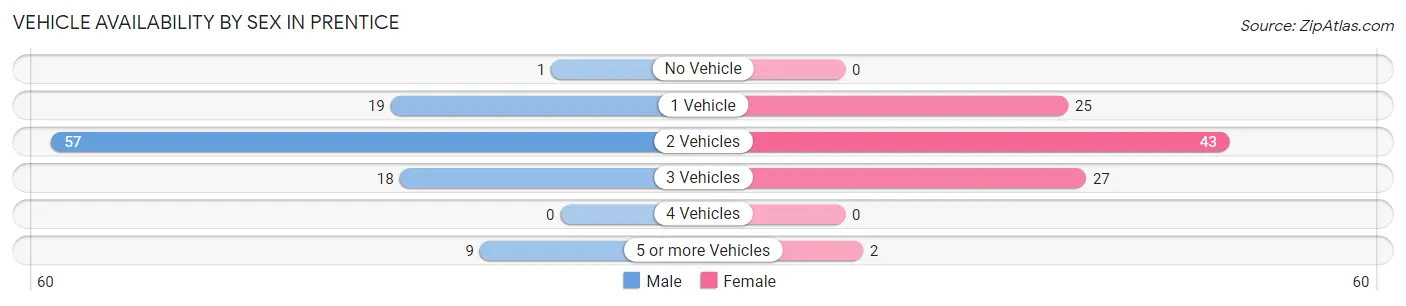
| Vehicles Available | Male | Female |
| No Vehicle | 1 (1.0%) | 0 (0.0%) |
| 1 Vehicle | 19 (18.3%) | 25 (25.8%) |
| 2 Vehicles | 57 (54.8%) | 43 (44.3%) |
| 3 Vehicles | 18 (17.3%) | 27 (27.8%) |
| 4 Vehicles | 0 (0.0%) | 0 (0.0%) |
| 5 or more Vehicles | 9 (8.6%) | 2 (2.1%) |
| Total | 104 (100.0%) | 97 (100.0%) |
Commute Time in Prentice
The most frequently occuring commute durations in Prentice are less than 5 minutes (42 commuters, 23.2%), 20 to 24 minutes (29 commuters, 16.0%), and 15 to 19 minutes (26 commuters, 14.4%).
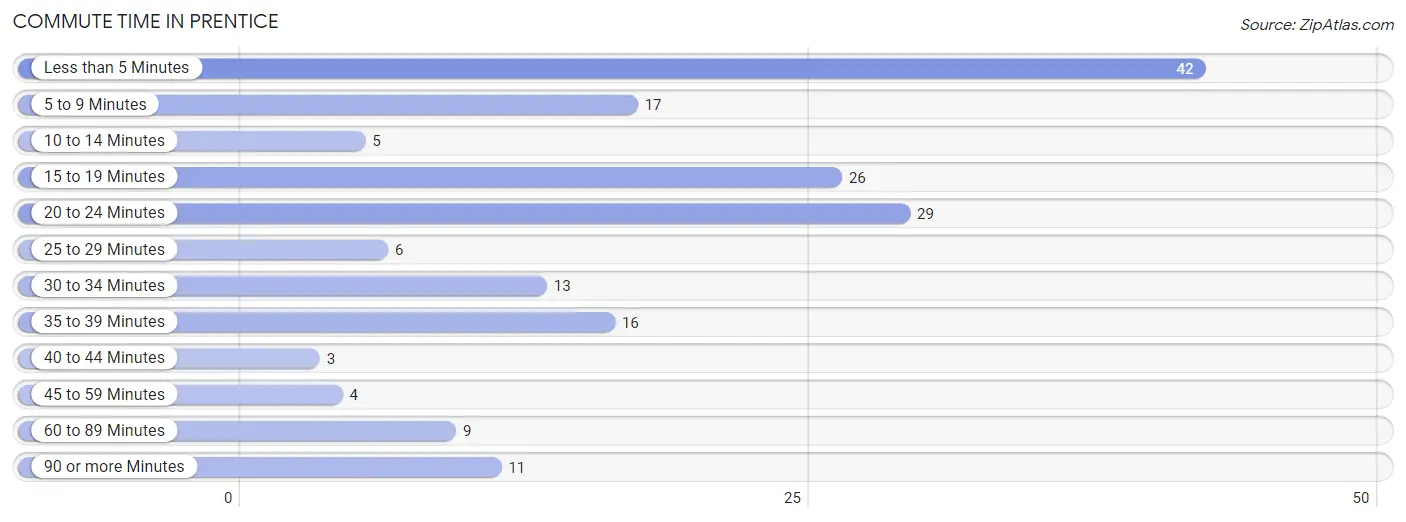
| Commute Time | # Commuters | % Commuters |
| Less than 5 Minutes | 42 | 23.2% |
| 5 to 9 Minutes | 17 | 9.4% |
| 10 to 14 Minutes | 5 | 2.8% |
| 15 to 19 Minutes | 26 | 14.4% |
| 20 to 24 Minutes | 29 | 16.0% |
| 25 to 29 Minutes | 6 | 3.3% |
| 30 to 34 Minutes | 13 | 7.2% |
| 35 to 39 Minutes | 16 | 8.8% |
| 40 to 44 Minutes | 3 | 1.7% |
| 45 to 59 Minutes | 4 | 2.2% |
| 60 to 89 Minutes | 9 | 5.0% |
| 90 or more Minutes | 11 | 6.1% |
Commute Time by Sex in Prentice
The most common commute times in Prentice are less than 5 minutes (28 commuters, 27.2%) for males and 20 to 24 minutes (19 commuters, 24.4%) for females.
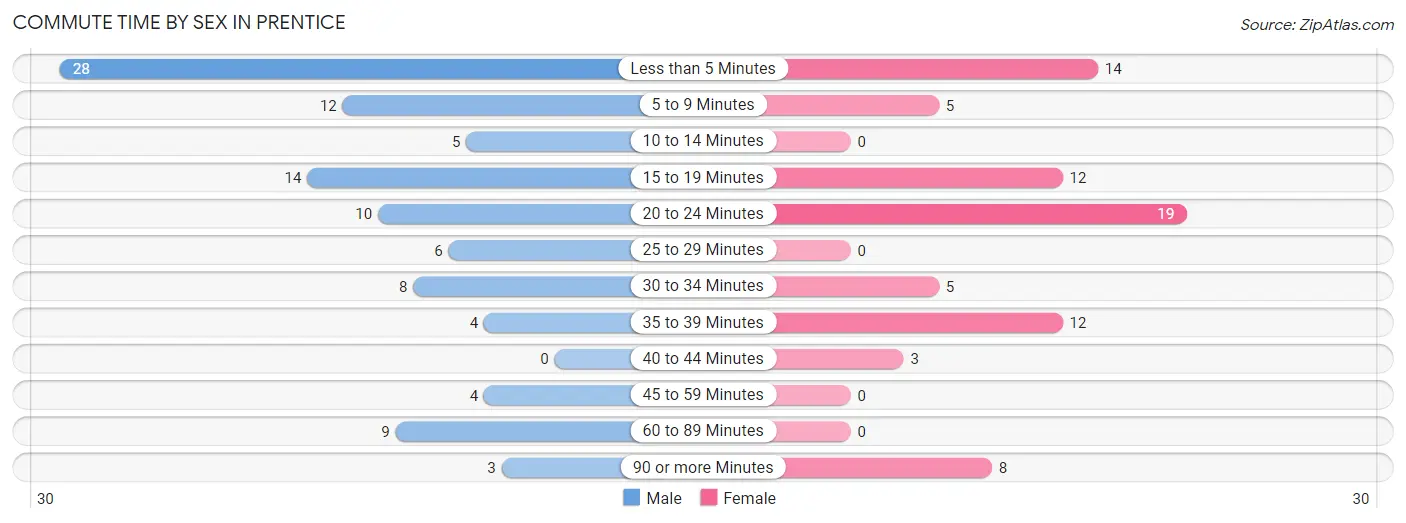
| Commute Time | Male | Female |
| Less than 5 Minutes | 28 (27.2%) | 14 (17.9%) |
| 5 to 9 Minutes | 12 (11.7%) | 5 (6.4%) |
| 10 to 14 Minutes | 5 (4.9%) | 0 (0.0%) |
| 15 to 19 Minutes | 14 (13.6%) | 12 (15.4%) |
| 20 to 24 Minutes | 10 (9.7%) | 19 (24.4%) |
| 25 to 29 Minutes | 6 (5.8%) | 0 (0.0%) |
| 30 to 34 Minutes | 8 (7.8%) | 5 (6.4%) |
| 35 to 39 Minutes | 4 (3.9%) | 12 (15.4%) |
| 40 to 44 Minutes | 0 (0.0%) | 3 (3.8%) |
| 45 to 59 Minutes | 4 (3.9%) | 0 (0.0%) |
| 60 to 89 Minutes | 9 (8.7%) | 0 (0.0%) |
| 90 or more Minutes | 3 (2.9%) | 8 (10.3%) |
Time of Departure to Work by Sex in Prentice
The most frequent times of departure to work in Prentice are 5:30 AM to 5:59 AM (23, 22.3%) for males and 7:00 AM to 7:29 AM (22, 28.2%) for females.
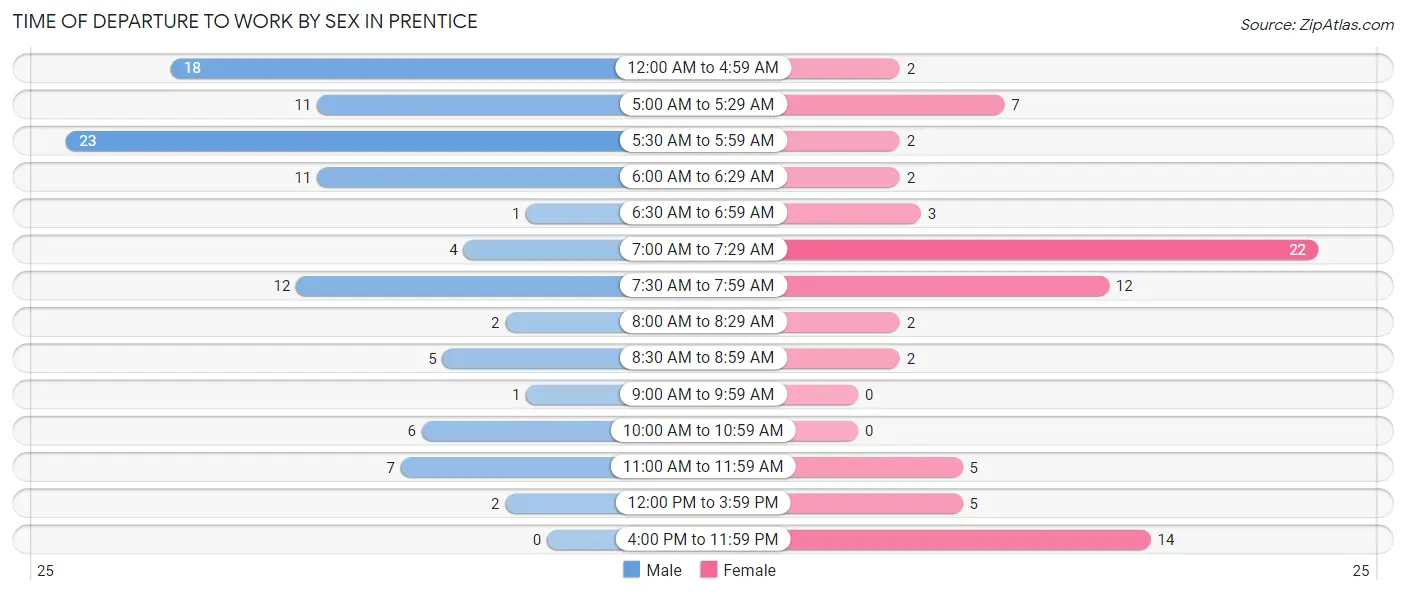
| Time of Departure | Male | Female |
| 12:00 AM to 4:59 AM | 18 (17.5%) | 2 (2.6%) |
| 5:00 AM to 5:29 AM | 11 (10.7%) | 7 (9.0%) |
| 5:30 AM to 5:59 AM | 23 (22.3%) | 2 (2.6%) |
| 6:00 AM to 6:29 AM | 11 (10.7%) | 2 (2.6%) |
| 6:30 AM to 6:59 AM | 1 (1.0%) | 3 (3.8%) |
| 7:00 AM to 7:29 AM | 4 (3.9%) | 22 (28.2%) |
| 7:30 AM to 7:59 AM | 12 (11.7%) | 12 (15.4%) |
| 8:00 AM to 8:29 AM | 2 (1.9%) | 2 (2.6%) |
| 8:30 AM to 8:59 AM | 5 (4.9%) | 2 (2.6%) |
| 9:00 AM to 9:59 AM | 1 (1.0%) | 0 (0.0%) |
| 10:00 AM to 10:59 AM | 6 (5.8%) | 0 (0.0%) |
| 11:00 AM to 11:59 AM | 7 (6.8%) | 5 (6.4%) |
| 12:00 PM to 3:59 PM | 2 (1.9%) | 5 (6.4%) |
| 4:00 PM to 11:59 PM | 0 (0.0%) | 14 (17.9%) |
| Total | 103 (100.0%) | 78 (100.0%) |
Housing Occupancy in Prentice
Occupancy by Ownership in Prentice
Of the total 214 dwellings in Prentice, owner-occupied units account for 147 (68.7%), while renter-occupied units make up 67 (31.3%).
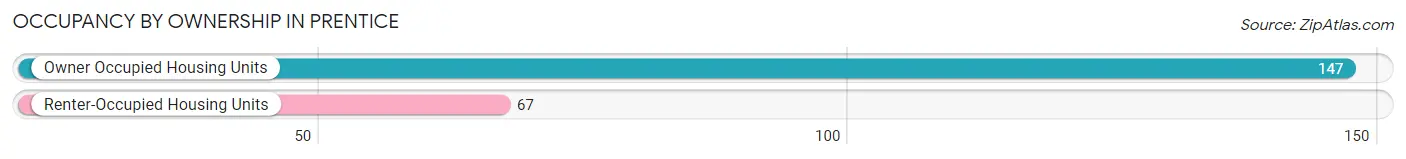
| Occupancy | # Housing Units | % Housing Units |
| Owner Occupied Housing Units | 147 | 68.7% |
| Renter-Occupied Housing Units | 67 | 31.3% |
| Total Occupied Housing Units | 214 | 100.0% |
Occupancy by Household Size in Prentice
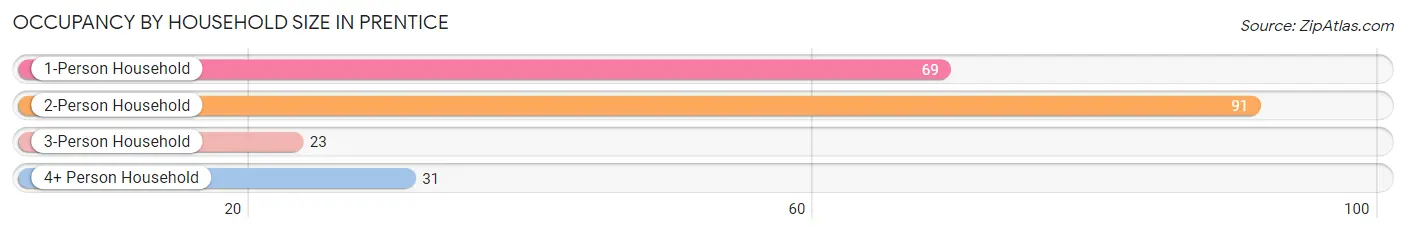
| Household Size | # Housing Units | % Housing Units |
| 1-Person Household | 69 | 32.2% |
| 2-Person Household | 91 | 42.5% |
| 3-Person Household | 23 | 10.7% |
| 4+ Person Household | 31 | 14.5% |
| Total Housing Units | 214 | 100.0% |
Occupancy by Ownership by Household Size in Prentice
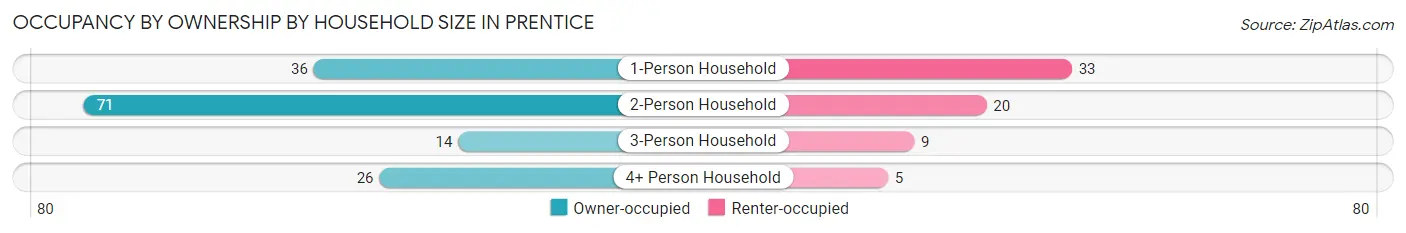
| Household Size | Owner-occupied | Renter-occupied |
| 1-Person Household | 36 (52.2%) | 33 (47.8%) |
| 2-Person Household | 71 (78.0%) | 20 (22.0%) |
| 3-Person Household | 14 (60.9%) | 9 (39.1%) |
| 4+ Person Household | 26 (83.9%) | 5 (16.1%) |
| Total Housing Units | 147 (68.7%) | 67 (31.3%) |
Occupancy by Educational Attainment in Prentice
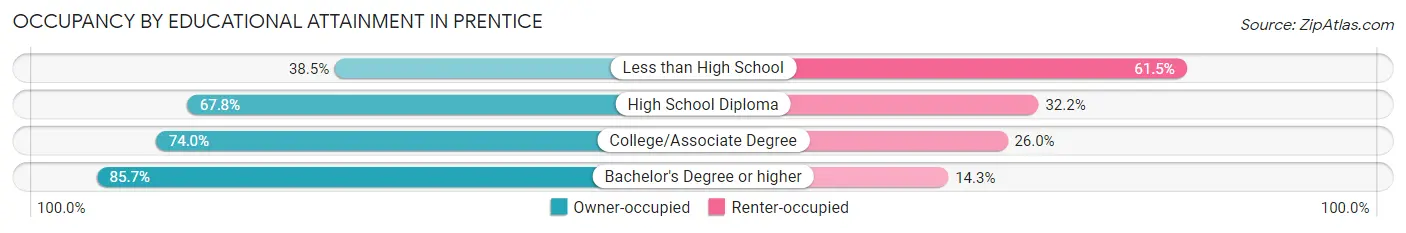
| Household Size | Owner-occupied | Renter-occupied |
| Less than High School | 10 (38.5%) | 16 (61.5%) |
| High School Diploma | 59 (67.8%) | 28 (32.2%) |
| College/Associate Degree | 54 (74.0%) | 19 (26.0%) |
| Bachelor's Degree or higher | 24 (85.7%) | 4 (14.3%) |
Occupancy by Age of Householder in Prentice
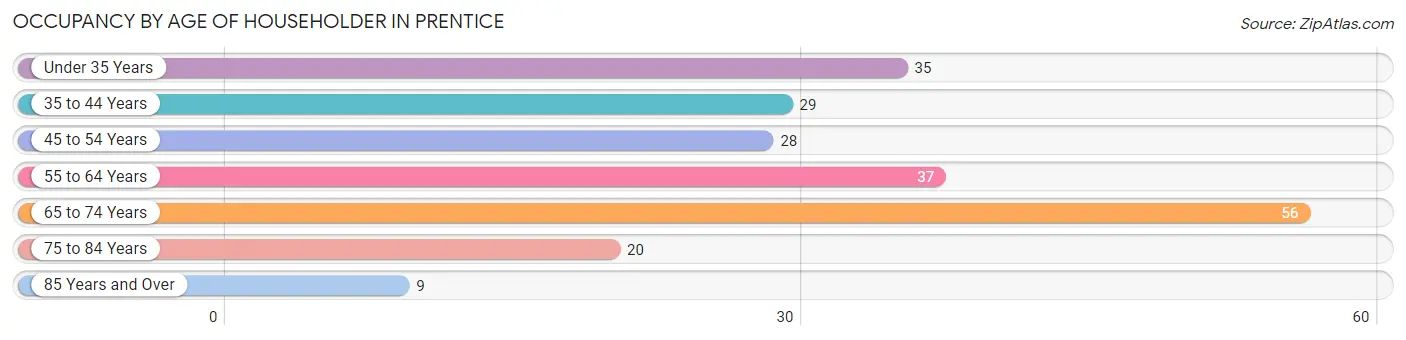
| Age Bracket | # Households | % Households |
| Under 35 Years | 35 | 16.4% |
| 35 to 44 Years | 29 | 13.6% |
| 45 to 54 Years | 28 | 13.1% |
| 55 to 64 Years | 37 | 17.3% |
| 65 to 74 Years | 56 | 26.2% |
| 75 to 84 Years | 20 | 9.3% |
| 85 Years and Over | 9 | 4.2% |
| Total | 214 | 100.0% |
Housing Finances in Prentice
Median Income by Occupancy in Prentice
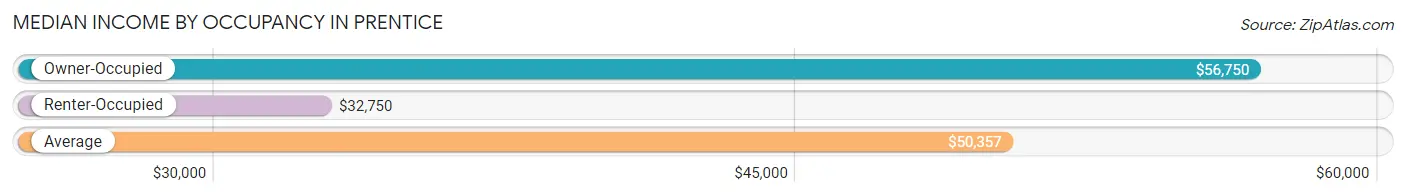
| Occupancy Type | # Households | Median Income |
| Owner-Occupied | 147 (68.7%) | $56,750 |
| Renter-Occupied | 67 (31.3%) | $32,750 |
| Average | 214 (100.0%) | $50,357 |
Occupancy by Householder Income Bracket in Prentice
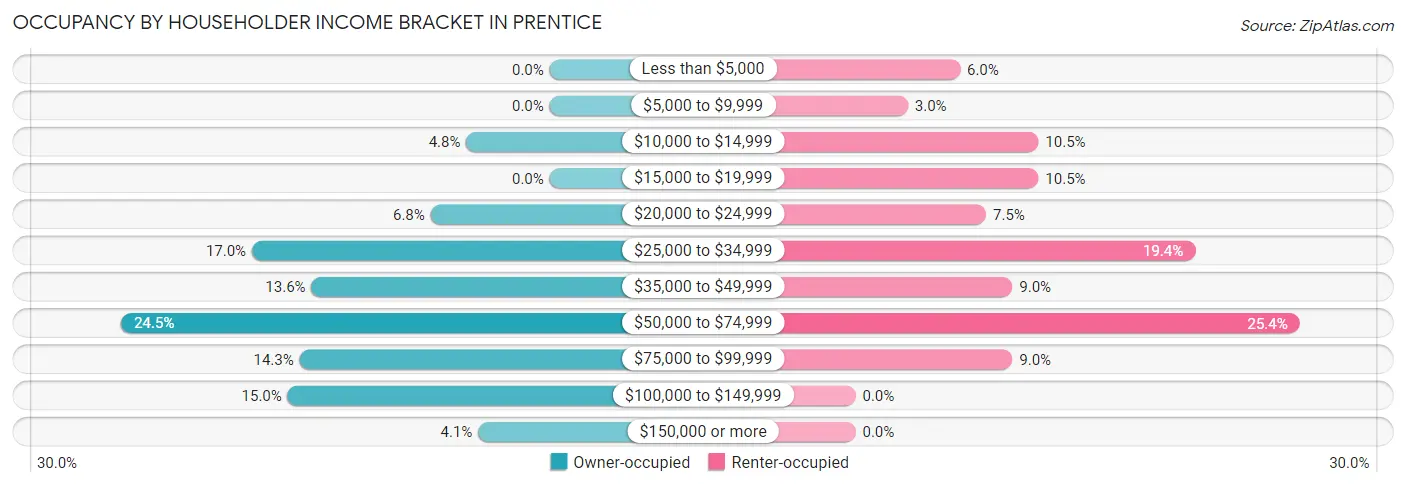
| Income Bracket | Owner-occupied | Renter-occupied |
| Less than $5,000 | 0 (0.0%) | 4 (6.0%) |
| $5,000 to $9,999 | 0 (0.0%) | 2 (3.0%) |
| $10,000 to $14,999 | 7 (4.8%) | 7 (10.4%) |
| $15,000 to $19,999 | 0 (0.0%) | 7 (10.4%) |
| $20,000 to $24,999 | 10 (6.8%) | 5 (7.5%) |
| $25,000 to $34,999 | 25 (17.0%) | 13 (19.4%) |
| $35,000 to $49,999 | 20 (13.6%) | 6 (9.0%) |
| $50,000 to $74,999 | 36 (24.5%) | 17 (25.4%) |
| $75,000 to $99,999 | 21 (14.3%) | 6 (9.0%) |
| $100,000 to $149,999 | 22 (15.0%) | 0 (0.0%) |
| $150,000 or more | 6 (4.1%) | 0 (0.0%) |
| Total | 147 (100.0%) | 67 (100.0%) |
Monthly Housing Cost Tiers in Prentice
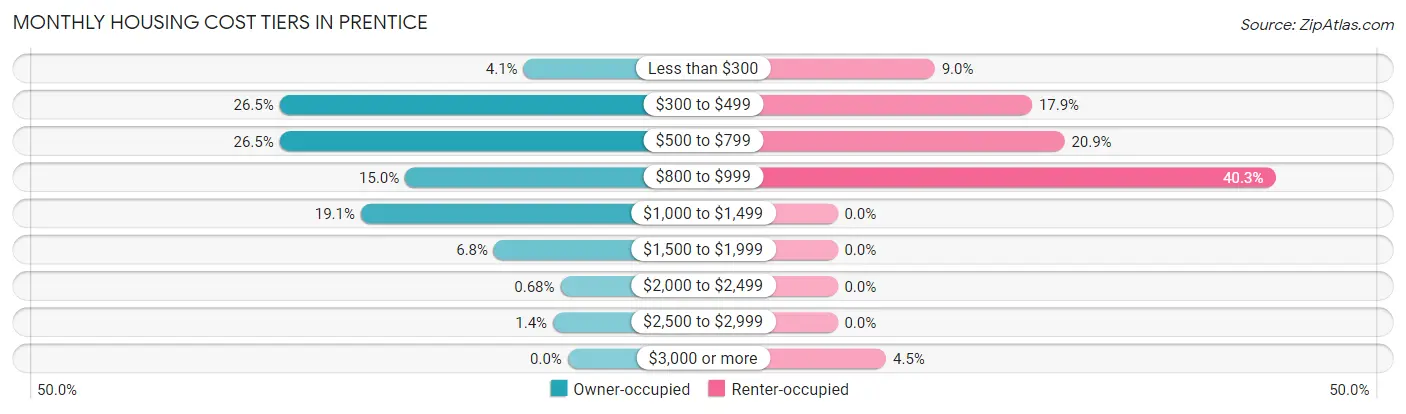
| Monthly Cost | Owner-occupied | Renter-occupied |
| Less than $300 | 6 (4.1%) | 6 (9.0%) |
| $300 to $499 | 39 (26.5%) | 12 (17.9%) |
| $500 to $799 | 39 (26.5%) | 14 (20.9%) |
| $800 to $999 | 22 (15.0%) | 27 (40.3%) |
| $1,000 to $1,499 | 28 (19.1%) | 0 (0.0%) |
| $1,500 to $1,999 | 10 (6.8%) | 0 (0.0%) |
| $2,000 to $2,499 | 1 (0.7%) | 0 (0.0%) |
| $2,500 to $2,999 | 2 (1.4%) | 0 (0.0%) |
| $3,000 or more | 0 (0.0%) | 3 (4.5%) |
| Total | 147 (100.0%) | 67 (100.0%) |
Physical Housing Characteristics in Prentice
Housing Structures in Prentice
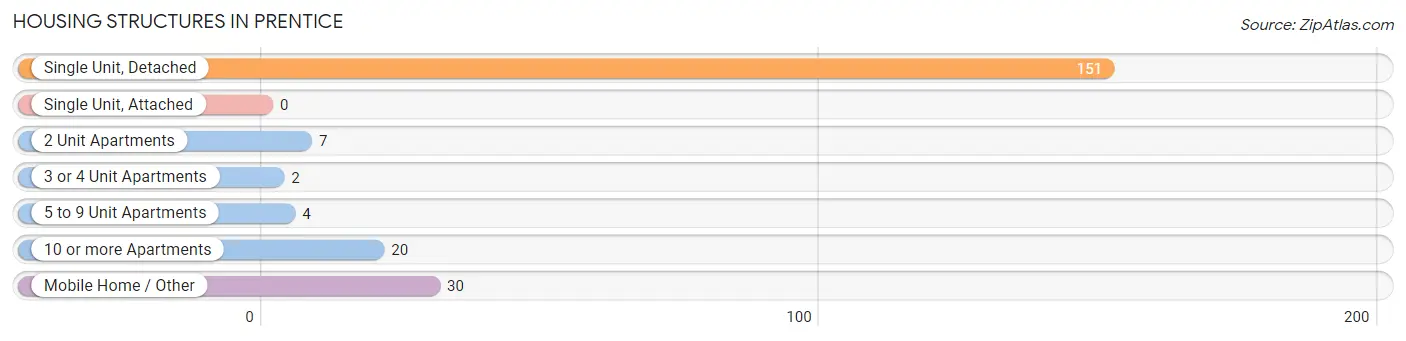
| Structure Type | # Housing Units | % Housing Units |
| Single Unit, Detached | 151 | 70.6% |
| Single Unit, Attached | 0 | 0.0% |
| 2 Unit Apartments | 7 | 3.3% |
| 3 or 4 Unit Apartments | 2 | 0.9% |
| 5 to 9 Unit Apartments | 4 | 1.9% |
| 10 or more Apartments | 20 | 9.3% |
| Mobile Home / Other | 30 | 14.0% |
| Total | 214 | 100.0% |
Housing Structures by Occupancy in Prentice
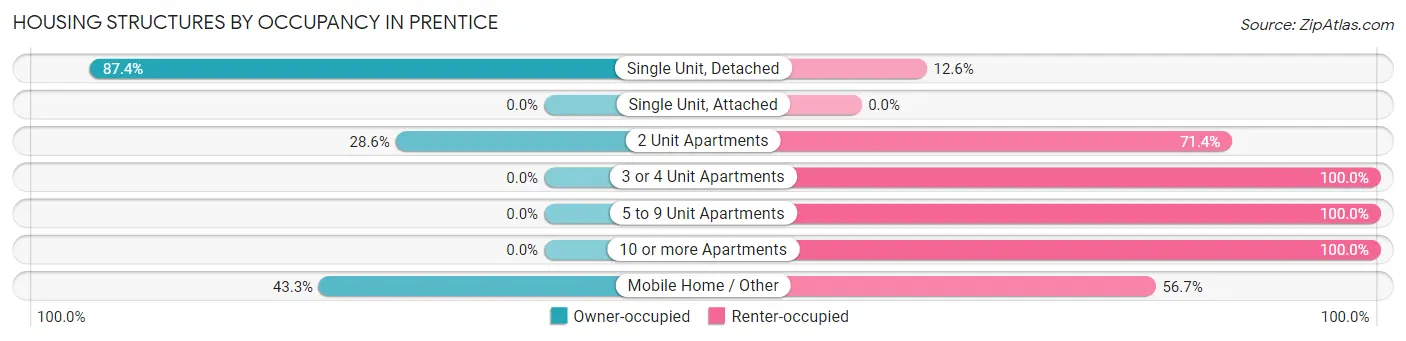
| Structure Type | Owner-occupied | Renter-occupied |
| Single Unit, Detached | 132 (87.4%) | 19 (12.6%) |
| Single Unit, Attached | 0 (0.0%) | 0 (0.0%) |
| 2 Unit Apartments | 2 (28.6%) | 5 (71.4%) |
| 3 or 4 Unit Apartments | 0 (0.0%) | 2 (100.0%) |
| 5 to 9 Unit Apartments | 0 (0.0%) | 4 (100.0%) |
| 10 or more Apartments | 0 (0.0%) | 20 (100.0%) |
| Mobile Home / Other | 13 (43.3%) | 17 (56.7%) |
| Total | 147 (68.7%) | 67 (31.3%) |
Housing Structures by Number of Rooms in Prentice
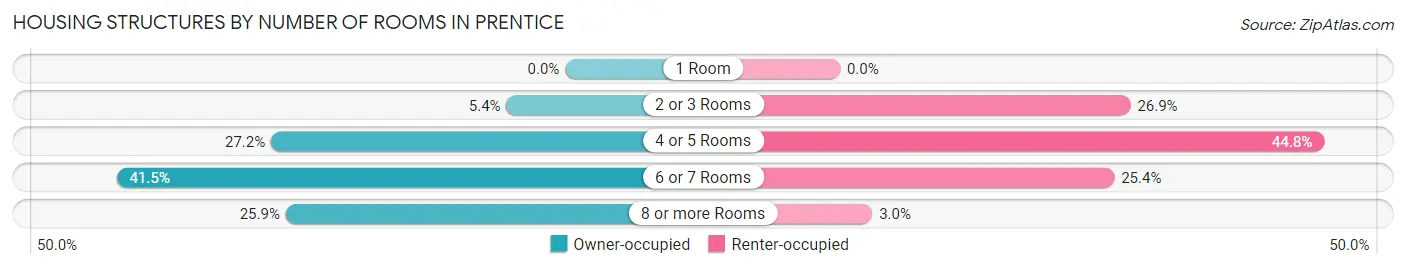
| Number of Rooms | Owner-occupied | Renter-occupied |
| 1 Room | 0 (0.0%) | 0 (0.0%) |
| 2 or 3 Rooms | 8 (5.4%) | 18 (26.9%) |
| 4 or 5 Rooms | 40 (27.2%) | 30 (44.8%) |
| 6 or 7 Rooms | 61 (41.5%) | 17 (25.4%) |
| 8 or more Rooms | 38 (25.9%) | 2 (3.0%) |
| Total | 147 (100.0%) | 67 (100.0%) |
Housing Structure by Heating Type in Prentice
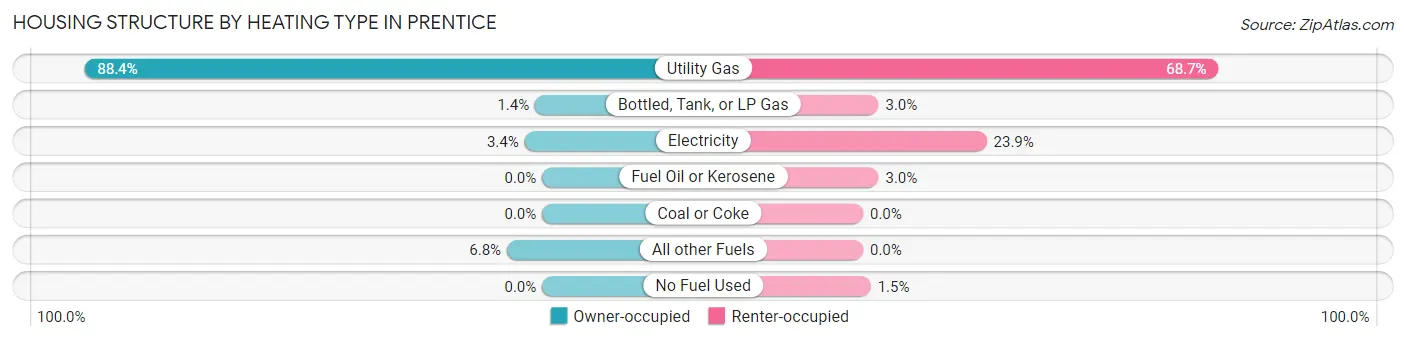
| Heating Type | Owner-occupied | Renter-occupied |
| Utility Gas | 130 (88.4%) | 46 (68.7%) |
| Bottled, Tank, or LP Gas | 2 (1.4%) | 2 (3.0%) |
| Electricity | 5 (3.4%) | 16 (23.9%) |
| Fuel Oil or Kerosene | 0 (0.0%) | 2 (3.0%) |
| Coal or Coke | 0 (0.0%) | 0 (0.0%) |
| All other Fuels | 10 (6.8%) | 0 (0.0%) |
| No Fuel Used | 0 (0.0%) | 1 (1.5%) |
| Total | 147 (100.0%) | 67 (100.0%) |
Household Vehicle Usage in Prentice
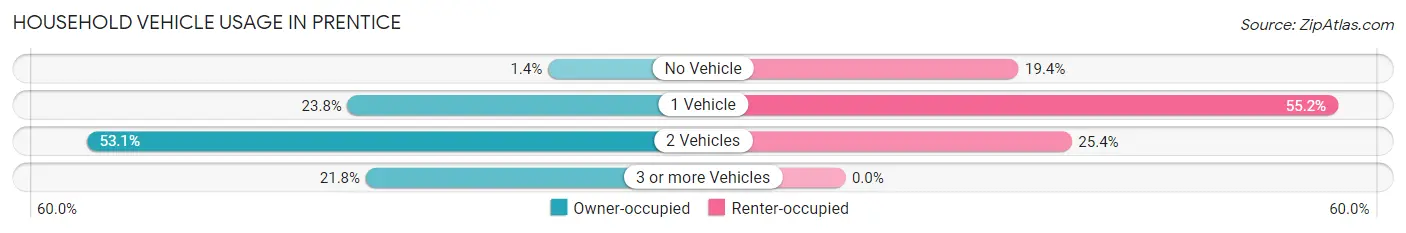
| Vehicles per Household | Owner-occupied | Renter-occupied |
| No Vehicle | 2 (1.4%) | 13 (19.4%) |
| 1 Vehicle | 35 (23.8%) | 37 (55.2%) |
| 2 Vehicles | 78 (53.1%) | 17 (25.4%) |
| 3 or more Vehicles | 32 (21.8%) | 0 (0.0%) |
| Total | 147 (100.0%) | 67 (100.0%) |
Real Estate & Mortgages in Prentice
Real Estate and Mortgage Overview in Prentice
| Characteristic | Without Mortgage | With Mortgage |
| Housing Units | 75 | 72 |
| Median Property Value | $94,400 | $90,000 |
| Median Household Income | $47,083 | $4 |
| Monthly Housing Costs | $467 | $0 |
| Real Estate Taxes | $1,317 | $0 |
Property Value by Mortgage Status in Prentice
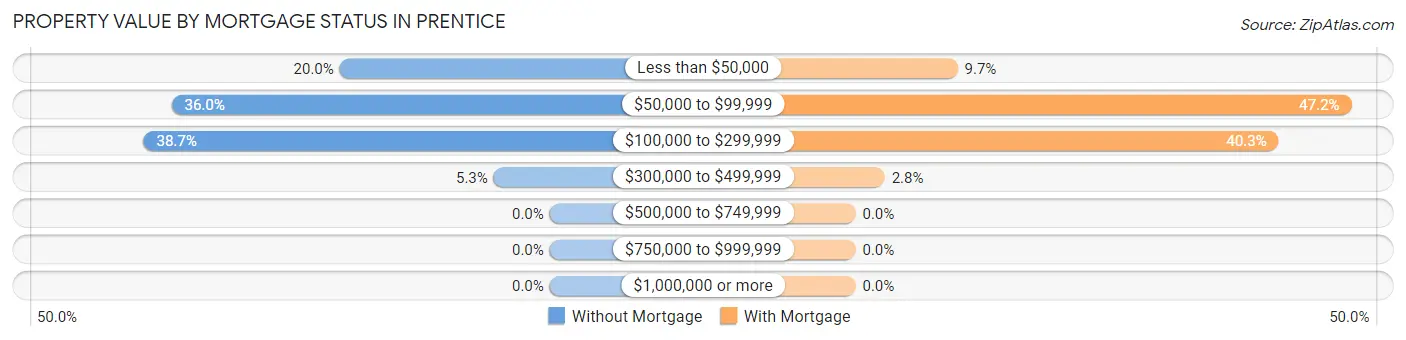
| Property Value | Without Mortgage | With Mortgage |
| Less than $50,000 | 15 (20.0%) | 7 (9.7%) |
| $50,000 to $99,999 | 27 (36.0%) | 34 (47.2%) |
| $100,000 to $299,999 | 29 (38.7%) | 29 (40.3%) |
| $300,000 to $499,999 | 4 (5.3%) | 2 (2.8%) |
| $500,000 to $749,999 | 0 (0.0%) | 0 (0.0%) |
| $750,000 to $999,999 | 0 (0.0%) | 0 (0.0%) |
| $1,000,000 or more | 0 (0.0%) | 0 (0.0%) |
| Total | 75 (100.0%) | 72 (100.0%) |
Household Income by Mortgage Status in Prentice
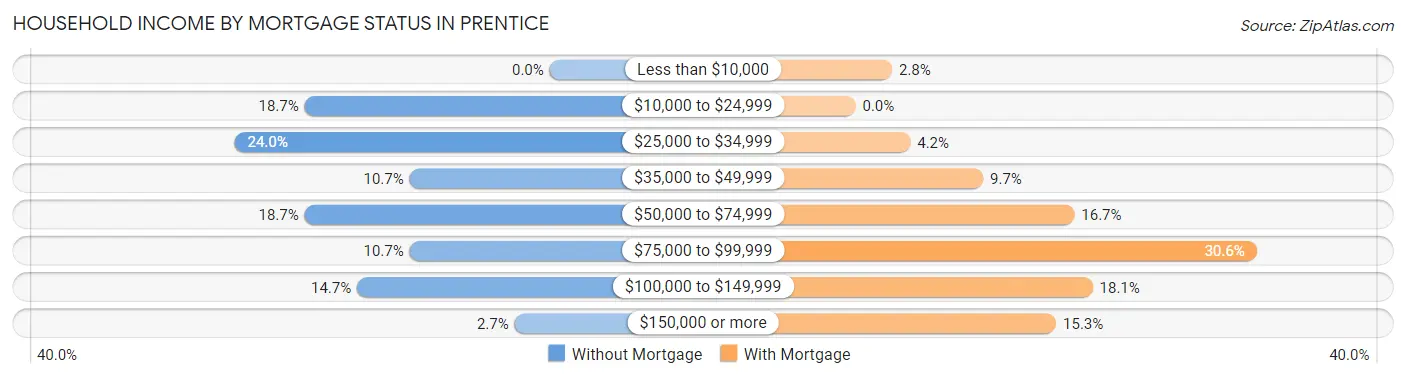
| Household Income | Without Mortgage | With Mortgage |
| Less than $10,000 | 0 (0.0%) | 2 (2.8%) |
| $10,000 to $24,999 | 14 (18.7%) | 0 (0.0%) |
| $25,000 to $34,999 | 18 (24.0%) | 3 (4.2%) |
| $35,000 to $49,999 | 8 (10.7%) | 7 (9.7%) |
| $50,000 to $74,999 | 14 (18.7%) | 12 (16.7%) |
| $75,000 to $99,999 | 8 (10.7%) | 22 (30.6%) |
| $100,000 to $149,999 | 11 (14.7%) | 13 (18.1%) |
| $150,000 or more | 2 (2.7%) | 11 (15.3%) |
| Total | 75 (100.0%) | 72 (100.0%) |
Property Value to Household Income Ratio in Prentice
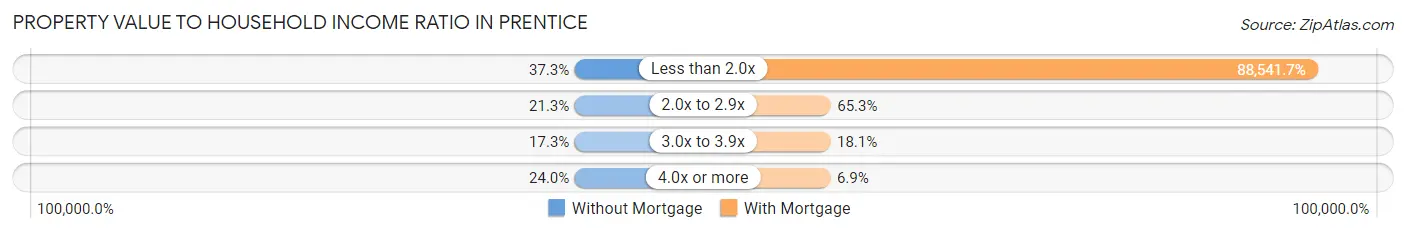
| Value-to-Income Ratio | Without Mortgage | With Mortgage |
| Less than 2.0x | 28 (37.3%) | 63,750 (88,541.7%) |
| 2.0x to 2.9x | 16 (21.3%) | 47 (65.3%) |
| 3.0x to 3.9x | 13 (17.3%) | 13 (18.1%) |
| 4.0x or more | 18 (24.0%) | 5 (6.9%) |
| Total | 75 (100.0%) | 72 (100.0%) |
Real Estate Taxes by Mortgage Status in Prentice
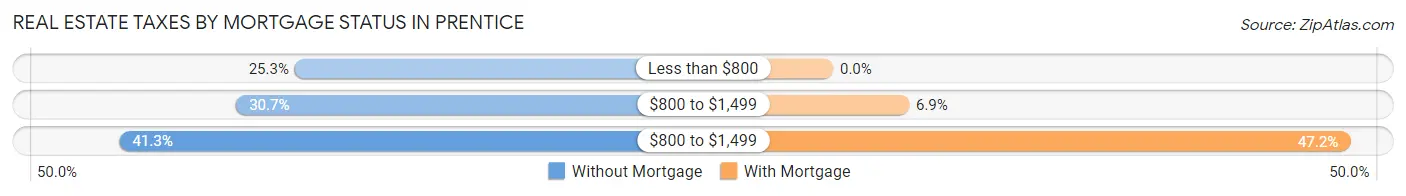
| Property Taxes | Without Mortgage | With Mortgage |
| Less than $800 | 19 (25.3%) | 0 (0.0%) |
| $800 to $1,499 | 23 (30.7%) | 5 (6.9%) |
| $800 to $1,499 | 31 (41.3%) | 34 (47.2%) |
| Total | 75 (100.0%) | 72 (100.0%) |
Health & Disability in Prentice
Health Insurance Coverage by Age in Prentice
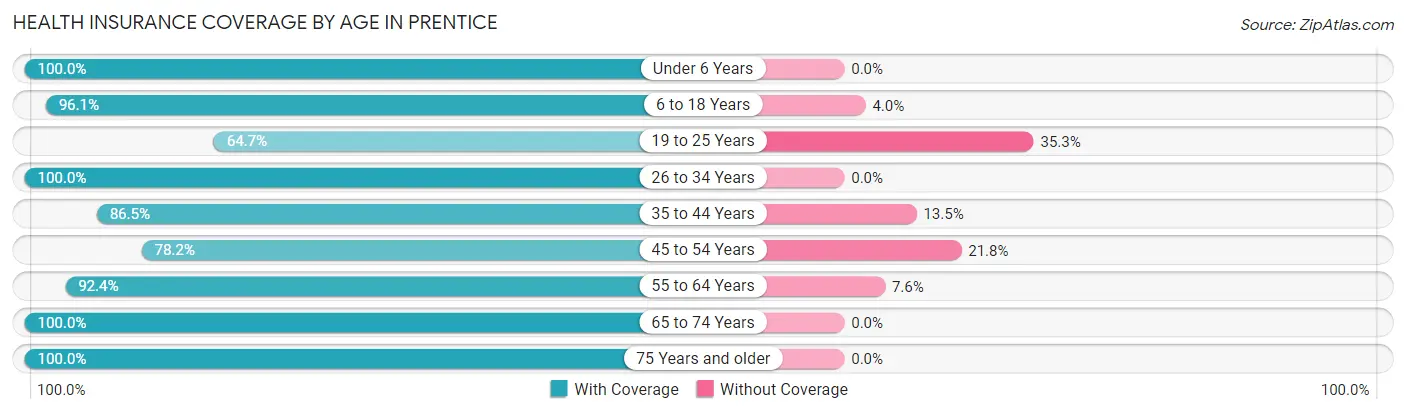
| Age Bracket | With Coverage | Without Coverage |
| Under 6 Years | 30 (100.0%) | 0 (0.0%) |
| 6 to 18 Years | 73 (96.1%) | 3 (4.0%) |
| 19 to 25 Years | 22 (64.7%) | 12 (35.3%) |
| 26 to 34 Years | 36 (100.0%) | 0 (0.0%) |
| 35 to 44 Years | 45 (86.5%) | 7 (13.5%) |
| 45 to 54 Years | 43 (78.2%) | 12 (21.8%) |
| 55 to 64 Years | 61 (92.4%) | 5 (7.6%) |
| 65 to 74 Years | 76 (100.0%) | 0 (0.0%) |
| 75 Years and older | 40 (100.0%) | 0 (0.0%) |
| Total | 426 (91.6%) | 39 (8.4%) |
Health Insurance Coverage by Citizenship Status in Prentice
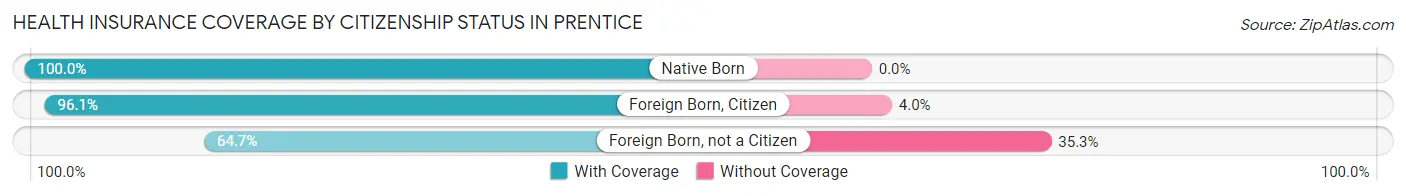
| Citizenship Status | With Coverage | Without Coverage |
| Native Born | 30 (100.0%) | 0 (0.0%) |
| Foreign Born, Citizen | 73 (96.1%) | 3 (4.0%) |
| Foreign Born, not a Citizen | 22 (64.7%) | 12 (35.3%) |
Health Insurance Coverage by Household Income in Prentice
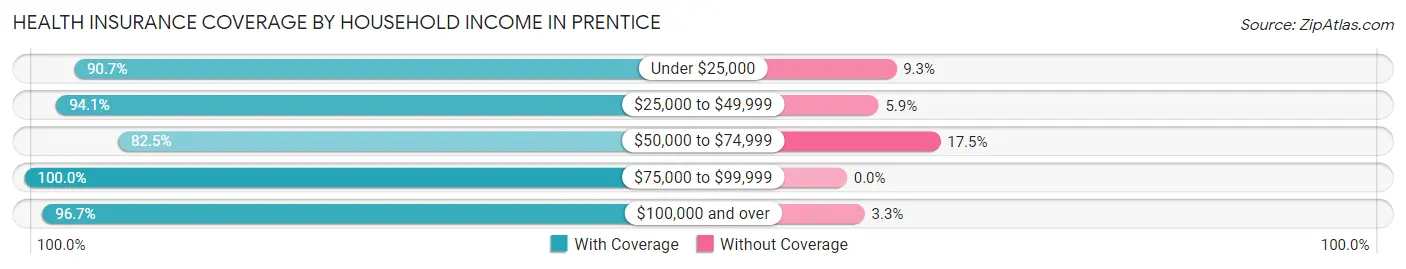
| Household Income | With Coverage | Without Coverage |
| Under $25,000 | 49 (90.7%) | 5 (9.3%) |
| $25,000 to $49,999 | 111 (94.1%) | 7 (5.9%) |
| $50,000 to $74,999 | 113 (82.5%) | 24 (17.5%) |
| $75,000 to $99,999 | 66 (100.0%) | 0 (0.0%) |
| $100,000 and over | 87 (96.7%) | 3 (3.3%) |
Public vs Private Health Insurance Coverage by Age in Prentice
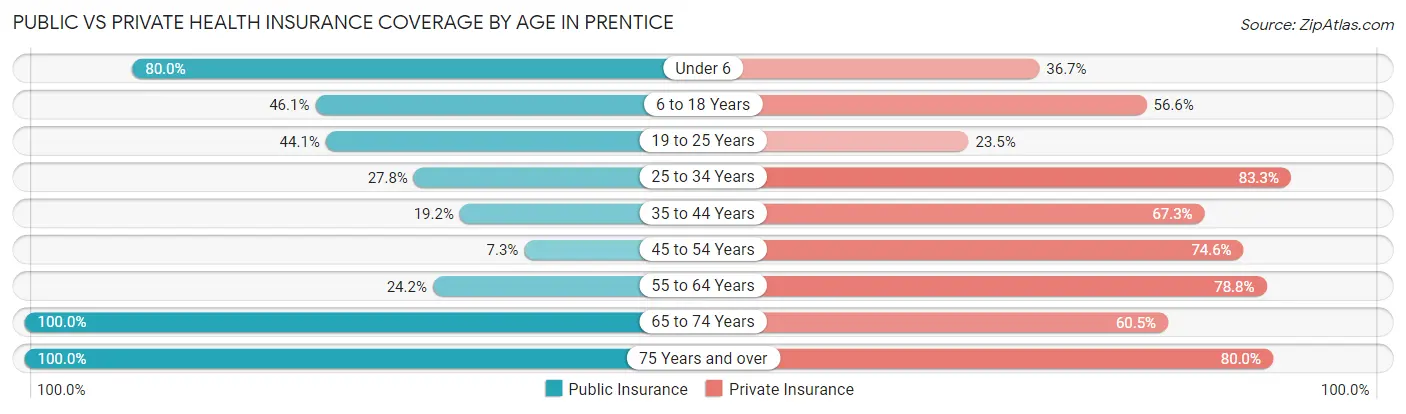
| Age Bracket | Public Insurance | Private Insurance |
| Under 6 | 24 (80.0%) | 11 (36.7%) |
| 6 to 18 Years | 35 (46.1%) | 43 (56.6%) |
| 19 to 25 Years | 15 (44.1%) | 8 (23.5%) |
| 25 to 34 Years | 10 (27.8%) | 30 (83.3%) |
| 35 to 44 Years | 10 (19.2%) | 35 (67.3%) |
| 45 to 54 Years | 4 (7.3%) | 41 (74.6%) |
| 55 to 64 Years | 16 (24.2%) | 52 (78.8%) |
| 65 to 74 Years | 76 (100.0%) | 46 (60.5%) |
| 75 Years and over | 40 (100.0%) | 32 (80.0%) |
| Total | 230 (49.5%) | 298 (64.1%) |
Disability Status by Sex by Age in Prentice
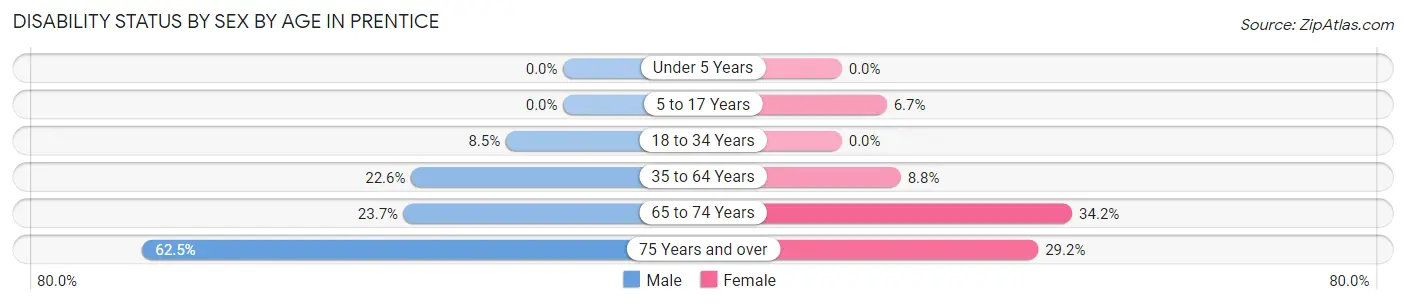
| Age Bracket | Male | Female |
| Under 5 Years | 0 (0.0%) | 0 (0.0%) |
| 5 to 17 Years | 0 (0.0%) | 3 (6.7%) |
| 18 to 34 Years | 4 (8.5%) | 0 (0.0%) |
| 35 to 64 Years | 21 (22.6%) | 7 (8.7%) |
| 65 to 74 Years | 9 (23.7%) | 13 (34.2%) |
| 75 Years and over | 10 (62.5%) | 7 (29.2%) |
Disability Class by Sex by Age in Prentice
Disability Class: Hearing Difficulty
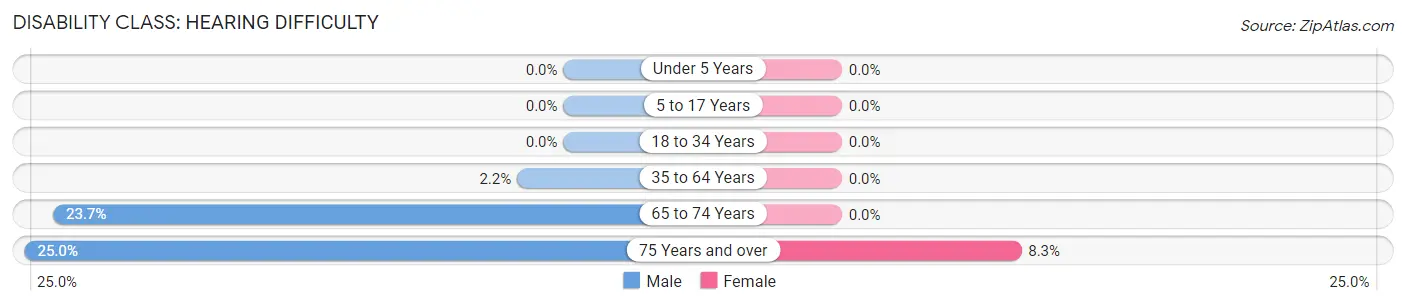
| Age Bracket | Male | Female |
| Under 5 Years | 0 (0.0%) | 0 (0.0%) |
| 5 to 17 Years | 0 (0.0%) | 0 (0.0%) |
| 18 to 34 Years | 0 (0.0%) | 0 (0.0%) |
| 35 to 64 Years | 2 (2.1%) | 0 (0.0%) |
| 65 to 74 Years | 9 (23.7%) | 0 (0.0%) |
| 75 Years and over | 4 (25.0%) | 2 (8.3%) |
Disability Class: Vision Difficulty
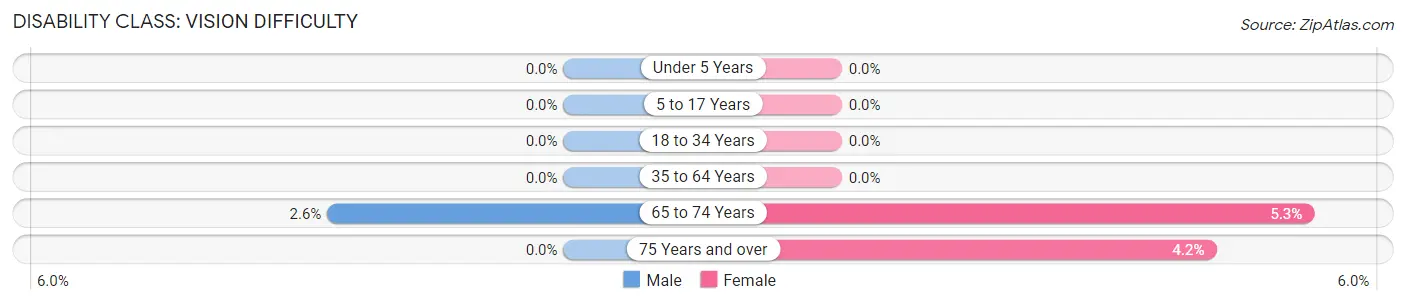
| Age Bracket | Male | Female |
| Under 5 Years | 0 (0.0%) | 0 (0.0%) |
| 5 to 17 Years | 0 (0.0%) | 0 (0.0%) |
| 18 to 34 Years | 0 (0.0%) | 0 (0.0%) |
| 35 to 64 Years | 0 (0.0%) | 0 (0.0%) |
| 65 to 74 Years | 1 (2.6%) | 2 (5.3%) |
| 75 Years and over | 0 (0.0%) | 1 (4.2%) |
Disability Class: Cognitive Difficulty
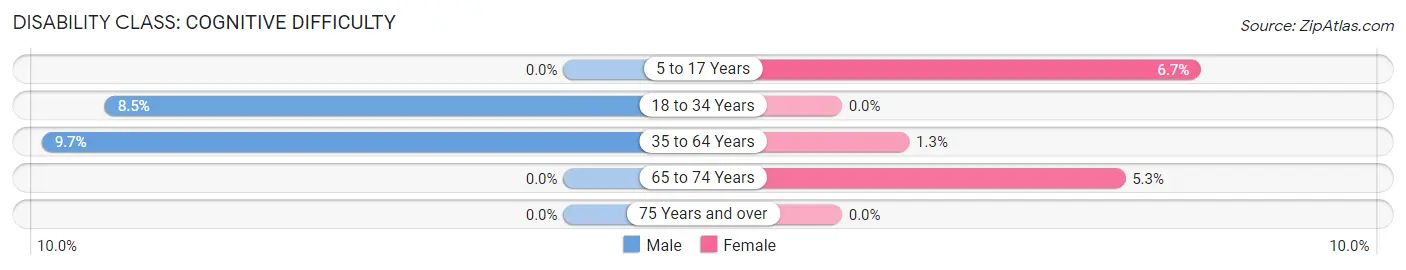
| Age Bracket | Male | Female |
| 5 to 17 Years | 0 (0.0%) | 3 (6.7%) |
| 18 to 34 Years | 4 (8.5%) | 0 (0.0%) |
| 35 to 64 Years | 9 (9.7%) | 1 (1.3%) |
| 65 to 74 Years | 0 (0.0%) | 2 (5.3%) |
| 75 Years and over | 0 (0.0%) | 0 (0.0%) |
Disability Class: Ambulatory Difficulty
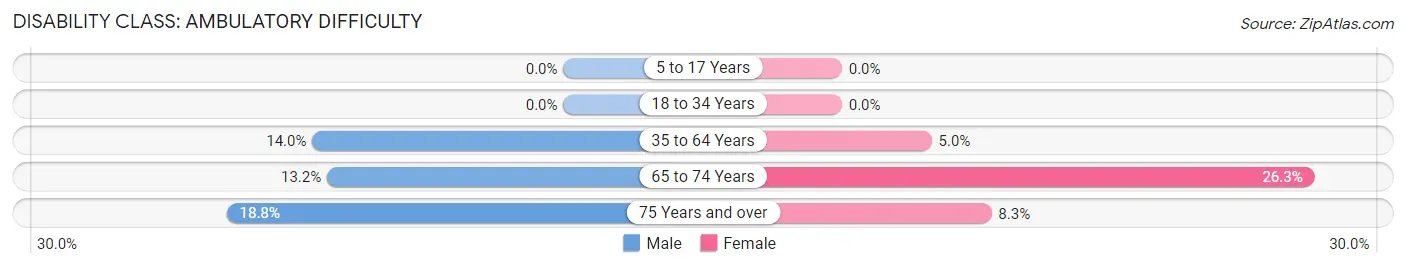
| Age Bracket | Male | Female |
| 5 to 17 Years | 0 (0.0%) | 0 (0.0%) |
| 18 to 34 Years | 0 (0.0%) | 0 (0.0%) |
| 35 to 64 Years | 13 (14.0%) | 4 (5.0%) |
| 65 to 74 Years | 5 (13.2%) | 10 (26.3%) |
| 75 Years and over | 3 (18.8%) | 2 (8.3%) |
Disability Class: Self-Care Difficulty
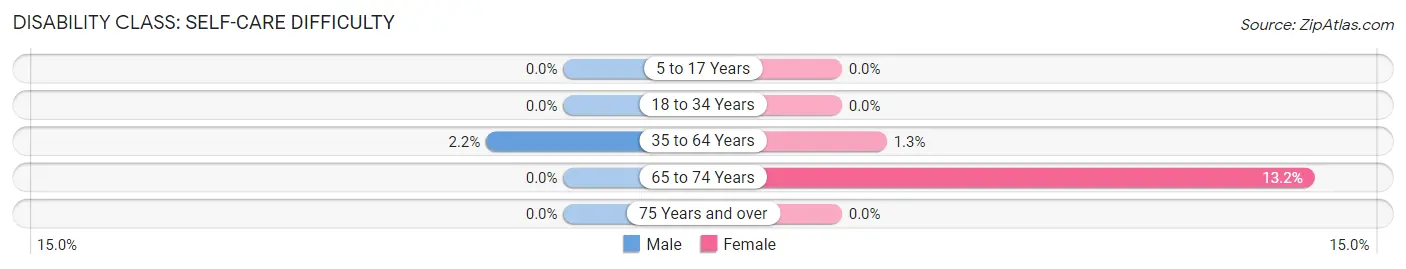
| Age Bracket | Male | Female |
| 5 to 17 Years | 0 (0.0%) | 0 (0.0%) |
| 18 to 34 Years | 0 (0.0%) | 0 (0.0%) |
| 35 to 64 Years | 2 (2.1%) | 1 (1.3%) |
| 65 to 74 Years | 0 (0.0%) | 5 (13.2%) |
| 75 Years and over | 0 (0.0%) | 0 (0.0%) |
Technology Access in Prentice
Computing Device Access in Prentice
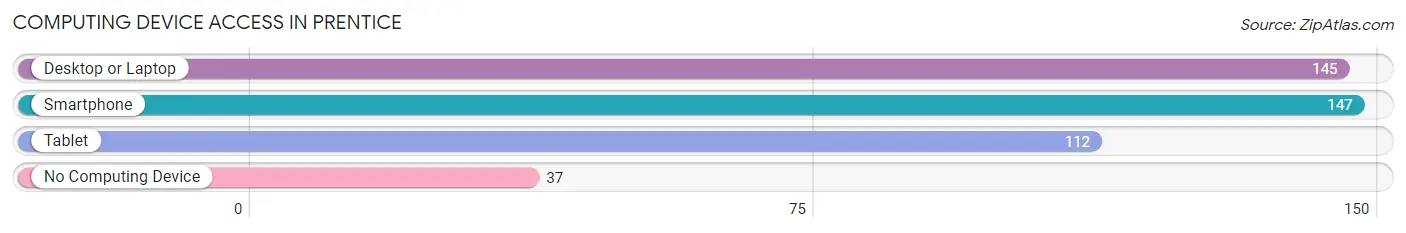
| Device Type | # Households | % Households |
| Desktop or Laptop | 145 | 67.8% |
| Smartphone | 147 | 68.7% |
| Tablet | 112 | 52.3% |
| No Computing Device | 37 | 17.3% |
| Total | 214 | 100.0% |
Internet Access in Prentice
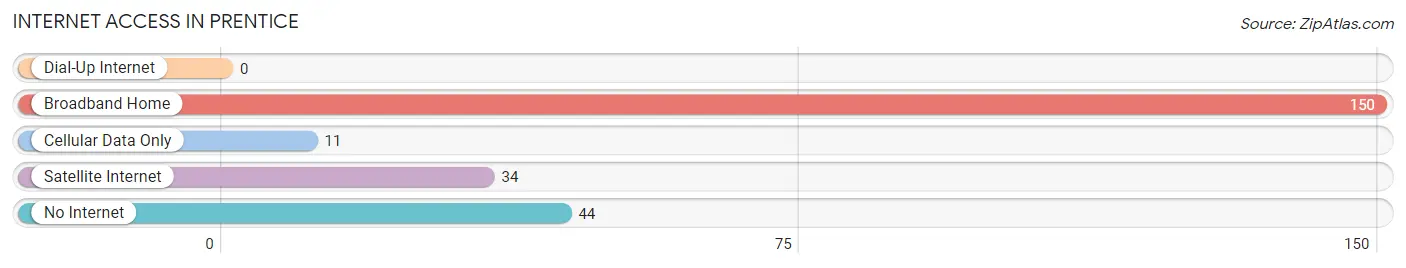
| Internet Type | # Households | % Households |
| Dial-Up Internet | 0 | 0.0% |
| Broadband Home | 150 | 70.1% |
| Cellular Data Only | 11 | 5.1% |
| Satellite Internet | 34 | 15.9% |
| No Internet | 44 | 20.6% |
| Total | 214 | 100.0% |
Prentice Summary
Prentice, Wisconsin is a small village located in Price County, Wisconsin. It is situated on the banks of the Jump River, and is surrounded by the Chequamegon National Forest. The village has a population of approximately 500 people, and is located about 30 miles northwest of Wausau.
Prentice was founded in 1883 by a group of settlers from the nearby town of Phillips. The settlers were looking for a place to settle and start a new life, and they chose the area around the Jump River. The village was named after the first settler, John Prentice.
The village of Prentice is located in a rural area of Wisconsin, and is surrounded by forests and lakes. The area is known for its outdoor recreation opportunities, including fishing, hunting, camping, and hiking. The village is also home to a number of small businesses, including a grocery store, a hardware store, and a few restaurants.
The economy of Prentice is largely based on agriculture and forestry. The village is home to several dairy farms, as well as a number of small logging operations. The village also has a number of small businesses, including a grocery store, a hardware store, and a few restaurants.
The demographics of Prentice are largely white, with a small percentage of African Americans and Native Americans. The median household income in Prentice is $37,000, and the median age is 44. The village has a high school, and the nearest college is the University of Wisconsin-Stevens Point.
Prentice is a small village with a rich history and a strong sense of community. The village is home to a number of small businesses, and the area is known for its outdoor recreation opportunities. The village is also home to a number of small farms and logging operations, and the economy is largely based on agriculture and forestry. The demographics of Prentice are largely white, with a small percentage of African Americans and Native Americans. The median household income in Prentice is $37,000, and the median age is 44. The village has a high school, and the nearest college is the University of Wisconsin-Stevens Point.
Common Questions
What is Per Capita Income in Prentice?
Per Capita income in Prentice is $30,443.
What is the Median Family Income in Prentice?
Median Family Income in Prentice is $63,125.
What is the Median Household income in Prentice?
Median Household Income in Prentice is $50,357.
What is Income or Wage Gap in Prentice?
Income or Wage Gap in Prentice is 36.2%.
Women in Prentice earn 63.8 cents for every dollar earned by a man.
What is Inequality or Gini Index in Prentice?
Inequality or Gini Index in Prentice is 0.45.
What is the Total Population of Prentice?
Total Population of Prentice is 465.
What is the Total Male Population of Prentice?
Total Male Population of Prentice is 222.
What is the Total Female Population of Prentice?
Total Female Population of Prentice is 243.
What is the Ratio of Males per 100 Females in Prentice?
There are 91.36 Males per 100 Females in Prentice.
What is the Ratio of Females per 100 Males in Prentice?
There are 109.46 Females per 100 Males in Prentice.
What is the Median Population Age in Prentice?
Median Population Age in Prentice is 45.6 Years.
What is the Average Family Size in Prentice
Average Family Size in Prentice is 2.8 People.
What is the Average Household Size in Prentice
Average Household Size in Prentice is 2.2 People.
How Large is the Labor Force in Prentice?
There are 207 People in the Labor Forcein in Prentice.
What is the Percentage of People in the Labor Force in Prentice?
53.9% of People are in the Labor Force in Prentice.
What is the Unemployment Rate in Prentice?
Unemployment Rate in Prentice is 2.9%.