Zip Codes with the Highest Percentage of Population with a Degree in Visual and Performing Arts in Corsicana, TX
RELATED REPORTS & OPTIONS
Visual and Performing Arts
Corsicana
Compare Zip Codes
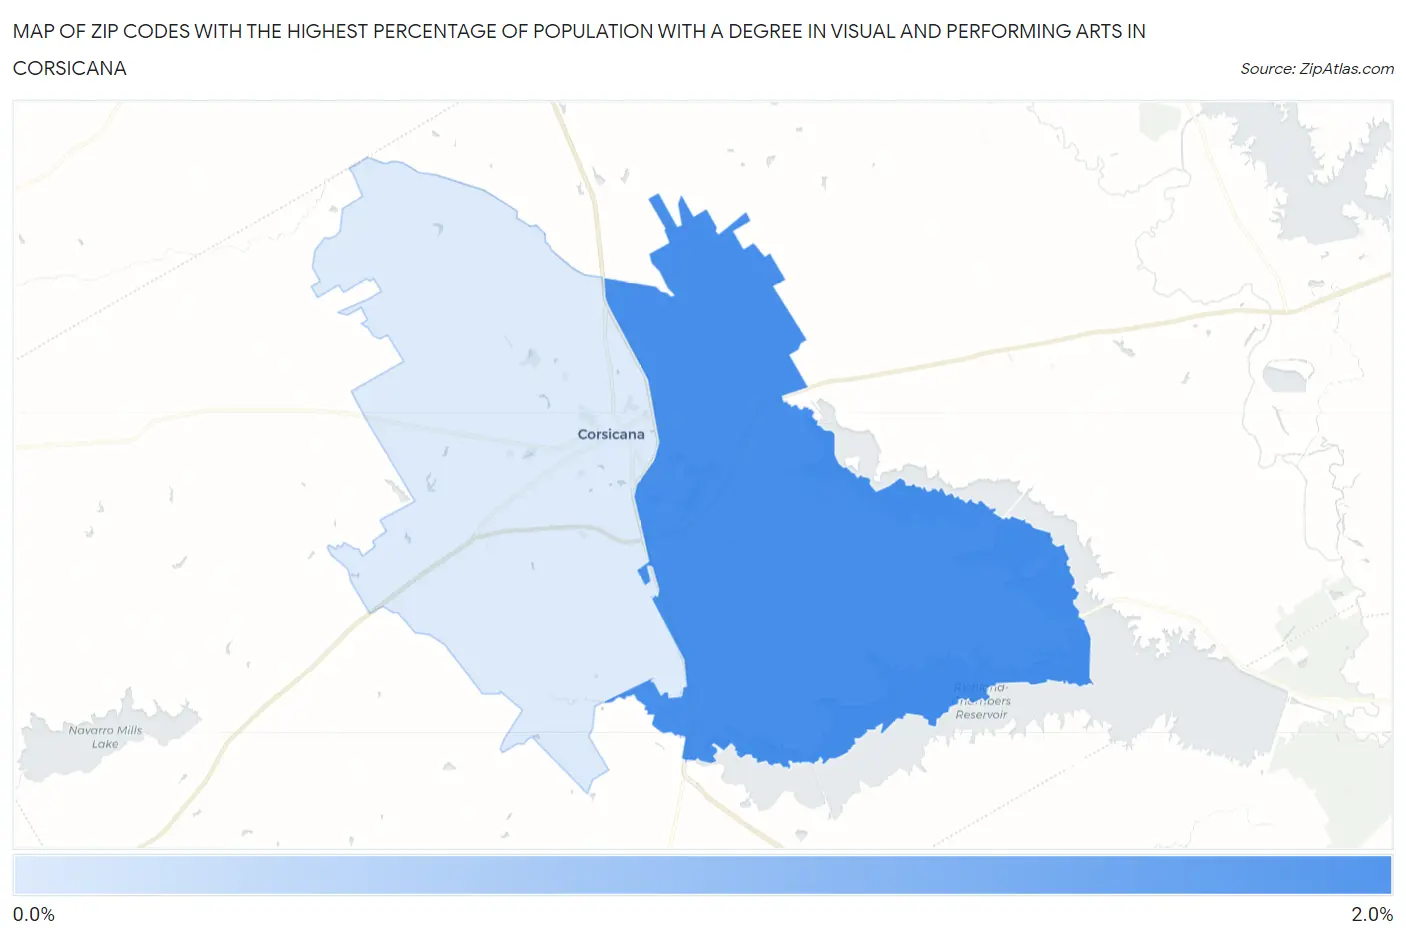
Map of Zip Codes with the Highest Percentage of Population with a Degree in Visual and Performing Arts in Corsicana
0.0%
2.0%
Zip Codes with the Highest Percentage of Population with a Degree in Visual and Performing Arts in Corsicana, TX
| Zip Code | % Graduates | vs State | vs National | |
| 1. | 75109 | 1.7% | 3.2%(-1.52)#949 | 4.3%(-2.57)#17,547 |
| 2. | 75110 | 0.88% | 3.2%(-2.33)#1,126 | 4.3%(-3.37)#19,982 |
1
Common Questions
What are the Top Zip Codes with the Highest Percentage of Population with a Degree in Visual and Performing Arts in Corsicana, TX?
Top Zip Codes with the Highest Percentage of Population with a Degree in Visual and Performing Arts in Corsicana, TX are:
What zip code has the Highest Percentage of Population with a Degree in Visual and Performing Arts in Corsicana, TX?
75109 has the Highest Percentage of Population with a Degree in Visual and Performing Arts in Corsicana, TX with 1.7%.
What is the Percentage of Population with a Degree in Visual and Performing Arts in Corsicana, TX?
Percentage of Population with a Degree in Visual and Performing Arts in Corsicana is 0.82%.
What is the Percentage of Population with a Degree in Visual and Performing Arts in Texas?
Percentage of Population with a Degree in Visual and Performing Arts in Texas is 3.2%.
What is the Percentage of Population with a Degree in Visual and Performing Arts in the United States?
Percentage of Population with a Degree in Visual and Performing Arts in the United States is 4.3%.