Zip Codes with the Highest Percentage of Population with a Degree in Visual and Performing Arts in Spring, TX
RELATED REPORTS & OPTIONS
Visual and Performing Arts
Spring
Compare Zip Codes
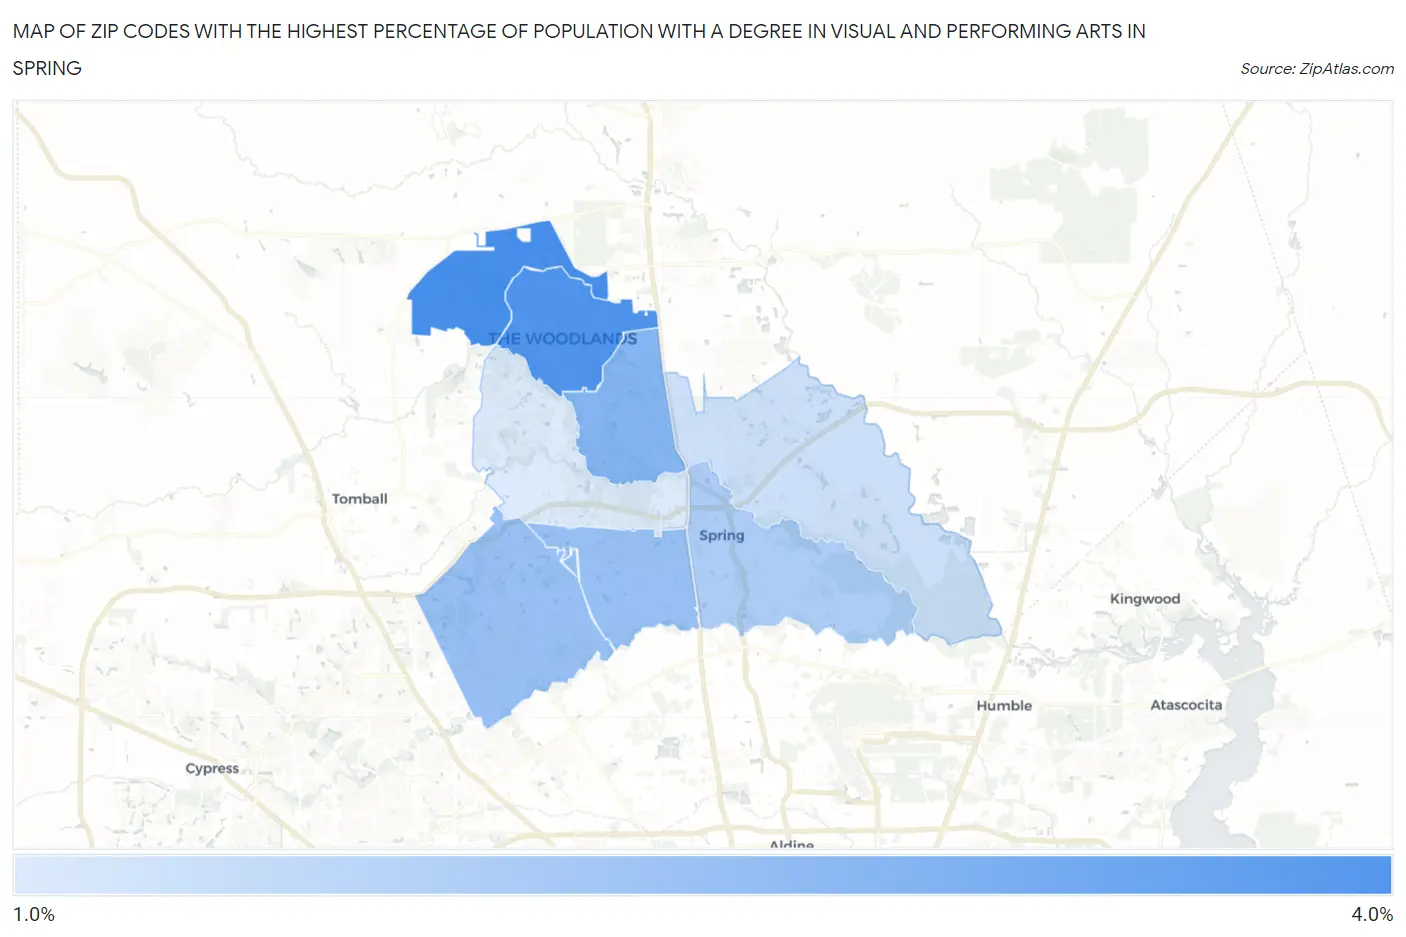
Map of Zip Codes with the Highest Percentage of Population with a Degree in Visual and Performing Arts in Spring
1.1%
3.2%
Zip Codes with the Highest Percentage of Population with a Degree in Visual and Performing Arts in Spring, TX
| Zip Code | % Graduates | vs State | vs National | |
| 1. | 77382 | 3.2% | 3.2%(-0.053)#566 | 4.3%(-1.10)#12,134 |
| 2. | 77381 | 3.0% | 3.2%(-0.176)#603 | 4.3%(-1.22)#12,620 |
| 3. | 77380 | 2.3% | 3.2%(-0.933)#786 | 4.3%(-1.98)#15,448 |
| 4. | 77379 | 2.0% | 3.2%(-1.17)#859 | 4.3%(-2.21)#16,313 |
| 5. | 77388 | 2.0% | 3.2%(-1.17)#863 | 4.3%(-2.22)#16,330 |
| 6. | 77373 | 1.8% | 3.2%(-1.46)#936 | 4.3%(-2.50)#17,311 |
| 7. | 77386 | 1.3% | 3.2%(-1.90)#1,042 | 4.3%(-2.94)#18,723 |
| 8. | 77389 | 1.1% | 3.2%(-2.13)#1,088 | 4.3%(-3.17)#19,451 |
1
Common Questions
What are the Top 5 Zip Codes with the Highest Percentage of Population with a Degree in Visual and Performing Arts in Spring, TX?
Top 5 Zip Codes with the Highest Percentage of Population with a Degree in Visual and Performing Arts in Spring, TX are:
What zip code has the Highest Percentage of Population with a Degree in Visual and Performing Arts in Spring, TX?
77382 has the Highest Percentage of Population with a Degree in Visual and Performing Arts in Spring, TX with 3.2%.
What is the Percentage of Population with a Degree in Visual and Performing Arts in Spring, TX?
Percentage of Population with a Degree in Visual and Performing Arts in Spring is 1.8%.
What is the Percentage of Population with a Degree in Visual and Performing Arts in Texas?
Percentage of Population with a Degree in Visual and Performing Arts in Texas is 3.2%.
What is the Percentage of Population with a Degree in Visual and Performing Arts in the United States?
Percentage of Population with a Degree in Visual and Performing Arts in the United States is 4.3%.