Immigrants from Burma/Myanmar vs Iroquois Receiving Food Stamps
COMPARE
Immigrants from Burma/Myanmar
Iroquois
Receiving Food Stamps
Receiving Food Stamps Comparison
Immigrants from Burma/Myanmar
Iroquois
12.9%
RECEIVING FOOD STAMPS
6.0/ 100
METRIC RATING
217th/ 347
METRIC RANK
13.5%
RECEIVING FOOD STAMPS
1.2/ 100
METRIC RATING
240th/ 347
METRIC RANK
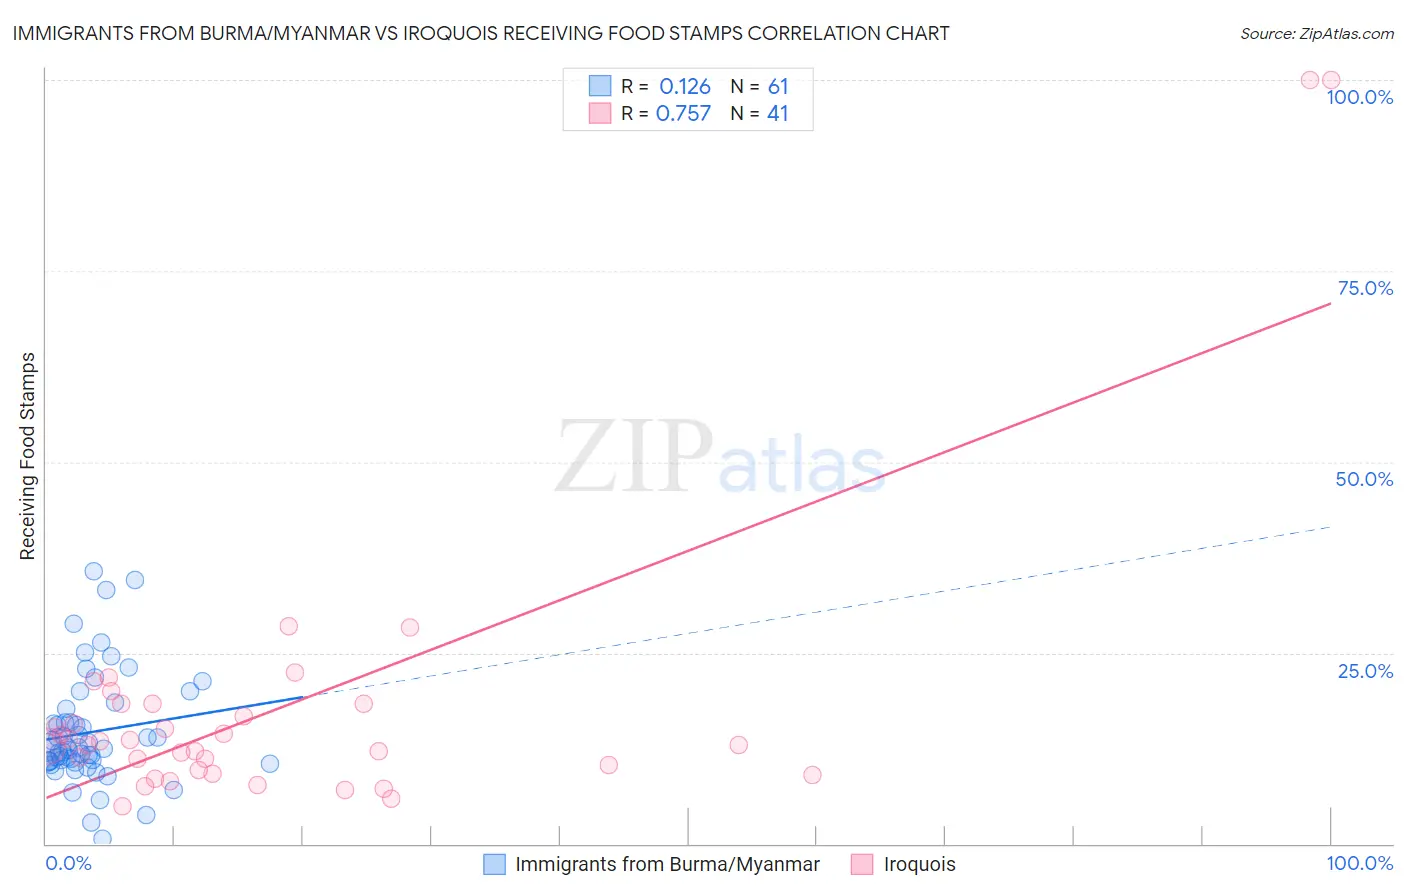
Immigrants from Burma/Myanmar vs Iroquois Receiving Food Stamps Correlation Chart
The statistical analysis conducted on geographies consisting of 172,104,421 people shows a poor positive correlation between the proportion of Immigrants from Burma/Myanmar and percentage of population receiving government assistance and/or food stamps in the United States with a correlation coefficient (R) of 0.126 and weighted average of 12.9%. Similarly, the statistical analysis conducted on geographies consisting of 207,071,964 people shows a strong positive correlation between the proportion of Iroquois and percentage of population receiving government assistance and/or food stamps in the United States with a correlation coefficient (R) of 0.757 and weighted average of 13.5%, a difference of 5.3%.
Receiving Food Stamps Correlation Summary
| Measurement | Immigrants from Burma/Myanmar | Iroquois |
| Minimum | 0.60% | 4.9% |
| Maximum | 35.6% | 100.0% |
| Range | 35.0% | 95.1% |
| Mean | 14.6% | 17.9% |
| Median | 12.5% | 13.0% |
| Interquartile 25% (IQ1) | 10.8% | 9.5% |
| Interquartile 75% (IQ3) | 16.7% | 18.4% |
| Interquartile Range (IQR) | 6.0% | 8.9% |
| Standard Deviation (Sample) | 7.2% | 19.6% |
| Standard Deviation (Population) | 7.1% | 19.4% |
Similar Demographics by Receiving Food Stamps
Demographics Similar to Immigrants from Burma/Myanmar by Receiving Food Stamps
In terms of receiving food stamps, the demographic groups most similar to Immigrants from Burma/Myanmar are Immigrants from South America (12.8%, a difference of 0.26%), Native Hawaiian (12.8%, a difference of 0.36%), Hawaiian (12.9%, a difference of 0.37%), Immigrants from Middle Africa (12.9%, a difference of 0.38%), and Immigrants from Colombia (12.9%, a difference of 0.41%).
| Demographics | Rating | Rank | Receiving Food Stamps |
| Immigrants | Uruguay | 12.8 /100 | #210 | Poor 12.5% |
| Colombians | 10.2 /100 | #211 | Poor 12.6% |
| Malaysians | 8.5 /100 | #212 | Tragic 12.7% |
| Moroccans | 7.6 /100 | #213 | Tragic 12.8% |
| Immigrants | Africa | 7.6 /100 | #214 | Tragic 12.8% |
| Native Hawaiians | 6.7 /100 | #215 | Tragic 12.8% |
| Immigrants | South America | 6.5 /100 | #216 | Tragic 12.8% |
| Immigrants | Burma/Myanmar | 6.0 /100 | #217 | Tragic 12.9% |
| Hawaiians | 5.4 /100 | #218 | Tragic 12.9% |
| Immigrants | Middle Africa | 5.4 /100 | #219 | Tragic 12.9% |
| Immigrants | Colombia | 5.3 /100 | #220 | Tragic 12.9% |
| Bermudans | 4.8 /100 | #221 | Tragic 13.0% |
| Immigrants | Immigrants | 4.4 /100 | #222 | Tragic 13.0% |
| Immigrants | Albania | 4.4 /100 | #223 | Tragic 13.0% |
| Immigrants | Armenia | 4.3 /100 | #224 | Tragic 13.0% |
Demographics Similar to Iroquois by Receiving Food Stamps
In terms of receiving food stamps, the demographic groups most similar to Iroquois are Immigrants from Micronesia (13.5%, a difference of 0.30%), Choctaw (13.6%, a difference of 0.43%), French American Indian (13.5%, a difference of 0.53%), Immigrants from Panama (13.6%, a difference of 0.62%), and Immigrants from El Salvador (13.5%, a difference of 0.72%).
| Demographics | Rating | Rank | Receiving Food Stamps |
| Cherokee | 2.5 /100 | #233 | Tragic 13.2% |
| Comanche | 2.4 /100 | #234 | Tragic 13.3% |
| Immigrants | Zaire | 1.9 /100 | #235 | Tragic 13.4% |
| Crow | 1.6 /100 | #236 | Tragic 13.4% |
| Immigrants | El Salvador | 1.5 /100 | #237 | Tragic 13.5% |
| French American Indians | 1.4 /100 | #238 | Tragic 13.5% |
| Immigrants | Micronesia | 1.3 /100 | #239 | Tragic 13.5% |
| Iroquois | 1.2 /100 | #240 | Tragic 13.5% |
| Choctaw | 1.0 /100 | #241 | Tragic 13.6% |
| Immigrants | Panama | 1.0 /100 | #242 | Tragic 13.6% |
| Somalis | 0.9 /100 | #243 | Tragic 13.7% |
| Cajuns | 0.9 /100 | #244 | Tragic 13.7% |
| Immigrants | Somalia | 0.9 /100 | #245 | Tragic 13.7% |
| Cree | 0.8 /100 | #246 | Tragic 13.7% |
| Mexican American Indians | 0.7 /100 | #247 | Tragic 13.8% |