Immigrants from Burma/Myanmar vs Jordanian Receiving Food Stamps

COMPARE

Immigrants from Burma/Myanmar
Race
Ancestry
AfghanAfricanAlaska NativeAlaskan AthabascanAlbanianAleutAlsatianAmericanApacheArabArapahoArgentineanArmenianAssyrian/Chaldean/SyriacAustralianAustrianBahamianBangladeshiBarbadianBasqueBelgianBelizeanBermudanBhutaneseBlackfeetBolivianBrazilianBritishBritish West IndianBulgarianBurmeseCajunCambodianCanadianCape VerdeanCarpatho RusynCelticCentral AmericanCentral American IndianCherokeeCheyenneChickasawChileanChineseChippewaChoctawColombianColvilleComancheCosta RicanCreeCreekCroatianCrowCubanCypriotCzechCzechoslovakianDanishDelawareDominicanDutchDutch West IndianEastern EuropeanEcuadorianEgyptianEnglishEstonianEthiopianEuropeanFijianFilipinoFinnishFrenchFrench American IndianFrench CanadianGermanGerman RussianGhanaianGreekGuamanian/ChamorroGuatemalanGuyaneseHaitianHmongHonduranHopiHoumaHungarianIcelanderIndian (Asian)IndonesianInupiatIranianIraqiIrishIroquoisIsraeliItalianJamaicanJapaneseKenyanKiowaKoreanLaotianLatvianLebaneseLiberianLithuanianLumbeeLuxembourgerMacedonianMalaysianMalteseMarshalleseMenomineeMexicanMexican American IndianMongolianMoroccanNative HawaiianNavajoNepaleseNew ZealanderNicaraguanNigerianNorthern EuropeanNorwegianOkinawanOsageOttawaPaiutePakistaniPalestinianPanamanianParaguayanPennsylvania GermanPeruvianPimaPolishPortuguesePotawatomiPuebloPuerto RicanPuget Sound SalishRomanianRussianSalvadoranSamoanScandinavianScotch-IrishScottishSeminoleSenegaleseSerbianShoshoneSierra LeoneanSiouxSlavicSlovakSloveneSomaliSouth AfricanSouth AmericanSouth American IndianSoviet UnionSpaniardSpanishSpanish AmericanSpanish American IndianSri LankanSubsaharan AfricanSudaneseSwedishSwissSyrianTaiwaneseThaiTlingit-HaidaTohono O'OdhamTonganTrinidadian and TobagonianTsimshianTurkishU.S. Virgin IslanderUgandanUkrainianUruguayanUteVenezuelanVietnameseWelshWest IndianYakamaYaquiYugoslavianYumanYup'ikZimbabwean
Immigration
NonimmigrantsImmigrantsAfghanistanAfricaAlbaniaArgentinaArmeniaAsiaAustraliaAustriaBahamasBangladeshBarbadosBelarusBelgiumBelizeBoliviaBosnia and HerzegovinaBrazilBulgariaBurma/MyanmarCabo VerdeCambodiaCameroonCanadaCaribbeanCentral AmericaChileChinaColombiaCongoCosta RicaCroatiaCubaCzechoslovakiaDenmarkDominicaDominican RepublicEastern AfricaEastern AsiaEastern EuropeEcuadorEgyptEl SalvadorEnglandEritreaEthiopiaEuropeFijiFranceGermanyGhanaGreeceGrenadaGuatemalaGuyanaHaitiHondurasHong KongHungaryIndiaIndonesiaIranIraqIrelandIsraelItalyJamaicaJapanJordanKazakhstanKenyaKoreaKuwaitLaosLatin AmericaLatviaLebanonLiberiaLithuaniaMalaysiaMexicoMicronesiaMiddle AfricaMoldovaMoroccoNepalNetherlandsNicaraguaNigeriaNorth AmericaNorth MacedoniaNorthern AfricaNorthern EuropeNorwayOceaniaPakistanPanamaPeruPhilippinesPolandPortugalRomaniaRussiaSaudi ArabiaScotlandSenegalSerbiaSierra LeoneSingaporeSomaliaSouth AfricaSouth AmericaSouth Central AsiaSouth Eastern AsiaSouthern EuropeSpainSri LankaSt. Vincent and the GrenadinesSudanSwedenSwitzerlandSyriaTaiwanThailandTrinidad and TobagoTurkeyUgandaUkraineUruguayUzbekistanVenezuelaVietnamWest IndiesWestern AfricaWestern AsiaWestern EuropeYemenZaireZimbabweAzores
Jordanian
Race
Ancestry
AfghanAfricanAlaska NativeAlaskan AthabascanAlbanianAleutAlsatianAmericanApacheArabArapahoArgentineanArmenianAssyrian/Chaldean/SyriacAustralianAustrianBahamianBangladeshiBarbadianBasqueBelgianBelizeanBermudanBhutaneseBlackfeetBolivianBrazilianBritishBritish West IndianBulgarianBurmeseCajunCambodianCanadianCape VerdeanCarpatho RusynCelticCentral AmericanCentral American IndianCherokeeCheyenneChickasawChileanChineseChippewaChoctawColombianColvilleComancheCosta RicanCreeCreekCroatianCrowCubanCypriotCzechCzechoslovakianDanishDelawareDominicanDutchDutch West IndianEastern EuropeanEcuadorianEgyptianEnglishEstonianEthiopianEuropeanFijianFilipinoFinnishFrenchFrench American IndianFrench CanadianGermanGerman RussianGhanaianGreekGuamanian/ChamorroGuatemalanGuyaneseHaitianHmongHonduranHopiHoumaHungarianIcelanderIndian (Asian)IndonesianInupiatIranianIraqiIrishIroquoisIsraeliItalianJamaicanJapaneseJordanianKenyanKiowaKoreanLaotianLatvianLebaneseLiberianLithuanianLumbeeLuxembourgerMacedonianMalaysianMalteseMarshalleseMenomineeMexicanMexican American IndianMongolianMoroccanNative HawaiianNavajoNepaleseNew ZealanderNicaraguanNigerianNorthern EuropeanNorwegianOkinawanOsageOttawaPaiutePakistaniPalestinianPanamanianParaguayanPennsylvania GermanPeruvianPimaPolishPortuguesePotawatomiPuebloPuerto RicanPuget Sound SalishRomanianRussianSalvadoranSamoanScandinavianScotch-IrishScottishSeminoleSenegaleseSerbianShoshoneSierra LeoneanSiouxSlavicSlovakSloveneSomaliSouth AfricanSouth AmericanSouth American IndianSoviet UnionSpaniardSpanishSpanish AmericanSpanish American IndianSri LankanSubsaharan AfricanSudaneseSwedishSwissSyrianTaiwaneseThaiTlingit-HaidaTohono O'OdhamTonganTrinidadian and TobagonianTsimshianTurkishU.S. Virgin IslanderUgandanUkrainianUruguayanUteVenezuelanVietnameseWelshWest IndianYakamaYaquiYugoslavianYumanYup'ikZimbabwean
Immigration
NonimmigrantsImmigrantsAfghanistanAfricaAlbaniaArgentinaArmeniaAsiaAustraliaAustriaBahamasBangladeshBarbadosBelarusBelgiumBelizeBoliviaBosnia and HerzegovinaBrazilBulgariaCabo VerdeCambodiaCameroonCanadaCaribbeanCentral AmericaChileChinaColombiaCongoCosta RicaCroatiaCubaCzechoslovakiaDenmarkDominicaDominican RepublicEastern AfricaEastern AsiaEastern EuropeEcuadorEgyptEl SalvadorEnglandEritreaEthiopiaEuropeFijiFranceGermanyGhanaGreeceGrenadaGuatemalaGuyanaHaitiHondurasHong KongHungaryIndiaIndonesiaIranIraqIrelandIsraelItalyJamaicaJapanJordanKazakhstanKenyaKoreaKuwaitLaosLatin AmericaLatviaLebanonLiberiaLithuaniaMalaysiaMexicoMicronesiaMiddle AfricaMoldovaMoroccoNepalNetherlandsNicaraguaNigeriaNorth AmericaNorth MacedoniaNorthern AfricaNorthern EuropeNorwayOceaniaPakistanPanamaPeruPhilippinesPolandPortugalRomaniaRussiaSaudi ArabiaScotlandSenegalSerbiaSierra LeoneSingaporeSomaliaSouth AfricaSouth AmericaSouth Central AsiaSouth Eastern AsiaSouthern EuropeSpainSri LankaSt. Vincent and the GrenadinesSudanSwedenSwitzerlandSyriaTaiwanThailandTrinidad and TobagoTurkeyUgandaUkraineUruguayUzbekistanVenezuelaVietnamWest IndiesWestern AfricaWestern AsiaWestern EuropeYemenZaireZimbabweAzores
Receiving Food Stamps
Income
Poverty
Unemployment
Labor Participation
Family Structure
Vehicle Availability
Education Level
Disability

Receiving Food Stamps Comparison

Immigrants from Burma/Myanmar

Jordanians

Tragic
Exceptional
12.9%
RECEIVING FOOD STAMPS
6.0/ 100
METRIC RATING
217th/ 347
METRIC RANK
10.2%
RECEIVING FOOD STAMPS
97.9/ 100
METRIC RATING
91st/ 347
METRIC RANK

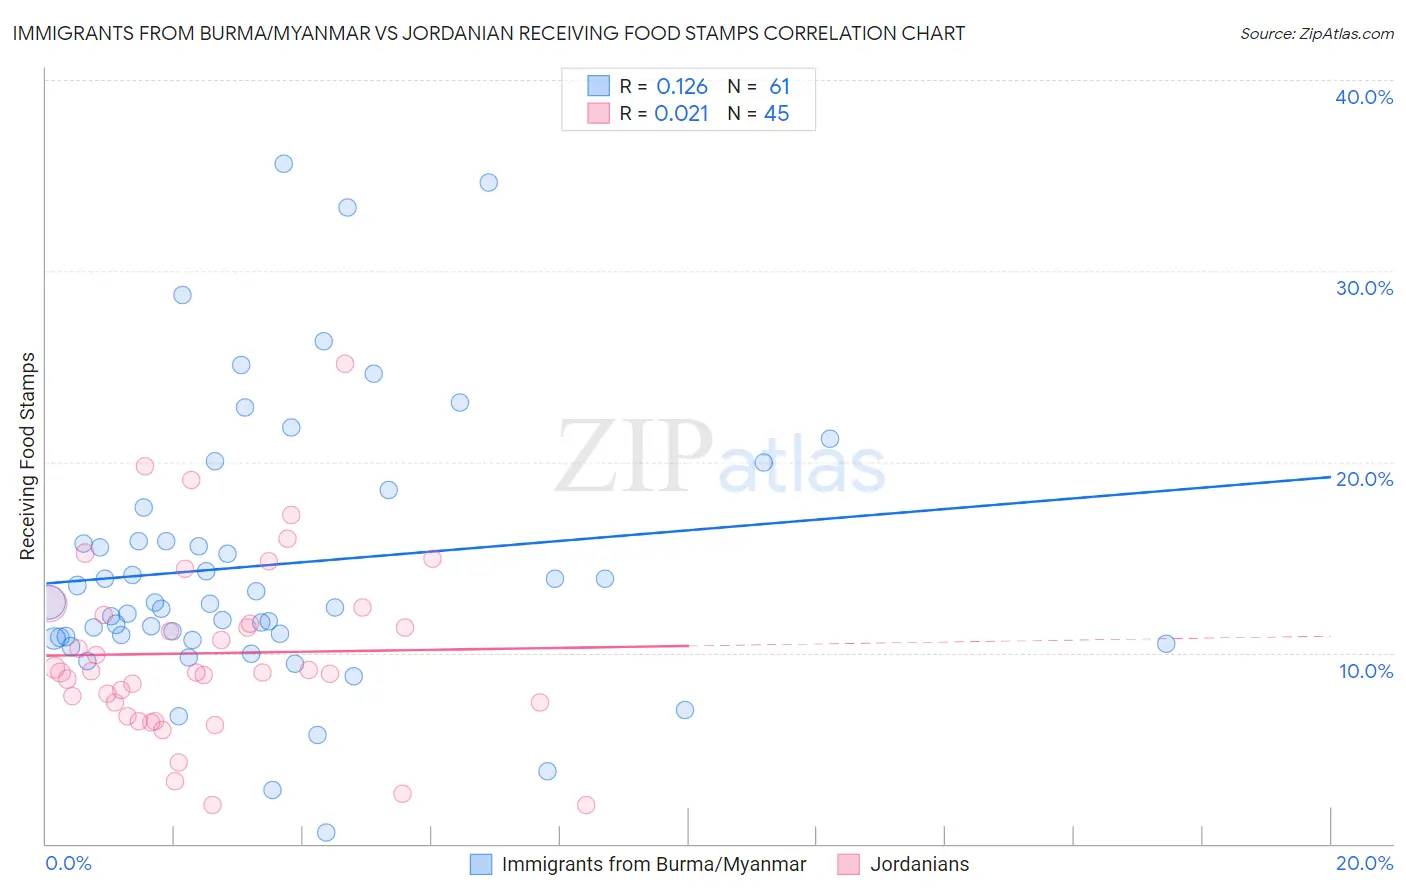
Immigrants from Burma/Myanmar vs Jordanian Receiving Food Stamps Correlation Chart

The statistical analysis conducted on geographies consisting of 172,104,421 people shows a poor positive correlation between the proportion of Immigrants from Burma/Myanmar and percentage of population receiving government assistance and/or food stamps in the United States with a correlation coefficient (R) of 0.126 and weighted average of 12.9%. Similarly, the statistical analysis conducted on geographies consisting of 166,269,073 people shows no correlation between the proportion of Jordanians and percentage of population receiving government assistance and/or food stamps in the United States with a correlation coefficient (R) of 0.021 and weighted average of 10.2%, a difference of 26.7%.
Immigrants from Burma/Myanmar vs Jordanian Receiving Food Stamps

Receiving Food Stamps Correlation Summary

MeasurementImmigrants from Burma/MyanmarJordanian
Minimum0.60%2.0%
Maximum35.6%25.2%
Range35.0%23.2%
Mean14.6%10.0%
Median12.5%9.0%
Interquartile 25% (IQ1)10.8%7.0%
Interquartile 75% (IQ3)16.7%12.2%
Interquartile Range (IQR)6.0%5.2%
Standard Deviation (Sample)7.2%4.8%
Standard Deviation (Population)7.1%4.7%

Similar Demographics by Receiving Food Stamps

Demographics Similar to Immigrants from Burma/Myanmar by Receiving Food Stamps

In terms of receiving food stamps, the demographic groups most similar to Immigrants from Burma/Myanmar are Immigrants from South America (12.8%, a difference of 0.26%), Native Hawaiian (12.8%, a difference of 0.36%), Hawaiian (12.9%, a difference of 0.37%), Immigrants from Middle Africa (12.9%, a difference of 0.38%), and Immigrants from Colombia (12.9%, a difference of 0.41%).
DemographicsRating | RankReceiving Food Stamps
Immigrants | Uruguay
12.8
/100
|
#210
Poor
12.5%
Colombians
10.2
/100
|
#211
Poor
12.6%
Malaysians
8.5
/100
|
#212
Tragic
12.7%
Moroccans
7.6
/100
|
#213
Tragic
12.8%
Immigrants | Africa
7.6
/100
|
#214
Tragic
12.8%
Native Hawaiians
6.7
/100
|
#215
Tragic
12.8%
Immigrants | South America
6.5
/100
|
#216
Tragic
12.8%
Immigrants | Burma/Myanmar
6.0
/100
|
#217
Tragic
12.9%
Hawaiians
5.4
/100
|
#218
Tragic
12.9%
Immigrants | Middle Africa
5.4
/100
|
#219
Tragic
12.9%
Immigrants | Colombia
5.3
/100
|
#220
Tragic
12.9%
Bermudans
4.8
/100
|
#221
Tragic
13.0%
Immigrants | Immigrants
4.4
/100
|
#222
Tragic
13.0%
Immigrants | Albania
4.4
/100
|
#223
Tragic
13.0%
Immigrants | Armenia
4.3
/100
|
#224
Tragic
13.0%

Demographics Similar to Jordanians by Receiving Food Stamps

In terms of receiving food stamps, the demographic groups most similar to Jordanians are Irish (10.2%, a difference of 0.0%), Finnish (10.2%, a difference of 0.040%), Belgian (10.2%, a difference of 0.39%), Immigrants from France (10.1%, a difference of 0.89%), and Immigrants from Greece (10.3%, a difference of 0.91%).
DemographicsRating | RankReceiving Food Stamps
Immigrants | Israel
98.5
/100
|
#84
Exceptional
10.0%
Immigrants | Romania
98.5
/100
|
#85
Exceptional
10.0%
Immigrants | Norway
98.4
/100
|
#86
Exceptional
10.0%
Egyptians
98.4
/100
|
#87
Exceptional
10.0%
Immigrants | Kuwait
98.4
/100
|
#88
Exceptional
10.0%
Immigrants | France
98.3
/100
|
#89
Exceptional
10.1%
Finns
97.9
/100
|
#90
Exceptional
10.2%
Jordanians
97.9
/100
|
#91
Exceptional
10.2%
Irish
97.9
/100
|
#92
Exceptional
10.2%
Belgians
97.7
/100
|
#93
Exceptional
10.2%
Immigrants | Greece
97.4
/100
|
#94
Exceptional
10.3%
Basques
97.4
/100
|
#95
Exceptional
10.3%
Welsh
97.3
/100
|
#96
Exceptional
10.3%
Czechoslovakians
97.2
/100
|
#97
Exceptional
10.3%
Immigrants | Egypt
97.1
/100
|
#98
Exceptional
10.3%