Zip Codes with the Highest Percentage of Population Employed in Legal Services & Support in Bethlehem, PA

RELATED REPORTS & OPTIONS

Legal Services & Support
Population
Families and Households
Female Fertility
Female Fertility (Unmarried)
Race (Community Size)
Race (Percentage)
Ancestry (Community Size)
AfghanAfricanAlbanianAmericanArabArgentineanAustrianBelgianBhutaneseBlackfeetBrazilianBritishBritish West IndianBulgarianBurmeseCanadianCentral AmericanCentral American IndianCherokeeChileanColombianCosta RicanCroatianCubanCzechCzechoslovakianDanishDominicanDutchEastern EuropeanEcuadorianEgyptianEnglishEuropeanFilipinoFinnishFrenchFrench CanadianGermanGreekGuatemalanGuyaneseHaitianHonduranHungarianIndian (Asian)IranianIrishIroquoisIsraeliItalianJamaicanKoreanLebaneseLiberianLithuanianMexicanMexican American IndianNative HawaiianNew ZealanderNicaraguanNigerianNorthern EuropeanNorwegianPanamanianPennsylvania GermanPeruvianPolishPortuguesePuerto RicanRomanianRussianSalvadoranScandinavianScotch-IrishScottishSerbianSlavicSlovakSloveneSouth AmericanSpaniardSpanishSri LankanSubsaharan AfricanSwedishSwissSyrianThaiTurkishUgandanUkrainianUruguayanVenezuelanWelshWest IndianYugoslavian
Ancestry (Percentage)
AfghanAfricanAlbanianAmericanArabArgentineanAustrianBelgianBhutaneseBlackfeetBrazilianBritishBritish West IndianBulgarianBurmeseCanadianCentral AmericanCentral American IndianCherokeeChileanColombianCosta RicanCroatianCubanCzechCzechoslovakianDanishDominicanDutchEastern EuropeanEcuadorianEgyptianEnglishEuropeanFilipinoFinnishFrenchFrench CanadianGermanGreekGuatemalanGuyaneseHaitianHonduranHungarianIndian (Asian)IranianIrishIroquoisIsraeliItalianJamaicanKoreanLebaneseLiberianLithuanianMexicanMexican American IndianNative HawaiianNew ZealanderNicaraguanNigerianNorthern EuropeanNorwegianPanamanianPennsylvania GermanPeruvianPolishPortuguesePuerto RicanRomanianRussianSalvadoranScandinavianScotch-IrishScottishSerbianSlavicSlovakSloveneSouth AmericanSpaniardSpanishSri LankanSubsaharan AfricanSwedishSwissSyrianThaiTurkishUgandanUkrainianUruguayanVenezuelanWelshWest IndianYugoslavian
Immigrant Origin (Total)
Immigrant Origin (Percentage)
Income
Income (Families)
Income (Households)
Poverty
Poverty (Families)
Unemployment
Employment Occupations
Employment Industries
Employer Class
Commute Time
Commute Means
School Enrollment
Education by Degree Field
Occupancy
Finances
Physical Characteristics
Bethlehem
Compare Zip Codes
Comparison Subject

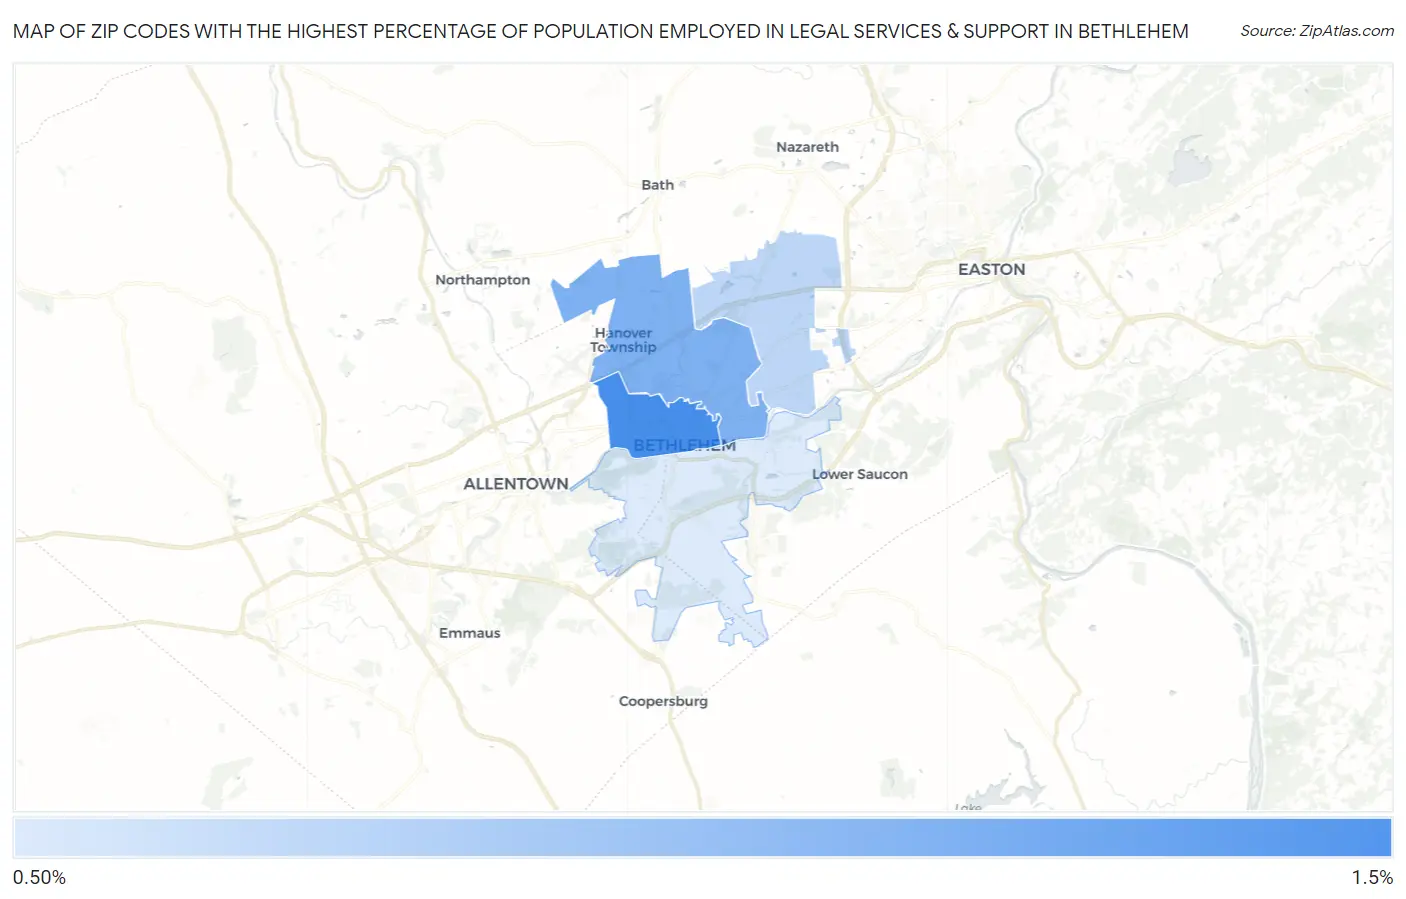
Map of Zip Codes with the Highest Percentage of Population Employed in Legal Services & Support in Bethlehem

0.0%
1.5%
Zip Codes with the Highest Percentage of Population Employed in Legal Services & Support in Bethlehem Map

Zip Codes with the Highest Percentage of Population Employed in Legal Services & Support in Bethlehem, PA

Zip Code % Employed vs State vs National
1.180181.4%1.1%(+0.250)#2461.2%(+0.214)#5,493
2.180171.1%1.1%(-0.060)#3321.2%(-0.096)#7,253
3.180200.75%1.1%(-0.393)#4751.2%(-0.429)#9,876
4.180150.58%1.1%(-0.572)#5701.2%(-0.608)#11,752

Common Questions

What are the Top 3 Zip Codes with the Highest Percentage of Population Employed in Legal Services & Support in Bethlehem, PA?
Top 3 Zip Codes with the Highest Percentage of Population Employed in Legal Services & Support in Bethlehem, PA are:
#1
1.4%
#2
1.1%
#3
0.75%
What zip code has the Highest Percentage of Population Employed in Legal Services & Support in Bethlehem, PA?
18018 has the Highest Percentage of Population Employed in Legal Services & Support in Bethlehem, PA with 1.4%.
What is the Percentage of Population Employed in Legal Services & Support in Bethlehem, PA?
Percentage of Population Employed in Legal Services & Support in Bethlehem is 1.0%.
What is the Percentage of Population Employed in Legal Services & Support in Pennsylvania?
Percentage of Population Employed in Legal Services & Support in Pennsylvania is 1.1%.
What is the Percentage of Population Employed in Legal Services & Support in the United States?
Percentage of Population Employed in Legal Services & Support in the United States is 1.2%.