Zip Codes with the Highest Percentage of Population Employed in Legal Services & Support in Williamsport, PA
RELATED REPORTS & OPTIONS
Legal Services & Support
Williamsport
Compare Zip Codes
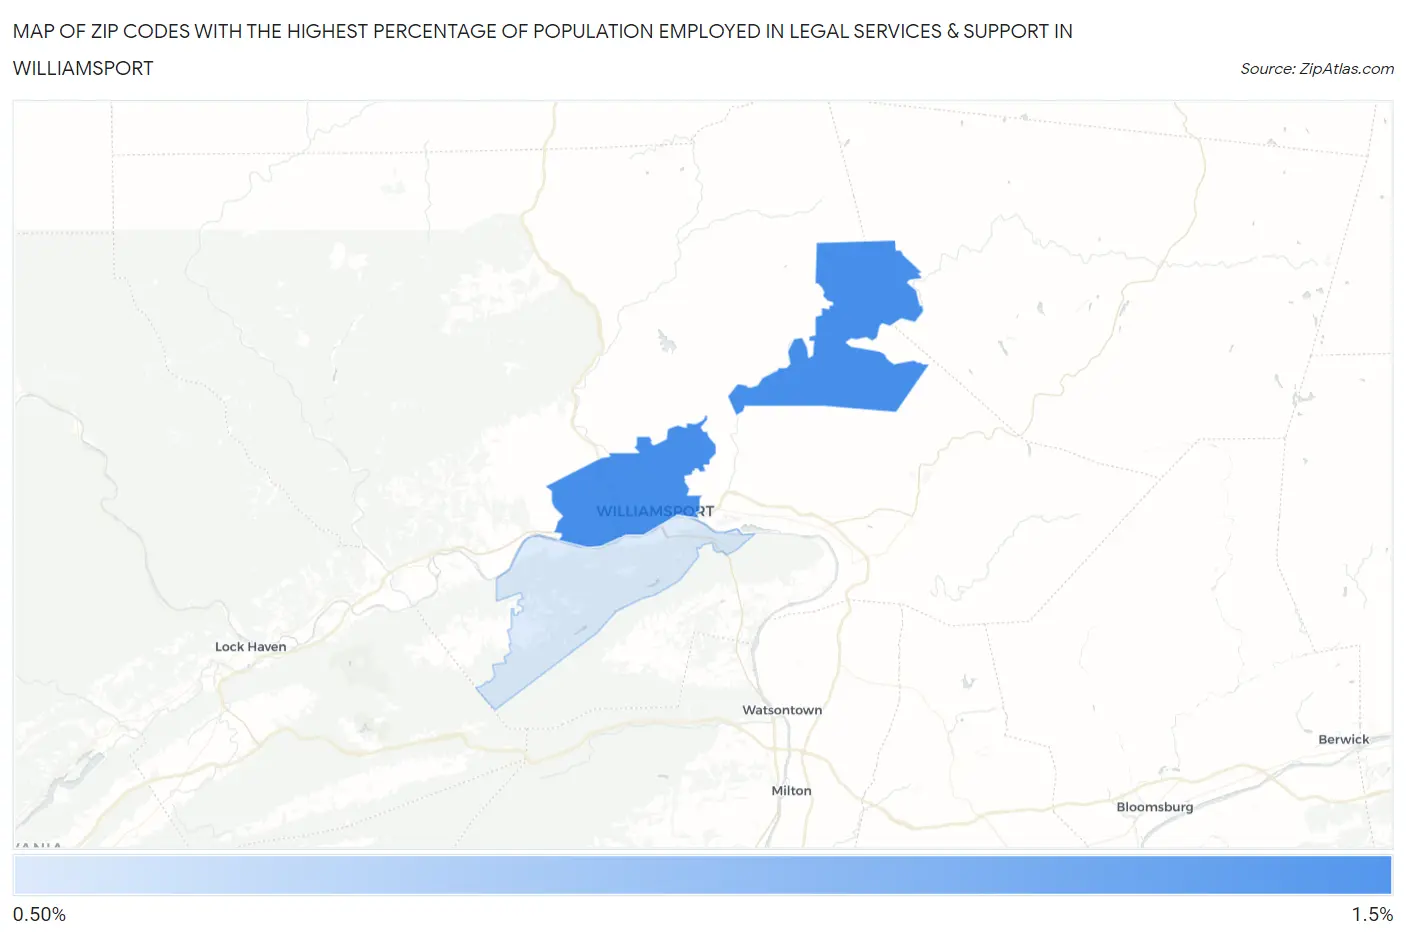
Map of Zip Codes with the Highest Percentage of Population Employed in Legal Services & Support in Williamsport
0.73%
1.1%
Zip Codes with the Highest Percentage of Population Employed in Legal Services & Support in Williamsport, PA
| Zip Code | % Employed | vs State | vs National | |
| 1. | 17701 | 1.1% | 1.1%(-0.041)#326 | 1.2%(-0.078)#7,124 |
| 2. | 17702 | 0.73% | 1.1%(-0.413)#491 | 1.2%(-0.450)#10,073 |
1
Common Questions
What are the Top Zip Codes with the Highest Percentage of Population Employed in Legal Services & Support in Williamsport, PA?
Top Zip Codes with the Highest Percentage of Population Employed in Legal Services & Support in Williamsport, PA are:
What zip code has the Highest Percentage of Population Employed in Legal Services & Support in Williamsport, PA?
17701 has the Highest Percentage of Population Employed in Legal Services & Support in Williamsport, PA with 1.1%.
What is the Percentage of Population Employed in Legal Services & Support in Williamsport, PA?
Percentage of Population Employed in Legal Services & Support in Williamsport is 1.5%.
What is the Percentage of Population Employed in Legal Services & Support in Pennsylvania?
Percentage of Population Employed in Legal Services & Support in Pennsylvania is 1.1%.
What is the Percentage of Population Employed in Legal Services & Support in the United States?
Percentage of Population Employed in Legal Services & Support in the United States is 1.2%.