Boiling Springs, PA Map & Demographics
Boiling Springs Map
Boiling Springs Overview
$44,482
PER CAPITA INCOME
$140,051
AVG FAMILY INCOME
$100,000
AVG HOUSEHOLD INCOME
41.9%
WAGE / INCOME GAP [ % ]
58.1¢/ $1
WAGE / INCOME GAP [ $ ]
0.38
INEQUALITY / GINI INDEX
3,584
TOTAL POPULATION
1,846
MALE POPULATION
1,738
FEMALE POPULATION
106.21
MALES / 100 FEMALES
94.15
FEMALES / 100 MALES
44.7
MEDIAN AGE
3.2
AVG FAMILY SIZE
2.8
AVG HOUSEHOLD SIZE
1,850
LABOR FORCE [ PEOPLE ]
66.0%
PERCENT IN LABOR FORCE
3.1%
UNEMPLOYMENT RATE
Boiling Springs Zip Codes
Boiling Springs Area Codes
Income in Boiling Springs
Income Overview in Boiling Springs
Per Capita Income in Boiling Springs is $44,482, while median incomes of families and households are $140,051 and $100,000 respectively.
| Characteristic | Number | Measure |
| Per Capita Income | 3,584 | $44,482 |
| Median Family Income | 974 | $140,051 |
| Mean Family Income | 974 | $142,349 |
| Median Household Income | 1,290 | $100,000 |
| Mean Household Income | 1,290 | $121,883 |
| Income Deficit | 974 | $0 |
| Wage / Income Gap (%) | 3,584 | 41.92% |
| Wage / Income Gap ($) | 3,584 | 58.08¢ per $1 |
| Gini / Inequality Index | 3,584 | 0.38 |
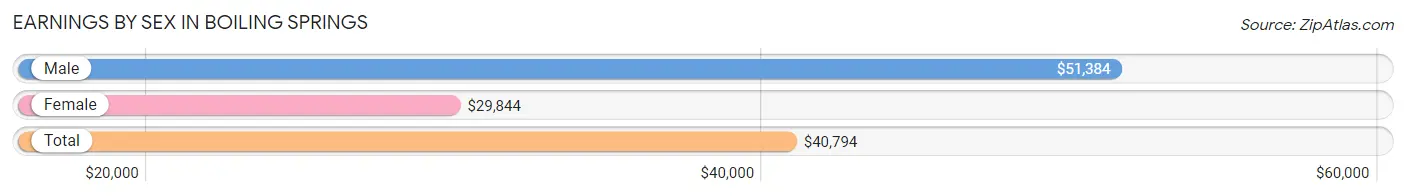
Earnings by Sex in Boiling Springs
Average Earnings in Boiling Springs are $40,794, $51,384 for men and $29,844 for women, a difference of 41.9%.
| Sex | Number | Average Earnings |
| Male | 920 (45.0%) | $51,384 |
| Female | 1,124 (55.0%) | $29,844 |
| Total | 2,044 (100.0%) | $40,794 |
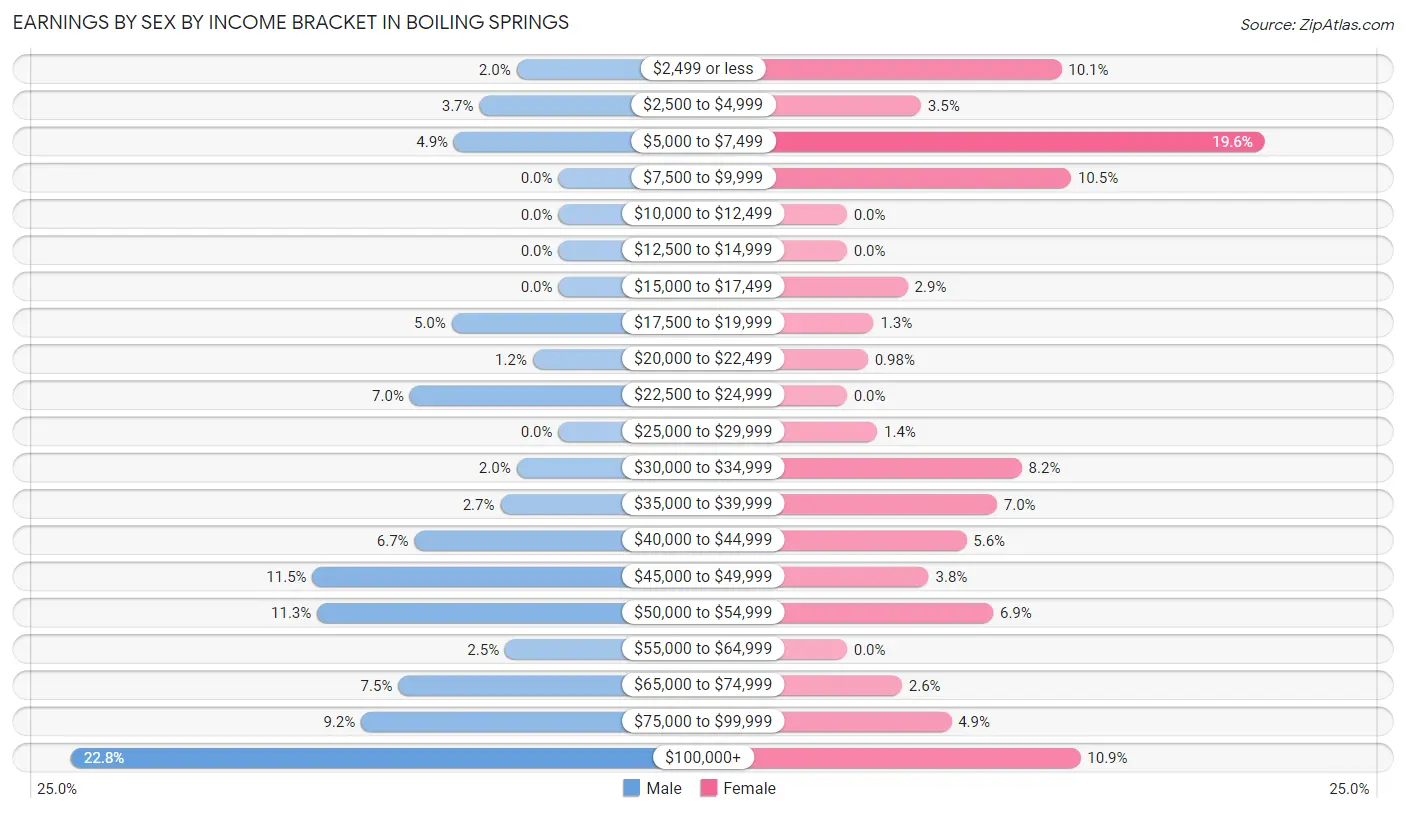
Earnings by Sex by Income Bracket in Boiling Springs
The most common earnings brackets in Boiling Springs are $100,000+ for men (210 | 22.8%) and $5,000 to $7,499 for women (220 | 19.6%).
| Income | Male | Female |
| $2,499 or less | 18 (2.0%) | 113 (10.1%) |
| $2,500 to $4,999 | 34 (3.7%) | 39 (3.5%) |
| $5,000 to $7,499 | 45 (4.9%) | 220 (19.6%) |
| $7,500 to $9,999 | 0 (0.0%) | 118 (10.5%) |
| $10,000 to $12,499 | 0 (0.0%) | 0 (0.0%) |
| $12,500 to $14,999 | 0 (0.0%) | 0 (0.0%) |
| $15,000 to $17,499 | 0 (0.0%) | 32 (2.9%) |
| $17,500 to $19,999 | 46 (5.0%) | 14 (1.3%) |
| $20,000 to $22,499 | 11 (1.2%) | 11 (1.0%) |
| $22,500 to $24,999 | 64 (7.0%) | 0 (0.0%) |
| $25,000 to $29,999 | 0 (0.0%) | 16 (1.4%) |
| $30,000 to $34,999 | 18 (2.0%) | 92 (8.2%) |
| $35,000 to $39,999 | 25 (2.7%) | 79 (7.0%) |
| $40,000 to $44,999 | 62 (6.7%) | 63 (5.6%) |
| $45,000 to $49,999 | 106 (11.5%) | 43 (3.8%) |
| $50,000 to $54,999 | 104 (11.3%) | 77 (6.9%) |
| $55,000 to $64,999 | 23 (2.5%) | 0 (0.0%) |
| $65,000 to $74,999 | 69 (7.5%) | 29 (2.6%) |
| $75,000 to $99,999 | 85 (9.2%) | 55 (4.9%) |
| $100,000+ | 210 (22.8%) | 123 (10.9%) |
| Total | 920 (100.0%) | 1,124 (100.0%) |
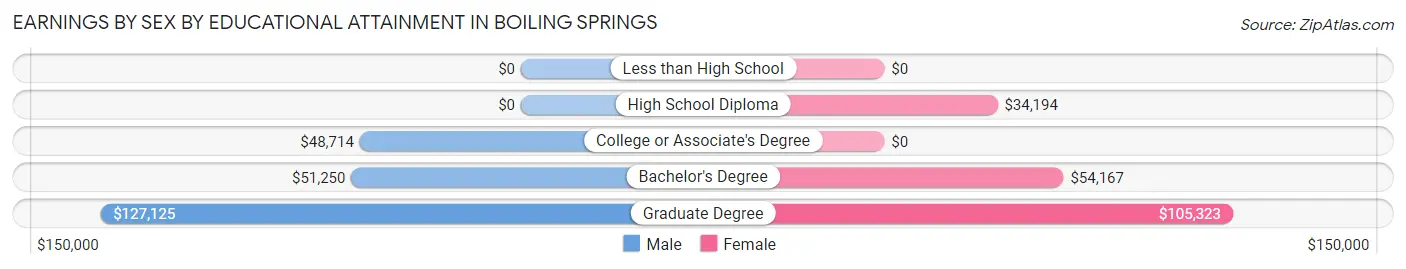
Earnings by Sex by Educational Attainment in Boiling Springs
Average earnings in Boiling Springs are $52,552 for men and $40,489 for women, a difference of 23.0%. Men with an educational attainment of graduate degree enjoy the highest average annual earnings of $127,125, while those with college or associate's degree education earn the least with $48,714. Women with an educational attainment of graduate degree earn the most with the average annual earnings of $105,323, while those with high school diploma education have the smallest earnings of $34,194.
| Educational Attainment | Male Income | Female Income |
| Less than High School | - | - |
| High School Diploma | - | - |
| College or Associate's Degree | $48,714 | $0 |
| Bachelor's Degree | $51,250 | $54,167 |
| Graduate Degree | $127,125 | $105,323 |
| Total | $52,552 | $40,489 |
Family Income in Boiling Springs
Family Income Brackets in Boiling Springs
According to the Boiling Springs family income data, there are 239 families falling into the $150,000 to $199,999 income range, which is the most common income bracket and makes up 24.5% of all families.
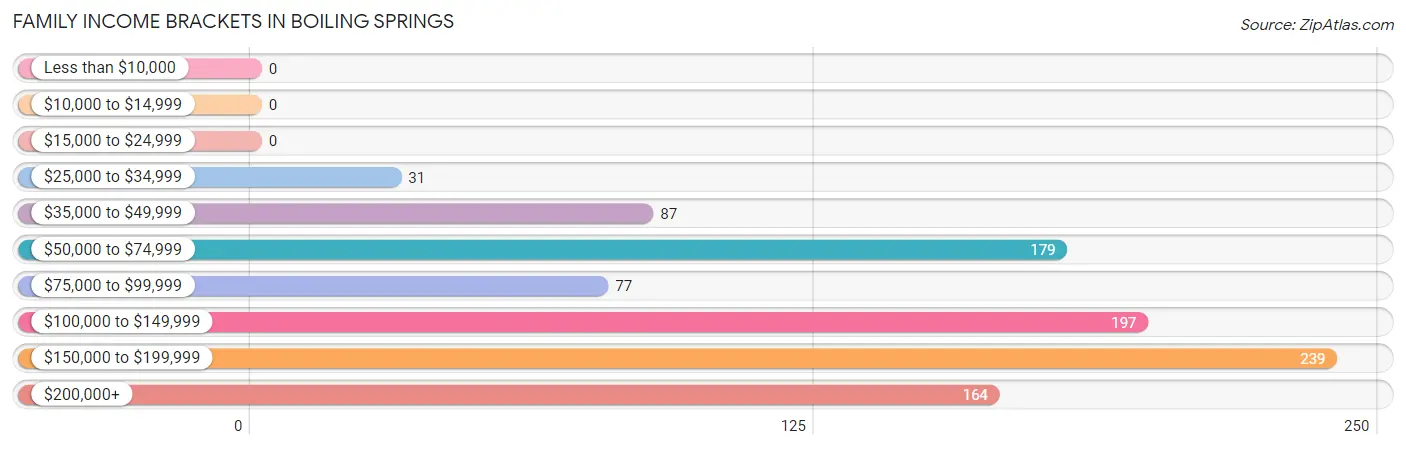
| Income Bracket | # Families | % Families |
| Less than $10,000 | 0 | 0.0% |
| $10,000 to $14,999 | 0 | 0.0% |
| $15,000 to $24,999 | 0 | 0.0% |
| $25,000 to $34,999 | 31 | 3.2% |
| $35,000 to $49,999 | 87 | 8.9% |
| $50,000 to $74,999 | 179 | 18.4% |
| $75,000 to $99,999 | 77 | 7.9% |
| $100,000 to $149,999 | 197 | 20.2% |
| $150,000 to $199,999 | 239 | 24.5% |
| $200,000+ | 164 | 16.8% |
Family Income by Famaliy Size in Boiling Springs
6-person families (35 | 3.6%) account for the highest median family income in Boiling Springs with $250,001 per family, while 4-person families (140 | 14.4%) have the highest median income of $49,596 per family member.
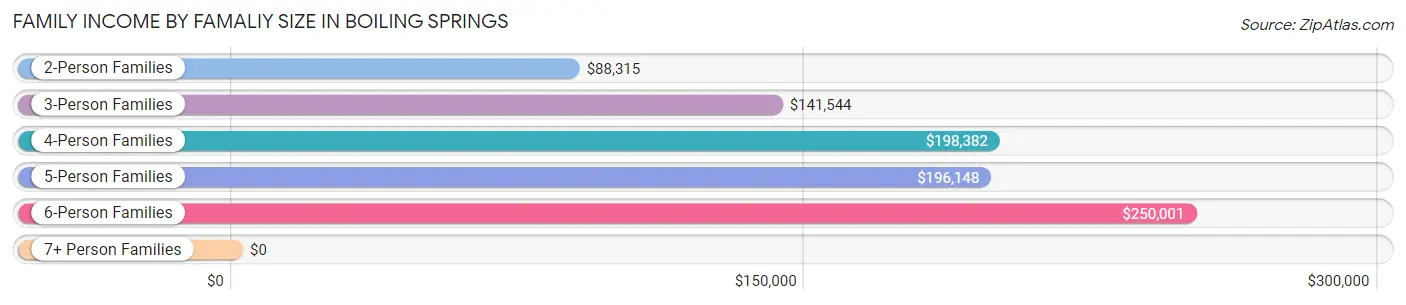
| Income Bracket | # Families | Median Income |
| 2-Person Families | 427 (43.8%) | $88,315 |
| 3-Person Families | 263 (27.0%) | $141,544 |
| 4-Person Families | 140 (14.4%) | $198,382 |
| 5-Person Families | 109 (11.2%) | $196,148 |
| 6-Person Families | 35 (3.6%) | $250,001 |
| 7+ Person Families | 0 (0.0%) | $0 |
| Total | 974 (100.0%) | $140,051 |
Family Income by Number of Earners in Boiling Springs
The median family income in Boiling Springs is $140,051, with families comprising 3+ earners (139) having the highest median family income of $230,260, while families with 1 earner (265) have the lowest median family income of $54,514, accounting for 14.3% and 27.2% of families, respectively.
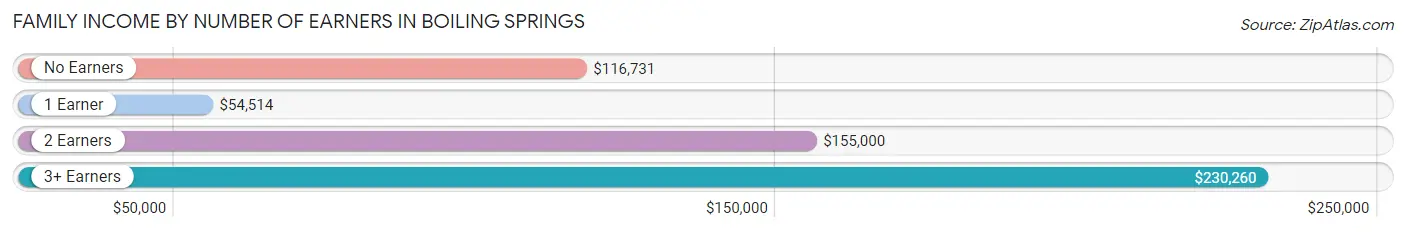
| Number of Earners | # Families | Median Income |
| No Earners | 128 (13.1%) | $116,731 |
| 1 Earner | 265 (27.2%) | $54,514 |
| 2 Earners | 442 (45.4%) | $155,000 |
| 3+ Earners | 139 (14.3%) | $230,260 |
| Total | 974 (100.0%) | $140,051 |
Household Income in Boiling Springs
Household Income Brackets in Boiling Springs
With 244 households falling in the category, the $50,000 to $74,999 income range is the most frequent in Boiling Springs, accounting for 18.9% of all households.
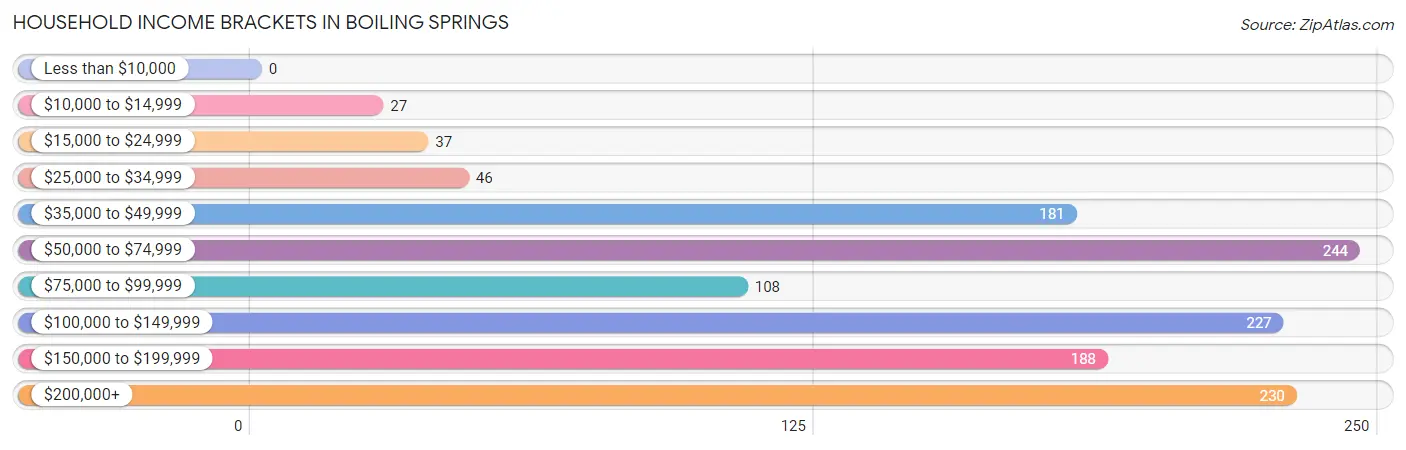
| Income Bracket | # Households | % Households |
| Less than $10,000 | 0 | 0.0% |
| $10,000 to $14,999 | 27 | 2.1% |
| $15,000 to $24,999 | 37 | 2.9% |
| $25,000 to $34,999 | 46 | 3.6% |
| $35,000 to $49,999 | 181 | 14.0% |
| $50,000 to $74,999 | 244 | 18.9% |
| $75,000 to $99,999 | 108 | 8.4% |
| $100,000 to $149,999 | 227 | 17.6% |
| $150,000 to $199,999 | 188 | 14.6% |
| $200,000+ | 230 | 17.8% |
Household Income by Householder Age in Boiling Springs
The median household income in Boiling Springs is $100,000, with the highest median household income of $117,500 found in the 45 to 64 years age bracket for the primary householder. A total of 586 households (45.4%) fall into this category.
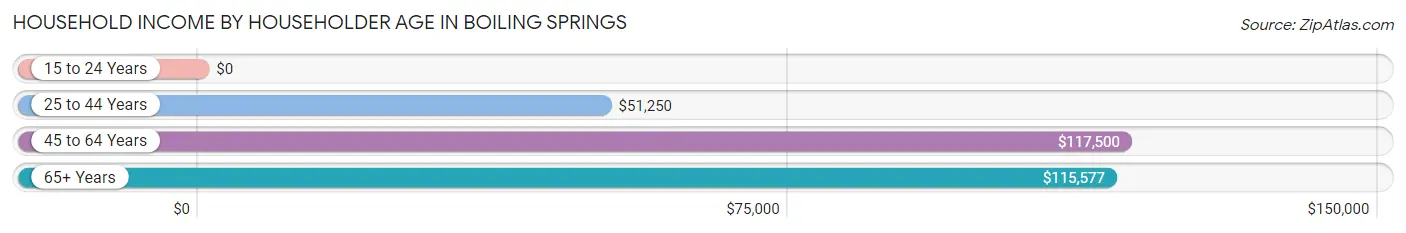
| Income Bracket | # Households | Median Income |
| 15 to 24 Years | 0 (0.0%) | $0 |
| 25 to 44 Years | 316 (24.5%) | $51,250 |
| 45 to 64 Years | 586 (45.4%) | $117,500 |
| 65+ Years | 388 (30.1%) | $115,577 |
| Total | 1,290 (100.0%) | $100,000 |
Poverty in Boiling Springs
Income Below Poverty by Sex and Age in Boiling Springs
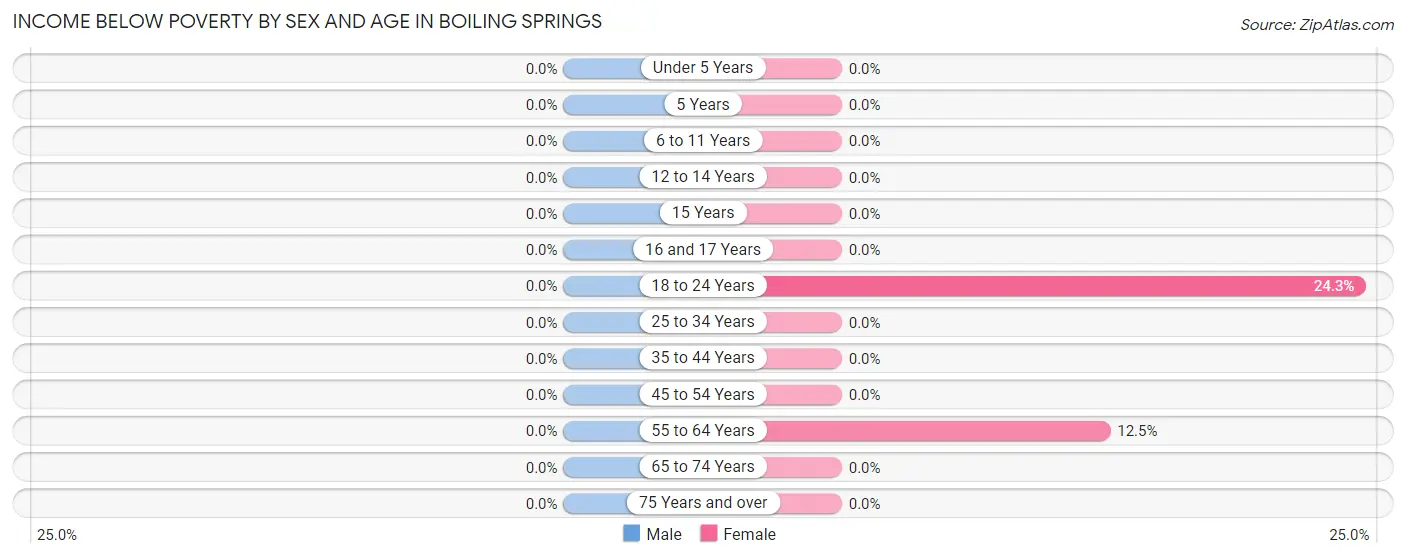
| Age Bracket | Male | Female |
| Under 5 Years | 0 (0.0%) | 0 (0.0%) |
| 5 Years | 0 (0.0%) | 0 (0.0%) |
| 6 to 11 Years | 0 (0.0%) | 0 (0.0%) |
| 12 to 14 Years | 0 (0.0%) | 0 (0.0%) |
| 15 Years | 0 (0.0%) | 0 (0.0%) |
| 16 and 17 Years | 0 (0.0%) | 0 (0.0%) |
| 18 to 24 Years | 0 (0.0%) | 73 (24.3%) |
| 25 to 34 Years | 0 (0.0%) | 0 (0.0%) |
| 35 to 44 Years | 0 (0.0%) | 0 (0.0%) |
| 45 to 54 Years | 0 (0.0%) | 0 (0.0%) |
| 55 to 64 Years | 0 (0.0%) | 40 (12.5%) |
| 65 to 74 Years | 0 (0.0%) | 0 (0.0%) |
| 75 Years and over | 0 (0.0%) | 0 (0.0%) |
| Total | 0 (0.0%) | 113 (6.5%) |
Income Above Poverty by Sex and Age in Boiling Springs
According to the poverty statistics in Boiling Springs, males aged under 5 years and females aged under 5 years are the age groups that are most secure financially, with 100.0% of males and 100.0% of females in these age groups living above the poverty line.
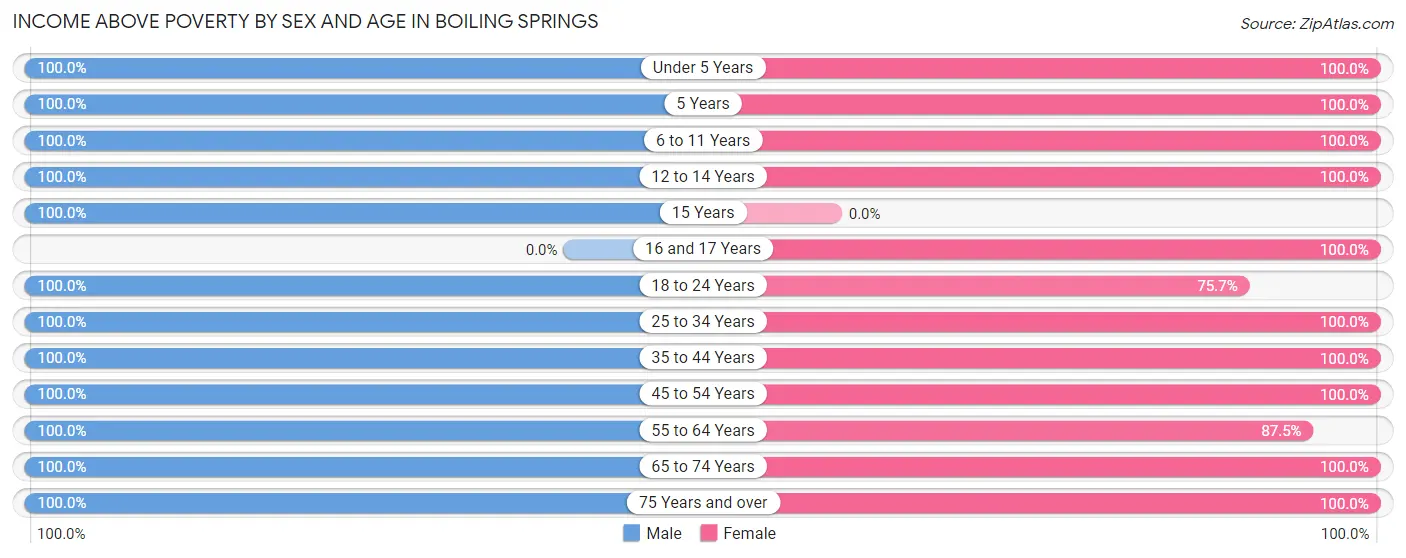
| Age Bracket | Male | Female |
| Under 5 Years | 113 (100.0%) | 32 (100.0%) |
| 5 Years | 6 (100.0%) | 26 (100.0%) |
| 6 to 11 Years | 249 (100.0%) | 92 (100.0%) |
| 12 to 14 Years | 101 (100.0%) | 49 (100.0%) |
| 15 Years | 113 (100.0%) | 0 (0.0%) |
| 16 and 17 Years | 0 (0.0%) | 53 (100.0%) |
| 18 to 24 Years | 80 (100.0%) | 227 (75.7%) |
| 25 to 34 Years | 113 (100.0%) | 155 (100.0%) |
| 35 to 44 Years | 170 (100.0%) | 168 (100.0%) |
| 45 to 54 Years | 308 (100.0%) | 262 (100.0%) |
| 55 to 64 Years | 204 (100.0%) | 281 (87.5%) |
| 65 to 74 Years | 266 (100.0%) | 191 (100.0%) |
| 75 Years and over | 123 (100.0%) | 89 (100.0%) |
| Total | 1,846 (100.0%) | 1,625 (93.5%) |
Income Below Poverty Among Married-Couple Families in Boiling Springs
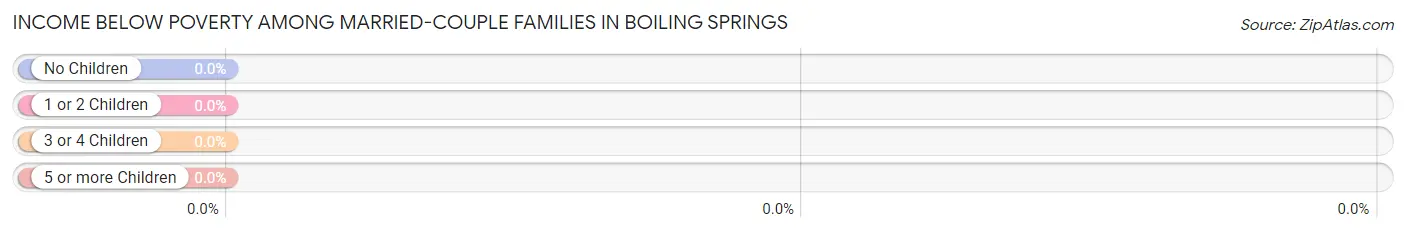
| Children | Above Poverty | Below Poverty |
| No Children | 509 (100.0%) | 0 (0.0%) |
| 1 or 2 Children | 186 (100.0%) | 0 (0.0%) |
| 3 or 4 Children | 56 (100.0%) | 0 (0.0%) |
| 5 or more Children | 0 (0.0%) | 0 (0.0%) |
| Total | 751 (100.0%) | 0 (0.0%) |
Income Below Poverty Among Single-Parent Households in Boiling Springs
| Children | Single Father | Single Mother |
| No Children | 0 (0.0%) | 0 (0.0%) |
| 1 or 2 Children | 0 (0.0%) | 0 (0.0%) |
| 3 or 4 Children | 0 (0.0%) | 0 (0.0%) |
| 5 or more Children | 0 (0.0%) | 0 (0.0%) |
| Total | 0 (0.0%) | 0 (0.0%) |
Income Below Poverty Among Married-Couple vs Single-Parent Households in Boiling Springs
| Children | Married-Couple Families | Single-Parent Households |
| No Children | 0 (0.0%) | 0 (0.0%) |
| 1 or 2 Children | 0 (0.0%) | 0 (0.0%) |
| 3 or 4 Children | 0 (0.0%) | 0 (0.0%) |
| 5 or more Children | 0 (0.0%) | 0 (0.0%) |
| Total | 0 (0.0%) | 0 (0.0%) |
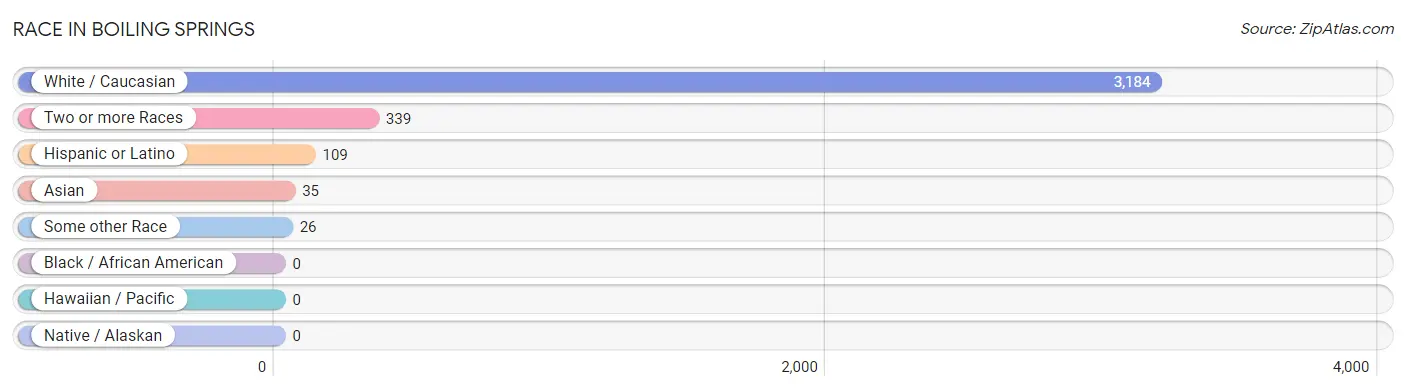
Race in Boiling Springs
The most populous races in Boiling Springs are White / Caucasian (3,184 | 88.8%), Two or more Races (339 | 9.5%), and Hispanic or Latino (109 | 3.0%).
| Race | # Population | % Population |
| Asian | 35 | 1.0% |
| Black / African American | 0 | 0.0% |
| Hawaiian / Pacific | 0 | 0.0% |
| Hispanic or Latino | 109 | 3.0% |
| Native / Alaskan | 0 | 0.0% |
| White / Caucasian | 3,184 | 88.8% |
| Two or more Races | 339 | 9.5% |
| Some other Race | 26 | 0.7% |
| Total | 3,584 | 100.0% |
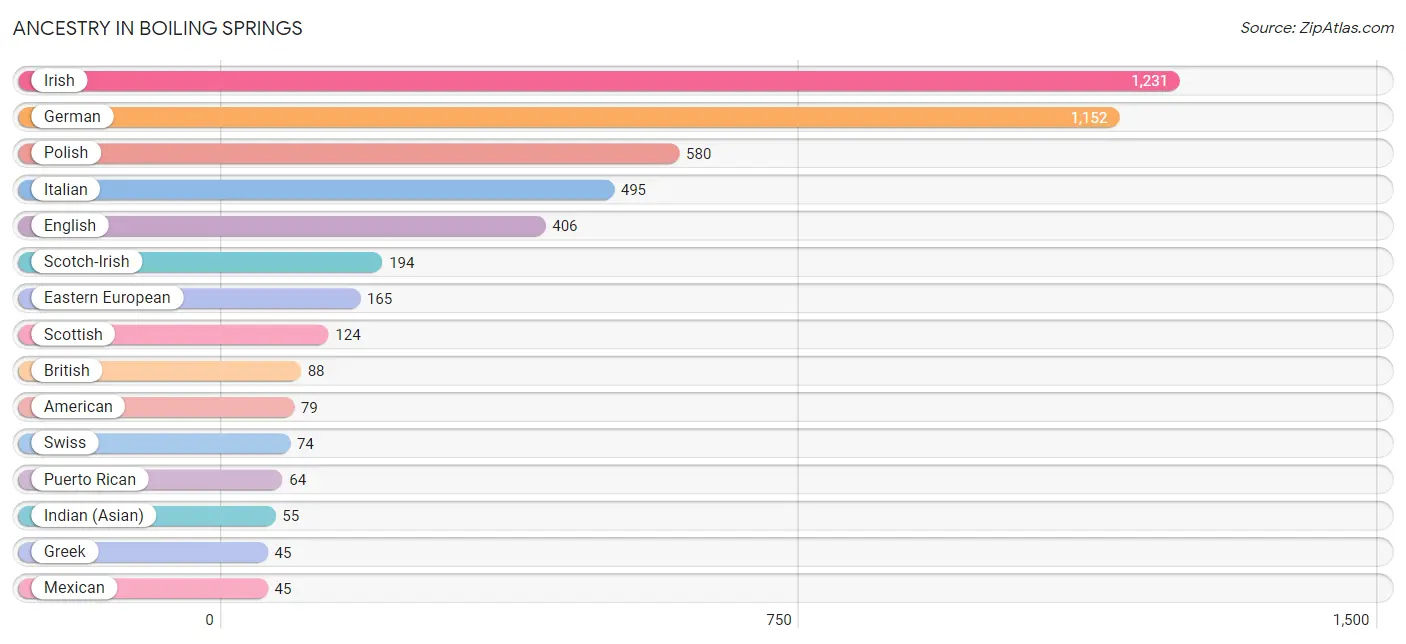
Ancestry in Boiling Springs
The most populous ancestries reported in Boiling Springs are Irish (1,231 | 34.4%), German (1,152 | 32.1%), Polish (580 | 16.2%), Italian (495 | 13.8%), and English (406 | 11.3%), together accounting for 107.8% of all Boiling Springs residents.
| Ancestry | # Population | % Population |
| American | 79 | 2.2% |
| Arab | 23 | 0.6% |
| Austrian | 22 | 0.6% |
| Blackfeet | 16 | 0.4% |
| British | 88 | 2.5% |
| Dutch | 37 | 1.0% |
| Eastern European | 165 | 4.6% |
| English | 406 | 11.3% |
| European | 27 | 0.7% |
| French | 37 | 1.0% |
| German | 1,152 | 32.1% |
| Greek | 45 | 1.3% |
| Hungarian | 6 | 0.2% |
| Indian (Asian) | 55 | 1.5% |
| Irish | 1,231 | 34.4% |
| Italian | 495 | 13.8% |
| Lebanese | 23 | 0.6% |
| Mexican | 45 | 1.3% |
| Polish | 580 | 16.2% |
| Puerto Rican | 64 | 1.8% |
| Scandinavian | 38 | 1.1% |
| Scotch-Irish | 194 | 5.4% |
| Scottish | 124 | 3.5% |
| Slovak | 6 | 0.2% |
| Swedish | 12 | 0.3% |
| Swiss | 74 | 2.1% |
| Ukrainian | 35 | 1.0% |
| Welsh | 40 | 1.1% | View All 28 Rows |
Immigrants in Boiling Springs
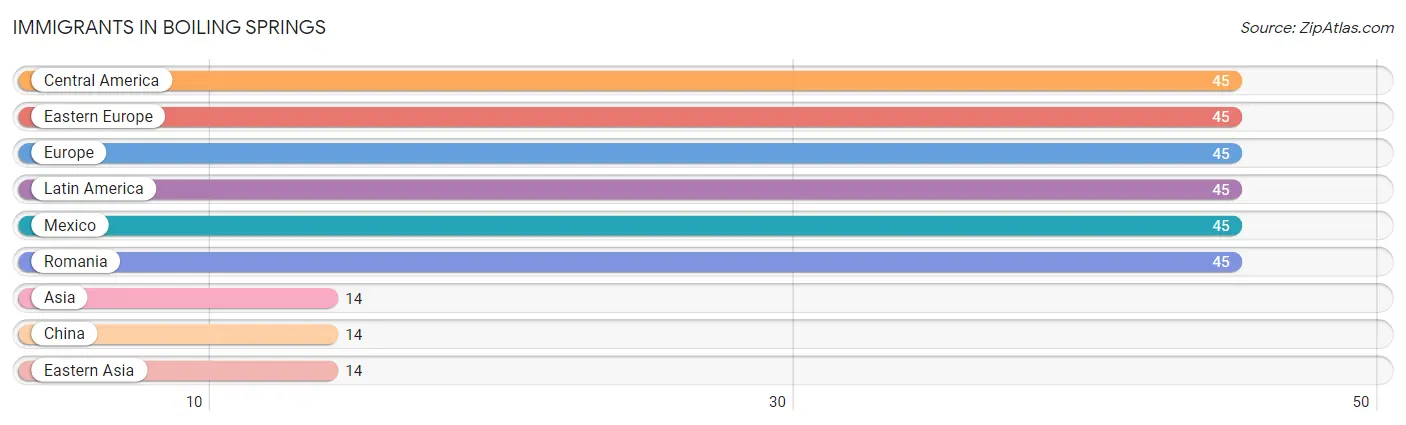
The most numerous immigrant groups reported in Boiling Springs came from Central America (45 | 1.3%), Eastern Europe (45 | 1.3%), Europe (45 | 1.3%), Latin America (45 | 1.3%), and Mexico (45 | 1.3%), together accounting for 6.3% of all Boiling Springs residents.
| Immigration Origin | # Population | % Population |
| Asia | 14 | 0.4% |
| Central America | 45 | 1.3% |
| China | 14 | 0.4% |
| Eastern Asia | 14 | 0.4% |
| Eastern Europe | 45 | 1.3% |
| Europe | 45 | 1.3% |
| Latin America | 45 | 1.3% |
| Mexico | 45 | 1.3% |
| Romania | 45 | 1.3% | View All 9 Rows |
Sex and Age in Boiling Springs
Sex and Age in Boiling Springs
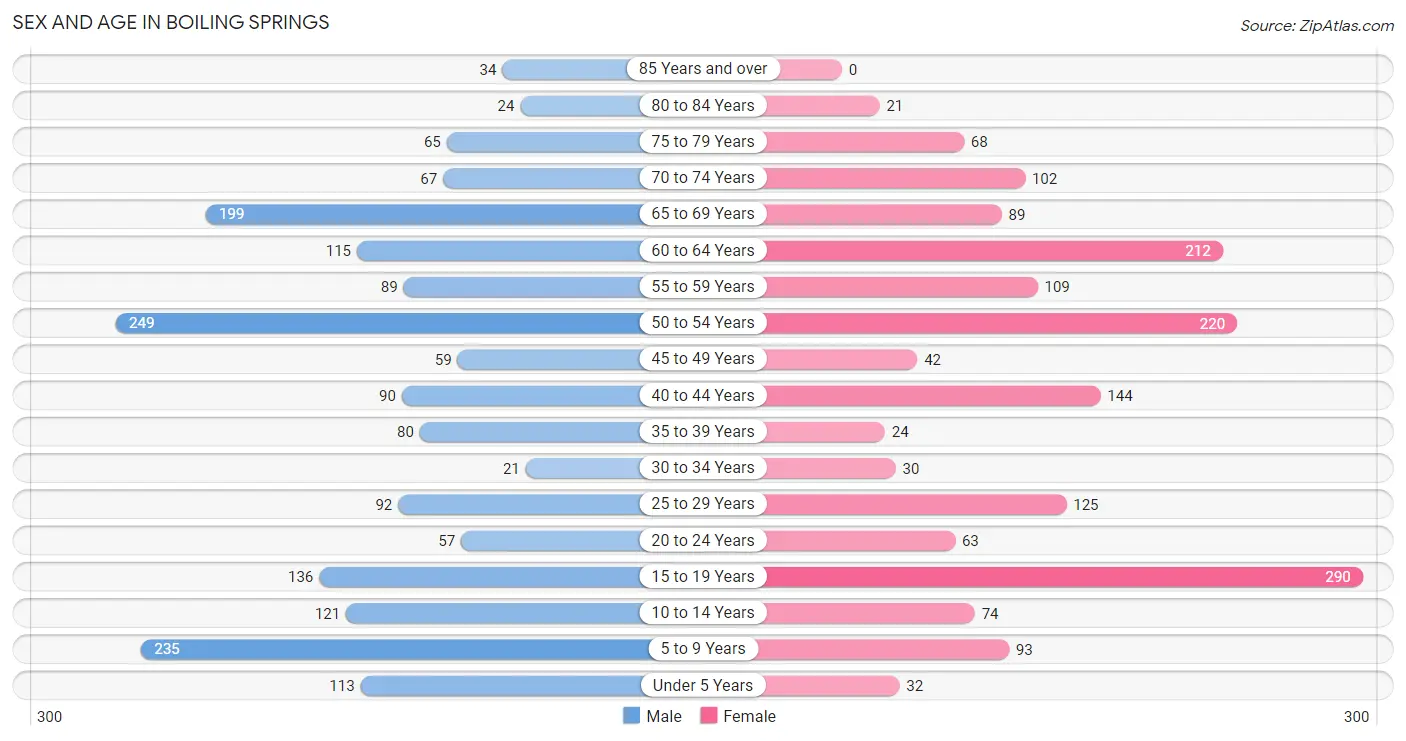
The most populous age groups in Boiling Springs are 50 to 54 Years (249 | 13.5%) for men and 15 to 19 Years (290 | 16.7%) for women.
| Age Bracket | Male | Female |
| Under 5 Years | 113 (6.1%) | 32 (1.8%) |
| 5 to 9 Years | 235 (12.7%) | 93 (5.3%) |
| 10 to 14 Years | 121 (6.6%) | 74 (4.3%) |
| 15 to 19 Years | 136 (7.4%) | 290 (16.7%) |
| 20 to 24 Years | 57 (3.1%) | 63 (3.6%) |
| 25 to 29 Years | 92 (5.0%) | 125 (7.2%) |
| 30 to 34 Years | 21 (1.1%) | 30 (1.7%) |
| 35 to 39 Years | 80 (4.3%) | 24 (1.4%) |
| 40 to 44 Years | 90 (4.9%) | 144 (8.3%) |
| 45 to 49 Years | 59 (3.2%) | 42 (2.4%) |
| 50 to 54 Years | 249 (13.5%) | 220 (12.7%) |
| 55 to 59 Years | 89 (4.8%) | 109 (6.3%) |
| 60 to 64 Years | 115 (6.2%) | 212 (12.2%) |
| 65 to 69 Years | 199 (10.8%) | 89 (5.1%) |
| 70 to 74 Years | 67 (3.6%) | 102 (5.9%) |
| 75 to 79 Years | 65 (3.5%) | 68 (3.9%) |
| 80 to 84 Years | 24 (1.3%) | 21 (1.2%) |
| 85 Years and over | 34 (1.8%) | 0 (0.0%) |
| Total | 1,846 (100.0%) | 1,738 (100.0%) |
Families and Households in Boiling Springs
Median Family Size in Boiling Springs
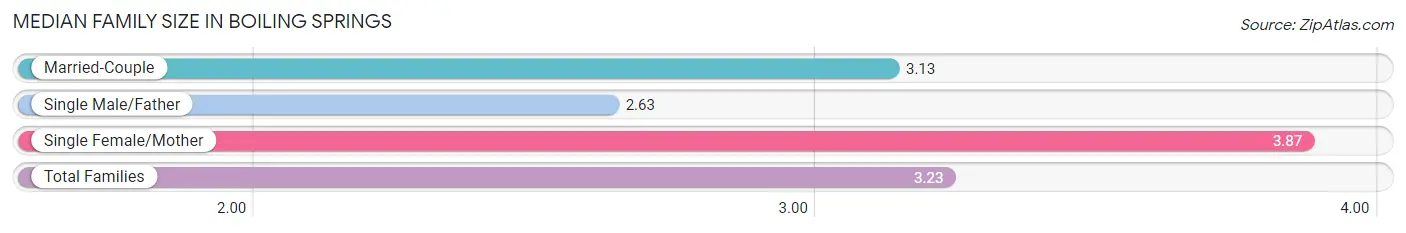
The median family size in Boiling Springs is 3.23 persons per family, with single female/mother families (172 | 17.7%) accounting for the largest median family size of 3.87 persons per family. On the other hand, single male/father families (51 | 5.2%) represent the smallest median family size with 2.63 persons per family.
| Family Type | # Families | Family Size |
| Married-Couple | 751 (77.1%) | 3.13 |
| Single Male/Father | 51 (5.2%) | 2.63 |
| Single Female/Mother | 172 (17.7%) | 3.87 |
| Total Families | 974 (100.0%) | 3.23 |
Median Household Size in Boiling Springs
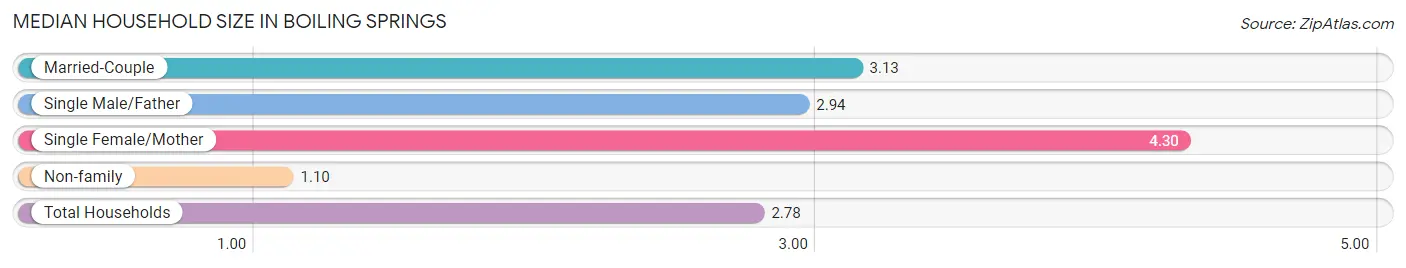
The median household size in Boiling Springs is 2.78 persons per household, with single female/mother households (172 | 13.3%) accounting for the largest median household size of 4.3 persons per household. non-family households (316 | 24.5%) represent the smallest median household size with 1.10 persons per household.
| Household Type | # Households | Household Size |
| Married-Couple | 751 (58.2%) | 3.13 |
| Single Male/Father | 51 (4.0%) | 2.94 |
| Single Female/Mother | 172 (13.3%) | 4.30 |
| Non-family | 316 (24.5%) | 1.10 |
| Total Households | 1,290 (100.0%) | 2.78 |
Household Size by Marriage Status in Boiling Springs
Out of a total of 1,290 households in Boiling Springs, 974 (75.5%) are family households, while 316 (24.5%) are nonfamily households. The most numerous type of family households are 2-person households, comprising 427, and the most common type of nonfamily households are 1-person households, comprising 288.
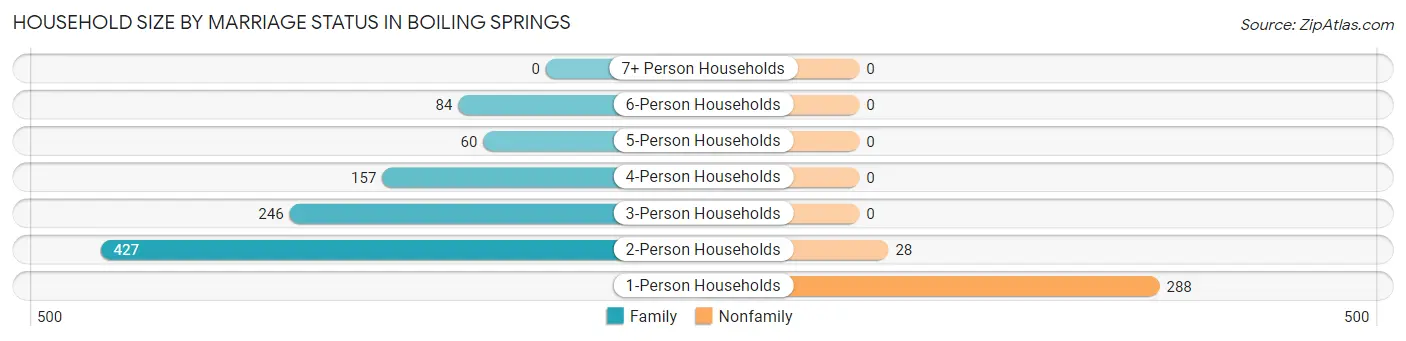
| Household Size | Family Households | Nonfamily Households |
| 1-Person Households | - | 288 (22.3%) |
| 2-Person Households | 427 (33.1%) | 28 (2.2%) |
| 3-Person Households | 246 (19.1%) | 0 (0.0%) |
| 4-Person Households | 157 (12.2%) | 0 (0.0%) |
| 5-Person Households | 60 (4.6%) | 0 (0.0%) |
| 6-Person Households | 84 (6.5%) | 0 (0.0%) |
| 7+ Person Households | 0 (0.0%) | 0 (0.0%) |
| Total | 974 (75.5%) | 316 (24.5%) |
Female Fertility in Boiling Springs
Fertility by Age in Boiling Springs
Average fertility rate in Boiling Springs is 57.0 births per 1,000 women. Women in the age bracket of 35 to 50 years have the highest fertility rate with 157.0 births per 1,000 women. Women in the age bracket of 35 to 50 years acount for 100.0% of all women with births.
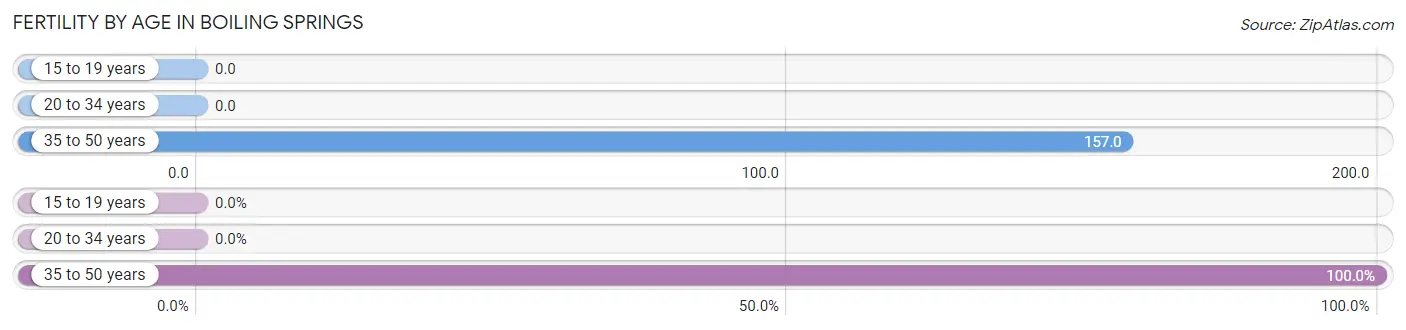
| Age Bracket | Women with Births | Births / 1,000 Women |
| 15 to 19 years | 0 (0.0%) | 0.0 |
| 20 to 34 years | 0 (0.0%) | 0.0 |
| 35 to 50 years | 45 (100.0%) | 157.0 |
| Total | 45 (100.0%) | 57.0 |
Fertility by Age by Marriage Status in Boiling Springs
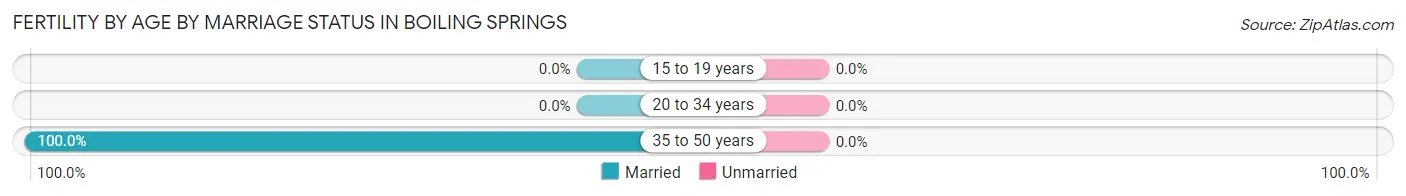
| Age Bracket | Married | Unmarried |
| 15 to 19 years | 0 (0.0%) | 0 (0.0%) |
| 20 to 34 years | 0 (0.0%) | 0 (0.0%) |
| 35 to 50 years | 45 (100.0%) | 0 (0.0%) |
| Total | 45 (100.0%) | 0 (0.0%) |
Fertility by Education in Boiling Springs
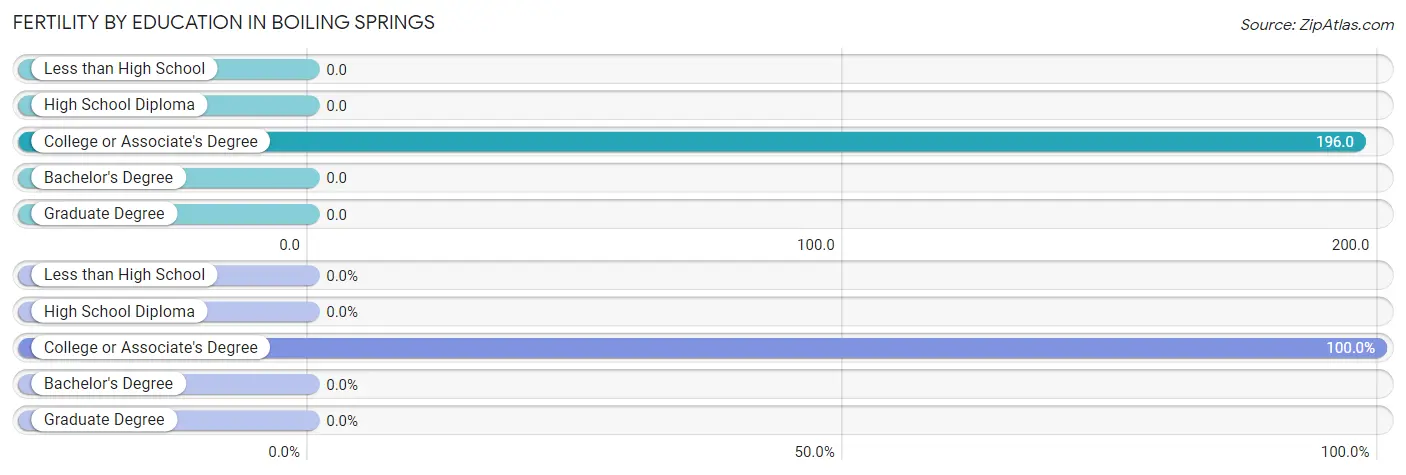
| Educational Attainment | Women with Births | Births / 1,000 Women |
| Less than High School | 0 (0.0%) | 0.0 |
| High School Diploma | 0 (0.0%) | 0.0 |
| College or Associate's Degree | 45 (100.0%) | 196.0 |
| Bachelor's Degree | 0 (0.0%) | 0.0 |
| Graduate Degree | 0 (0.0%) | 0.0 |
| Total | 45 (100.0%) | 57.0 |
Fertility by Education by Marriage Status in Boiling Springs
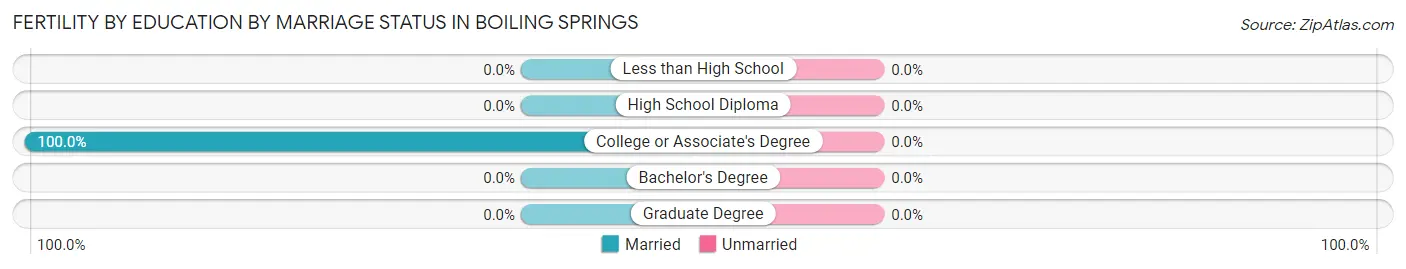
| Educational Attainment | Married | Unmarried |
| Less than High School | 0 (0.0%) | 0 (0.0%) |
| High School Diploma | 0 (0.0%) | 0 (0.0%) |
| College or Associate's Degree | 45 (100.0%) | 0 (0.0%) |
| Bachelor's Degree | 0 (0.0%) | 0 (0.0%) |
| Graduate Degree | 0 (0.0%) | 0 (0.0%) |
| Total | 45 (100.0%) | 0 (0.0%) |
Employment Characteristics in Boiling Springs
Employment by Class of Employer in Boiling Springs
Among the 1,786 employed individuals in Boiling Springs, private company employees (1,210 | 67.7%), not-for-profit organizations (167 | 9.3%), and local government employees (137 | 7.7%) make up the most common classes of employment.
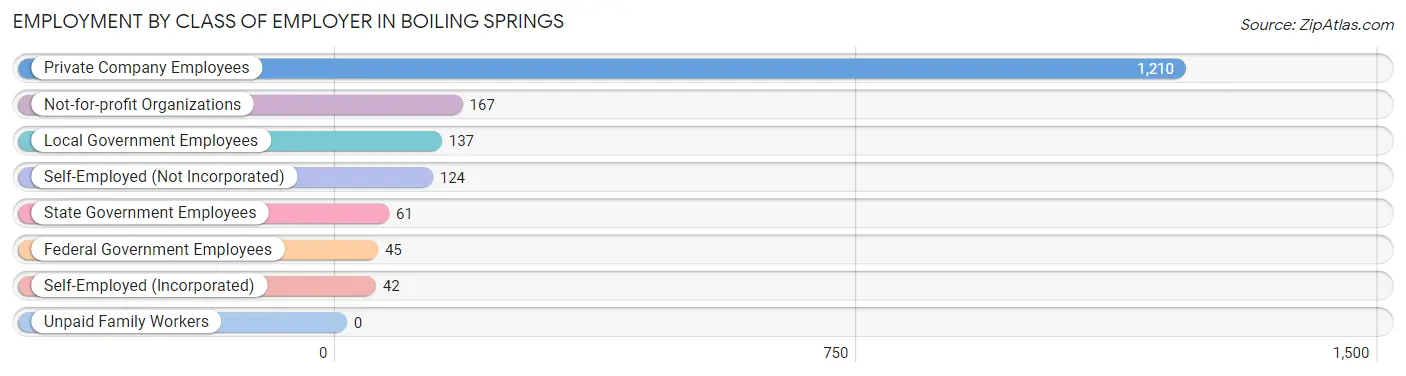
| Employer Class | # Employees | % Employees |
| Private Company Employees | 1,210 | 67.7% |
| Self-Employed (Incorporated) | 42 | 2.4% |
| Self-Employed (Not Incorporated) | 124 | 6.9% |
| Not-for-profit Organizations | 167 | 9.3% |
| Local Government Employees | 137 | 7.7% |
| State Government Employees | 61 | 3.4% |
| Federal Government Employees | 45 | 2.5% |
| Unpaid Family Workers | 0 | 0.0% |
| Total | 1,786 | 100.0% |
Employment Status by Age in Boiling Springs
According to the labor force statistics for Boiling Springs, out of the total population over 16 years of age (2,803), 66.0% or 1,850 individuals are in the labor force, with 3.1% or 57 of them unemployed. The age group with the highest labor force participation rate is 25 to 29 years, with 100.0% or 217 individuals in the labor force. Within the labor force, the 20 to 24 years age range has the highest percentage of unemployed individuals, with 26.7% or 23 of them being unemployed.
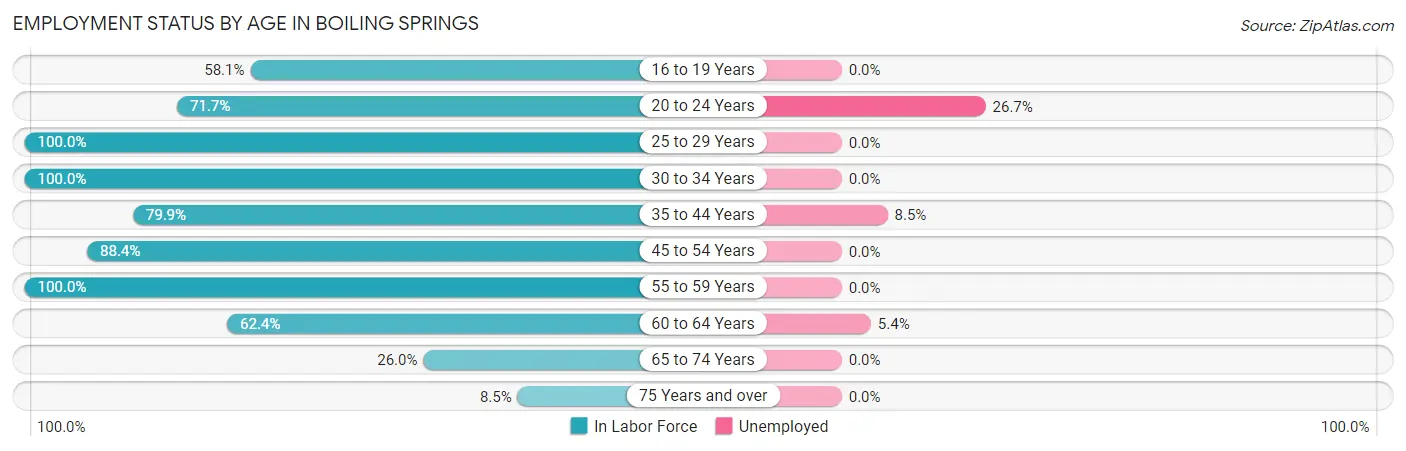
| Age Bracket | In Labor Force | Unemployed |
| 16 to 19 Years | 182 (58.1%) | 0 (0.0%) |
| 20 to 24 Years | 86 (71.7%) | 23 (26.7%) |
| 25 to 29 Years | 217 (100.0%) | 0 (0.0%) |
| 30 to 34 Years | 51 (100.0%) | 0 (0.0%) |
| 35 to 44 Years | 270 (79.9%) | 23 (8.5%) |
| 45 to 54 Years | 504 (88.4%) | 0 (0.0%) |
| 55 to 59 Years | 198 (100.0%) | 0 (0.0%) |
| 60 to 64 Years | 204 (62.4%) | 11 (5.4%) |
| 65 to 74 Years | 119 (26.0%) | 0 (0.0%) |
| 75 Years and over | 18 (8.5%) | 0 (0.0%) |
| Total | 1,850 (66.0%) | 57 (3.1%) |
Employment Status by Educational Attainment in Boiling Springs
According to labor force statistics for Boiling Springs, 84.9% of individuals (1,444) out of the total population between 25 and 64 years of age (1,701) are in the labor force, with 2.4% or 35 of them being unemployed. The group with the highest labor force participation rate are those with the educational attainment of bachelor's degree or higher, with 87.6% or 698 individuals in the labor force. Within the labor force, individuals with bachelor's degree or higher education have the highest percentage of unemployment, with 4.9% or 34 of them being unemployed.
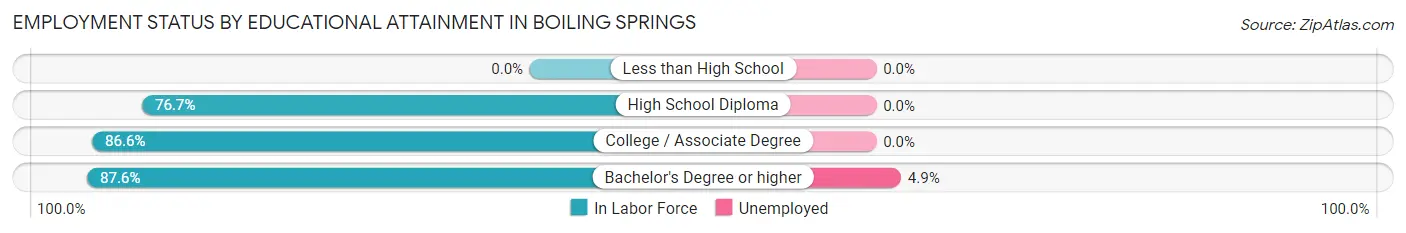
| Educational Attainment | In Labor Force | Unemployed |
| Less than High School | 0 (0.0%) | 0 (0.0%) |
| High School Diploma | 286 (76.7%) | 0 (0.0%) |
| College / Associate Degree | 460 (86.6%) | 0 (0.0%) |
| Bachelor's Degree or higher | 698 (87.6%) | 39 (4.9%) |
| Total | 1,444 (84.9%) | 41 (2.4%) |
Employment Occupations by Sex in Boiling Springs
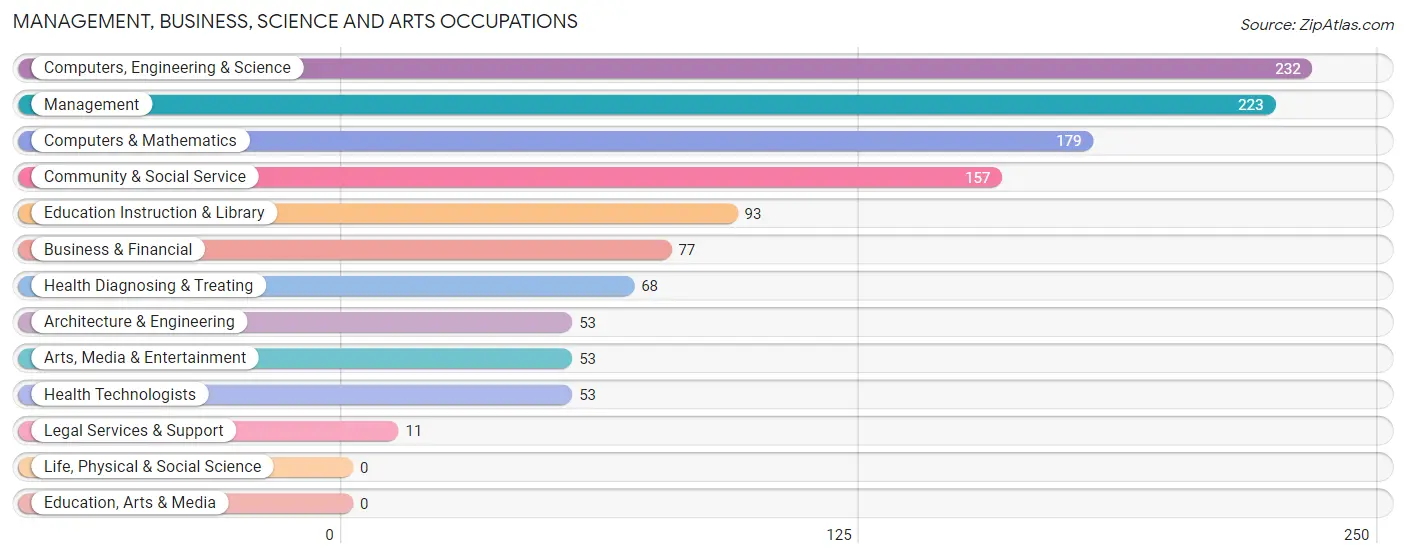
Management, Business, Science and Arts Occupations
The most common Management, Business, Science and Arts occupations in Boiling Springs are Computers, Engineering & Science (232 | 13.0%), Management (223 | 12.4%), Computers & Mathematics (179 | 10.0%), Community & Social Service (157 | 8.8%), and Education Instruction & Library (93 | 5.2%).
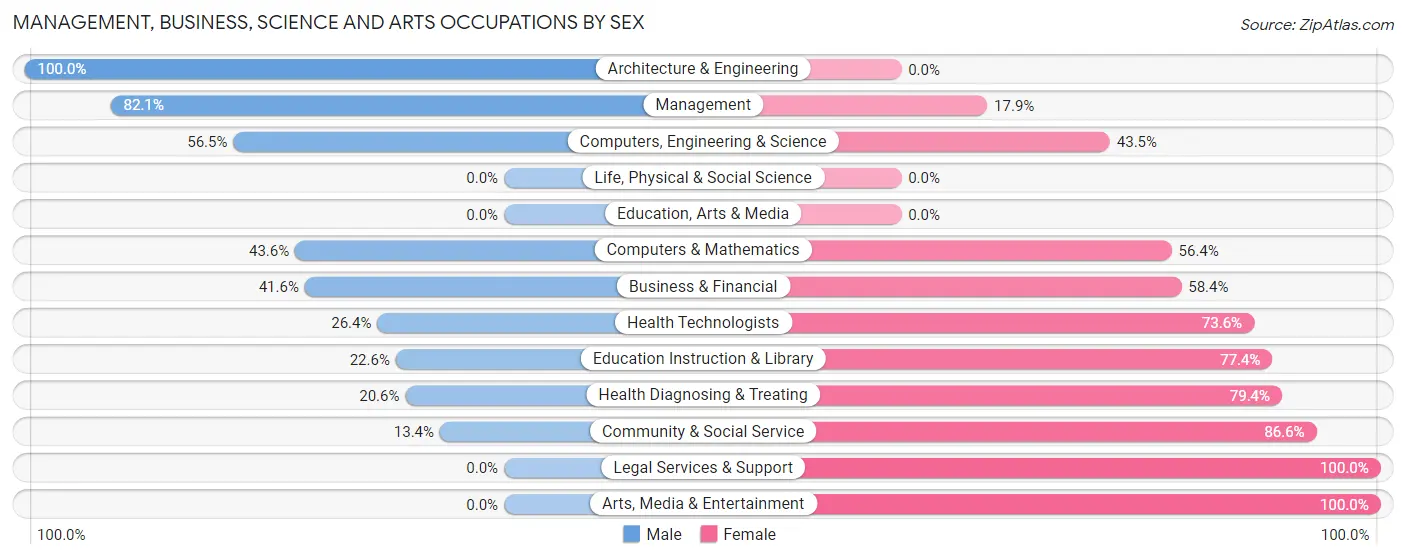
Management, Business, Science and Arts Occupations by Sex
Within the Management, Business, Science and Arts occupations in Boiling Springs, the most male-oriented occupations are Architecture & Engineering (100.0%), Management (82.1%), and Computers, Engineering & Science (56.5%), while the most female-oriented occupations are Legal Services & Support (100.0%), Arts, Media & Entertainment (100.0%), and Community & Social Service (86.6%).
| Occupation | Male | Female |
| Management | 183 (82.1%) | 40 (17.9%) |
| Business & Financial | 32 (41.6%) | 45 (58.4%) |
| Computers, Engineering & Science | 131 (56.5%) | 101 (43.5%) |
| Computers & Mathematics | 78 (43.6%) | 101 (56.4%) |
| Architecture & Engineering | 53 (100.0%) | 0 (0.0%) |
| Life, Physical & Social Science | 0 (0.0%) | 0 (0.0%) |
| Community & Social Service | 21 (13.4%) | 136 (86.6%) |
| Education, Arts & Media | 0 (0.0%) | 0 (0.0%) |
| Legal Services & Support | 0 (0.0%) | 11 (100.0%) |
| Education Instruction & Library | 21 (22.6%) | 72 (77.4%) |
| Arts, Media & Entertainment | 0 (0.0%) | 53 (100.0%) |
| Health Diagnosing & Treating | 14 (20.6%) | 54 (79.4%) |
| Health Technologists | 14 (26.4%) | 39 (73.6%) |
| Total (Category) | 381 (50.3%) | 376 (49.7%) |
| Total (Overall) | 842 (47.0%) | 950 (53.0%) |
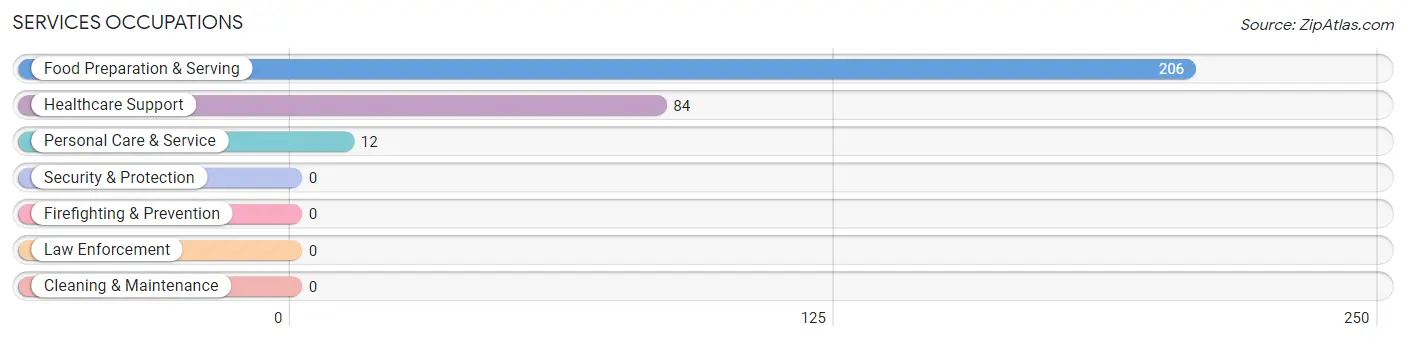
Services Occupations
The most common Services occupations in Boiling Springs are Food Preparation & Serving (206 | 11.5%), Healthcare Support (84 | 4.7%), and Personal Care & Service (12 | 0.7%).
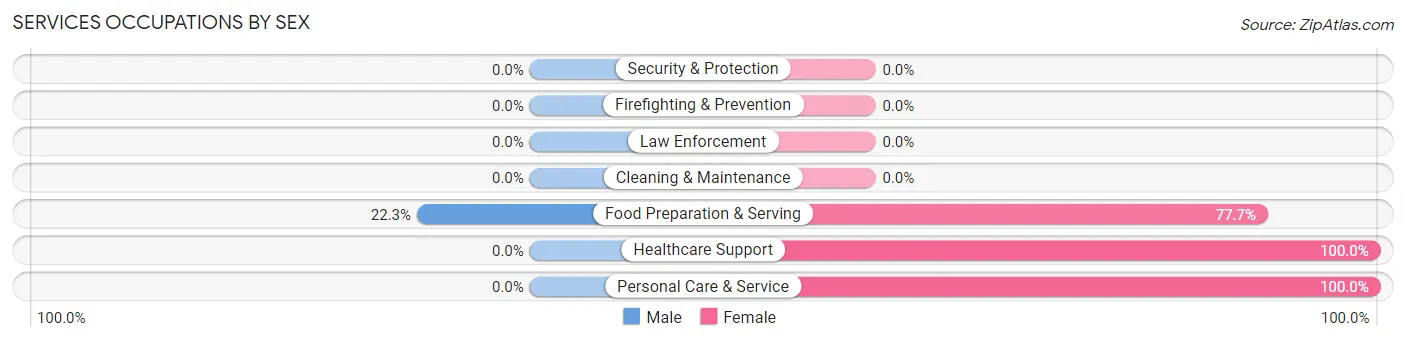
Services Occupations by Sex
| Occupation | Male | Female |
| Healthcare Support | 0 (0.0%) | 84 (100.0%) |
| Security & Protection | 0 (0.0%) | 0 (0.0%) |
| Firefighting & Prevention | 0 (0.0%) | 0 (0.0%) |
| Law Enforcement | 0 (0.0%) | 0 (0.0%) |
| Food Preparation & Serving | 46 (22.3%) | 160 (77.7%) |
| Cleaning & Maintenance | 0 (0.0%) | 0 (0.0%) |
| Personal Care & Service | 0 (0.0%) | 12 (100.0%) |
| Total (Category) | 46 (15.2%) | 256 (84.8%) |
| Total (Overall) | 842 (47.0%) | 950 (53.0%) |
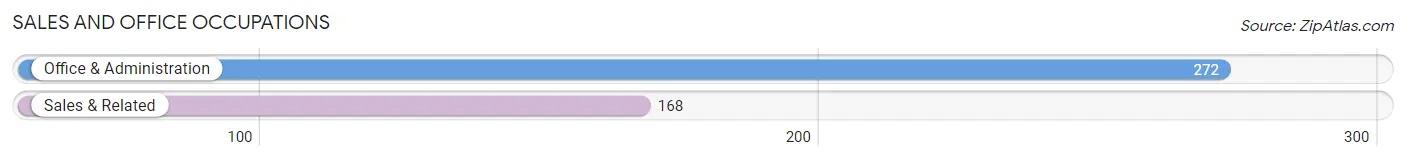
Sales and Office Occupations
The most common Sales and Office occupations in Boiling Springs are Office & Administration (272 | 15.2%), and Sales & Related (168 | 9.4%).
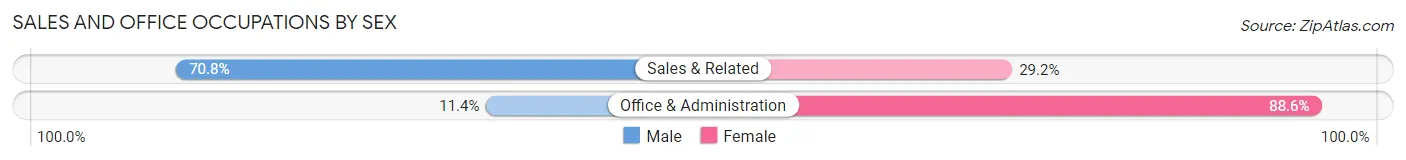
Sales and Office Occupations by Sex
| Occupation | Male | Female |
| Sales & Related | 119 (70.8%) | 49 (29.2%) |
| Office & Administration | 31 (11.4%) | 241 (88.6%) |
| Total (Category) | 150 (34.1%) | 290 (65.9%) |
| Total (Overall) | 842 (47.0%) | 950 (53.0%) |
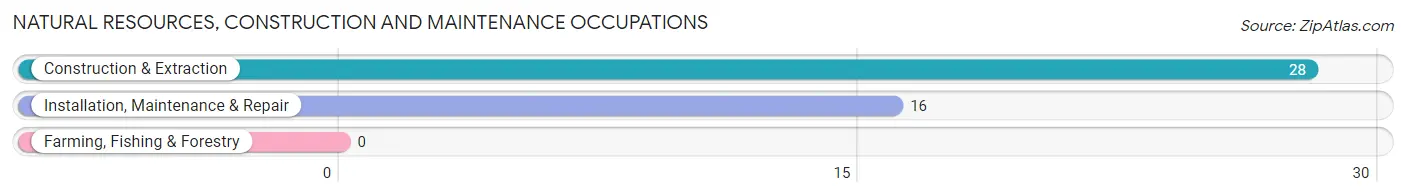
Natural Resources, Construction and Maintenance Occupations
The most common Natural Resources, Construction and Maintenance occupations in Boiling Springs are Construction & Extraction (28 | 1.6%), and Installation, Maintenance & Repair (16 | 0.9%).
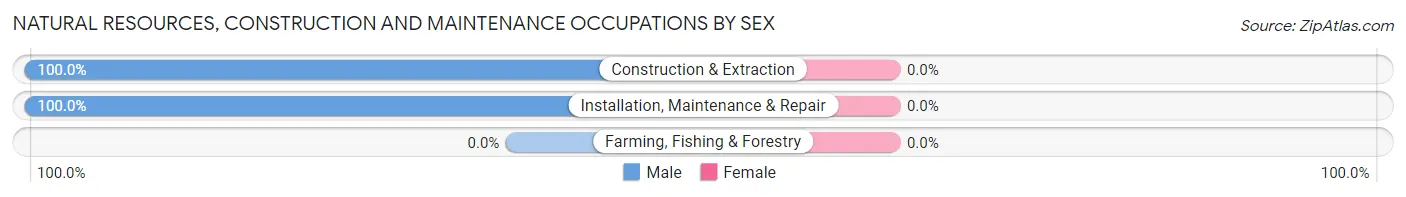
Natural Resources, Construction and Maintenance Occupations by Sex
| Occupation | Male | Female |
| Farming, Fishing & Forestry | 0 (0.0%) | 0 (0.0%) |
| Construction & Extraction | 28 (100.0%) | 0 (0.0%) |
| Installation, Maintenance & Repair | 16 (100.0%) | 0 (0.0%) |
| Total (Category) | 44 (100.0%) | 0 (0.0%) |
| Total (Overall) | 842 (47.0%) | 950 (53.0%) |
Production, Transportation and Moving Occupations
The most common Production, Transportation and Moving occupations in Boiling Springs are Transportation (158 | 8.8%), Production (48 | 2.7%), and Material Moving (43 | 2.4%).
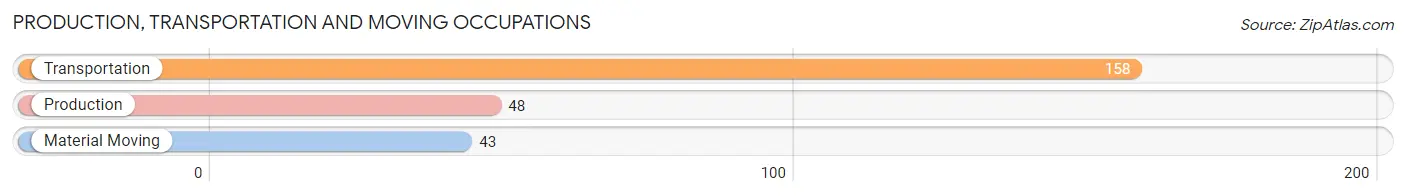
Production, Transportation and Moving Occupations by Sex
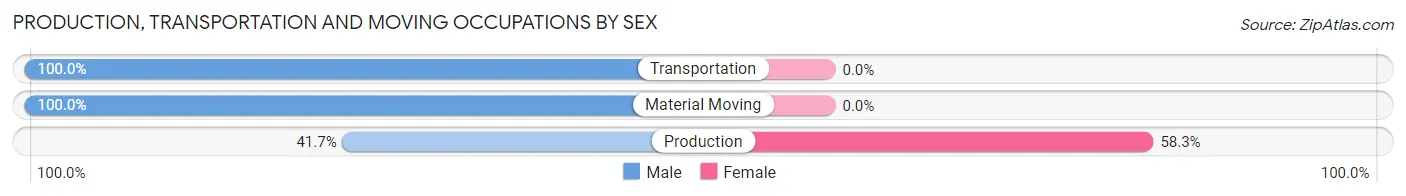
| Occupation | Male | Female |
| Production | 20 (41.7%) | 28 (58.3%) |
| Transportation | 158 (100.0%) | 0 (0.0%) |
| Material Moving | 43 (100.0%) | 0 (0.0%) |
| Total (Category) | 221 (88.8%) | 28 (11.2%) |
| Total (Overall) | 842 (47.0%) | 950 (53.0%) |
Employment Industries by Sex in Boiling Springs
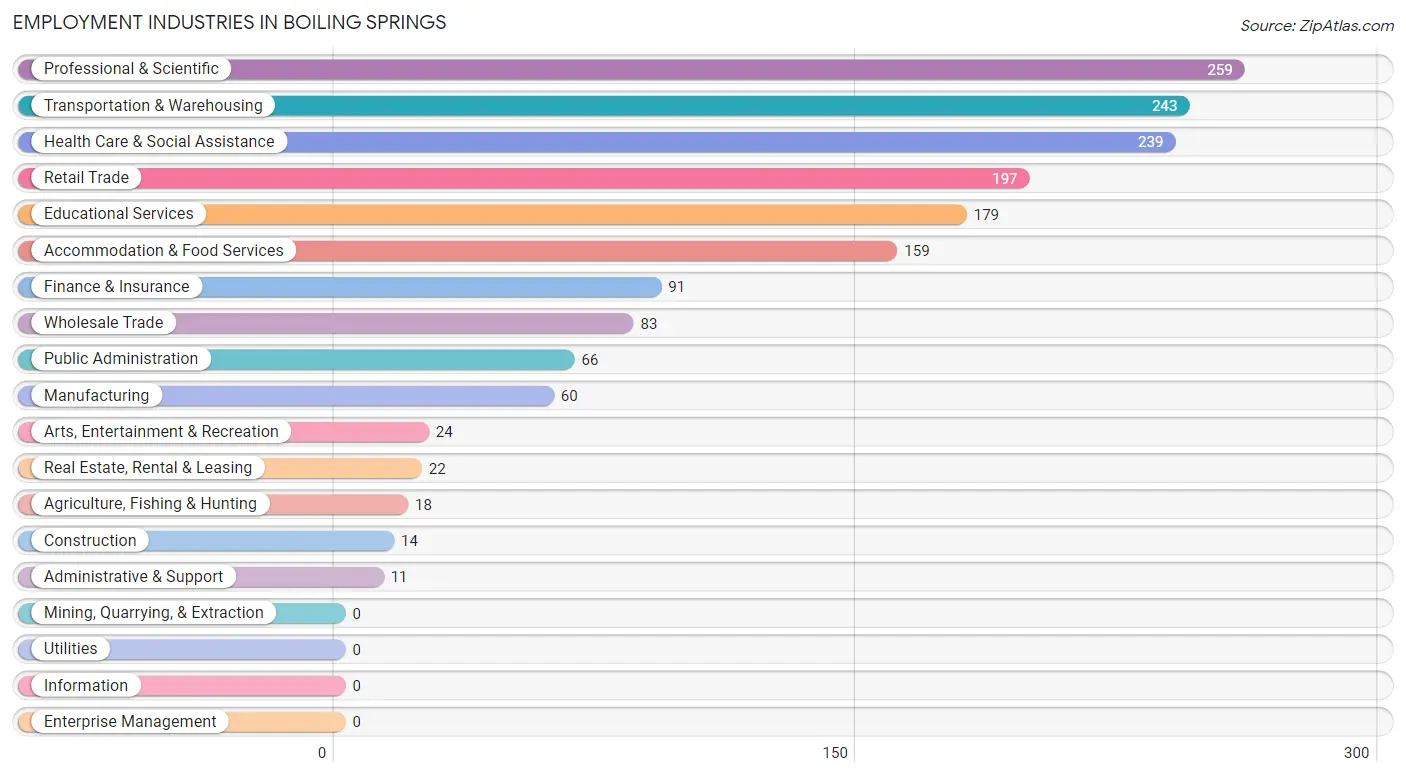
Employment Industries in Boiling Springs
The major employment industries in Boiling Springs include Professional & Scientific (259 | 14.4%), Transportation & Warehousing (243 | 13.6%), Health Care & Social Assistance (239 | 13.3%), Retail Trade (197 | 11.0%), and Educational Services (179 | 10.0%).
Employment Industries by Sex in Boiling Springs
The Boiling Springs industries that see more men than women are Agriculture, Fishing & Hunting (100.0%), Construction (100.0%), and Wholesale Trade (100.0%), whereas the industries that tend to have a higher number of women are Arts, Entertainment & Recreation (100.0%), Retail Trade (89.3%), and Accommodation & Food Services (85.5%).
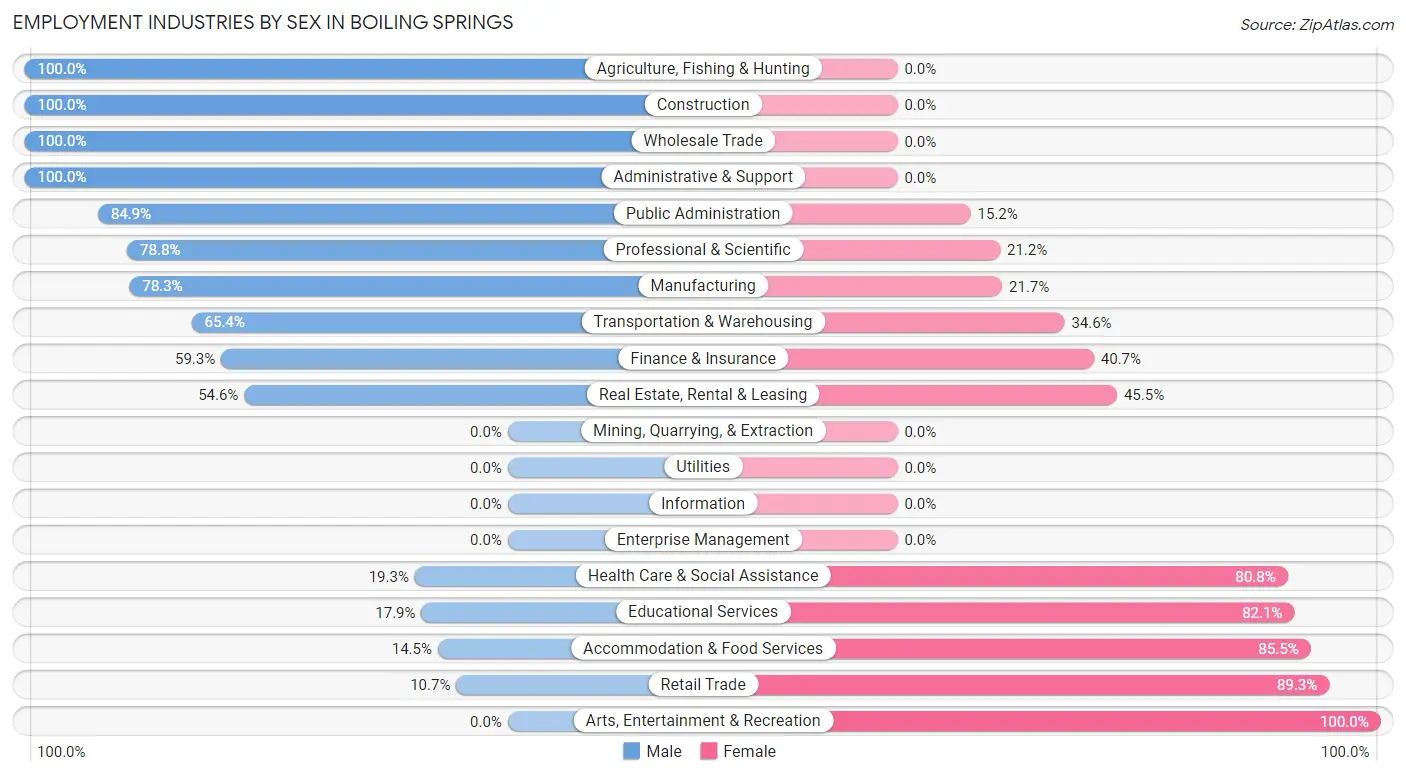
| Industry | Male | Female |
| Agriculture, Fishing & Hunting | 18 (100.0%) | 0 (0.0%) |
| Mining, Quarrying, & Extraction | 0 (0.0%) | 0 (0.0%) |
| Construction | 14 (100.0%) | 0 (0.0%) |
| Manufacturing | 47 (78.3%) | 13 (21.7%) |
| Wholesale Trade | 83 (100.0%) | 0 (0.0%) |
| Retail Trade | 21 (10.7%) | 176 (89.3%) |
| Transportation & Warehousing | 159 (65.4%) | 84 (34.6%) |
| Utilities | 0 (0.0%) | 0 (0.0%) |
| Information | 0 (0.0%) | 0 (0.0%) |
| Finance & Insurance | 54 (59.3%) | 37 (40.7%) |
| Real Estate, Rental & Leasing | 12 (54.5%) | 10 (45.5%) |
| Professional & Scientific | 204 (78.8%) | 55 (21.2%) |
| Enterprise Management | 0 (0.0%) | 0 (0.0%) |
| Administrative & Support | 11 (100.0%) | 0 (0.0%) |
| Educational Services | 32 (17.9%) | 147 (82.1%) |
| Health Care & Social Assistance | 46 (19.3%) | 193 (80.7%) |
| Arts, Entertainment & Recreation | 0 (0.0%) | 24 (100.0%) |
| Accommodation & Food Services | 23 (14.5%) | 136 (85.5%) |
| Public Administration | 56 (84.9%) | 10 (15.1%) |
| Total | 842 (47.0%) | 950 (53.0%) |
Education in Boiling Springs
School Enrollment in Boiling Springs
The most common levels of schooling among the 955 students in Boiling Springs are elementary school (299 | 31.3%), college / undergraduate (237 | 24.8%), and high school (209 | 21.9%).
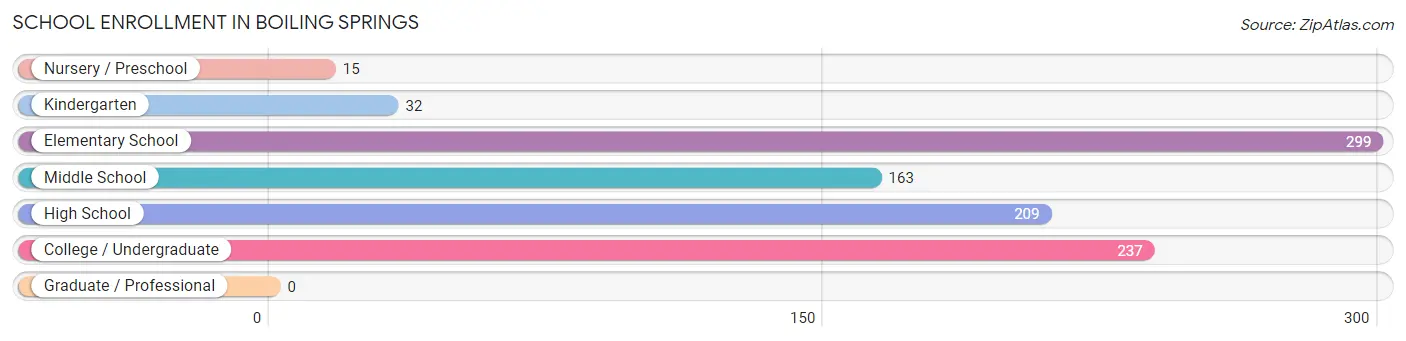
| School Level | # Students | % Students |
| Nursery / Preschool | 15 | 1.6% |
| Kindergarten | 32 | 3.4% |
| Elementary School | 299 | 31.3% |
| Middle School | 163 | 17.1% |
| High School | 209 | 21.9% |
| College / Undergraduate | 237 | 24.8% |
| Graduate / Professional | 0 | 0.0% |
| Total | 955 | 100.0% |
School Enrollment by Age by Funding Source in Boiling Springs
Out of a total of 955 students who are enrolled in schools in Boiling Springs, 130 (13.6%) attend a private institution, while the remaining 825 (86.4%) are enrolled in public schools. The age group of 20 to 24 year olds has the highest likelihood of being enrolled in private schools, with 63 (64.9% in the age bracket) enrolled. Conversely, the age group of 5 to 9 year old has the lowest likelihood of being enrolled in a private school, with 328 (100.0% in the age bracket) attending a public institution.
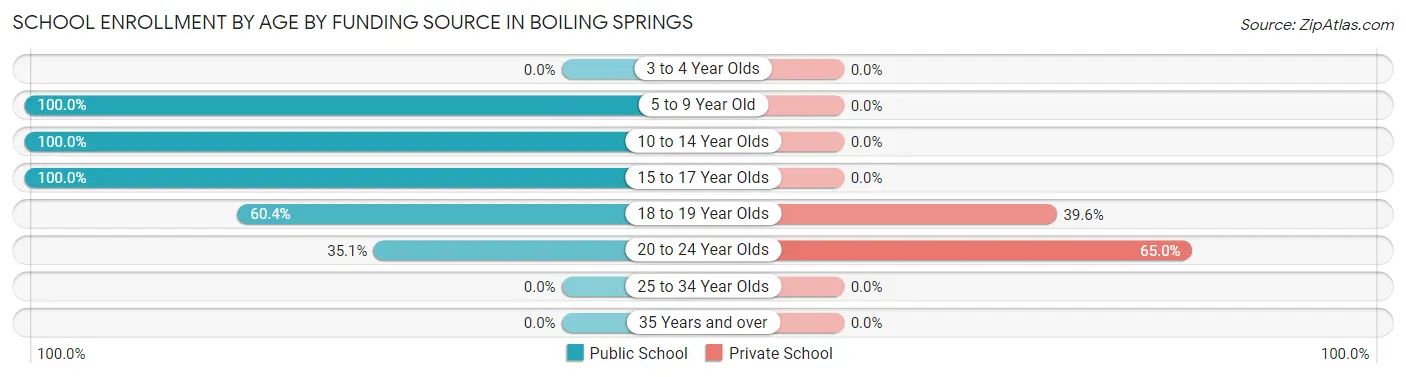
| Age Bracket | Public School | Private School |
| 3 to 4 Year Olds | 0 (0.0%) | 0 (0.0%) |
| 5 to 9 Year Old | 328 (100.0%) | 0 (0.0%) |
| 10 to 14 Year Olds | 195 (100.0%) | 0 (0.0%) |
| 15 to 17 Year Olds | 166 (100.0%) | 0 (0.0%) |
| 18 to 19 Year Olds | 102 (60.4%) | 67 (39.6%) |
| 20 to 24 Year Olds | 34 (35.0%) | 63 (64.9%) |
| 25 to 34 Year Olds | 0 (0.0%) | 0 (0.0%) |
| 35 Years and over | 0 (0.0%) | 0 (0.0%) |
| Total | 825 (86.4%) | 130 (13.6%) |
Educational Attainment by Field of Study in Boiling Springs
Education (243 | 20.7%), social sciences (164 | 14.0%), communications (151 | 12.8%), bio, nature & agricultural (135 | 11.5%), and computers & mathematics (112 | 9.5%) are the most common fields of study among 1,176 individuals in Boiling Springs who have obtained a bachelor's degree or higher.
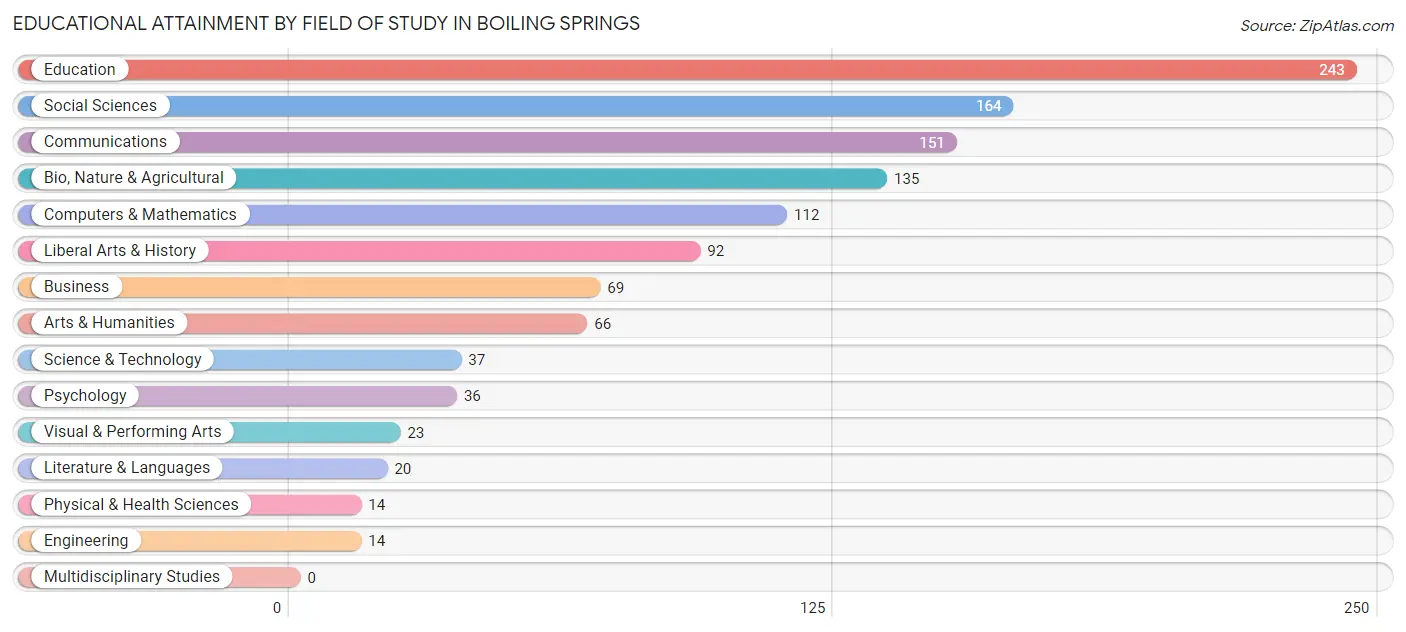
| Field of Study | # Graduates | % Graduates |
| Computers & Mathematics | 112 | 9.5% |
| Bio, Nature & Agricultural | 135 | 11.5% |
| Physical & Health Sciences | 14 | 1.2% |
| Psychology | 36 | 3.1% |
| Social Sciences | 164 | 14.0% |
| Engineering | 14 | 1.2% |
| Multidisciplinary Studies | 0 | 0.0% |
| Science & Technology | 37 | 3.2% |
| Business | 69 | 5.9% |
| Education | 243 | 20.7% |
| Literature & Languages | 20 | 1.7% |
| Liberal Arts & History | 92 | 7.8% |
| Visual & Performing Arts | 23 | 2.0% |
| Communications | 151 | 12.8% |
| Arts & Humanities | 66 | 5.6% |
| Total | 1,176 | 100.0% |
Transportation & Commute in Boiling Springs
Vehicle Availability by Sex in Boiling Springs
The most prevalent vehicle ownership categories in Boiling Springs are males with 2 vehicles (295, accounting for 35.3%) and females with 2 vehicles (317, making up 31.0%).
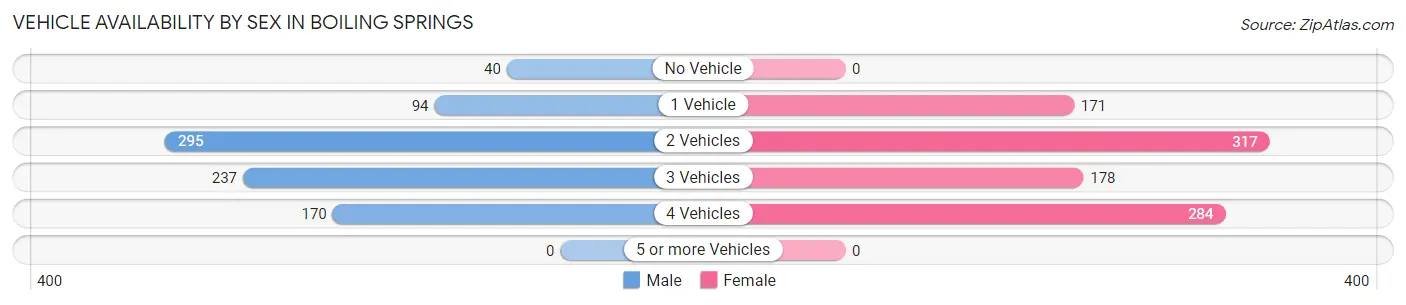
| Vehicles Available | Male | Female |
| No Vehicle | 40 (4.8%) | 0 (0.0%) |
| 1 Vehicle | 94 (11.2%) | 171 (18.0%) |
| 2 Vehicles | 295 (35.3%) | 317 (33.4%) |
| 3 Vehicles | 237 (28.3%) | 178 (18.7%) |
| 4 Vehicles | 170 (20.3%) | 284 (29.9%) |
| 5 or more Vehicles | 0 (0.0%) | 0 (0.0%) |
| Total | 836 (100.0%) | 950 (100.0%) |
Commute Time in Boiling Springs
The most frequently occuring commute durations in Boiling Springs are 10 to 14 minutes (560 commuters, 35.1%), 15 to 19 minutes (429 commuters, 26.9%), and 30 to 34 minutes (130 commuters, 8.2%).
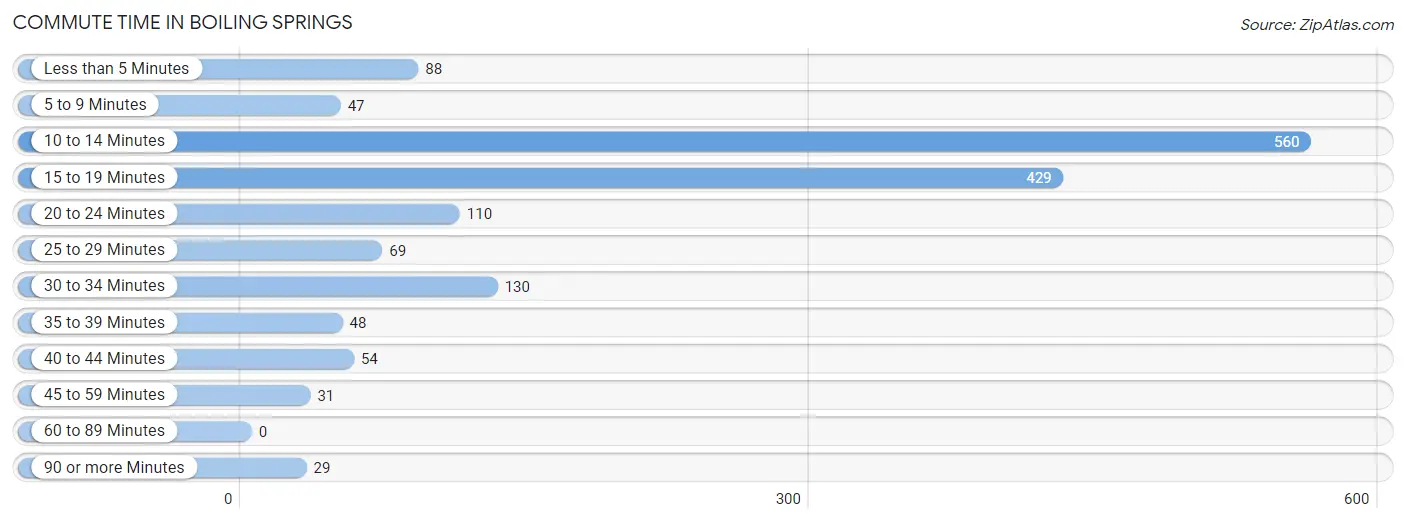
| Commute Time | # Commuters | % Commuters |
| Less than 5 Minutes | 88 | 5.5% |
| 5 to 9 Minutes | 47 | 2.9% |
| 10 to 14 Minutes | 560 | 35.1% |
| 15 to 19 Minutes | 429 | 26.9% |
| 20 to 24 Minutes | 110 | 6.9% |
| 25 to 29 Minutes | 69 | 4.3% |
| 30 to 34 Minutes | 130 | 8.2% |
| 35 to 39 Minutes | 48 | 3.0% |
| 40 to 44 Minutes | 54 | 3.4% |
| 45 to 59 Minutes | 31 | 1.9% |
| 60 to 89 Minutes | 0 | 0.0% |
| 90 or more Minutes | 29 | 1.8% |
Commute Time by Sex in Boiling Springs
The most common commute times in Boiling Springs are 15 to 19 minutes (231 commuters, 32.0%) for males and 10 to 14 minutes (351 commuters, 40.2%) for females.
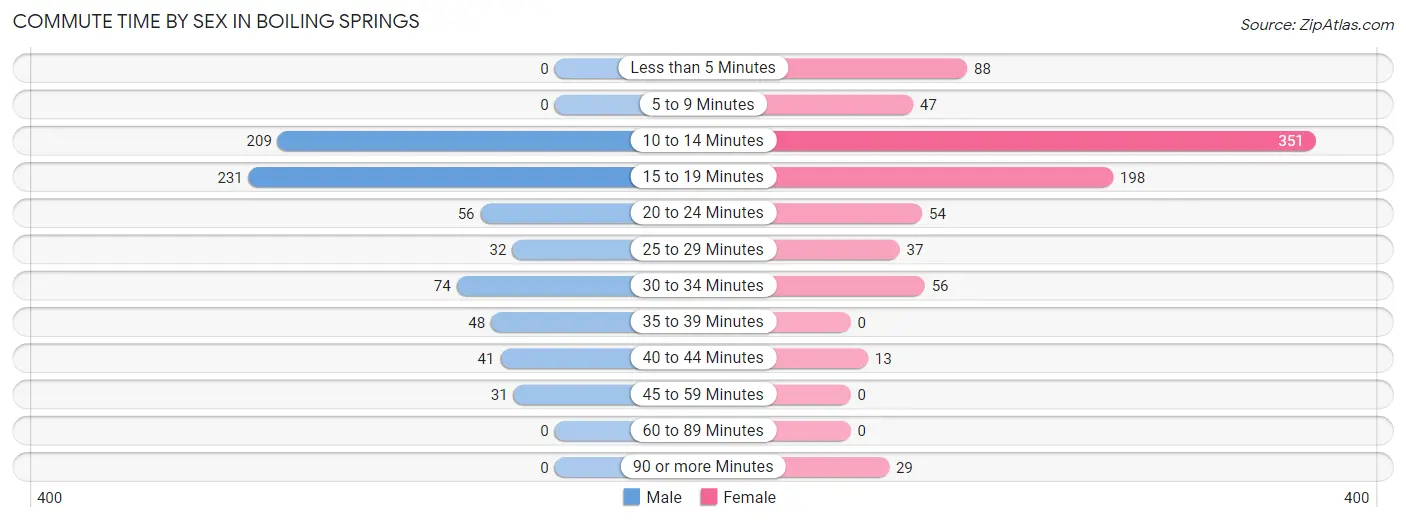
| Commute Time | Male | Female |
| Less than 5 Minutes | 0 (0.0%) | 88 (10.1%) |
| 5 to 9 Minutes | 0 (0.0%) | 47 (5.4%) |
| 10 to 14 Minutes | 209 (28.9%) | 351 (40.2%) |
| 15 to 19 Minutes | 231 (32.0%) | 198 (22.7%) |
| 20 to 24 Minutes | 56 (7.8%) | 54 (6.2%) |
| 25 to 29 Minutes | 32 (4.4%) | 37 (4.2%) |
| 30 to 34 Minutes | 74 (10.2%) | 56 (6.4%) |
| 35 to 39 Minutes | 48 (6.7%) | 0 (0.0%) |
| 40 to 44 Minutes | 41 (5.7%) | 13 (1.5%) |
| 45 to 59 Minutes | 31 (4.3%) | 0 (0.0%) |
| 60 to 89 Minutes | 0 (0.0%) | 0 (0.0%) |
| 90 or more Minutes | 0 (0.0%) | 29 (3.3%) |
Time of Departure to Work by Sex in Boiling Springs
The most frequent times of departure to work in Boiling Springs are 12:00 PM to 3:59 PM (148, 20.5%) for males and 9:00 AM to 9:59 AM (221, 25.3%) for females.
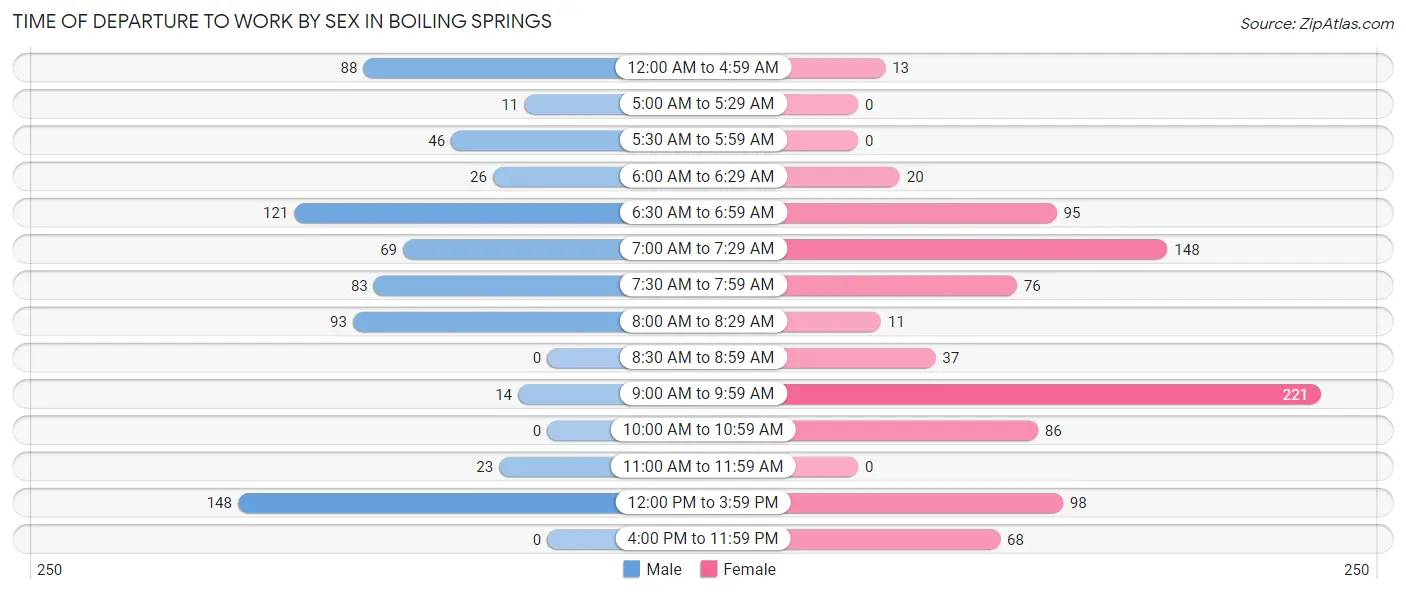
| Time of Departure | Male | Female |
| 12:00 AM to 4:59 AM | 88 (12.2%) | 13 (1.5%) |
| 5:00 AM to 5:29 AM | 11 (1.5%) | 0 (0.0%) |
| 5:30 AM to 5:59 AM | 46 (6.4%) | 0 (0.0%) |
| 6:00 AM to 6:29 AM | 26 (3.6%) | 20 (2.3%) |
| 6:30 AM to 6:59 AM | 121 (16.8%) | 95 (10.9%) |
| 7:00 AM to 7:29 AM | 69 (9.6%) | 148 (17.0%) |
| 7:30 AM to 7:59 AM | 83 (11.5%) | 76 (8.7%) |
| 8:00 AM to 8:29 AM | 93 (12.9%) | 11 (1.3%) |
| 8:30 AM to 8:59 AM | 0 (0.0%) | 37 (4.2%) |
| 9:00 AM to 9:59 AM | 14 (1.9%) | 221 (25.3%) |
| 10:00 AM to 10:59 AM | 0 (0.0%) | 86 (9.9%) |
| 11:00 AM to 11:59 AM | 23 (3.2%) | 0 (0.0%) |
| 12:00 PM to 3:59 PM | 148 (20.5%) | 98 (11.2%) |
| 4:00 PM to 11:59 PM | 0 (0.0%) | 68 (7.8%) |
| Total | 722 (100.0%) | 873 (100.0%) |
Housing Occupancy in Boiling Springs
Occupancy by Ownership in Boiling Springs
Of the total 1,290 dwellings in Boiling Springs, owner-occupied units account for 986 (76.4%), while renter-occupied units make up 304 (23.6%).
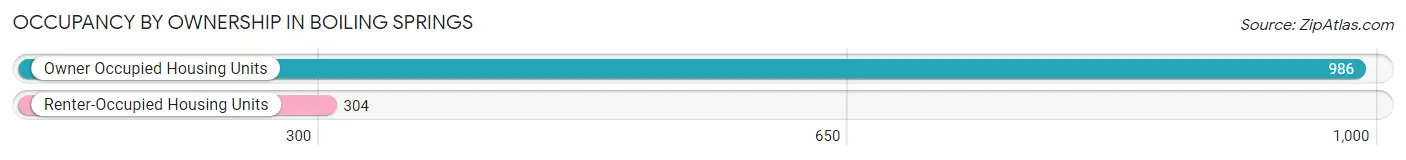
| Occupancy | # Housing Units | % Housing Units |
| Owner Occupied Housing Units | 986 | 76.4% |
| Renter-Occupied Housing Units | 304 | 23.6% |
| Total Occupied Housing Units | 1,290 | 100.0% |
Occupancy by Household Size in Boiling Springs
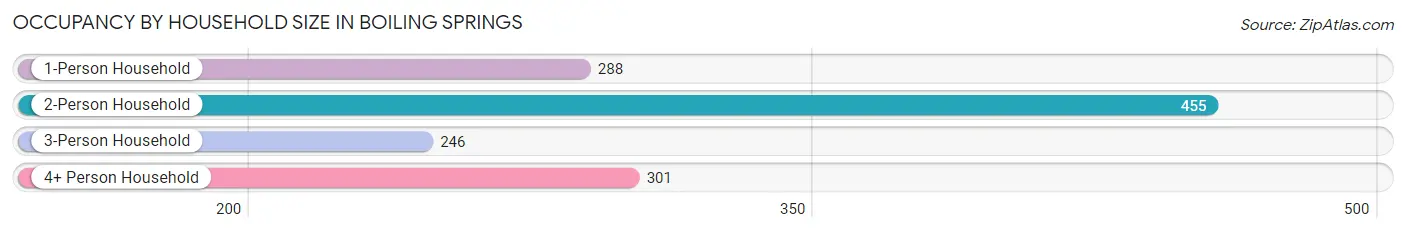
| Household Size | # Housing Units | % Housing Units |
| 1-Person Household | 288 | 22.3% |
| 2-Person Household | 455 | 35.3% |
| 3-Person Household | 246 | 19.1% |
| 4+ Person Household | 301 | 23.3% |
| Total Housing Units | 1,290 | 100.0% |
Occupancy by Ownership by Household Size in Boiling Springs
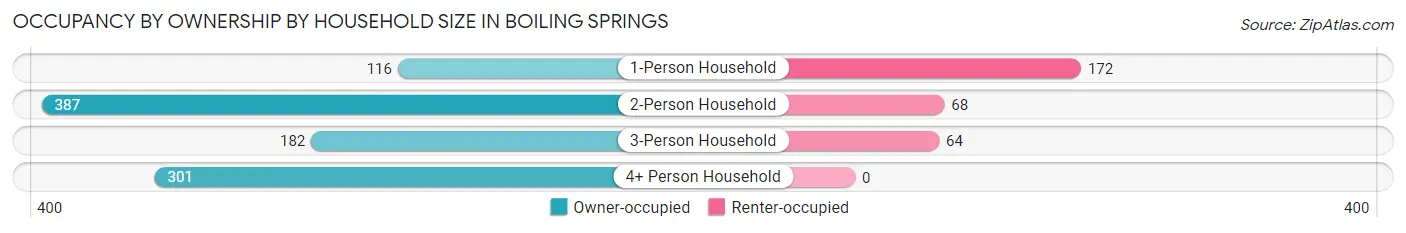
| Household Size | Owner-occupied | Renter-occupied |
| 1-Person Household | 116 (40.3%) | 172 (59.7%) |
| 2-Person Household | 387 (85.1%) | 68 (14.9%) |
| 3-Person Household | 182 (74.0%) | 64 (26.0%) |
| 4+ Person Household | 301 (100.0%) | 0 (0.0%) |
| Total Housing Units | 986 (76.4%) | 304 (23.6%) |
Occupancy by Educational Attainment in Boiling Springs
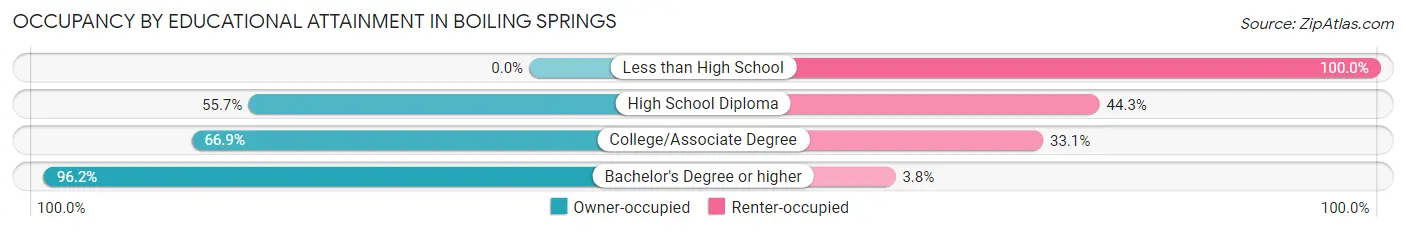
| Household Size | Owner-occupied | Renter-occupied |
| Less than High School | 0 (0.0%) | 38 (100.0%) |
| High School Diploma | 137 (55.7%) | 109 (44.3%) |
| College/Associate Degree | 271 (66.9%) | 134 (33.1%) |
| Bachelor's Degree or higher | 578 (96.2%) | 23 (3.8%) |
Occupancy by Age of Householder in Boiling Springs
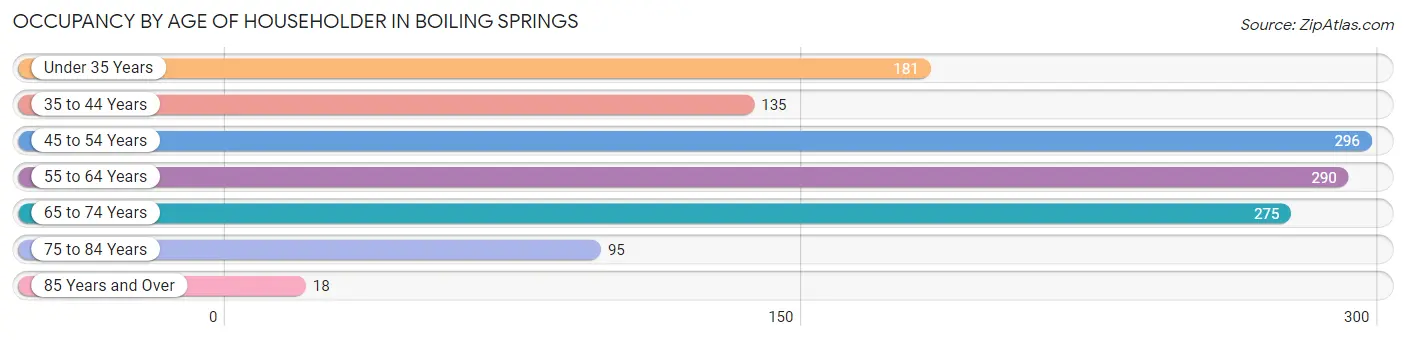
| Age Bracket | # Households | % Households |
| Under 35 Years | 181 | 14.0% |
| 35 to 44 Years | 135 | 10.5% |
| 45 to 54 Years | 296 | 23.0% |
| 55 to 64 Years | 290 | 22.5% |
| 65 to 74 Years | 275 | 21.3% |
| 75 to 84 Years | 95 | 7.4% |
| 85 Years and Over | 18 | 1.4% |
| Total | 1,290 | 100.0% |
Housing Finances in Boiling Springs
Median Income by Occupancy in Boiling Springs
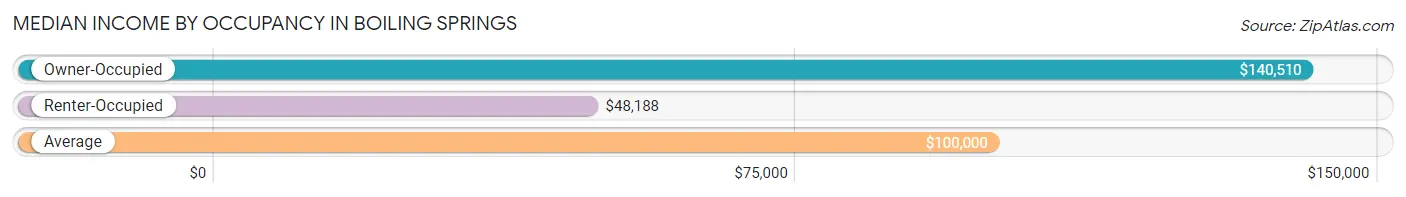
| Occupancy Type | # Households | Median Income |
| Owner-Occupied | 986 (76.4%) | $140,510 |
| Renter-Occupied | 304 (23.6%) | $48,188 |
| Average | 1,290 (100.0%) | $100,000 |
Occupancy by Householder Income Bracket in Boiling Springs
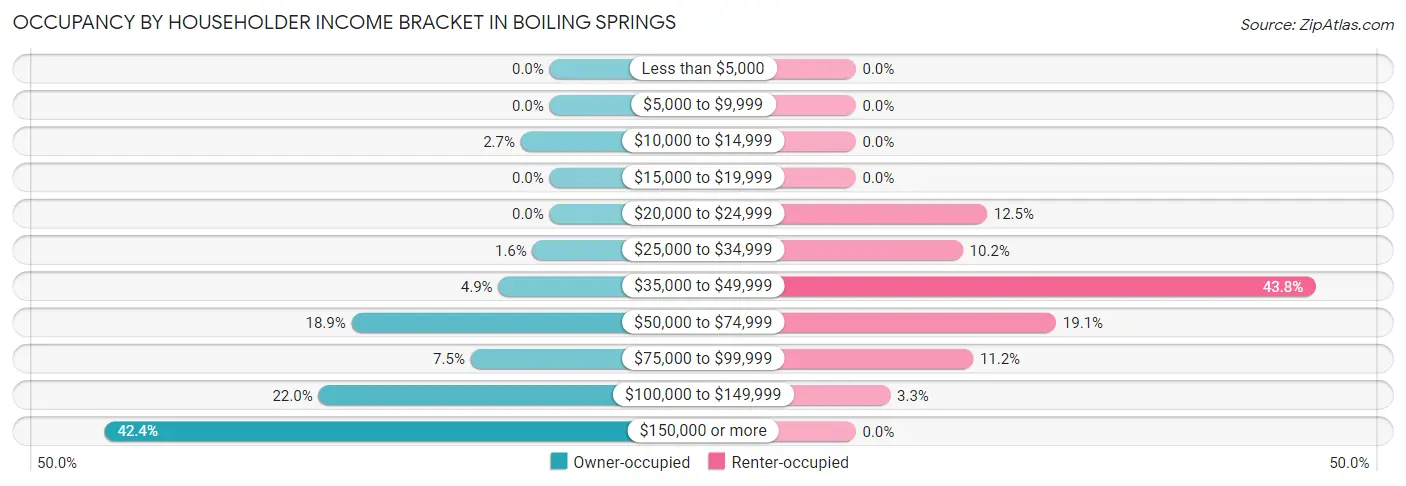
| Income Bracket | Owner-occupied | Renter-occupied |
| Less than $5,000 | 0 (0.0%) | 0 (0.0%) |
| $5,000 to $9,999 | 0 (0.0%) | 0 (0.0%) |
| $10,000 to $14,999 | 27 (2.7%) | 0 (0.0%) |
| $15,000 to $19,999 | 0 (0.0%) | 0 (0.0%) |
| $20,000 to $24,999 | 0 (0.0%) | 38 (12.5%) |
| $25,000 to $34,999 | 16 (1.6%) | 31 (10.2%) |
| $35,000 to $49,999 | 48 (4.9%) | 133 (43.8%) |
| $50,000 to $74,999 | 186 (18.9%) | 58 (19.1%) |
| $75,000 to $99,999 | 74 (7.5%) | 34 (11.2%) |
| $100,000 to $149,999 | 217 (22.0%) | 10 (3.3%) |
| $150,000 or more | 418 (42.4%) | 0 (0.0%) |
| Total | 986 (100.0%) | 304 (100.0%) |
Monthly Housing Cost Tiers in Boiling Springs
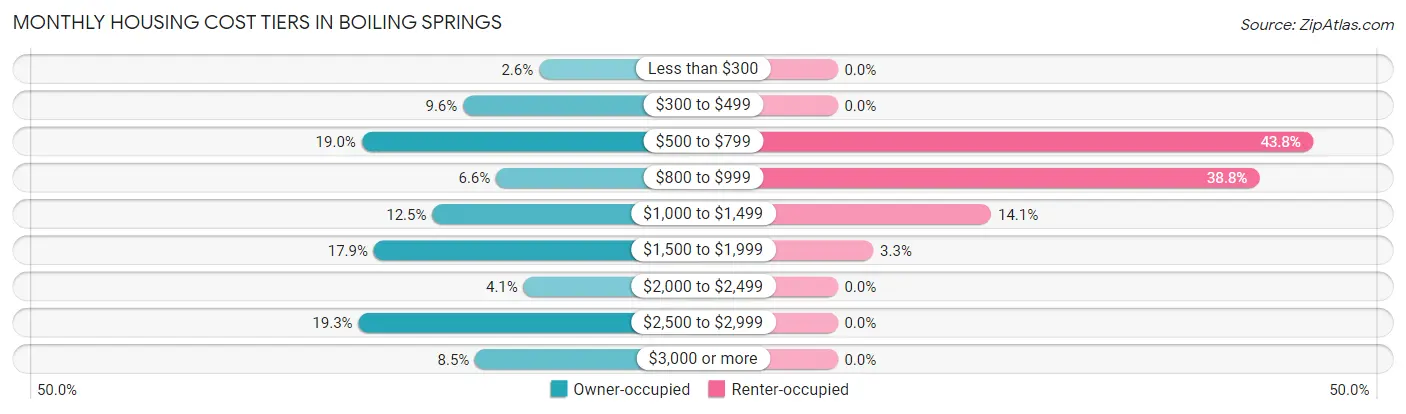
| Monthly Cost | Owner-occupied | Renter-occupied |
| Less than $300 | 26 (2.6%) | 0 (0.0%) |
| $300 to $499 | 95 (9.6%) | 0 (0.0%) |
| $500 to $799 | 187 (19.0%) | 133 (43.8%) |
| $800 to $999 | 65 (6.6%) | 118 (38.8%) |
| $1,000 to $1,499 | 123 (12.5%) | 43 (14.1%) |
| $1,500 to $1,999 | 176 (17.8%) | 10 (3.3%) |
| $2,000 to $2,499 | 40 (4.1%) | 0 (0.0%) |
| $2,500 to $2,999 | 190 (19.3%) | 0 (0.0%) |
| $3,000 or more | 84 (8.5%) | 0 (0.0%) |
| Total | 986 (100.0%) | 304 (100.0%) |
Physical Housing Characteristics in Boiling Springs
Housing Structures in Boiling Springs
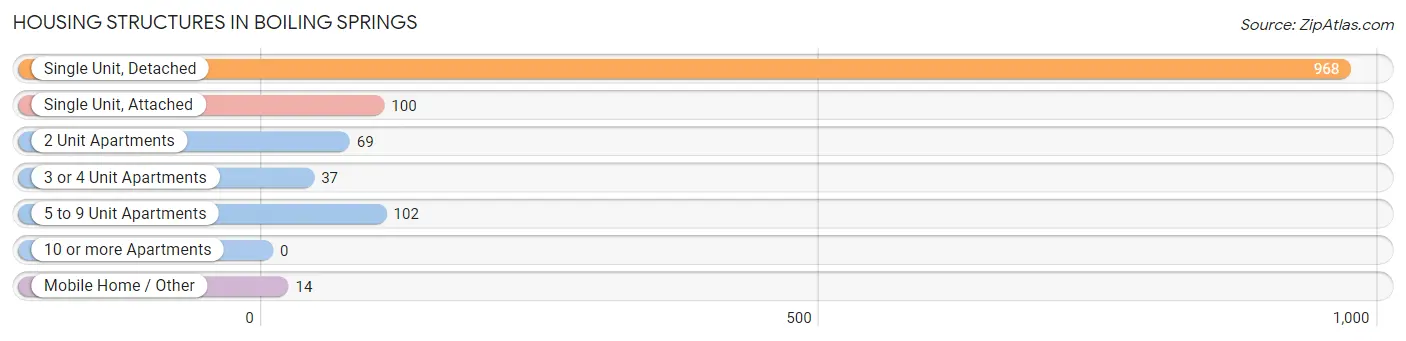
| Structure Type | # Housing Units | % Housing Units |
| Single Unit, Detached | 968 | 75.0% |
| Single Unit, Attached | 100 | 7.7% |
| 2 Unit Apartments | 69 | 5.3% |
| 3 or 4 Unit Apartments | 37 | 2.9% |
| 5 to 9 Unit Apartments | 102 | 7.9% |
| 10 or more Apartments | 0 | 0.0% |
| Mobile Home / Other | 14 | 1.1% |
| Total | 1,290 | 100.0% |
Housing Structures by Occupancy in Boiling Springs
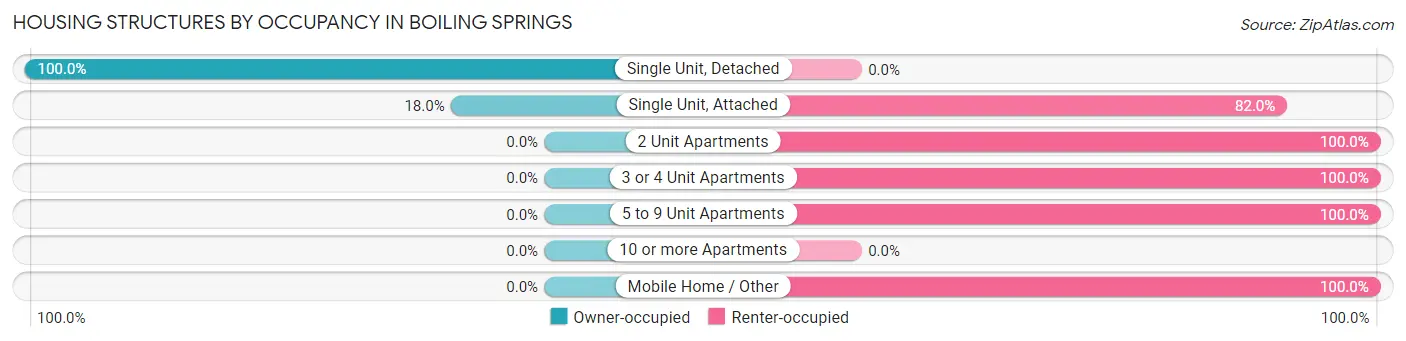
| Structure Type | Owner-occupied | Renter-occupied |
| Single Unit, Detached | 968 (100.0%) | 0 (0.0%) |
| Single Unit, Attached | 18 (18.0%) | 82 (82.0%) |
| 2 Unit Apartments | 0 (0.0%) | 69 (100.0%) |
| 3 or 4 Unit Apartments | 0 (0.0%) | 37 (100.0%) |
| 5 to 9 Unit Apartments | 0 (0.0%) | 102 (100.0%) |
| 10 or more Apartments | 0 (0.0%) | 0 (0.0%) |
| Mobile Home / Other | 0 (0.0%) | 14 (100.0%) |
| Total | 986 (76.4%) | 304 (23.6%) |
Housing Structures by Number of Rooms in Boiling Springs
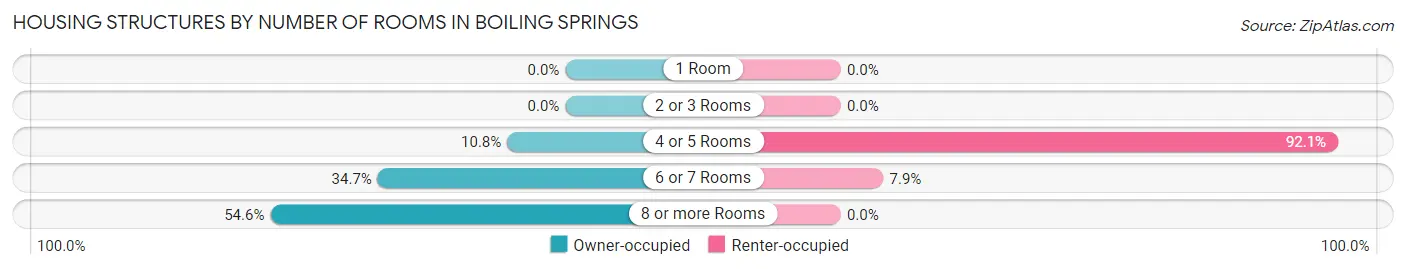
| Number of Rooms | Owner-occupied | Renter-occupied |
| 1 Room | 0 (0.0%) | 0 (0.0%) |
| 2 or 3 Rooms | 0 (0.0%) | 0 (0.0%) |
| 4 or 5 Rooms | 106 (10.7%) | 280 (92.1%) |
| 6 or 7 Rooms | 342 (34.7%) | 24 (7.9%) |
| 8 or more Rooms | 538 (54.6%) | 0 (0.0%) |
| Total | 986 (100.0%) | 304 (100.0%) |
Housing Structure by Heating Type in Boiling Springs
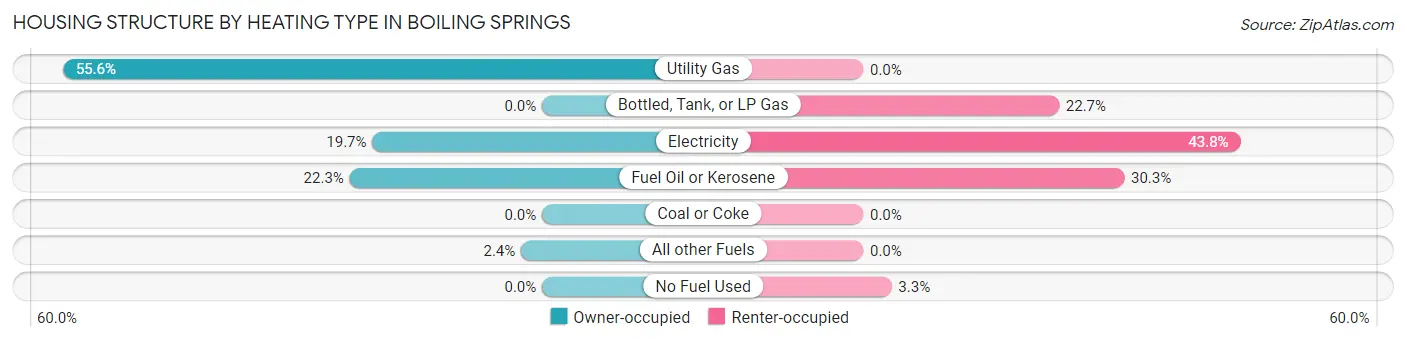
| Heating Type | Owner-occupied | Renter-occupied |
| Utility Gas | 548 (55.6%) | 0 (0.0%) |
| Bottled, Tank, or LP Gas | 0 (0.0%) | 69 (22.7%) |
| Electricity | 194 (19.7%) | 133 (43.8%) |
| Fuel Oil or Kerosene | 220 (22.3%) | 92 (30.3%) |
| Coal or Coke | 0 (0.0%) | 0 (0.0%) |
| All other Fuels | 24 (2.4%) | 0 (0.0%) |
| No Fuel Used | 0 (0.0%) | 10 (3.3%) |
| Total | 986 (100.0%) | 304 (100.0%) |
Household Vehicle Usage in Boiling Springs
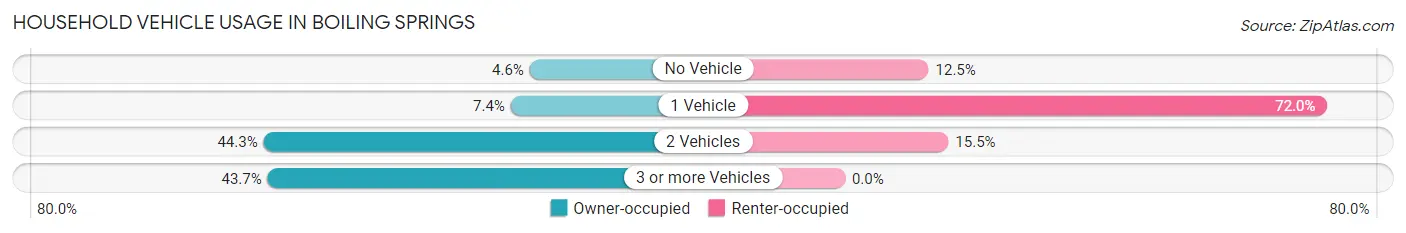
| Vehicles per Household | Owner-occupied | Renter-occupied |
| No Vehicle | 45 (4.6%) | 38 (12.5%) |
| 1 Vehicle | 73 (7.4%) | 219 (72.0%) |
| 2 Vehicles | 437 (44.3%) | 47 (15.5%) |
| 3 or more Vehicles | 431 (43.7%) | 0 (0.0%) |
| Total | 986 (100.0%) | 304 (100.0%) |
Real Estate & Mortgages in Boiling Springs
Real Estate and Mortgage Overview in Boiling Springs
| Characteristic | Without Mortgage | With Mortgage |
| Housing Units | 379 | 607 |
| Median Property Value | $233,800 | $408,300 |
| Median Household Income | $105,347 | $283 |
| Monthly Housing Costs | $630 | $84 |
| Real Estate Taxes | $2,833 | $0 |
Property Value by Mortgage Status in Boiling Springs
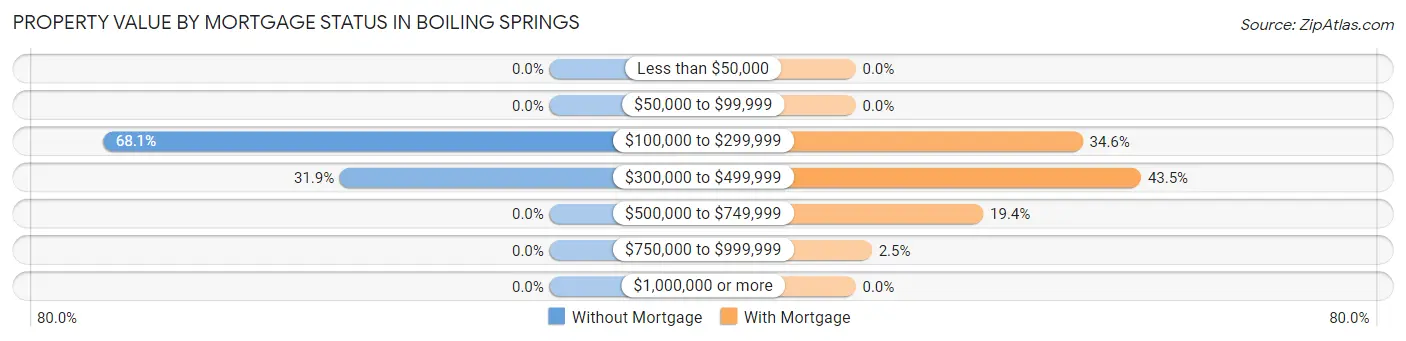
| Property Value | Without Mortgage | With Mortgage |
| Less than $50,000 | 0 (0.0%) | 0 (0.0%) |
| $50,000 to $99,999 | 0 (0.0%) | 0 (0.0%) |
| $100,000 to $299,999 | 258 (68.1%) | 210 (34.6%) |
| $300,000 to $499,999 | 121 (31.9%) | 264 (43.5%) |
| $500,000 to $749,999 | 0 (0.0%) | 118 (19.4%) |
| $750,000 to $999,999 | 0 (0.0%) | 15 (2.5%) |
| $1,000,000 or more | 0 (0.0%) | 0 (0.0%) |
| Total | 379 (100.0%) | 607 (100.0%) |
Household Income by Mortgage Status in Boiling Springs
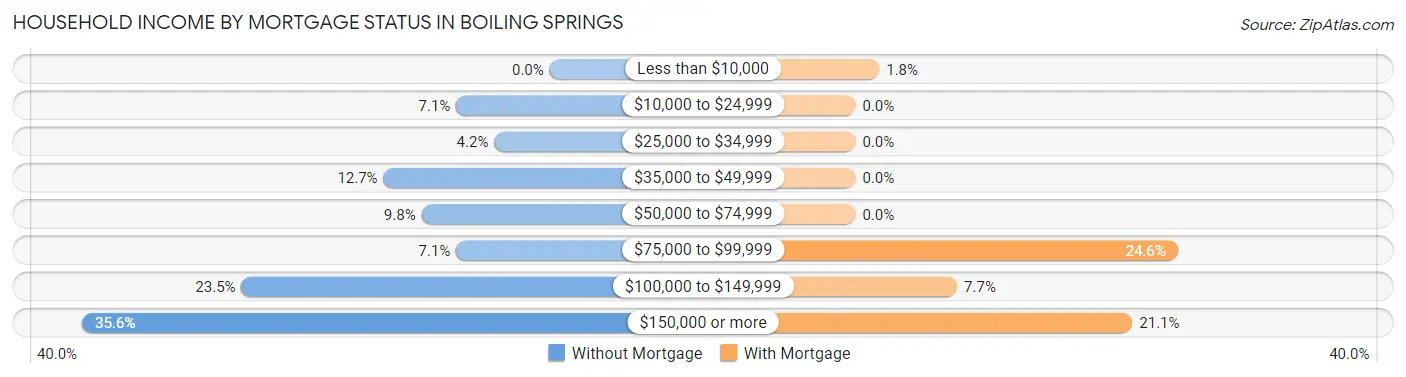
| Household Income | Without Mortgage | With Mortgage |
| Less than $10,000 | 0 (0.0%) | 11 (1.8%) |
| $10,000 to $24,999 | 27 (7.1%) | 0 (0.0%) |
| $25,000 to $34,999 | 16 (4.2%) | 0 (0.0%) |
| $35,000 to $49,999 | 48 (12.7%) | 0 (0.0%) |
| $50,000 to $74,999 | 37 (9.8%) | 0 (0.0%) |
| $75,000 to $99,999 | 27 (7.1%) | 149 (24.5%) |
| $100,000 to $149,999 | 89 (23.5%) | 47 (7.7%) |
| $150,000 or more | 135 (35.6%) | 128 (21.1%) |
| Total | 379 (100.0%) | 607 (100.0%) |
Property Value to Household Income Ratio in Boiling Springs
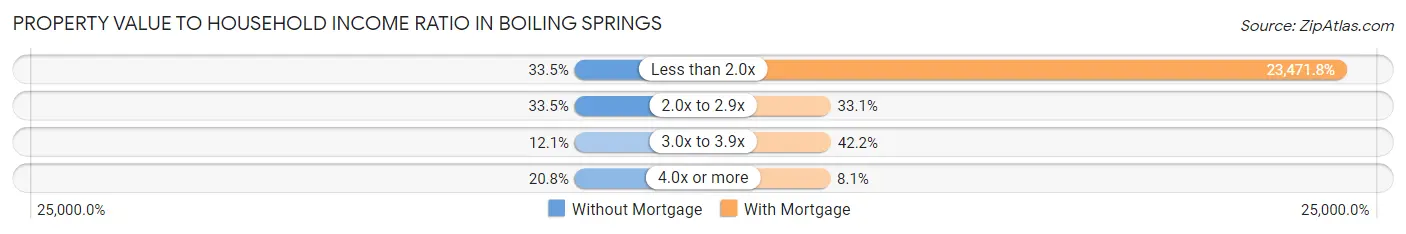
| Value-to-Income Ratio | Without Mortgage | With Mortgage |
| Less than 2.0x | 127 (33.5%) | 142,474 (23,471.8%) |
| 2.0x to 2.9x | 127 (33.5%) | 201 (33.1%) |
| 3.0x to 3.9x | 46 (12.1%) | 256 (42.2%) |
| 4.0x or more | 79 (20.8%) | 49 (8.1%) |
| Total | 379 (100.0%) | 607 (100.0%) |
Real Estate Taxes by Mortgage Status in Boiling Springs
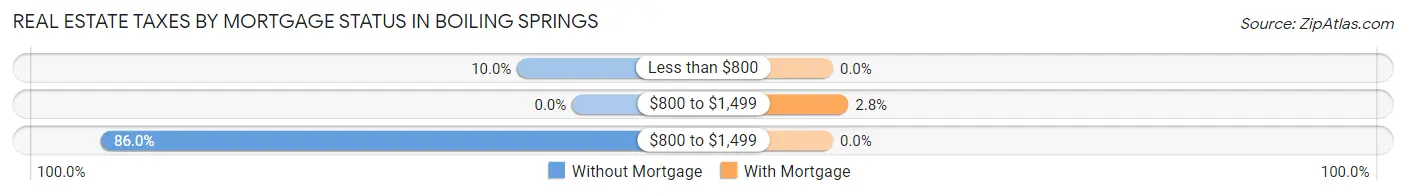
| Property Taxes | Without Mortgage | With Mortgage |
| Less than $800 | 38 (10.0%) | 0 (0.0%) |
| $800 to $1,499 | 0 (0.0%) | 17 (2.8%) |
| $800 to $1,499 | 326 (86.0%) | 0 (0.0%) |
| Total | 379 (100.0%) | 607 (100.0%) |
Health & Disability in Boiling Springs
Health Insurance Coverage by Age in Boiling Springs
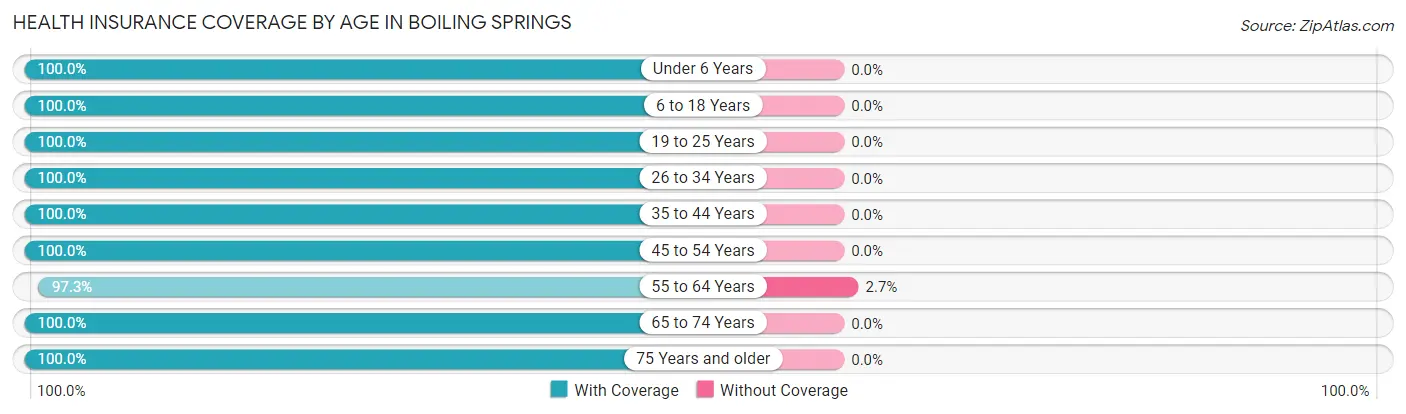
| Age Bracket | With Coverage | Without Coverage |
| Under 6 Years | 177 (100.0%) | 0 (0.0%) |
| 6 to 18 Years | 826 (100.0%) | 0 (0.0%) |
| 19 to 25 Years | 234 (100.0%) | 0 (0.0%) |
| 26 to 34 Years | 245 (100.0%) | 0 (0.0%) |
| 35 to 44 Years | 338 (100.0%) | 0 (0.0%) |
| 45 to 54 Years | 570 (100.0%) | 0 (0.0%) |
| 55 to 64 Years | 511 (97.3%) | 14 (2.7%) |
| 65 to 74 Years | 457 (100.0%) | 0 (0.0%) |
| 75 Years and older | 212 (100.0%) | 0 (0.0%) |
| Total | 3,570 (99.6%) | 14 (0.4%) |
Health Insurance Coverage by Citizenship Status in Boiling Springs
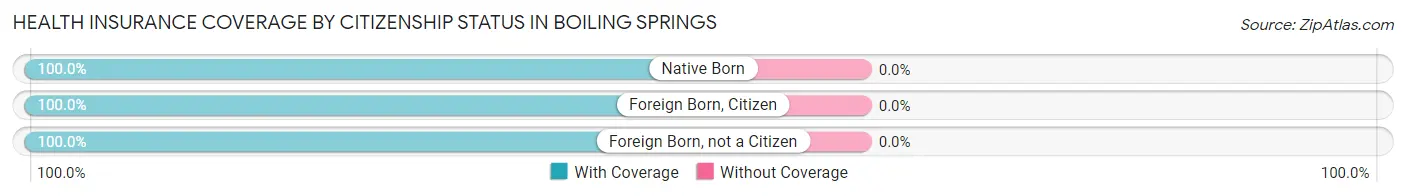
| Citizenship Status | With Coverage | Without Coverage |
| Native Born | 177 (100.0%) | 0 (0.0%) |
| Foreign Born, Citizen | 826 (100.0%) | 0 (0.0%) |
| Foreign Born, not a Citizen | 234 (100.0%) | 0 (0.0%) |
Health Insurance Coverage by Household Income in Boiling Springs
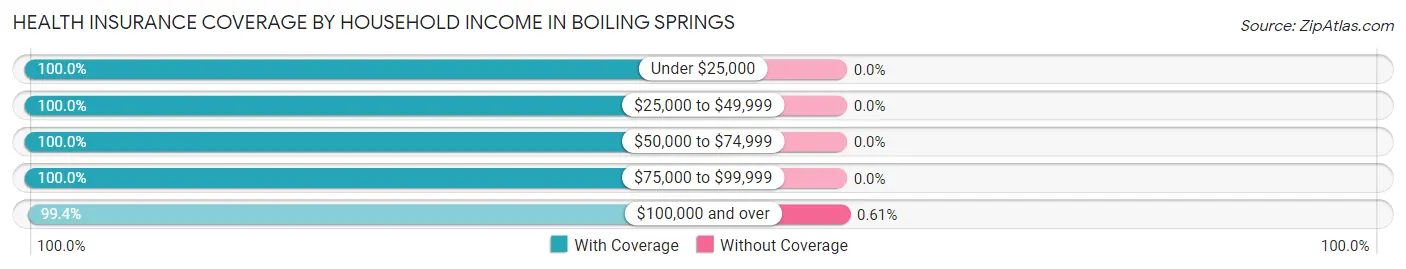
| Household Income | With Coverage | Without Coverage |
| Under $25,000 | 65 (100.0%) | 0 (0.0%) |
| $25,000 to $49,999 | 530 (100.0%) | 0 (0.0%) |
| $50,000 to $74,999 | 484 (100.0%) | 0 (0.0%) |
| $75,000 to $99,999 | 213 (100.0%) | 0 (0.0%) |
| $100,000 and over | 2,278 (99.4%) | 14 (0.6%) |
Public vs Private Health Insurance Coverage by Age in Boiling Springs
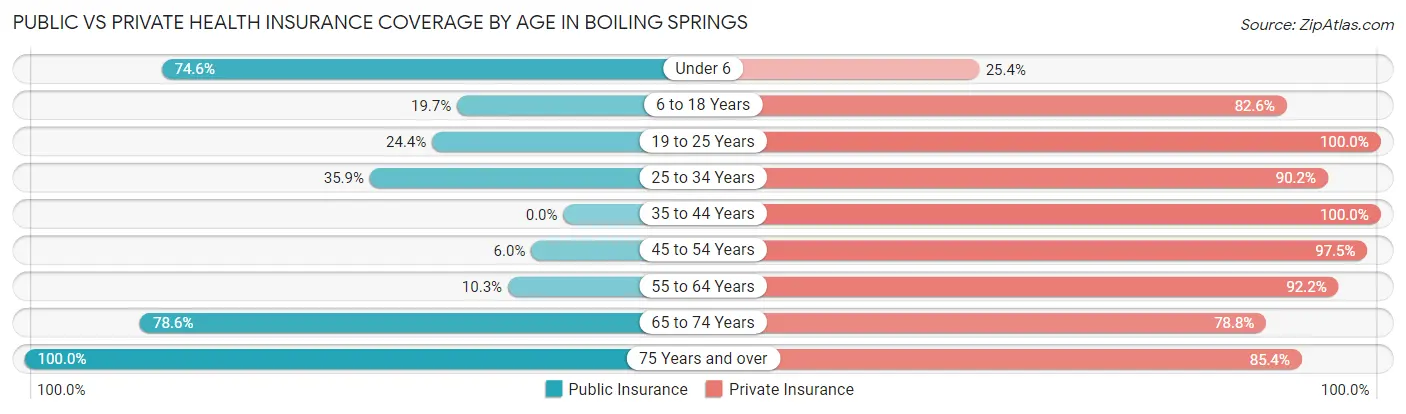
| Age Bracket | Public Insurance | Private Insurance |
| Under 6 | 132 (74.6%) | 45 (25.4%) |
| 6 to 18 Years | 163 (19.7%) | 682 (82.6%) |
| 19 to 25 Years | 57 (24.4%) | 234 (100.0%) |
| 25 to 34 Years | 88 (35.9%) | 221 (90.2%) |
| 35 to 44 Years | 0 (0.0%) | 338 (100.0%) |
| 45 to 54 Years | 34 (6.0%) | 556 (97.5%) |
| 55 to 64 Years | 54 (10.3%) | 484 (92.2%) |
| 65 to 74 Years | 359 (78.6%) | 360 (78.8%) |
| 75 Years and over | 212 (100.0%) | 181 (85.4%) |
| Total | 1,099 (30.7%) | 3,101 (86.5%) |
Disability Status by Sex by Age in Boiling Springs
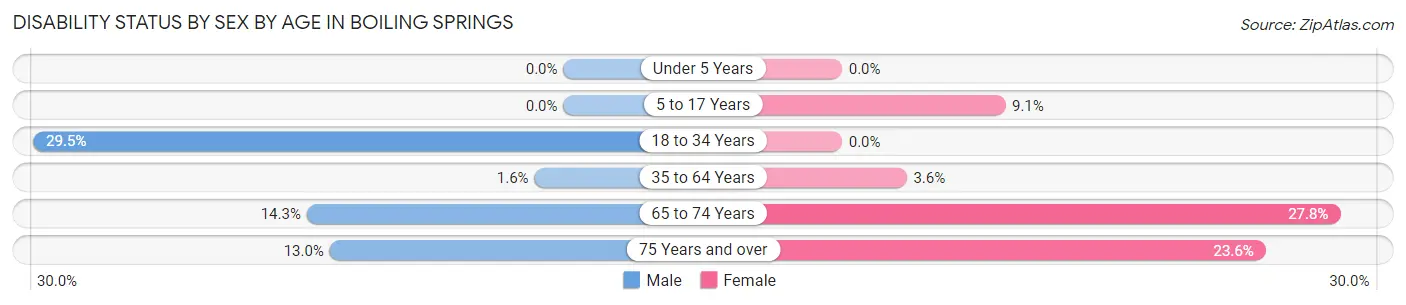
| Age Bracket | Male | Female |
| Under 5 Years | 0 (0.0%) | 0 (0.0%) |
| 5 to 17 Years | 0 (0.0%) | 20 (9.1%) |
| 18 to 34 Years | 57 (29.5%) | 0 (0.0%) |
| 35 to 64 Years | 11 (1.6%) | 27 (3.6%) |
| 65 to 74 Years | 38 (14.3%) | 53 (27.8%) |
| 75 Years and over | 16 (13.0%) | 21 (23.6%) |
Disability Class by Sex by Age in Boiling Springs
Disability Class: Hearing Difficulty
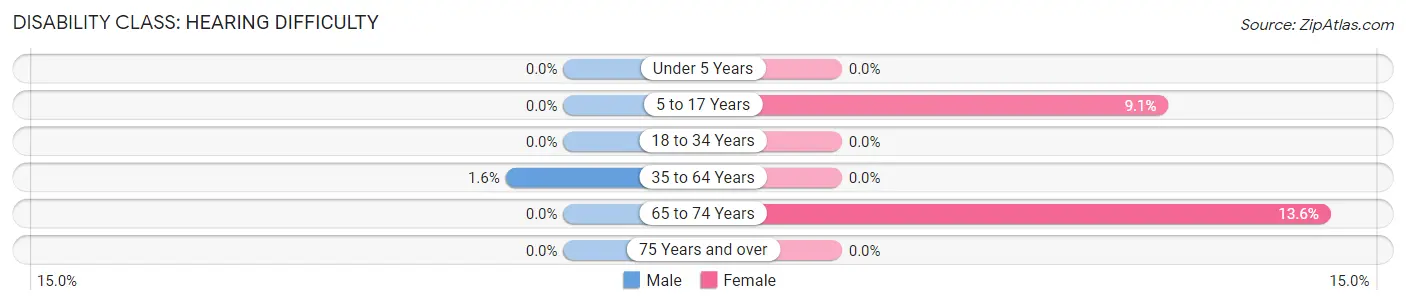
| Age Bracket | Male | Female |
| Under 5 Years | 0 (0.0%) | 0 (0.0%) |
| 5 to 17 Years | 0 (0.0%) | 20 (9.1%) |
| 18 to 34 Years | 0 (0.0%) | 0 (0.0%) |
| 35 to 64 Years | 11 (1.6%) | 0 (0.0%) |
| 65 to 74 Years | 0 (0.0%) | 26 (13.6%) |
| 75 Years and over | 0 (0.0%) | 0 (0.0%) |
Disability Class: Vision Difficulty
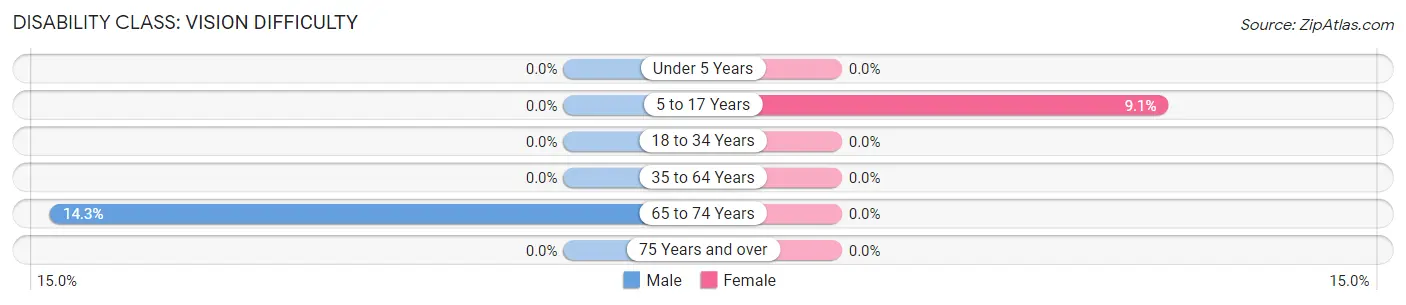
| Age Bracket | Male | Female |
| Under 5 Years | 0 (0.0%) | 0 (0.0%) |
| 5 to 17 Years | 0 (0.0%) | 20 (9.1%) |
| 18 to 34 Years | 0 (0.0%) | 0 (0.0%) |
| 35 to 64 Years | 0 (0.0%) | 0 (0.0%) |
| 65 to 74 Years | 38 (14.3%) | 0 (0.0%) |
| 75 Years and over | 0 (0.0%) | 0 (0.0%) |
Disability Class: Cognitive Difficulty
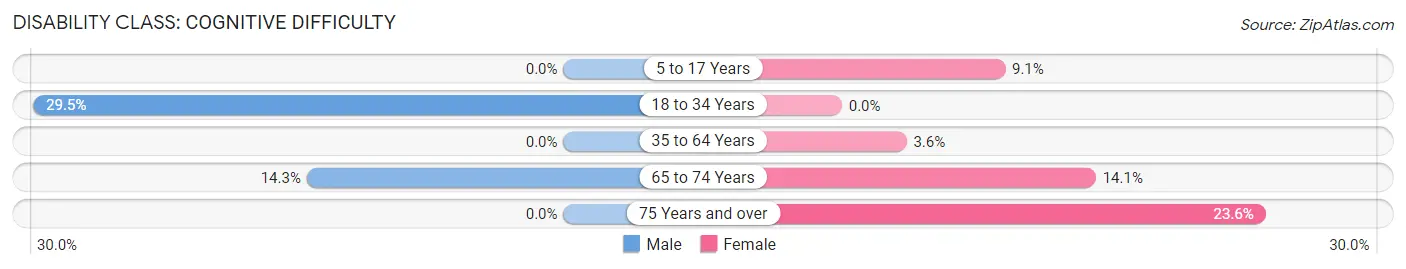
| Age Bracket | Male | Female |
| 5 to 17 Years | 0 (0.0%) | 20 (9.1%) |
| 18 to 34 Years | 57 (29.5%) | 0 (0.0%) |
| 35 to 64 Years | 0 (0.0%) | 27 (3.6%) |
| 65 to 74 Years | 38 (14.3%) | 27 (14.1%) |
| 75 Years and over | 0 (0.0%) | 21 (23.6%) |
Disability Class: Ambulatory Difficulty
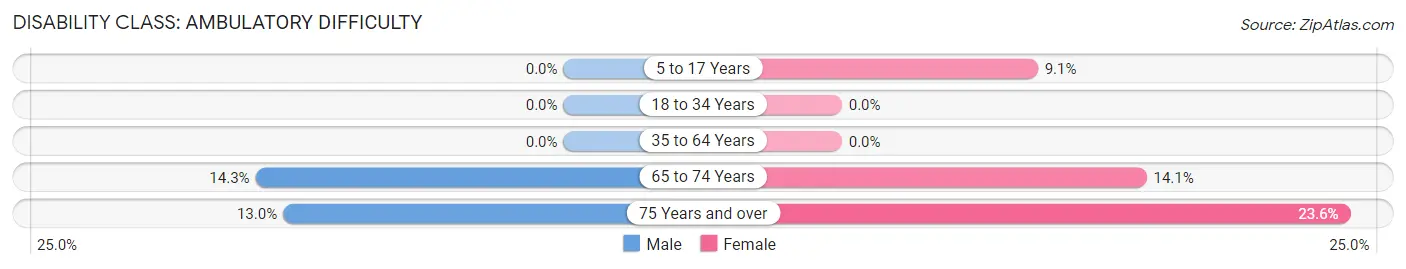
| Age Bracket | Male | Female |
| 5 to 17 Years | 0 (0.0%) | 20 (9.1%) |
| 18 to 34 Years | 0 (0.0%) | 0 (0.0%) |
| 35 to 64 Years | 0 (0.0%) | 0 (0.0%) |
| 65 to 74 Years | 38 (14.3%) | 27 (14.1%) |
| 75 Years and over | 16 (13.0%) | 21 (23.6%) |
Disability Class: Self-Care Difficulty
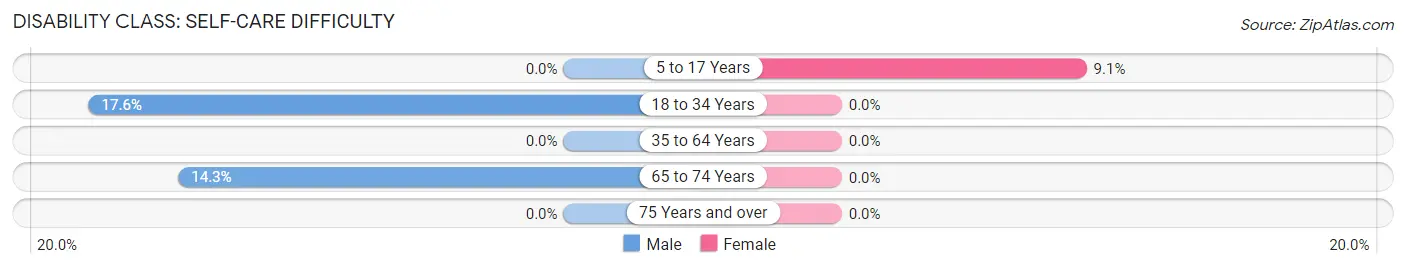
| Age Bracket | Male | Female |
| 5 to 17 Years | 0 (0.0%) | 20 (9.1%) |
| 18 to 34 Years | 34 (17.6%) | 0 (0.0%) |
| 35 to 64 Years | 0 (0.0%) | 0 (0.0%) |
| 65 to 74 Years | 38 (14.3%) | 0 (0.0%) |
| 75 Years and over | 0 (0.0%) | 0 (0.0%) |
Technology Access in Boiling Springs
Computing Device Access in Boiling Springs
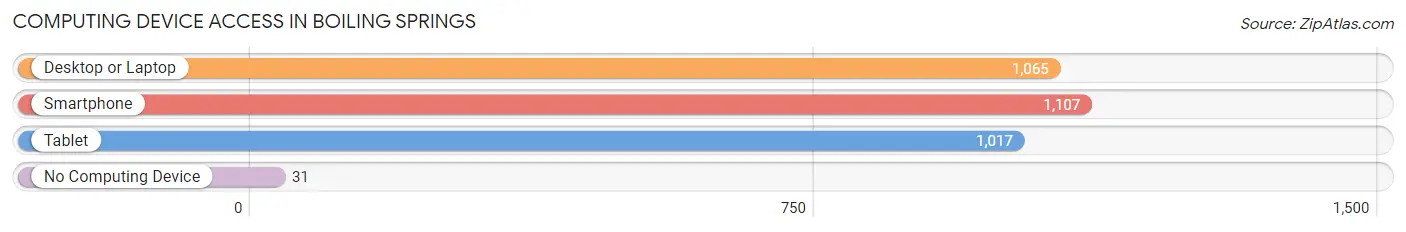
| Device Type | # Households | % Households |
| Desktop or Laptop | 1,065 | 82.6% |
| Smartphone | 1,107 | 85.8% |
| Tablet | 1,017 | 78.8% |
| No Computing Device | 31 | 2.4% |
| Total | 1,290 | 100.0% |
Internet Access in Boiling Springs
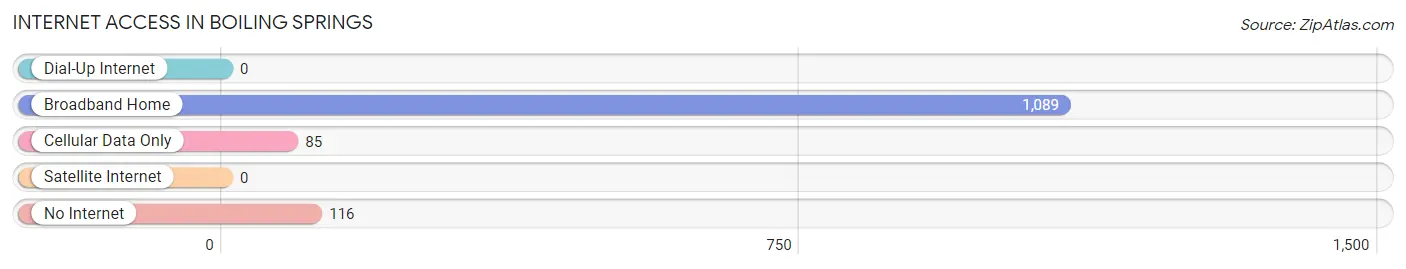
| Internet Type | # Households | % Households |
| Dial-Up Internet | 0 | 0.0% |
| Broadband Home | 1,089 | 84.4% |
| Cellular Data Only | 85 | 6.6% |
| Satellite Internet | 0 | 0.0% |
| No Internet | 116 | 9.0% |
| Total | 1,290 | 100.0% |
Boiling Springs Summary
Boiling Springs is a small borough located in Cumberland County, Pennsylvania. It is situated in the south-central part of the state, approximately 10 miles north of the state capital of Harrisburg. The population of Boiling Springs was 2,717 at the 2010 census.
History
Boiling Springs was founded in 1750 by a group of German settlers who were looking for a place to settle and farm. The area was originally known as “The Springs” due to the numerous natural springs in the area. The name was changed to Boiling Springs in 1820 when a local resident discovered a boiling spring near the town.
The town was officially incorporated in 1845 and was home to a variety of industries, including a grist mill, a saw mill, a tannery, and a woolen mill. The town was also home to a number of churches, including the Boiling Springs United Methodist Church, which was founded in 1845.
Geography
Boiling Springs is located at 40°10'45" North, 77°2'45" West (40.179167, -77.045278). It is situated in the Appalachian Mountains and is surrounded by rolling hills and forests. The town is located near the Appalachian Trail and is a popular destination for hikers and campers.
The town is located approximately 10 miles north of Harrisburg, the state capital, and is accessible via Interstate 81 and U.S. Route 11. The closest major airport is Harrisburg International Airport, which is located approximately 25 miles south of Boiling Springs.
Economy
Boiling Springs is a small, rural community with a primarily agricultural economy. The town is home to a number of farms, including dairy farms, beef farms, and vegetable farms. The town is also home to a number of small businesses, including restaurants, retail stores, and service providers.
The town is also home to a number of educational institutions, including Boiling Springs High School, Boiling Springs Middle School, and Boiling Springs Elementary School. The town is also home to Messiah College, a private Christian college.
Demographics
As of the 2010 census, the population of Boiling Springs was 2,717. The racial makeup of the town was 95.3% White, 1.2% African American, 0.3% Native American, 0.7% Asian, 0.1% Pacific Islander, 0.7% from other races, and 1.7% from two or more races. Hispanic or Latino of any race were 2.2% of the population.
The median income for a household in Boiling Springs was $50,972, and the median income for a family was $60,972. The per capita income for the town was $22,972. About 5.2% of families and 7.2% of the population were below the poverty line, including 8.2% of those under age 18 and 5.2% of those age 65 or over.
Common Questions
What is Per Capita Income in Boiling Springs?
Per Capita income in Boiling Springs is $44,482.
What is the Median Family Income in Boiling Springs?
Median Family Income in Boiling Springs is $140,051.
What is the Median Household income in Boiling Springs?
Median Household Income in Boiling Springs is $100,000.
What is Income or Wage Gap in Boiling Springs?
Income or Wage Gap in Boiling Springs is 41.9%.
Women in Boiling Springs earn 58.1 cents for every dollar earned by a man.
What is Inequality or Gini Index in Boiling Springs?
Inequality or Gini Index in Boiling Springs is 0.38.
What is the Total Population of Boiling Springs?
Total Population of Boiling Springs is 3,584.
What is the Total Male Population of Boiling Springs?
Total Male Population of Boiling Springs is 1,846.
What is the Total Female Population of Boiling Springs?
Total Female Population of Boiling Springs is 1,738.
What is the Ratio of Males per 100 Females in Boiling Springs?
There are 106.21 Males per 100 Females in Boiling Springs.
What is the Ratio of Females per 100 Males in Boiling Springs?
There are 94.15 Females per 100 Males in Boiling Springs.
What is the Median Population Age in Boiling Springs?
Median Population Age in Boiling Springs is 44.7 Years.
What is the Average Family Size in Boiling Springs
Average Family Size in Boiling Springs is 3.2 People.
What is the Average Household Size in Boiling Springs
Average Household Size in Boiling Springs is 2.8 People.
How Large is the Labor Force in Boiling Springs?
There are 1,850 People in the Labor Forcein in Boiling Springs.
What is the Percentage of People in the Labor Force in Boiling Springs?
66.0% of People are in the Labor Force in Boiling Springs.
What is the Unemployment Rate in Boiling Springs?
Unemployment Rate in Boiling Springs is 3.1%.