Yukon, PA Map & Demographics
Yukon Map
Yukon Overview
$28,607
PER CAPITA INCOME
$44,806
AVG FAMILY INCOME
$48,707
AVG HOUSEHOLD INCOME
0.28
INEQUALITY / GINI INDEX
610
TOTAL POPULATION
365
MALE POPULATION
245
FEMALE POPULATION
148.98
MALES / 100 FEMALES
67.12
FEMALES / 100 MALES
58.8
MEDIAN AGE
3.0
AVG FAMILY SIZE
2.4
AVG HOUSEHOLD SIZE
221
LABOR FORCE [ PEOPLE ]
46.8%
PERCENT IN LABOR FORCE
Yukon Zip Codes
Yukon Area Codes
Income in Yukon
Income Overview in Yukon
Per Capita Income in Yukon is $28,607, while median incomes of families and households are $44,806 and $48,707 respectively.
| Characteristic | Number | Measure |
| Per Capita Income | 610 | $28,607 |
| Median Family Income | 166 | $44,806 |
| Mean Family Income | 166 | $57,719 |
| Median Household Income | 256 | $48,707 |
| Mean Household Income | 256 | $66,980 |
| Income Deficit | 166 | $0 |
| Wage / Income Gap (%) | 610 | 0.00% |
| Wage / Income Gap ($) | 610 | 100.00¢ per $1 |
| Gini / Inequality Index | 610 | 0.28 |
Earnings by Sex in Yukon
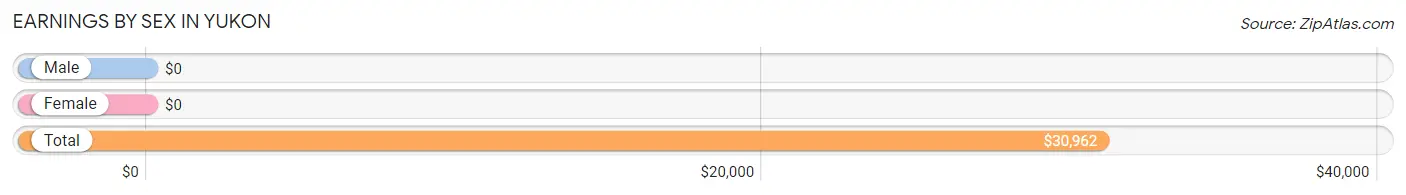
| Sex | Number | Average Earnings |
| Male | 182 (78.4%) | $0 |
| Female | 50 (21.5%) | $0 |
| Total | 232 (100.0%) | $30,962 |
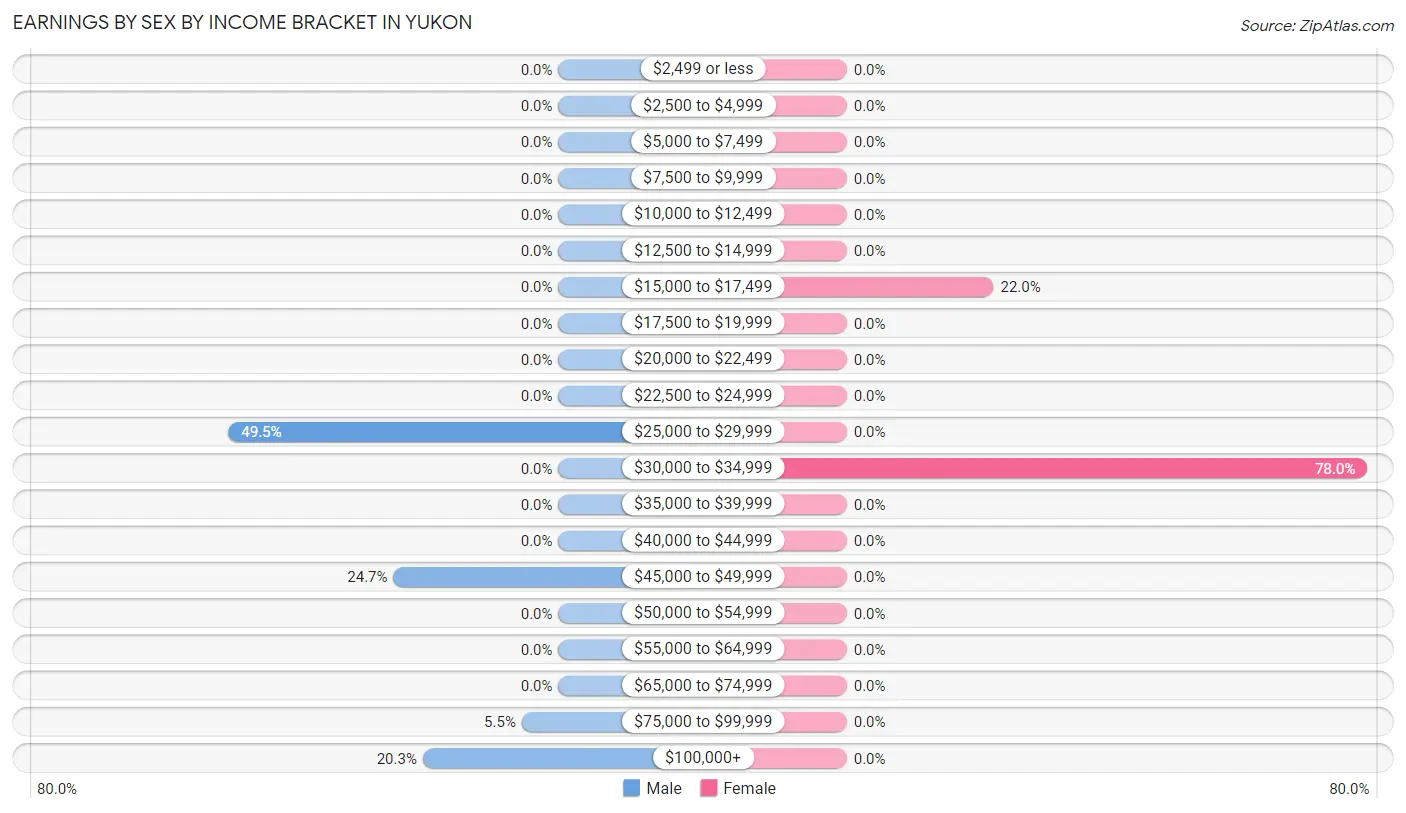
Earnings by Sex by Income Bracket in Yukon
The most common earnings brackets in Yukon are $25,000 to $29,999 for men (90 | 49.4%) and $30,000 to $34,999 for women (39 | 78.0%).
| Income | Male | Female |
| $2,499 or less | 0 (0.0%) | 0 (0.0%) |
| $2,500 to $4,999 | 0 (0.0%) | 0 (0.0%) |
| $5,000 to $7,499 | 0 (0.0%) | 0 (0.0%) |
| $7,500 to $9,999 | 0 (0.0%) | 0 (0.0%) |
| $10,000 to $12,499 | 0 (0.0%) | 0 (0.0%) |
| $12,500 to $14,999 | 0 (0.0%) | 0 (0.0%) |
| $15,000 to $17,499 | 0 (0.0%) | 11 (22.0%) |
| $17,500 to $19,999 | 0 (0.0%) | 0 (0.0%) |
| $20,000 to $22,499 | 0 (0.0%) | 0 (0.0%) |
| $22,500 to $24,999 | 0 (0.0%) | 0 (0.0%) |
| $25,000 to $29,999 | 90 (49.4%) | 0 (0.0%) |
| $30,000 to $34,999 | 0 (0.0%) | 39 (78.0%) |
| $35,000 to $39,999 | 0 (0.0%) | 0 (0.0%) |
| $40,000 to $44,999 | 0 (0.0%) | 0 (0.0%) |
| $45,000 to $49,999 | 45 (24.7%) | 0 (0.0%) |
| $50,000 to $54,999 | 0 (0.0%) | 0 (0.0%) |
| $55,000 to $64,999 | 0 (0.0%) | 0 (0.0%) |
| $65,000 to $74,999 | 0 (0.0%) | 0 (0.0%) |
| $75,000 to $99,999 | 10 (5.5%) | 0 (0.0%) |
| $100,000+ | 37 (20.3%) | 0 (0.0%) |
| Total | 182 (100.0%) | 50 (100.0%) |
Earnings by Sex by Educational Attainment in Yukon
| Educational Attainment | Male Income | Female Income |
| Less than High School | - | - |
| High School Diploma | - | - |
| College or Associate's Degree | - | - |
| Bachelor's Degree | - | - |
| Graduate Degree | - | - |
| Total | - | - |
Family Income in Yukon
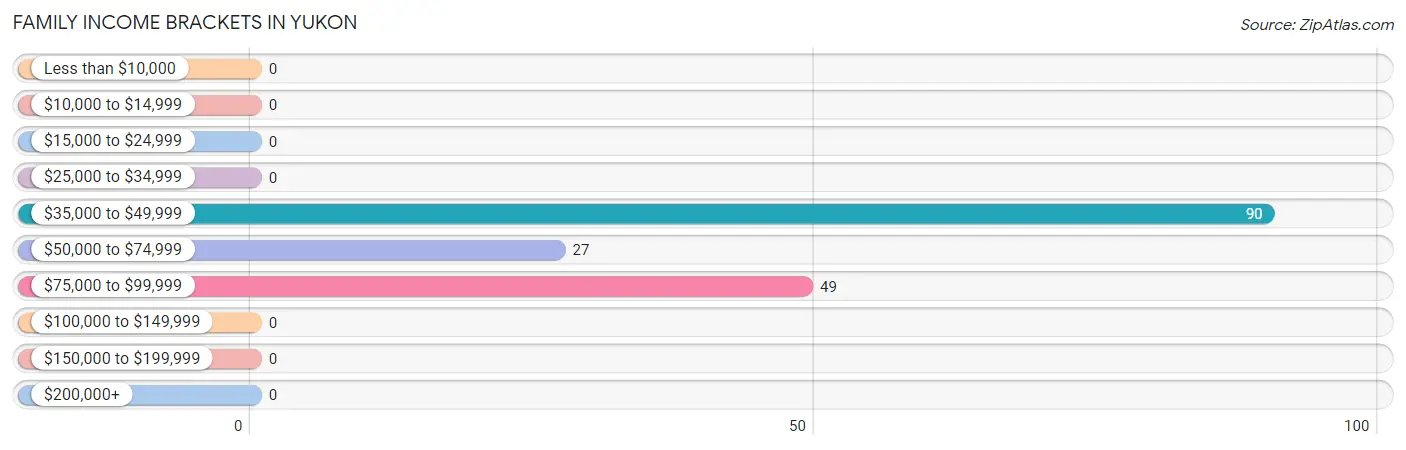
Family Income Brackets in Yukon
According to the Yukon family income data, there are 90 families falling into the $35,000 to $49,999 income range, which is the most common income bracket and makes up 54.2% of all families.
| Income Bracket | # Families | % Families |
| Less than $10,000 | 0 | 0.0% |
| $10,000 to $14,999 | 0 | 0.0% |
| $15,000 to $24,999 | 0 | 0.0% |
| $25,000 to $34,999 | 0 | 0.0% |
| $35,000 to $49,999 | 90 | 54.2% |
| $50,000 to $74,999 | 27 | 16.3% |
| $75,000 to $99,999 | 49 | 29.5% |
| $100,000 to $149,999 | 0 | 0.0% |
| $150,000 to $199,999 | 0 | 0.0% |
| $200,000+ | 0 | 0.0% |
Family Income by Famaliy Size in Yukon
| Income Bracket | # Families | Median Income |
| 2-Person Families | 90 (54.2%) | $0 |
| 3-Person Families | 27 (16.3%) | $0 |
| 4-Person Families | 10 (6.0%) | $0 |
| 5-Person Families | 39 (23.5%) | $0 |
| 6-Person Families | 0 (0.0%) | $0 |
| 7+ Person Families | 0 (0.0%) | $0 |
| Total | 166 (100.0%) | $44,806 |
Family Income by Number of Earners in Yukon
| Number of Earners | # Families | Median Income |
| No Earners | 27 (16.3%) | $0 |
| 1 Earner | 100 (60.2%) | $0 |
| 2 Earners | 39 (23.5%) | $0 |
| 3+ Earners | 0 (0.0%) | $0 |
| Total | 166 (100.0%) | $44,806 |
Household Income in Yukon
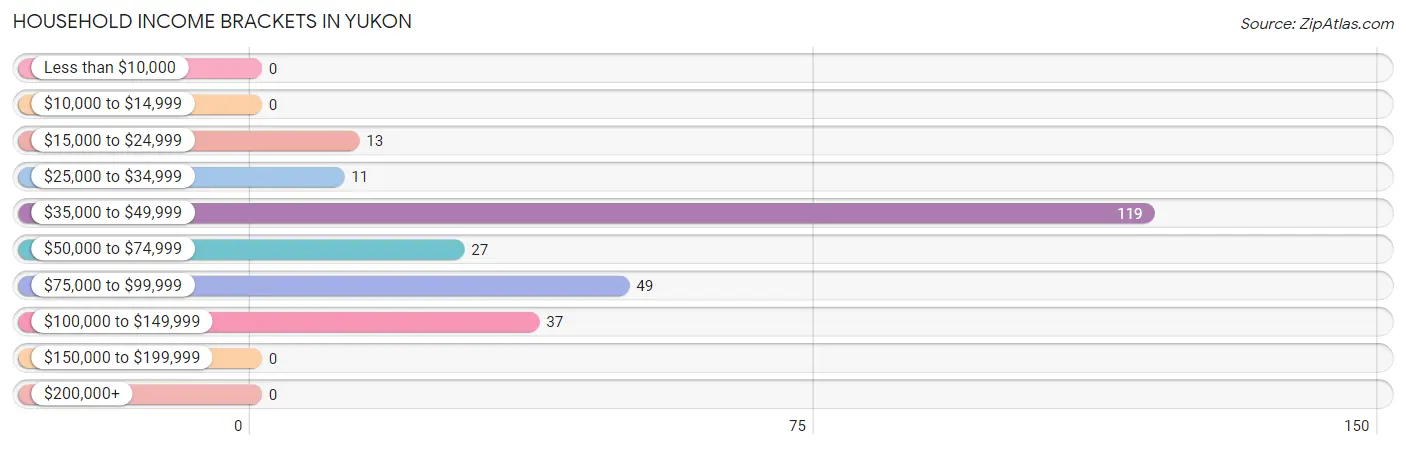
Household Income Brackets in Yukon
With 119 households falling in the category, the $35,000 to $49,999 income range is the most frequent in Yukon, accounting for 46.5% of all households.
| Income Bracket | # Households | % Households |
| Less than $10,000 | 0 | 0.0% |
| $10,000 to $14,999 | 0 | 0.0% |
| $15,000 to $24,999 | 13 | 5.1% |
| $25,000 to $34,999 | 11 | 4.3% |
| $35,000 to $49,999 | 119 | 46.5% |
| $50,000 to $74,999 | 27 | 10.5% |
| $75,000 to $99,999 | 49 | 19.1% |
| $100,000 to $149,999 | 37 | 14.5% |
| $150,000 to $199,999 | 0 | 0.0% |
| $200,000+ | 0 | 0.0% |
Household Income by Householder Age in Yukon
The median household income in Yukon is $48,707, with the highest median household income of $49,353 found in the 65+ years age bracket for the primary householder. A total of 69 households (27.0%) fall into this category.
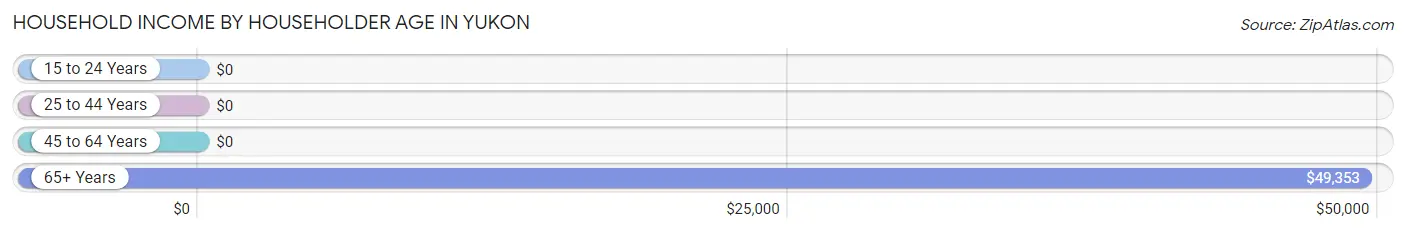
| Income Bracket | # Households | Median Income |
| 15 to 24 Years | 0 (0.0%) | $0 |
| 25 to 44 Years | 49 (19.1%) | $0 |
| 45 to 64 Years | 138 (53.9%) | $0 |
| 65+ Years | 69 (27.0%) | $49,353 |
| Total | 256 (100.0%) | $48,707 |
Poverty in Yukon
Income Below Poverty by Sex and Age in Yukon
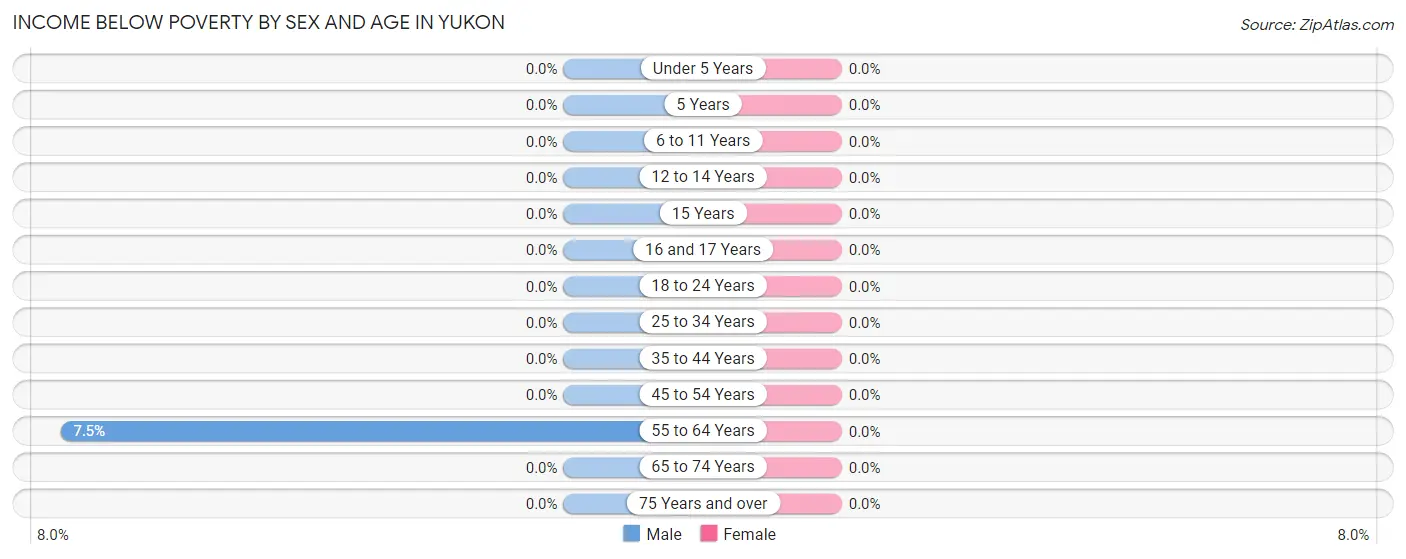
| Age Bracket | Male | Female |
| Under 5 Years | 0 (0.0%) | 0 (0.0%) |
| 5 Years | 0 (0.0%) | 0 (0.0%) |
| 6 to 11 Years | 0 (0.0%) | 0 (0.0%) |
| 12 to 14 Years | 0 (0.0%) | 0 (0.0%) |
| 15 Years | 0 (0.0%) | 0 (0.0%) |
| 16 and 17 Years | 0 (0.0%) | 0 (0.0%) |
| 18 to 24 Years | 0 (0.0%) | 0 (0.0%) |
| 25 to 34 Years | 0 (0.0%) | 0 (0.0%) |
| 35 to 44 Years | 0 (0.0%) | 0 (0.0%) |
| 45 to 54 Years | 0 (0.0%) | 0 (0.0%) |
| 55 to 64 Years | 13 (7.5%) | 0 (0.0%) |
| 65 to 74 Years | 0 (0.0%) | 0 (0.0%) |
| 75 Years and over | 0 (0.0%) | 0 (0.0%) |
| Total | 13 (3.6%) | 0 (0.0%) |
Income Above Poverty by Sex and Age in Yukon
According to the poverty statistics in Yukon, males aged under 5 years and females aged under 5 years are the age groups that are most secure financially, with 100.0% of males and 100.0% of females in these age groups living above the poverty line.
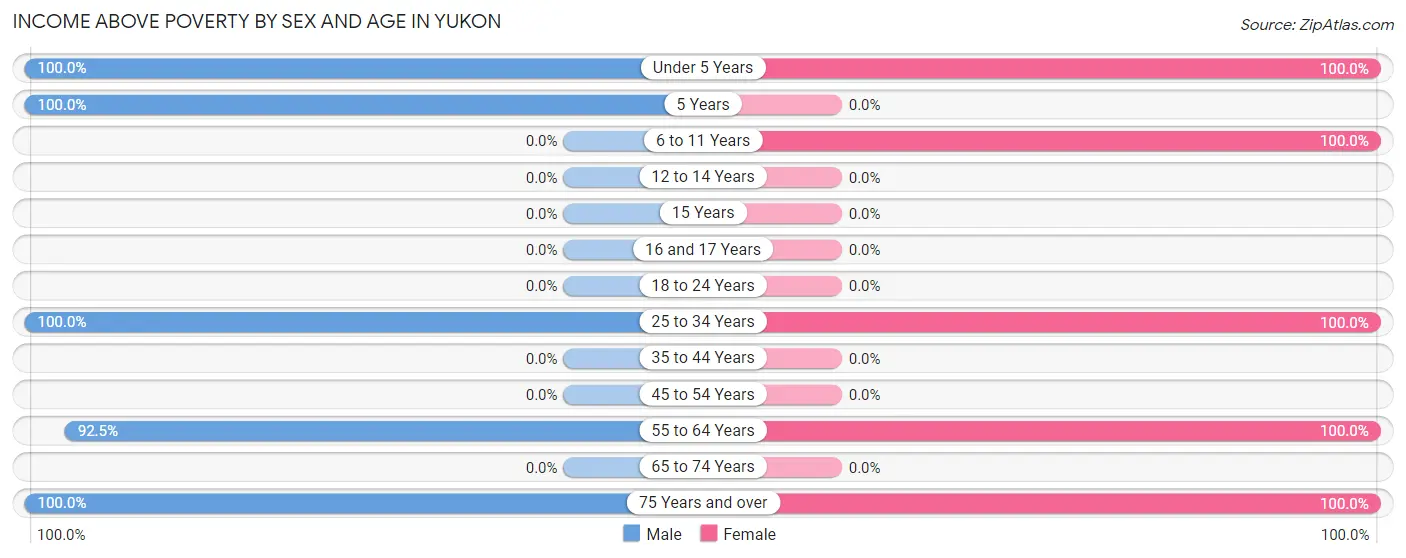
| Age Bracket | Male | Female |
| Under 5 Years | 40 (100.0%) | 18 (100.0%) |
| 5 Years | 39 (100.0%) | 0 (0.0%) |
| 6 to 11 Years | 0 (0.0%) | 41 (100.0%) |
| 12 to 14 Years | 0 (0.0%) | 0 (0.0%) |
| 15 Years | 0 (0.0%) | 0 (0.0%) |
| 16 and 17 Years | 0 (0.0%) | 0 (0.0%) |
| 18 to 24 Years | 0 (0.0%) | 0 (0.0%) |
| 25 to 34 Years | 55 (100.0%) | 50 (100.0%) |
| 35 to 44 Years | 0 (0.0%) | 0 (0.0%) |
| 45 to 54 Years | 0 (0.0%) | 0 (0.0%) |
| 55 to 64 Years | 161 (92.5%) | 11 (100.0%) |
| 65 to 74 Years | 0 (0.0%) | 0 (0.0%) |
| 75 Years and over | 57 (100.0%) | 125 (100.0%) |
| Total | 352 (96.4%) | 245 (100.0%) |
Income Below Poverty Among Married-Couple Families in Yukon
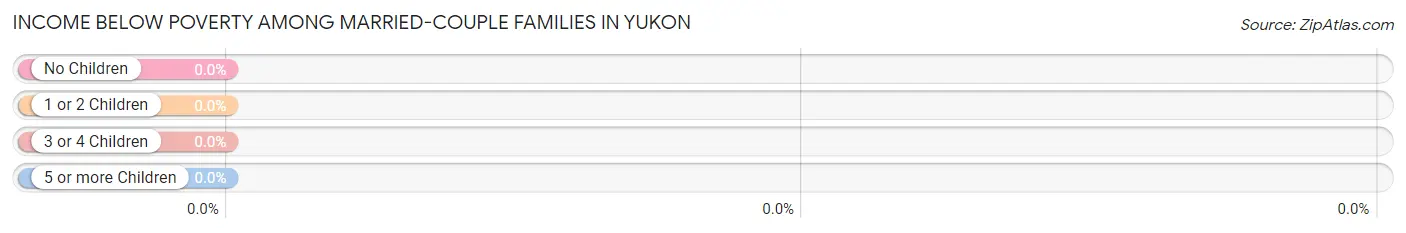
| Children | Above Poverty | Below Poverty |
| No Children | 27 (100.0%) | 0 (0.0%) |
| 1 or 2 Children | 10 (100.0%) | 0 (0.0%) |
| 3 or 4 Children | 39 (100.0%) | 0 (0.0%) |
| 5 or more Children | 0 (0.0%) | 0 (0.0%) |
| Total | 76 (100.0%) | 0 (0.0%) |
Income Below Poverty Among Single-Parent Households in Yukon
| Children | Single Father | Single Mother |
| No Children | 0 (0.0%) | 0 (0.0%) |
| 1 or 2 Children | 0 (0.0%) | 0 (0.0%) |
| 3 or 4 Children | 0 (0.0%) | 0 (0.0%) |
| 5 or more Children | 0 (0.0%) | 0 (0.0%) |
| Total | 0 (0.0%) | 0 (0.0%) |
Income Below Poverty Among Married-Couple vs Single-Parent Households in Yukon
| Children | Married-Couple Families | Single-Parent Households |
| No Children | 0 (0.0%) | 0 (0.0%) |
| 1 or 2 Children | 0 (0.0%) | 0 (0.0%) |
| 3 or 4 Children | 0 (0.0%) | 0 (0.0%) |
| 5 or more Children | 0 (0.0%) | 0 (0.0%) |
| Total | 0 (0.0%) | 0 (0.0%) |
Race in Yukon
The most populous races in Yukon are , and White / Caucasian (610 | 100.0%).
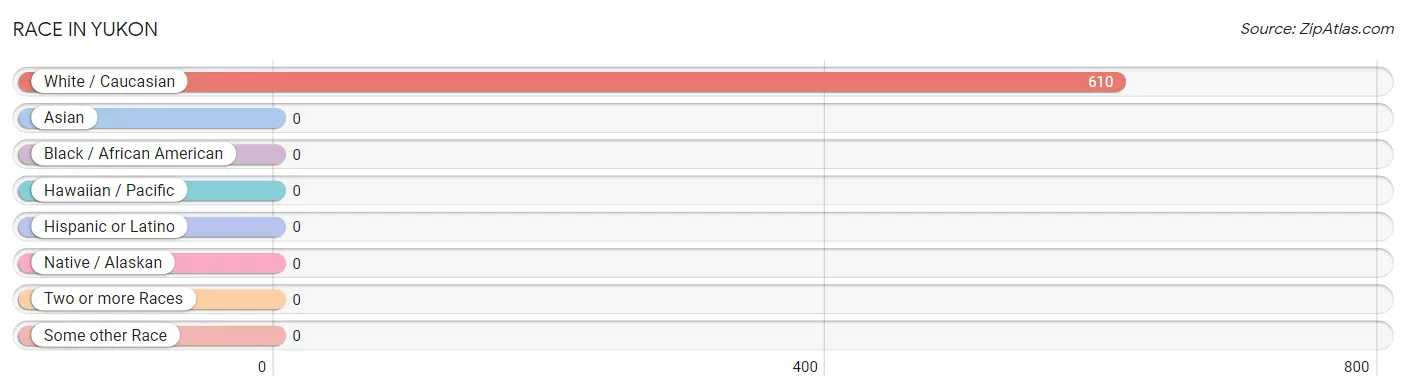
| Race | # Population | % Population |
| Asian | 0 | 0.0% |
| Black / African American | 0 | 0.0% |
| Hawaiian / Pacific | 0 | 0.0% |
| Hispanic or Latino | 0 | 0.0% |
| Native / Alaskan | 0 | 0.0% |
| White / Caucasian | 610 | 100.0% |
| Two or more Races | 0 | 0.0% |
| Some other Race | 0 | 0.0% |
| Total | 610 | 100.0% |
Ancestry in Yukon
The most populous ancestries reported in Yukon are English (180 | 29.5%), Croatian (175 | 28.7%), Hungarian (175 | 28.7%), German (125 | 20.5%), and Irish (66 | 10.8%), together accounting for 118.2% of all Yukon residents.
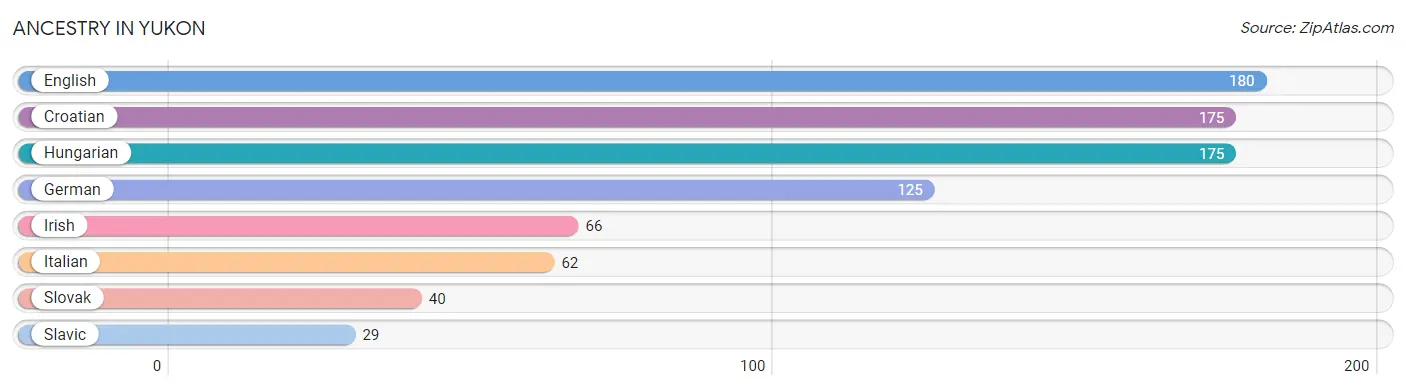
| Ancestry | # Population | % Population |
| Croatian | 175 | 28.7% |
| English | 180 | 29.5% |
| German | 125 | 20.5% |
| Hungarian | 175 | 28.7% |
| Irish | 66 | 10.8% |
| Italian | 62 | 10.2% |
| Slavic | 29 | 4.8% |
| Slovak | 40 | 6.6% | View All 8 Rows |
Immigrants in Yukon

| Immigration Origin | # Population | % Population | View All 0 Rows |
Sex and Age in Yukon
Sex and Age in Yukon
The most populous age groups in Yukon are 55 to 59 Years (161 | 44.1%) for men and 85 Years and over (98 | 40.0%) for women.
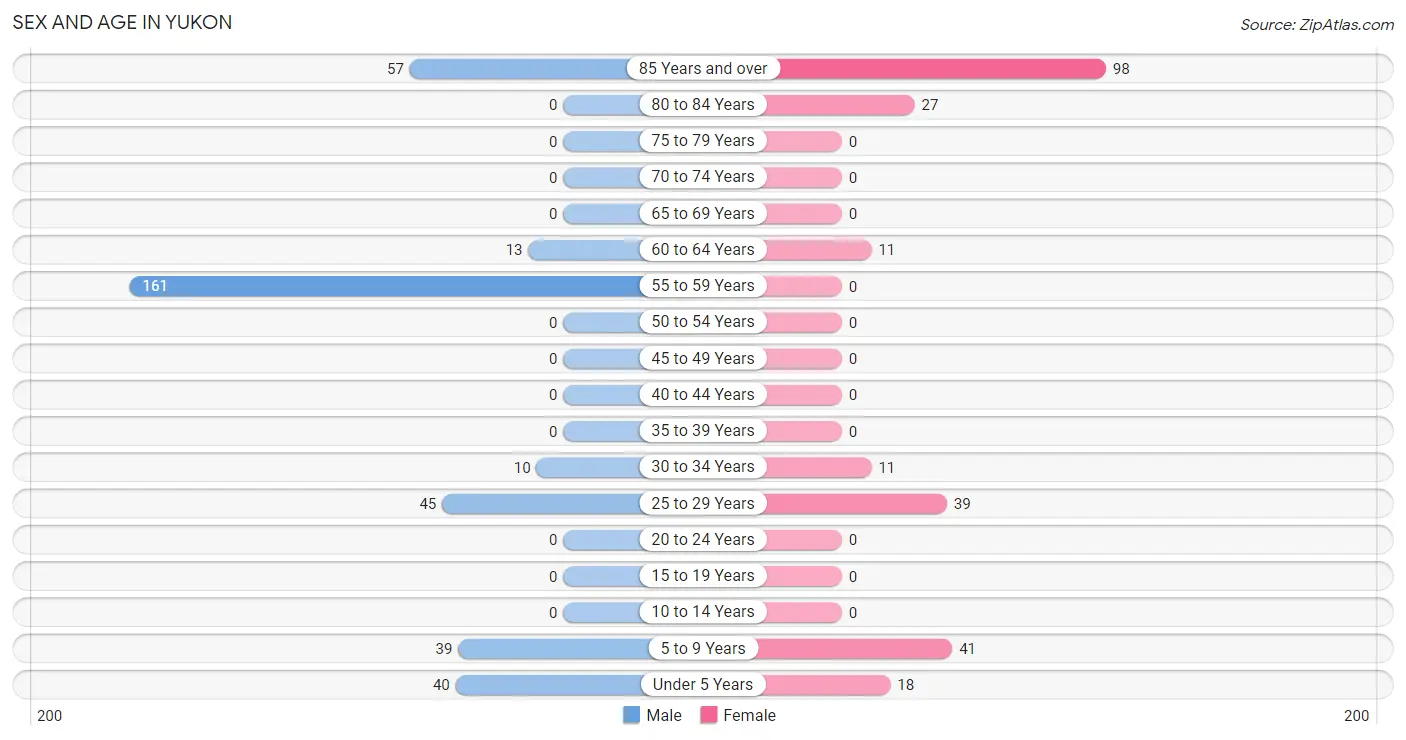
| Age Bracket | Male | Female |
| Under 5 Years | 40 (11.0%) | 18 (7.3%) |
| 5 to 9 Years | 39 (10.7%) | 41 (16.7%) |
| 10 to 14 Years | 0 (0.0%) | 0 (0.0%) |
| 15 to 19 Years | 0 (0.0%) | 0 (0.0%) |
| 20 to 24 Years | 0 (0.0%) | 0 (0.0%) |
| 25 to 29 Years | 45 (12.3%) | 39 (15.9%) |
| 30 to 34 Years | 10 (2.7%) | 11 (4.5%) |
| 35 to 39 Years | 0 (0.0%) | 0 (0.0%) |
| 40 to 44 Years | 0 (0.0%) | 0 (0.0%) |
| 45 to 49 Years | 0 (0.0%) | 0 (0.0%) |
| 50 to 54 Years | 0 (0.0%) | 0 (0.0%) |
| 55 to 59 Years | 161 (44.1%) | 0 (0.0%) |
| 60 to 64 Years | 13 (3.6%) | 11 (4.5%) |
| 65 to 69 Years | 0 (0.0%) | 0 (0.0%) |
| 70 to 74 Years | 0 (0.0%) | 0 (0.0%) |
| 75 to 79 Years | 0 (0.0%) | 0 (0.0%) |
| 80 to 84 Years | 0 (0.0%) | 27 (11.0%) |
| 85 Years and over | 57 (15.6%) | 98 (40.0%) |
| Total | 365 (100.0%) | 245 (100.0%) |
Families and Households in Yukon
Median Family Size in Yukon
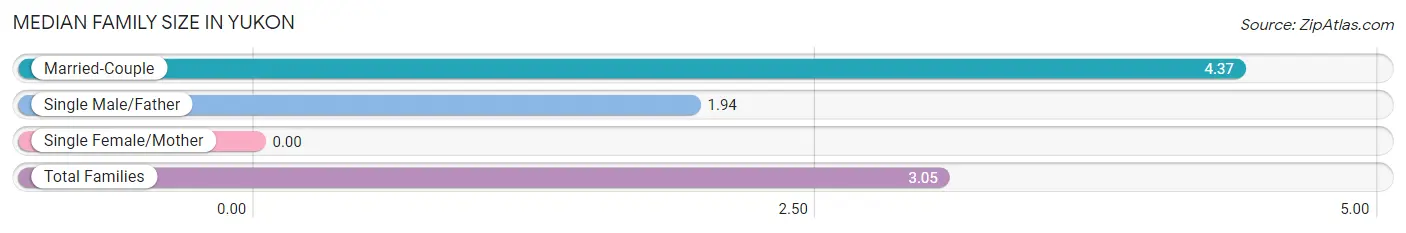
| Family Type | # Families | Family Size |
| Married-Couple | 76 (45.8%) | 4.37 |
| Single Male/Father | 90 (54.2%) | 1.94 |
| Single Female/Mother | 0 (0.0%) | - |
| Total Families | 166 (100.0%) | 3.05 |
Median Household Size in Yukon
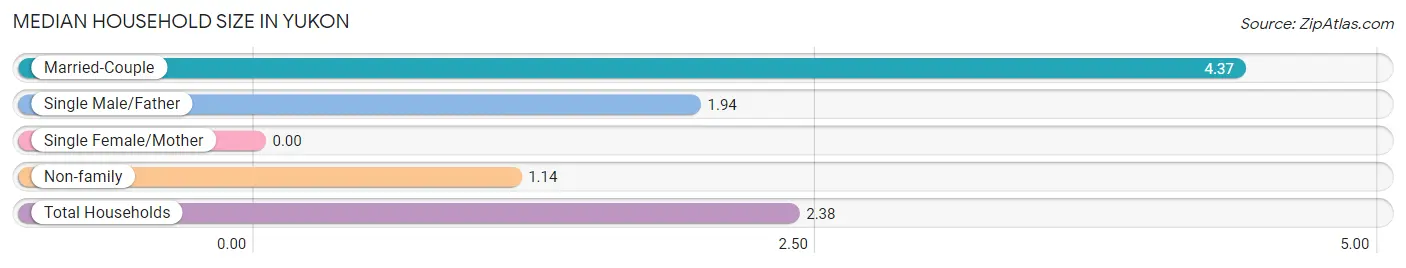
| Household Type | # Households | Household Size |
| Married-Couple | 76 (29.7%) | 4.37 |
| Single Male/Father | 90 (35.2%) | 1.94 |
| Single Female/Mother | 0 (0.0%) | - |
| Non-family | 90 (35.2%) | 1.14 |
| Total Households | 256 (100.0%) | 2.38 |
Household Size by Marriage Status in Yukon
Out of a total of 256 households in Yukon, 166 (64.8%) are family households, while 90 (35.2%) are nonfamily households. The most numerous type of family households are 2-person households, comprising 90, and the most common type of nonfamily households are 1-person households, comprising 79.
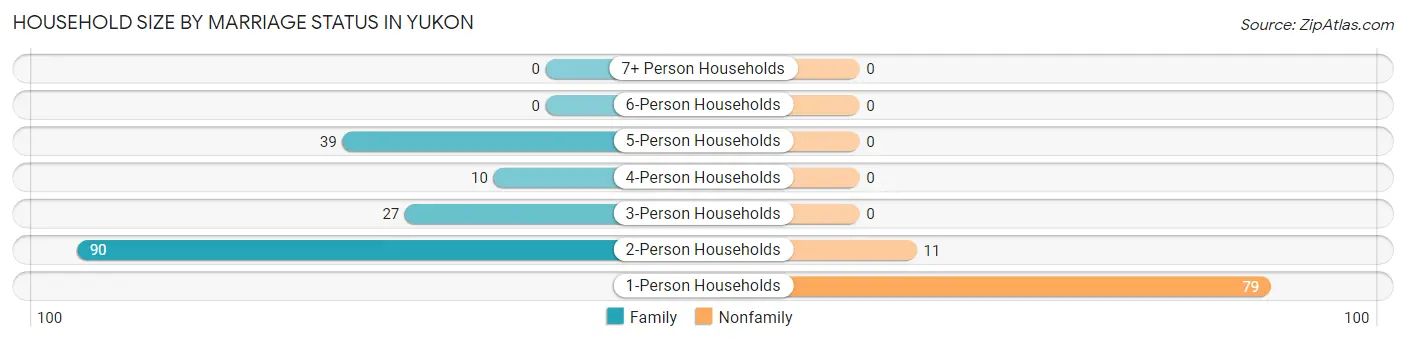
| Household Size | Family Households | Nonfamily Households |
| 1-Person Households | - | 79 (30.9%) |
| 2-Person Households | 90 (35.2%) | 11 (4.3%) |
| 3-Person Households | 27 (10.5%) | 0 (0.0%) |
| 4-Person Households | 10 (3.9%) | 0 (0.0%) |
| 5-Person Households | 39 (15.2%) | 0 (0.0%) |
| 6-Person Households | 0 (0.0%) | 0 (0.0%) |
| 7+ Person Households | 0 (0.0%) | 0 (0.0%) |
| Total | 166 (64.8%) | 90 (35.2%) |
Female Fertility in Yukon
Fertility by Age in Yukon
| Age Bracket | Women with Births | Births / 1,000 Women |
| 15 to 19 years | 0 (0.0%) | 0.0 |
| 20 to 34 years | 0 (0.0%) | 0.0 |
| 35 to 50 years | 0 (0.0%) | 0.0 |
| Total | 0 (0.0%) | 0.0 |
Fertility by Age by Marriage Status in Yukon
| Age Bracket | Married | Unmarried |
| 15 to 19 years | 0 (0.0%) | 0 (0.0%) |
| 20 to 34 years | 0 (0.0%) | 0 (0.0%) |
| 35 to 50 years | 0 (0.0%) | 0 (0.0%) |
| Total | 0 (0.0%) | 0 (0.0%) |
Fertility by Education in Yukon
| Educational Attainment | Women with Births | Births / 1,000 Women |
| Less than High School | 0 (0.0%) | 0.0 |
| High School Diploma | 0 (0.0%) | 0.0 |
| College or Associate's Degree | 0 (0.0%) | 0.0 |
| Bachelor's Degree | 0 (0.0%) | 0.0 |
| Graduate Degree | 0 (0.0%) | 0.0 |
| Total | 0 (0.0%) | 0.0 |
Fertility by Education by Marriage Status in Yukon
| Educational Attainment | Married | Unmarried |
| Less than High School | 0 (0.0%) | 0 (0.0%) |
| High School Diploma | 0 (0.0%) | 0 (0.0%) |
| College or Associate's Degree | 0 (0.0%) | 0 (0.0%) |
| Bachelor's Degree | 0 (0.0%) | 0 (0.0%) |
| Graduate Degree | 0 (0.0%) | 0 (0.0%) |
| Total | 0 (0.0%) | 0 (0.0%) |
Employment Characteristics in Yukon
Employment by Class of Employer in Yukon
Among the 221 employed individuals in Yukon, , and private company employees (221 | 100.0%) make up the most common classes of employment.
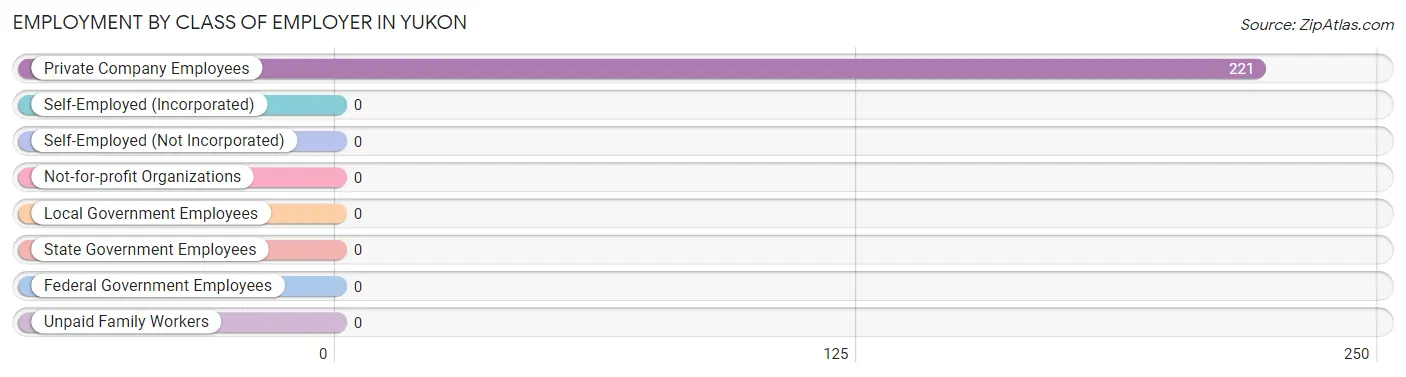
| Employer Class | # Employees | % Employees |
| Private Company Employees | 221 | 100.0% |
| Self-Employed (Incorporated) | 0 | 0.0% |
| Self-Employed (Not Incorporated) | 0 | 0.0% |
| Not-for-profit Organizations | 0 | 0.0% |
| Local Government Employees | 0 | 0.0% |
| State Government Employees | 0 | 0.0% |
| Federal Government Employees | 0 | 0.0% |
| Unpaid Family Workers | 0 | 0.0% |
| Total | 221 | 100.0% |
Employment Status by Age in Yukon
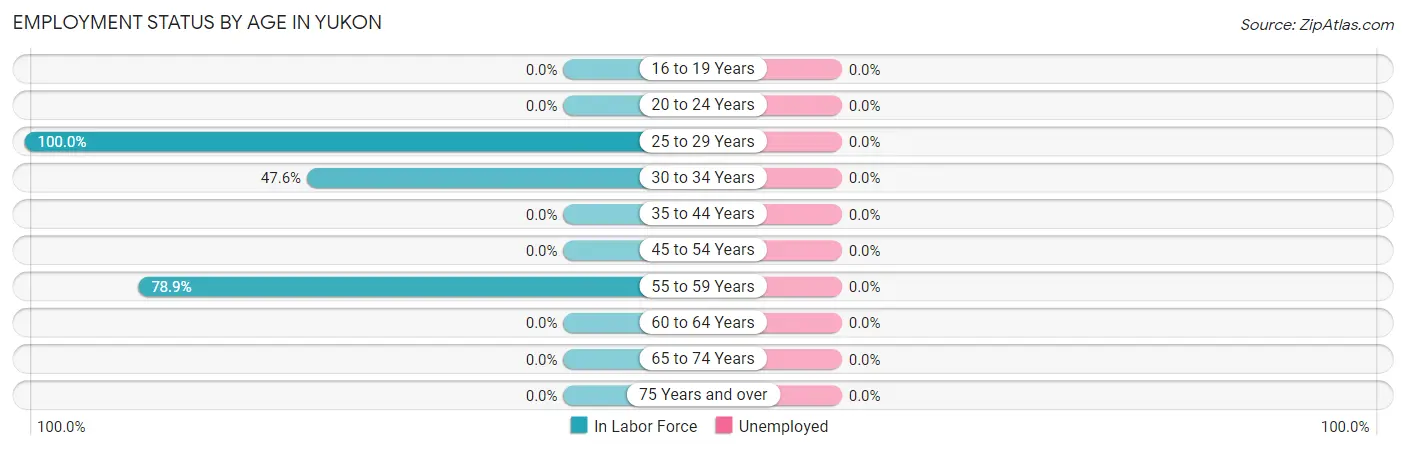
| Age Bracket | In Labor Force | Unemployed |
| 16 to 19 Years | 0 (0.0%) | 0 (0.0%) |
| 20 to 24 Years | 0 (0.0%) | 0 (0.0%) |
| 25 to 29 Years | 84 (100.0%) | 0 (0.0%) |
| 30 to 34 Years | 10 (47.6%) | 0 (0.0%) |
| 35 to 44 Years | 0 (0.0%) | 0 (0.0%) |
| 45 to 54 Years | 0 (0.0%) | 0 (0.0%) |
| 55 to 59 Years | 127 (78.9%) | 0 (0.0%) |
| 60 to 64 Years | 0 (0.0%) | 0 (0.0%) |
| 65 to 74 Years | 0 (0.0%) | 0 (0.0%) |
| 75 Years and over | 0 (0.0%) | 0 (0.0%) |
| Total | 221 (46.8%) | 0 (0.0%) |
Employment Status by Educational Attainment in Yukon
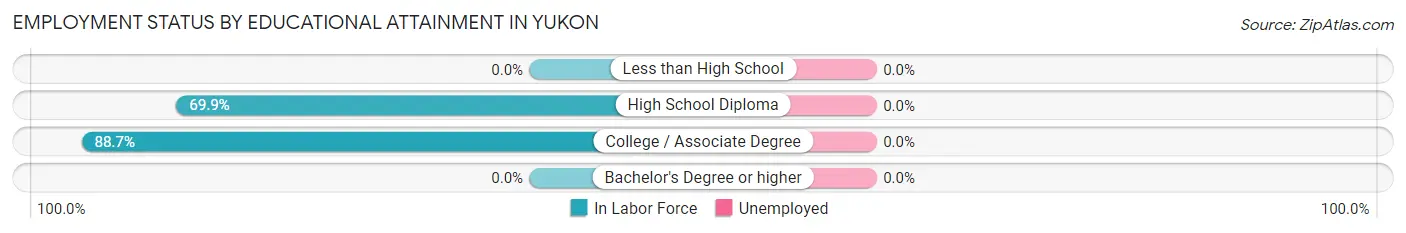
| Educational Attainment | In Labor Force | Unemployed |
| Less than High School | 0 (0.0%) | 0 (0.0%) |
| High School Diploma | 135 (69.9%) | 0 (0.0%) |
| College / Associate Degree | 86 (88.7%) | 0 (0.0%) |
| Bachelor's Degree or higher | 0 (0.0%) | 0 (0.0%) |
| Total | 221 (76.2%) | 0 (0.0%) |
Employment Occupations by Sex in Yukon
Management, Business, Science and Arts Occupations
The most common Management, Business, Science and Arts occupations in Yukon are Computers, Engineering & Science (76 | 34.4%), Computers & Mathematics (76 | 34.4%), and Health Diagnosing & Treating (45 | 20.4%).
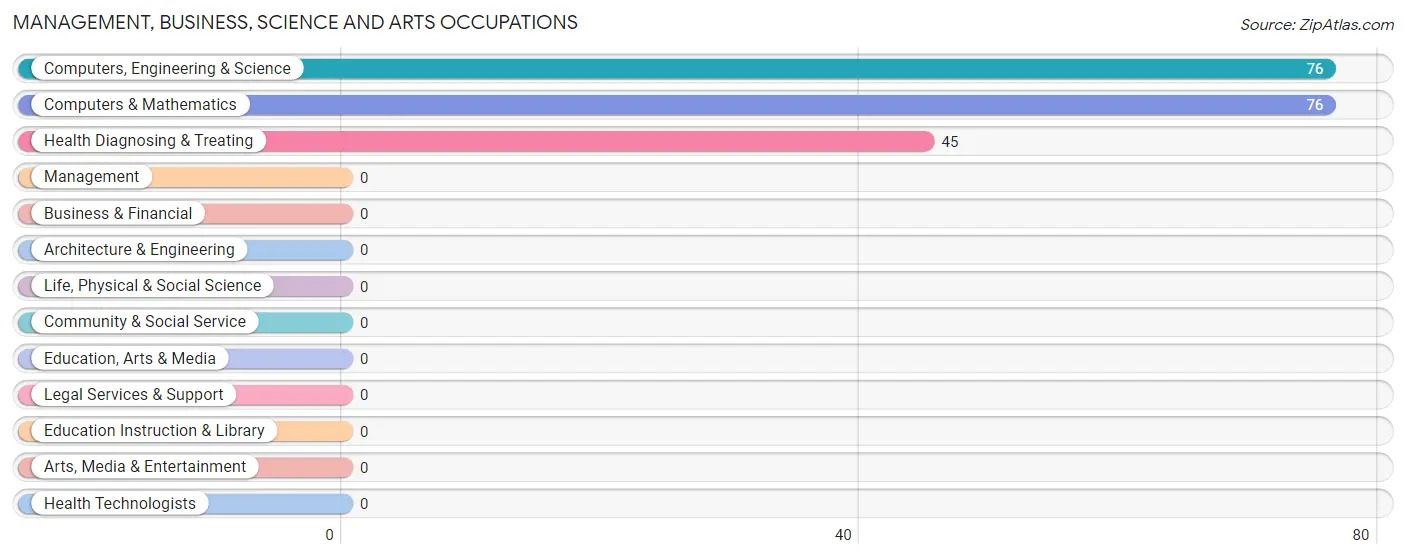
Management, Business, Science and Arts Occupations by Sex
Within the Management, Business, Science and Arts occupations in Yukon, the most male-oriented occupations are Health Diagnosing & Treating (100.0%), Computers, Engineering & Science (48.7%), and Computers & Mathematics (48.7%), while the most female-oriented occupations are Computers, Engineering & Science (51.3%), and Computers & Mathematics (51.3%).
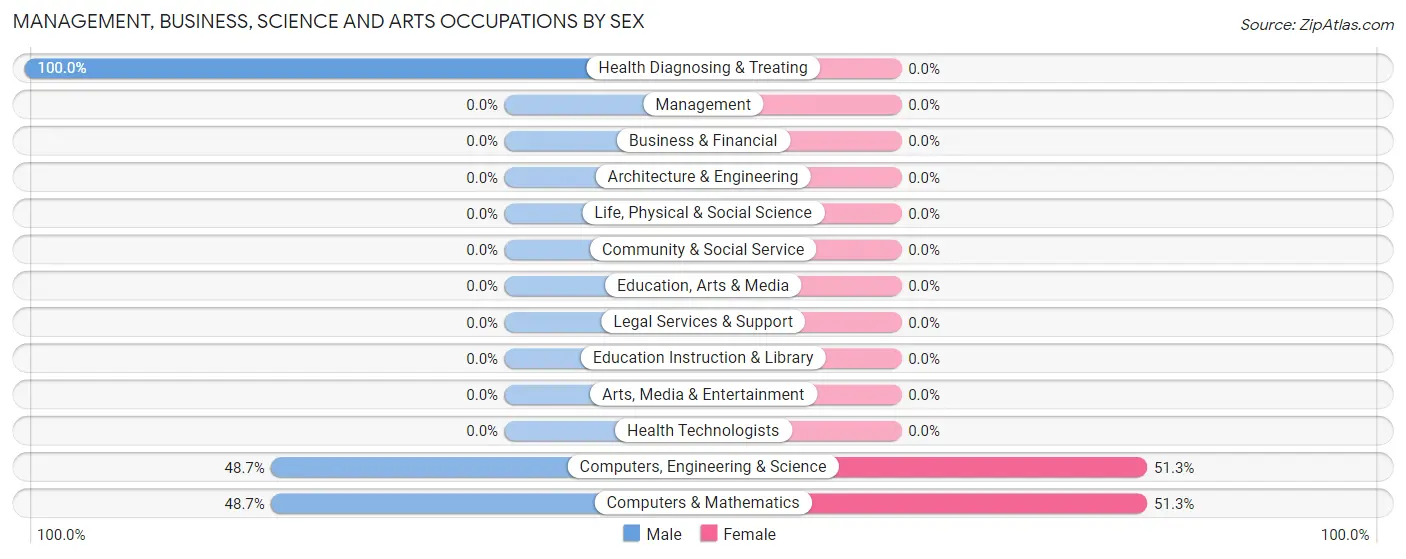
| Occupation | Male | Female |
| Management | 0 (0.0%) | 0 (0.0%) |
| Business & Financial | 0 (0.0%) | 0 (0.0%) |
| Computers, Engineering & Science | 37 (48.7%) | 39 (51.3%) |
| Computers & Mathematics | 37 (48.7%) | 39 (51.3%) |
| Architecture & Engineering | 0 (0.0%) | 0 (0.0%) |
| Life, Physical & Social Science | 0 (0.0%) | 0 (0.0%) |
| Community & Social Service | 0 (0.0%) | 0 (0.0%) |
| Education, Arts & Media | 0 (0.0%) | 0 (0.0%) |
| Legal Services & Support | 0 (0.0%) | 0 (0.0%) |
| Education Instruction & Library | 0 (0.0%) | 0 (0.0%) |
| Arts, Media & Entertainment | 0 (0.0%) | 0 (0.0%) |
| Health Diagnosing & Treating | 45 (100.0%) | 0 (0.0%) |
| Health Technologists | 0 (0.0%) | 0 (0.0%) |
| Total (Category) | 82 (67.8%) | 39 (32.2%) |
| Total (Overall) | 182 (82.4%) | 39 (17.6%) |
Services Occupations
Services Occupations by Sex
| Occupation | Male | Female |
| Healthcare Support | 0 (0.0%) | 0 (0.0%) |
| Security & Protection | 0 (0.0%) | 0 (0.0%) |
| Firefighting & Prevention | 0 (0.0%) | 0 (0.0%) |
| Law Enforcement | 0 (0.0%) | 0 (0.0%) |
| Food Preparation & Serving | 0 (0.0%) | 0 (0.0%) |
| Cleaning & Maintenance | 0 (0.0%) | 0 (0.0%) |
| Personal Care & Service | 0 (0.0%) | 0 (0.0%) |
| Total (Category) | 0 (0.0%) | 0 (0.0%) |
| Total (Overall) | 182 (82.4%) | 39 (17.6%) |
Sales and Office Occupations
Sales and Office Occupations by Sex
| Occupation | Male | Female |
| Sales & Related | 0 (0.0%) | 0 (0.0%) |
| Office & Administration | 0 (0.0%) | 0 (0.0%) |
| Total (Category) | 0 (0.0%) | 0 (0.0%) |
| Total (Overall) | 182 (82.4%) | 39 (17.6%) |
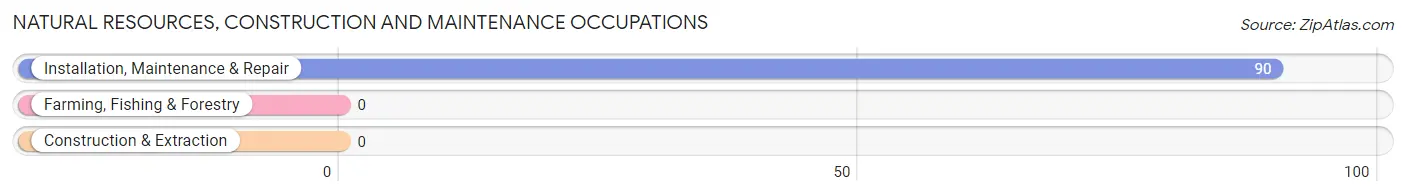
Natural Resources, Construction and Maintenance Occupations
The most common Natural Resources, Construction and Maintenance occupations in Yukon are , and Installation, Maintenance & Repair (90 | 40.7%).
Natural Resources, Construction and Maintenance Occupations by Sex
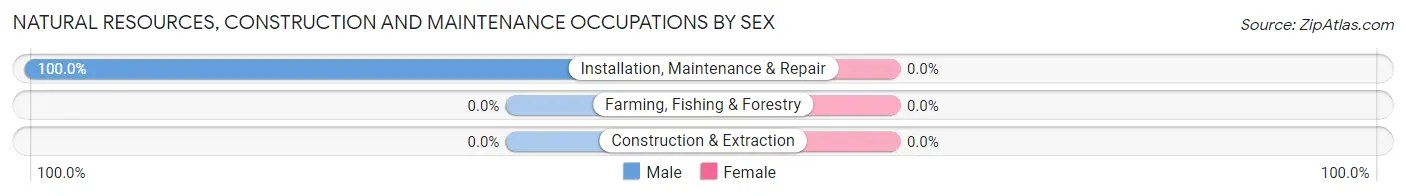
| Occupation | Male | Female |
| Farming, Fishing & Forestry | 0 (0.0%) | 0 (0.0%) |
| Construction & Extraction | 0 (0.0%) | 0 (0.0%) |
| Installation, Maintenance & Repair | 90 (100.0%) | 0 (0.0%) |
| Total (Category) | 90 (100.0%) | 0 (0.0%) |
| Total (Overall) | 182 (82.4%) | 39 (17.6%) |
Production, Transportation and Moving Occupations
The most common Production, Transportation and Moving occupations in Yukon are , and Transportation (10 | 4.5%).
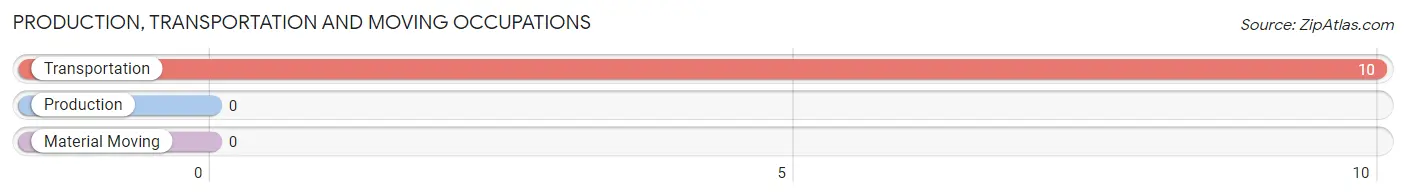
Production, Transportation and Moving Occupations by Sex
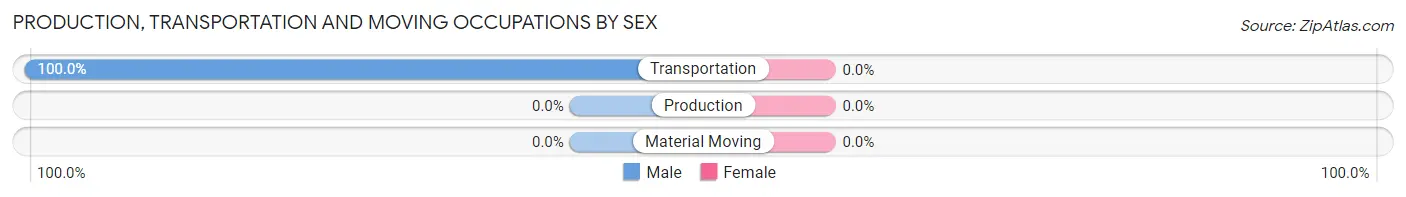
| Occupation | Male | Female |
| Production | 0 (0.0%) | 0 (0.0%) |
| Transportation | 10 (100.0%) | 0 (0.0%) |
| Material Moving | 0 (0.0%) | 0 (0.0%) |
| Total (Category) | 10 (100.0%) | 0 (0.0%) |
| Total (Overall) | 182 (82.4%) | 39 (17.6%) |
Employment Industries by Sex in Yukon
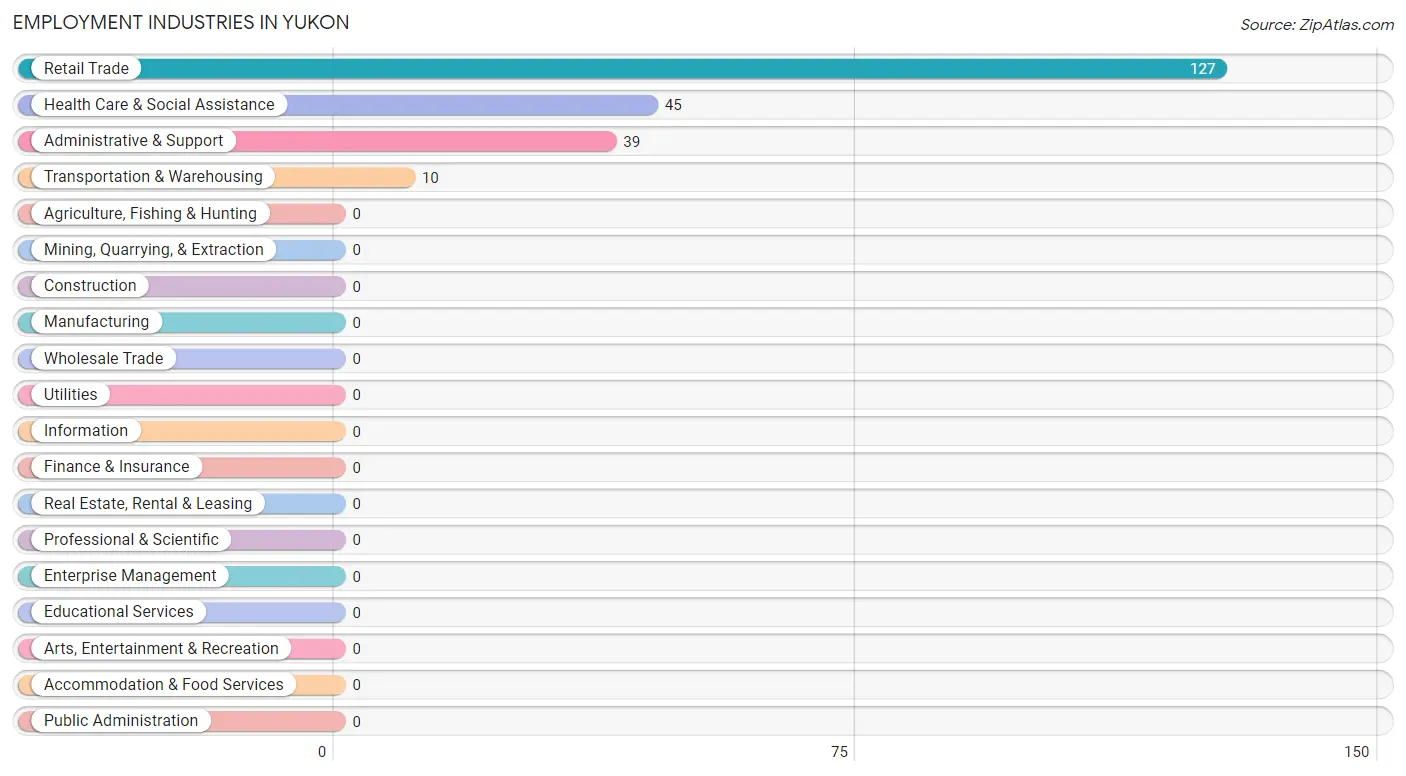
Employment Industries in Yukon
The major employment industries in Yukon include Retail Trade (127 | 57.5%), Health Care & Social Assistance (45 | 20.4%), Administrative & Support (39 | 17.6%), and Transportation & Warehousing (10 | 4.5%).
Employment Industries by Sex in Yukon
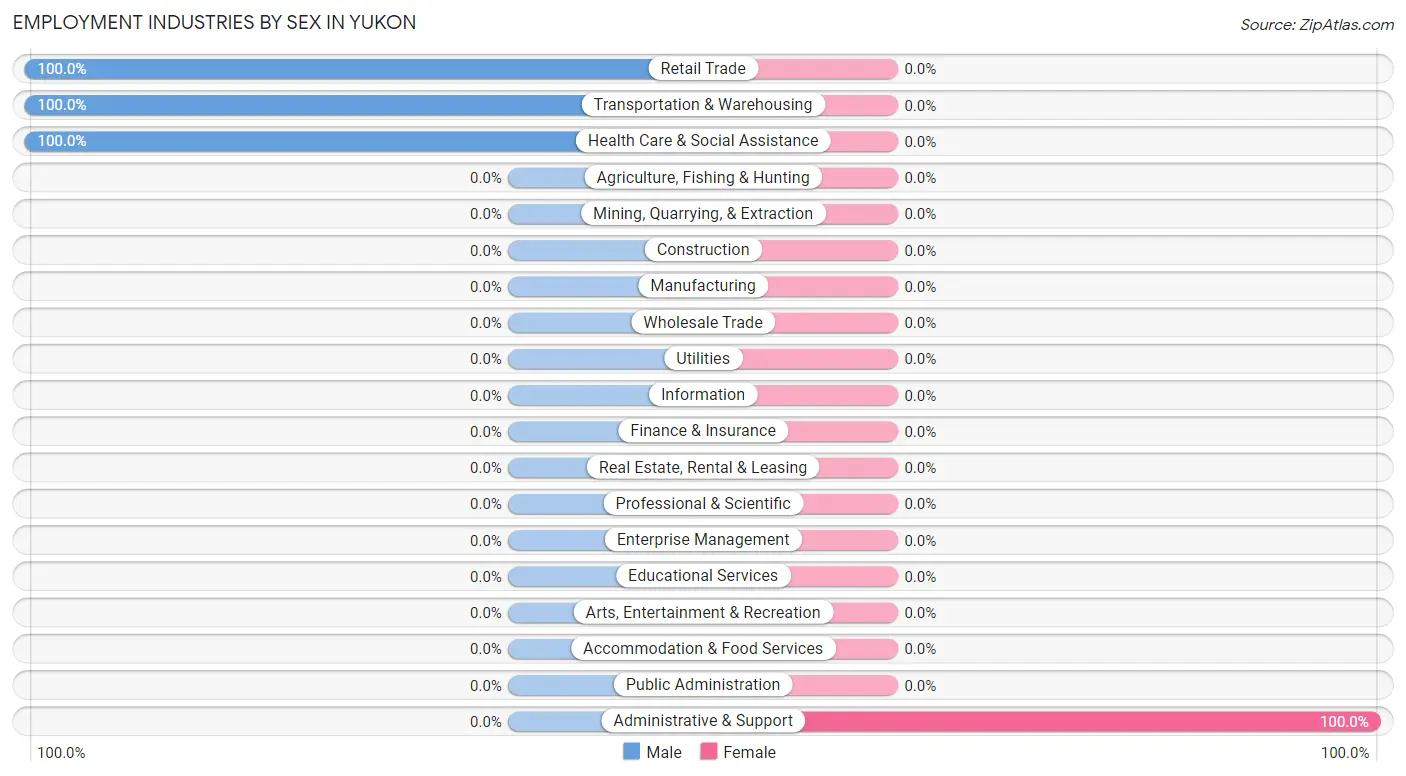
| Industry | Male | Female |
| Agriculture, Fishing & Hunting | 0 (0.0%) | 0 (0.0%) |
| Mining, Quarrying, & Extraction | 0 (0.0%) | 0 (0.0%) |
| Construction | 0 (0.0%) | 0 (0.0%) |
| Manufacturing | 0 (0.0%) | 0 (0.0%) |
| Wholesale Trade | 0 (0.0%) | 0 (0.0%) |
| Retail Trade | 127 (100.0%) | 0 (0.0%) |
| Transportation & Warehousing | 10 (100.0%) | 0 (0.0%) |
| Utilities | 0 (0.0%) | 0 (0.0%) |
| Information | 0 (0.0%) | 0 (0.0%) |
| Finance & Insurance | 0 (0.0%) | 0 (0.0%) |
| Real Estate, Rental & Leasing | 0 (0.0%) | 0 (0.0%) |
| Professional & Scientific | 0 (0.0%) | 0 (0.0%) |
| Enterprise Management | 0 (0.0%) | 0 (0.0%) |
| Administrative & Support | 0 (0.0%) | 39 (100.0%) |
| Educational Services | 0 (0.0%) | 0 (0.0%) |
| Health Care & Social Assistance | 45 (100.0%) | 0 (0.0%) |
| Arts, Entertainment & Recreation | 0 (0.0%) | 0 (0.0%) |
| Accommodation & Food Services | 0 (0.0%) | 0 (0.0%) |
| Public Administration | 0 (0.0%) | 0 (0.0%) |
| Total | 182 (82.4%) | 39 (17.6%) |
Education in Yukon
School Enrollment in Yukon
The most common levels of schooling among the 89 students in Yukon are elementary school (41 | 46.1%), kindergarten (39 | 43.8%), and nursery / preschool (9 | 10.1%).
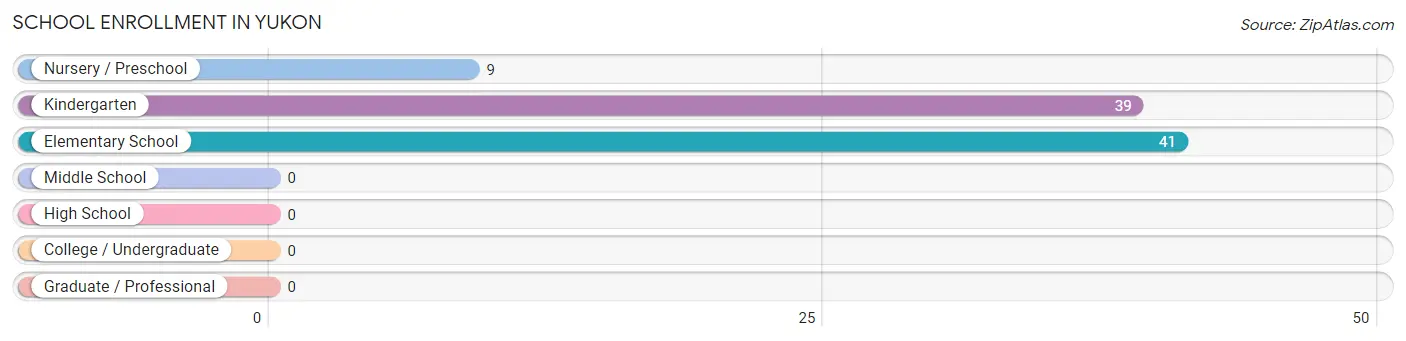
| School Level | # Students | % Students |
| Nursery / Preschool | 9 | 10.1% |
| Kindergarten | 39 | 43.8% |
| Elementary School | 41 | 46.1% |
| Middle School | 0 | 0.0% |
| High School | 0 | 0.0% |
| College / Undergraduate | 0 | 0.0% |
| Graduate / Professional | 0 | 0.0% |
| Total | 89 | 100.0% |
School Enrollment by Age by Funding Source in Yukon
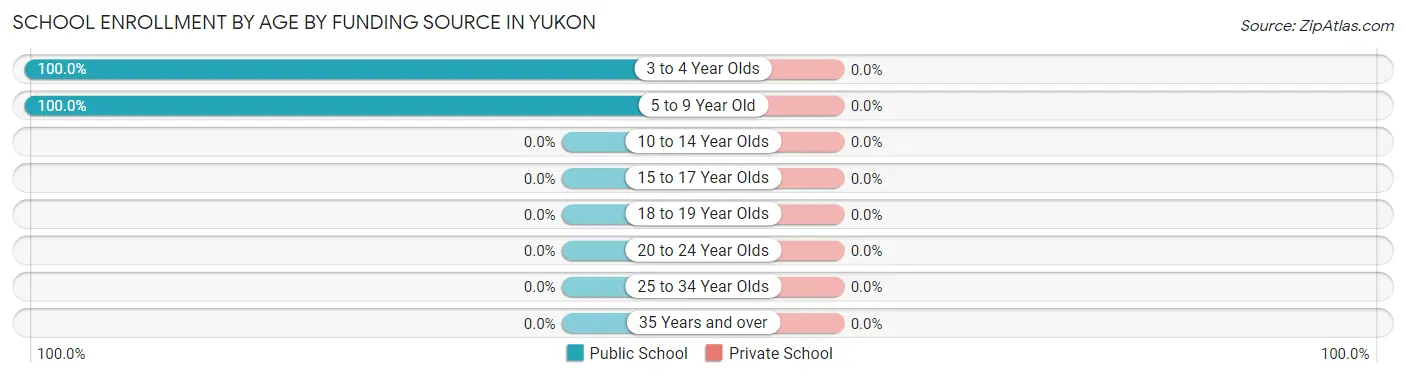
| Age Bracket | Public School | Private School |
| 3 to 4 Year Olds | 9 (100.0%) | 0 (0.0%) |
| 5 to 9 Year Old | 80 (100.0%) | 0 (0.0%) |
| 10 to 14 Year Olds | 0 (0.0%) | 0 (0.0%) |
| 15 to 17 Year Olds | 0 (0.0%) | 0 (0.0%) |
| 18 to 19 Year Olds | 0 (0.0%) | 0 (0.0%) |
| 20 to 24 Year Olds | 0 (0.0%) | 0 (0.0%) |
| 25 to 34 Year Olds | 0 (0.0%) | 0 (0.0%) |
| 35 Years and over | 0 (0.0%) | 0 (0.0%) |
| Total | 89 (100.0%) | 0 (0.0%) |
Educational Attainment by Field of Study in Yukon
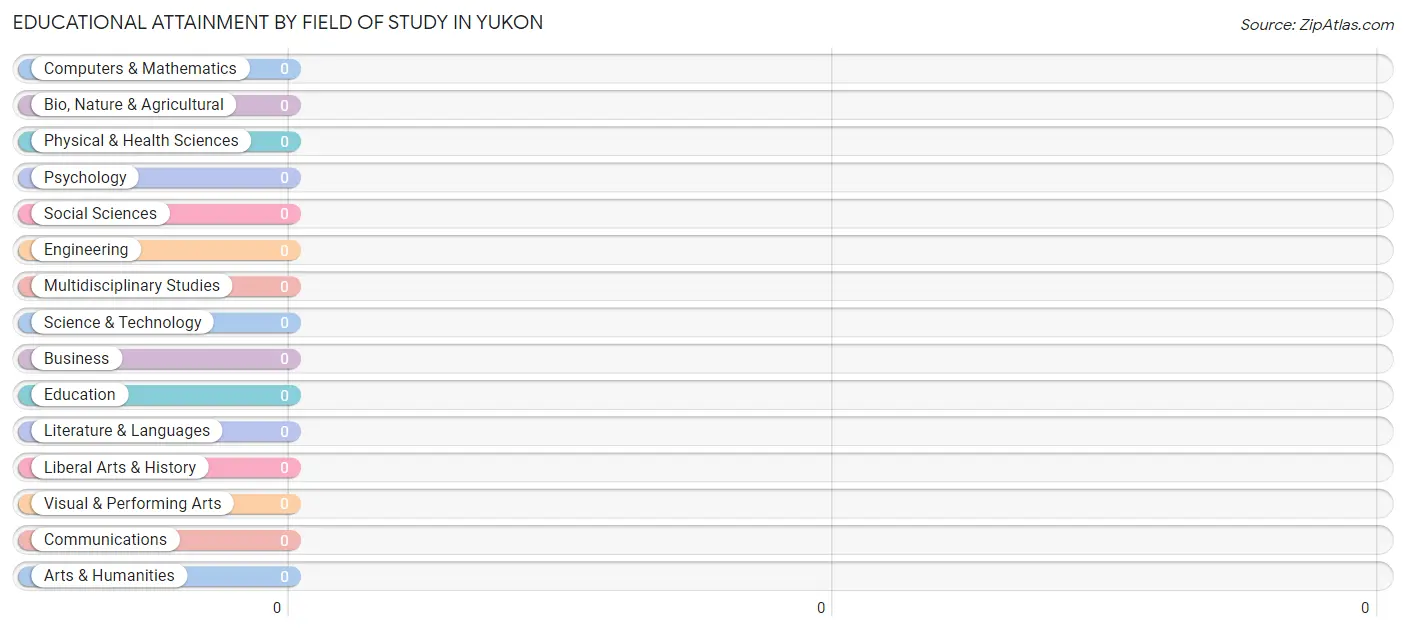
| Field of Study | # Graduates | % Graduates |
| Computers & Mathematics | 0 | 0.0% |
| Bio, Nature & Agricultural | 0 | 0.0% |
| Physical & Health Sciences | 0 | 0.0% |
| Psychology | 0 | 0.0% |
| Social Sciences | 0 | 0.0% |
| Engineering | 0 | 0.0% |
| Multidisciplinary Studies | 0 | 0.0% |
| Science & Technology | 0 | 0.0% |
| Business | 0 | 0.0% |
| Education | 0 | 0.0% |
| Literature & Languages | 0 | 0.0% |
| Liberal Arts & History | 0 | 0.0% |
| Visual & Performing Arts | 0 | 0.0% |
| Communications | 0 | 0.0% |
| Arts & Humanities | 0 | 0.0% |
| Total | 0 | 0.0% |
Transportation & Commute in Yukon
Vehicle Availability by Sex in Yukon
The most prevalent vehicle ownership categories in Yukon are males with 2 vehicles (145, accounting for 79.7%) and females with 2 vehicles (39, making up 371.8%).
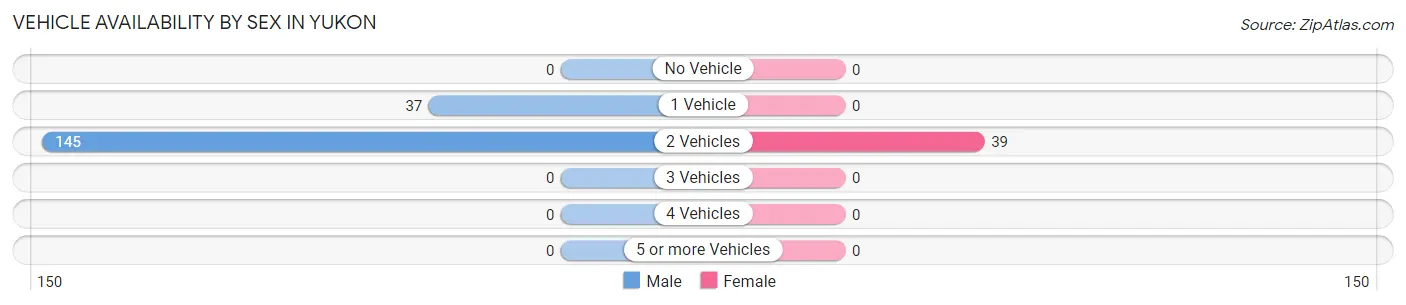
| Vehicles Available | Male | Female |
| No Vehicle | 0 (0.0%) | 0 (0.0%) |
| 1 Vehicle | 37 (20.3%) | 0 (0.0%) |
| 2 Vehicles | 145 (79.7%) | 39 (100.0%) |
| 3 Vehicles | 0 (0.0%) | 0 (0.0%) |
| 4 Vehicles | 0 (0.0%) | 0 (0.0%) |
| 5 or more Vehicles | 0 (0.0%) | 0 (0.0%) |
| Total | 182 (100.0%) | 39 (100.0%) |
Commute Time in Yukon
The most frequently occuring commute durations in Yukon are 15 to 19 minutes (100 commuters, 45.3%), 60 to 89 minutes (45 commuters, 20.4%), and 20 to 24 minutes (39 commuters, 17.6%).
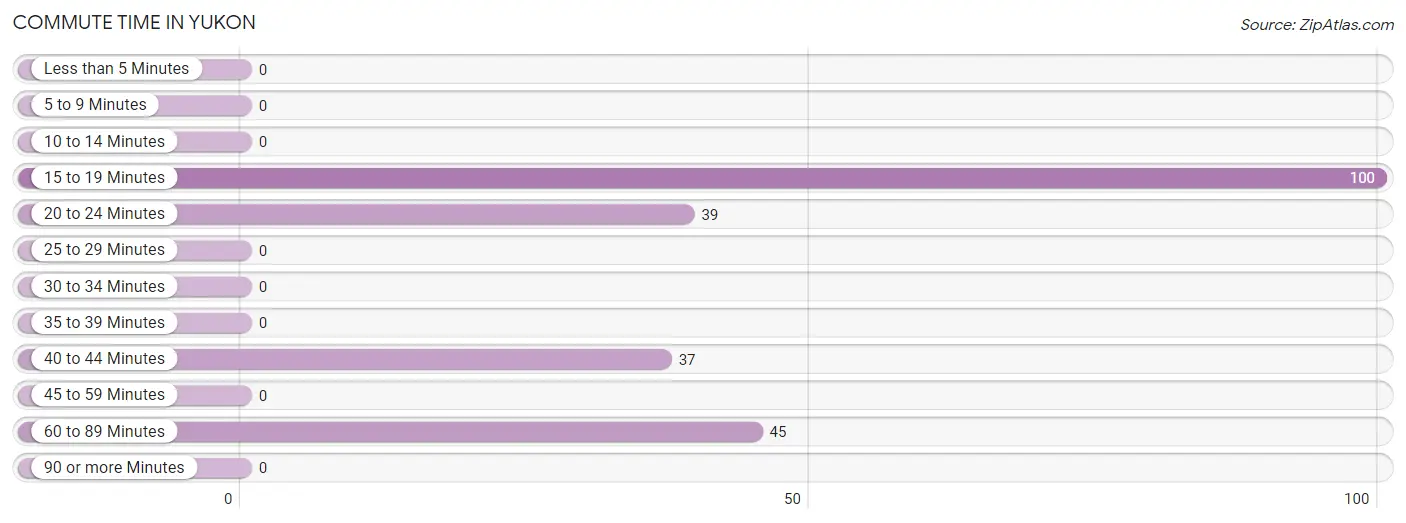
| Commute Time | # Commuters | % Commuters |
| Less than 5 Minutes | 0 | 0.0% |
| 5 to 9 Minutes | 0 | 0.0% |
| 10 to 14 Minutes | 0 | 0.0% |
| 15 to 19 Minutes | 100 | 45.3% |
| 20 to 24 Minutes | 39 | 17.6% |
| 25 to 29 Minutes | 0 | 0.0% |
| 30 to 34 Minutes | 0 | 0.0% |
| 35 to 39 Minutes | 0 | 0.0% |
| 40 to 44 Minutes | 37 | 16.7% |
| 45 to 59 Minutes | 0 | 0.0% |
| 60 to 89 Minutes | 45 | 20.4% |
| 90 or more Minutes | 0 | 0.0% |
Commute Time by Sex in Yukon
The most common commute times in Yukon are 15 to 19 minutes (100 commuters, 54.9%) for males and 20 to 24 minutes (39 commuters, 100.0%) for females.
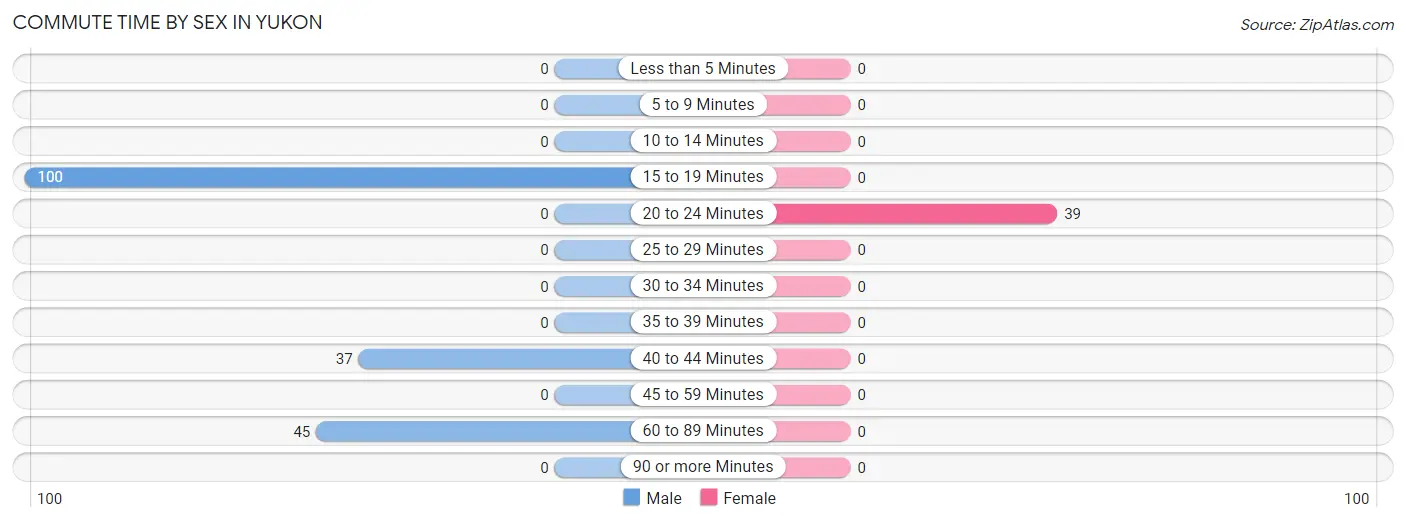
| Commute Time | Male | Female |
| Less than 5 Minutes | 0 (0.0%) | 0 (0.0%) |
| 5 to 9 Minutes | 0 (0.0%) | 0 (0.0%) |
| 10 to 14 Minutes | 0 (0.0%) | 0 (0.0%) |
| 15 to 19 Minutes | 100 (54.9%) | 0 (0.0%) |
| 20 to 24 Minutes | 0 (0.0%) | 39 (100.0%) |
| 25 to 29 Minutes | 0 (0.0%) | 0 (0.0%) |
| 30 to 34 Minutes | 0 (0.0%) | 0 (0.0%) |
| 35 to 39 Minutes | 0 (0.0%) | 0 (0.0%) |
| 40 to 44 Minutes | 37 (20.3%) | 0 (0.0%) |
| 45 to 59 Minutes | 0 (0.0%) | 0 (0.0%) |
| 60 to 89 Minutes | 45 (24.7%) | 0 (0.0%) |
| 90 or more Minutes | 0 (0.0%) | 0 (0.0%) |
Time of Departure to Work by Sex in Yukon
The most frequent times of departure to work in Yukon are 7:00 AM to 7:29 AM (90, 49.4%) for males and 4:00 PM to 11:59 PM (39, 100.0%) for females.
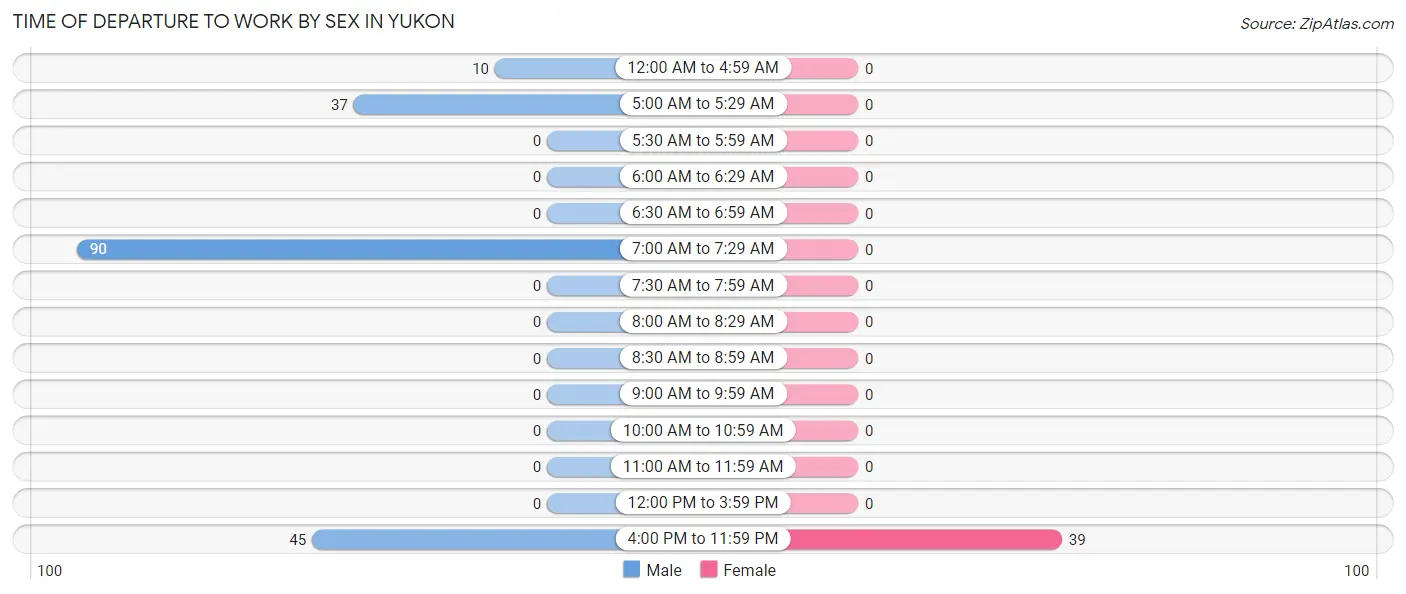
| Time of Departure | Male | Female |
| 12:00 AM to 4:59 AM | 10 (5.5%) | 0 (0.0%) |
| 5:00 AM to 5:29 AM | 37 (20.3%) | 0 (0.0%) |
| 5:30 AM to 5:59 AM | 0 (0.0%) | 0 (0.0%) |
| 6:00 AM to 6:29 AM | 0 (0.0%) | 0 (0.0%) |
| 6:30 AM to 6:59 AM | 0 (0.0%) | 0 (0.0%) |
| 7:00 AM to 7:29 AM | 90 (49.4%) | 0 (0.0%) |
| 7:30 AM to 7:59 AM | 0 (0.0%) | 0 (0.0%) |
| 8:00 AM to 8:29 AM | 0 (0.0%) | 0 (0.0%) |
| 8:30 AM to 8:59 AM | 0 (0.0%) | 0 (0.0%) |
| 9:00 AM to 9:59 AM | 0 (0.0%) | 0 (0.0%) |
| 10:00 AM to 10:59 AM | 0 (0.0%) | 0 (0.0%) |
| 11:00 AM to 11:59 AM | 0 (0.0%) | 0 (0.0%) |
| 12:00 PM to 3:59 PM | 0 (0.0%) | 0 (0.0%) |
| 4:00 PM to 11:59 PM | 45 (24.7%) | 39 (100.0%) |
| Total | 182 (100.0%) | 39 (100.0%) |
Housing Occupancy in Yukon
Occupancy by Ownership in Yukon
Of the total 256 dwellings in Yukon, owner-occupied units account for 206 (80.5%), while renter-occupied units make up 50 (19.5%).
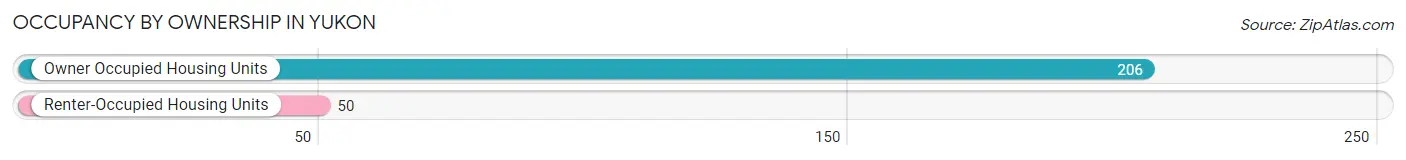
| Occupancy | # Housing Units | % Housing Units |
| Owner Occupied Housing Units | 206 | 80.5% |
| Renter-Occupied Housing Units | 50 | 19.5% |
| Total Occupied Housing Units | 256 | 100.0% |
Occupancy by Household Size in Yukon
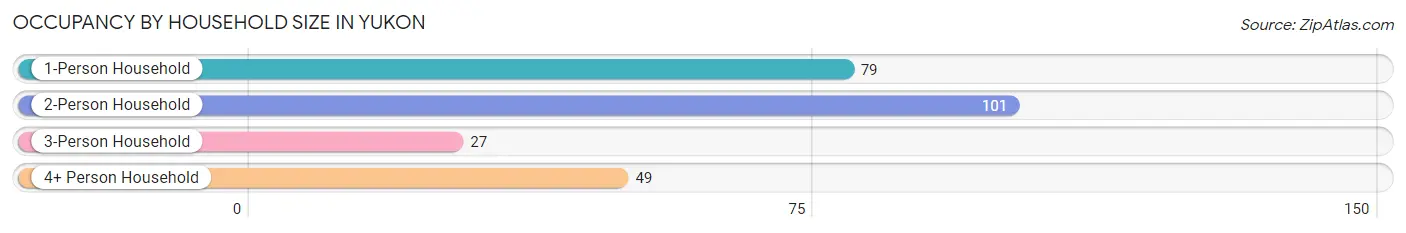
| Household Size | # Housing Units | % Housing Units |
| 1-Person Household | 79 | 30.9% |
| 2-Person Household | 101 | 39.5% |
| 3-Person Household | 27 | 10.5% |
| 4+ Person Household | 49 | 19.1% |
| Total Housing Units | 256 | 100.0% |
Occupancy by Ownership by Household Size in Yukon
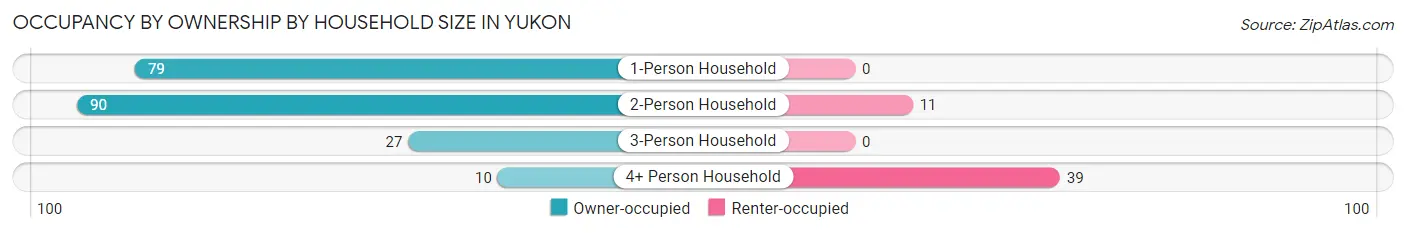
| Household Size | Owner-occupied | Renter-occupied |
| 1-Person Household | 79 (100.0%) | 0 (0.0%) |
| 2-Person Household | 90 (89.1%) | 11 (10.9%) |
| 3-Person Household | 27 (100.0%) | 0 (0.0%) |
| 4+ Person Household | 10 (20.4%) | 39 (79.6%) |
| Total Housing Units | 206 (80.5%) | 50 (19.5%) |
Occupancy by Educational Attainment in Yukon
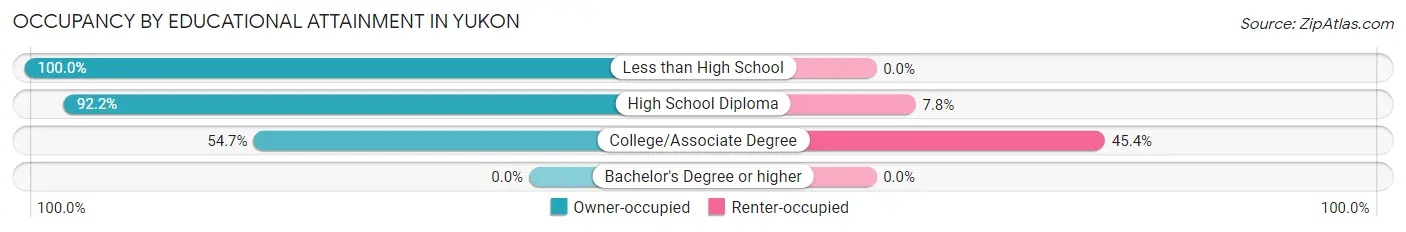
| Household Size | Owner-occupied | Renter-occupied |
| Less than High School | 29 (100.0%) | 0 (0.0%) |
| High School Diploma | 130 (92.2%) | 11 (7.8%) |
| College/Associate Degree | 47 (54.6%) | 39 (45.4%) |
| Bachelor's Degree or higher | 0 (0.0%) | 0 (0.0%) |
Occupancy by Age of Householder in Yukon
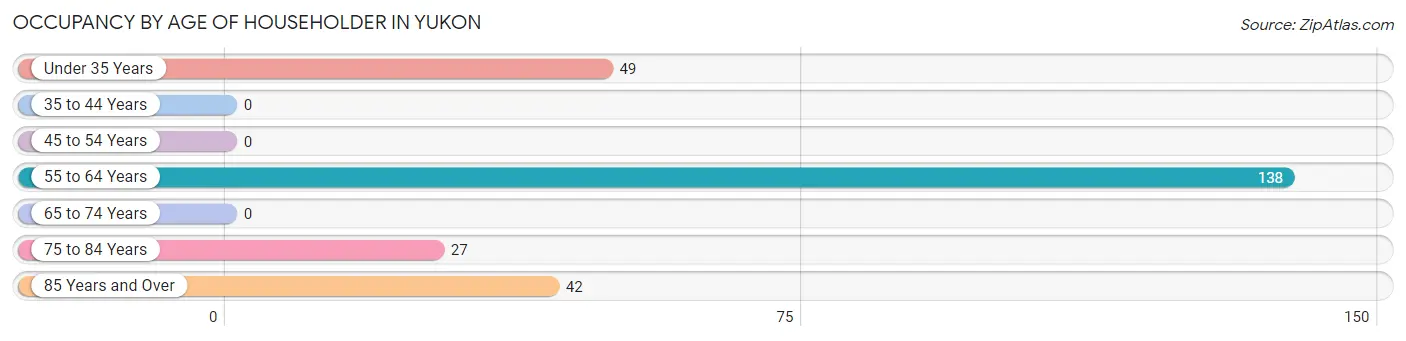
| Age Bracket | # Households | % Households |
| Under 35 Years | 49 | 19.1% |
| 35 to 44 Years | 0 | 0.0% |
| 45 to 54 Years | 0 | 0.0% |
| 55 to 64 Years | 138 | 53.9% |
| 65 to 74 Years | 0 | 0.0% |
| 75 to 84 Years | 27 | 10.5% |
| 85 Years and Over | 42 | 16.4% |
| Total | 256 | 100.0% |
Housing Finances in Yukon
Median Income by Occupancy in Yukon
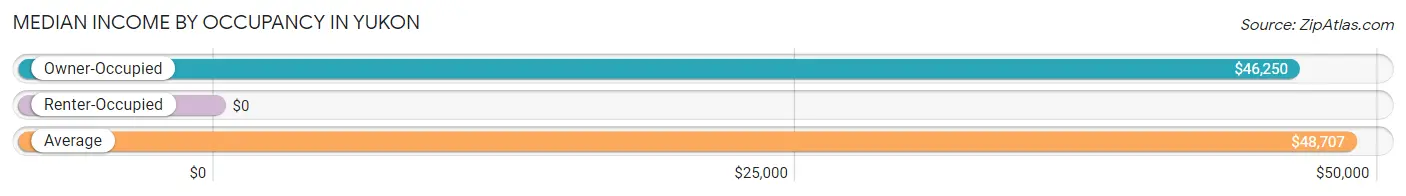
| Occupancy Type | # Households | Median Income |
| Owner-Occupied | 206 (80.5%) | $46,250 |
| Renter-Occupied | 50 (19.5%) | $0 |
| Average | 256 (100.0%) | $48,707 |
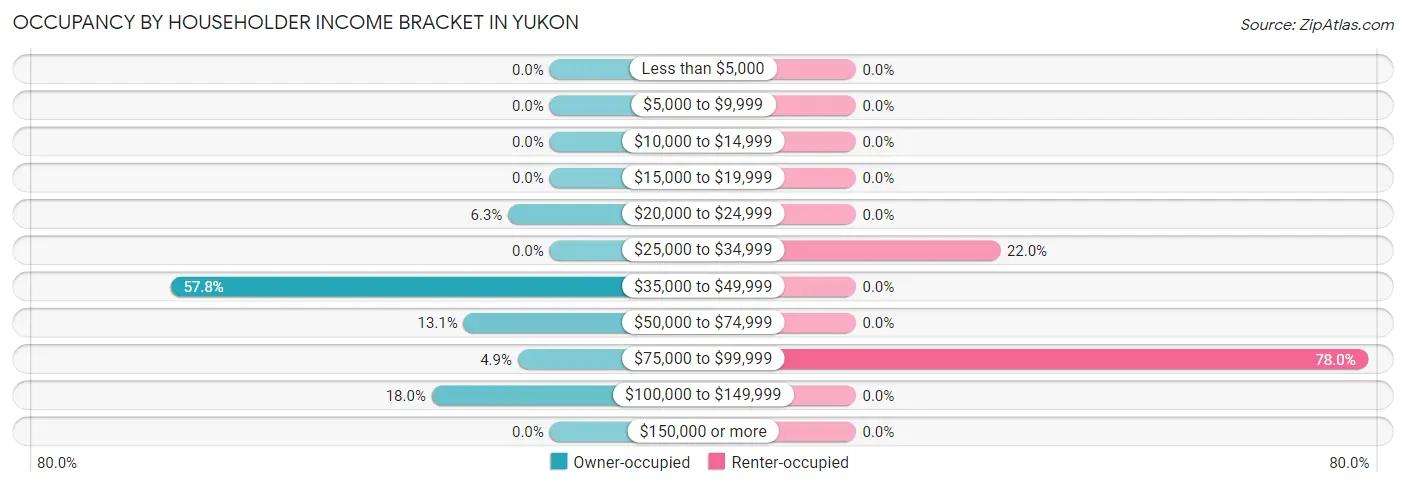
Occupancy by Householder Income Bracket in Yukon
| Income Bracket | Owner-occupied | Renter-occupied |
| Less than $5,000 | 0 (0.0%) | 0 (0.0%) |
| $5,000 to $9,999 | 0 (0.0%) | 0 (0.0%) |
| $10,000 to $14,999 | 0 (0.0%) | 0 (0.0%) |
| $15,000 to $19,999 | 0 (0.0%) | 0 (0.0%) |
| $20,000 to $24,999 | 13 (6.3%) | 0 (0.0%) |
| $25,000 to $34,999 | 0 (0.0%) | 11 (22.0%) |
| $35,000 to $49,999 | 119 (57.8%) | 0 (0.0%) |
| $50,000 to $74,999 | 27 (13.1%) | 0 (0.0%) |
| $75,000 to $99,999 | 10 (4.9%) | 39 (78.0%) |
| $100,000 to $149,999 | 37 (18.0%) | 0 (0.0%) |
| $150,000 or more | 0 (0.0%) | 0 (0.0%) |
| Total | 206 (100.0%) | 50 (100.0%) |
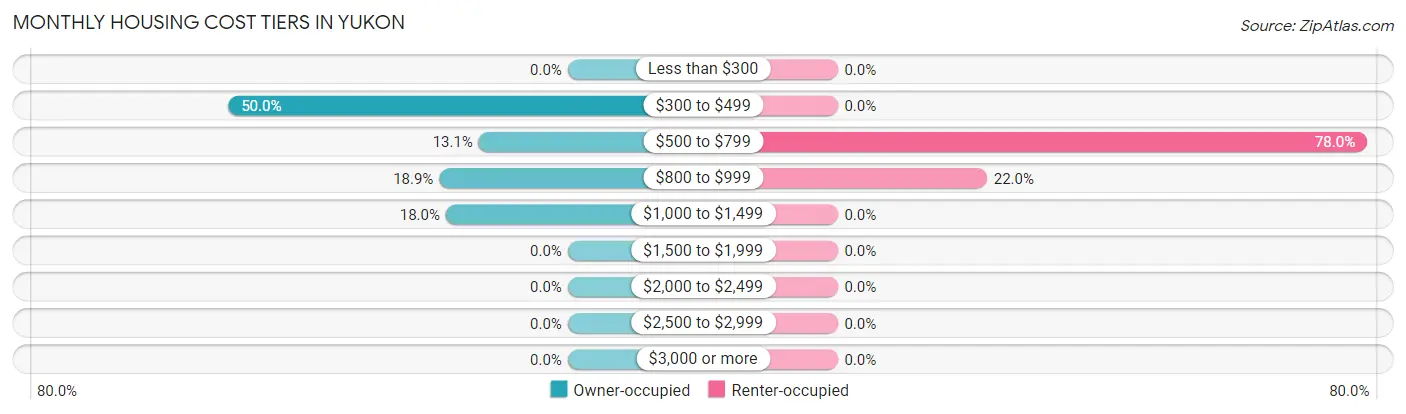
Monthly Housing Cost Tiers in Yukon
| Monthly Cost | Owner-occupied | Renter-occupied |
| Less than $300 | 0 (0.0%) | 0 (0.0%) |
| $300 to $499 | 103 (50.0%) | 0 (0.0%) |
| $500 to $799 | 27 (13.1%) | 39 (78.0%) |
| $800 to $999 | 39 (18.9%) | 11 (22.0%) |
| $1,000 to $1,499 | 37 (18.0%) | 0 (0.0%) |
| $1,500 to $1,999 | 0 (0.0%) | 0 (0.0%) |
| $2,000 to $2,499 | 0 (0.0%) | 0 (0.0%) |
| $2,500 to $2,999 | 0 (0.0%) | 0 (0.0%) |
| $3,000 or more | 0 (0.0%) | 0 (0.0%) |
| Total | 206 (100.0%) | 50 (100.0%) |
Physical Housing Characteristics in Yukon
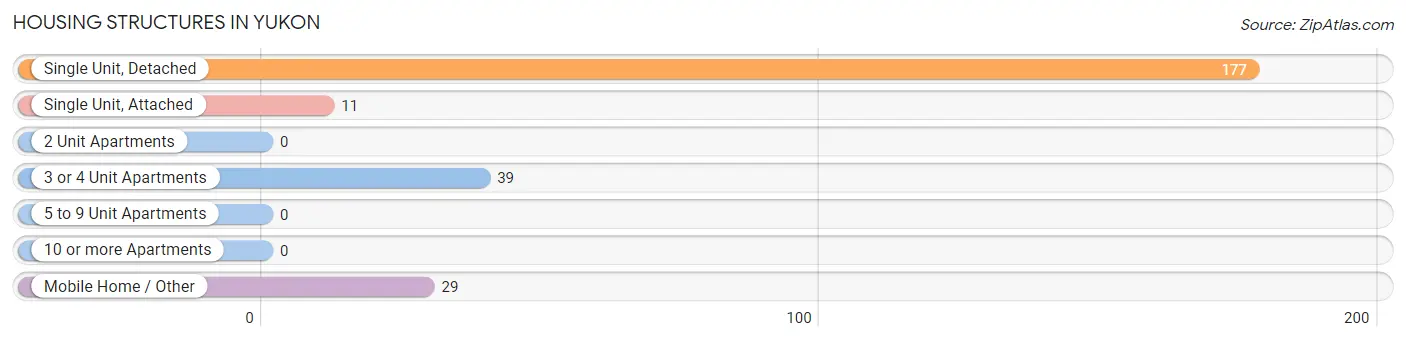
Housing Structures in Yukon
| Structure Type | # Housing Units | % Housing Units |
| Single Unit, Detached | 177 | 69.1% |
| Single Unit, Attached | 11 | 4.3% |
| 2 Unit Apartments | 0 | 0.0% |
| 3 or 4 Unit Apartments | 39 | 15.2% |
| 5 to 9 Unit Apartments | 0 | 0.0% |
| 10 or more Apartments | 0 | 0.0% |
| Mobile Home / Other | 29 | 11.3% |
| Total | 256 | 100.0% |
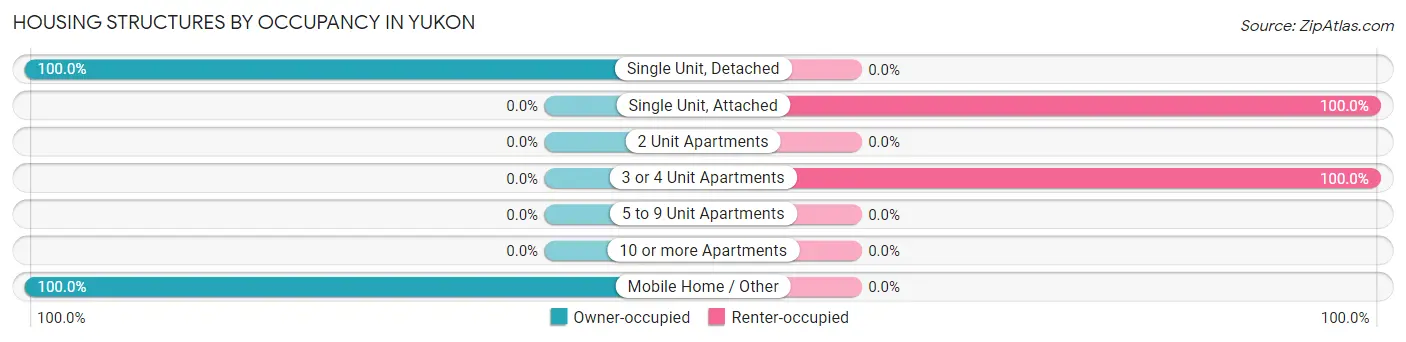
Housing Structures by Occupancy in Yukon
| Structure Type | Owner-occupied | Renter-occupied |
| Single Unit, Detached | 177 (100.0%) | 0 (0.0%) |
| Single Unit, Attached | 0 (0.0%) | 11 (100.0%) |
| 2 Unit Apartments | 0 (0.0%) | 0 (0.0%) |
| 3 or 4 Unit Apartments | 0 (0.0%) | 39 (100.0%) |
| 5 to 9 Unit Apartments | 0 (0.0%) | 0 (0.0%) |
| 10 or more Apartments | 0 (0.0%) | 0 (0.0%) |
| Mobile Home / Other | 29 (100.0%) | 0 (0.0%) |
| Total | 206 (80.5%) | 50 (19.5%) |
Housing Structures by Number of Rooms in Yukon
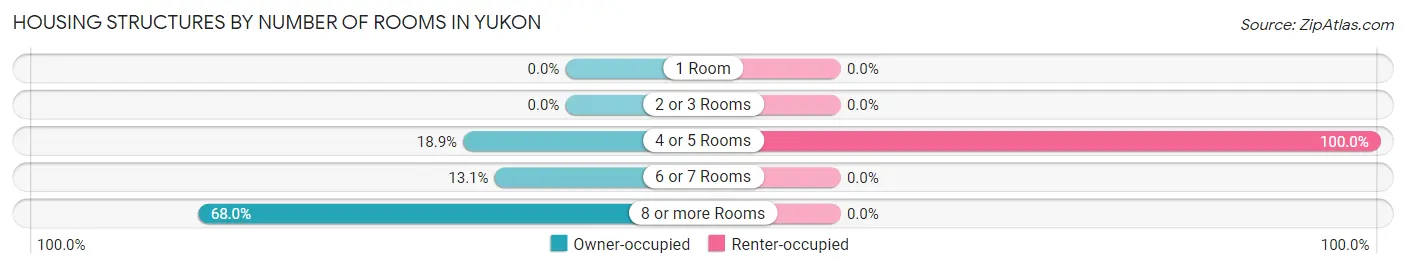
| Number of Rooms | Owner-occupied | Renter-occupied |
| 1 Room | 0 (0.0%) | 0 (0.0%) |
| 2 or 3 Rooms | 0 (0.0%) | 0 (0.0%) |
| 4 or 5 Rooms | 39 (18.9%) | 50 (100.0%) |
| 6 or 7 Rooms | 27 (13.1%) | 0 (0.0%) |
| 8 or more Rooms | 140 (68.0%) | 0 (0.0%) |
| Total | 206 (100.0%) | 50 (100.0%) |
Housing Structure by Heating Type in Yukon
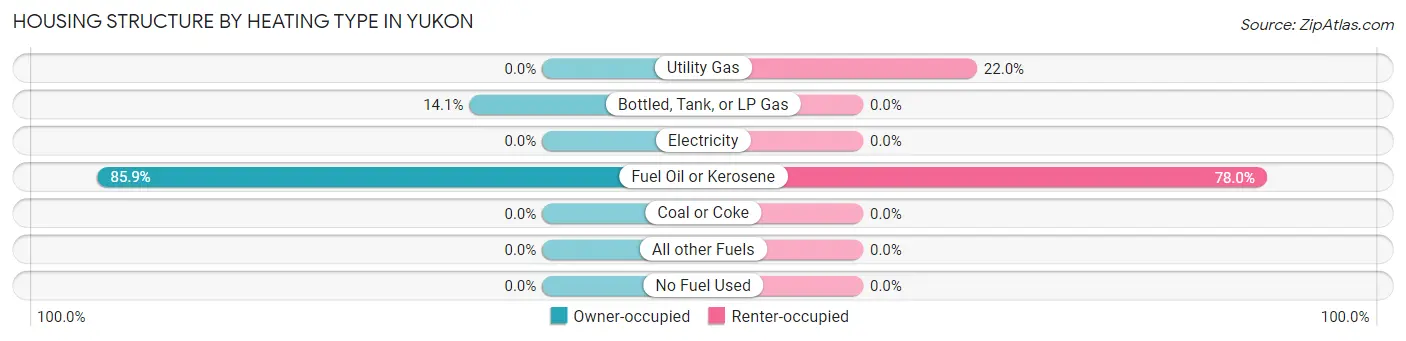
| Heating Type | Owner-occupied | Renter-occupied |
| Utility Gas | 0 (0.0%) | 11 (22.0%) |
| Bottled, Tank, or LP Gas | 29 (14.1%) | 0 (0.0%) |
| Electricity | 0 (0.0%) | 0 (0.0%) |
| Fuel Oil or Kerosene | 177 (85.9%) | 39 (78.0%) |
| Coal or Coke | 0 (0.0%) | 0 (0.0%) |
| All other Fuels | 0 (0.0%) | 0 (0.0%) |
| No Fuel Used | 0 (0.0%) | 0 (0.0%) |
| Total | 206 (100.0%) | 50 (100.0%) |
Household Vehicle Usage in Yukon
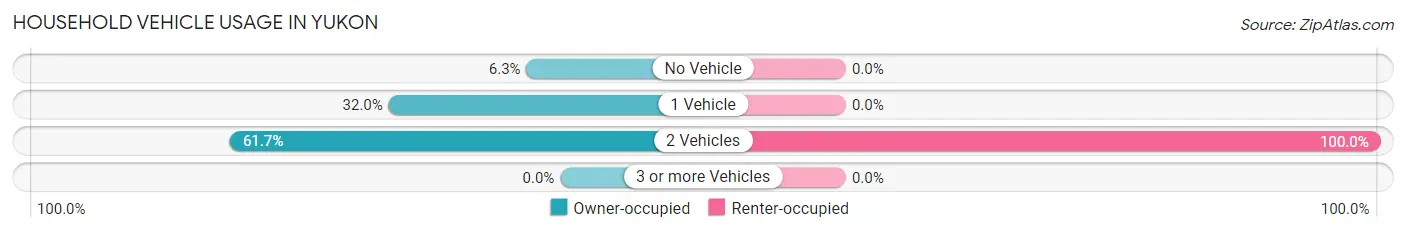
| Vehicles per Household | Owner-occupied | Renter-occupied |
| No Vehicle | 13 (6.3%) | 0 (0.0%) |
| 1 Vehicle | 66 (32.0%) | 0 (0.0%) |
| 2 Vehicles | 127 (61.7%) | 50 (100.0%) |
| 3 or more Vehicles | 0 (0.0%) | 0 (0.0%) |
| Total | 206 (100.0%) | 50 (100.0%) |
Real Estate & Mortgages in Yukon
Real Estate and Mortgage Overview in Yukon
| Characteristic | Without Mortgage | With Mortgage |
| Housing Units | 159 | 47 |
| Median Property Value | $108,000 | $0 |
| Median Household Income | $44,347 | $0 |
| Monthly Housing Costs | $477 | $0 |
| Real Estate Taxes | $1,316 | $0 |
Property Value by Mortgage Status in Yukon
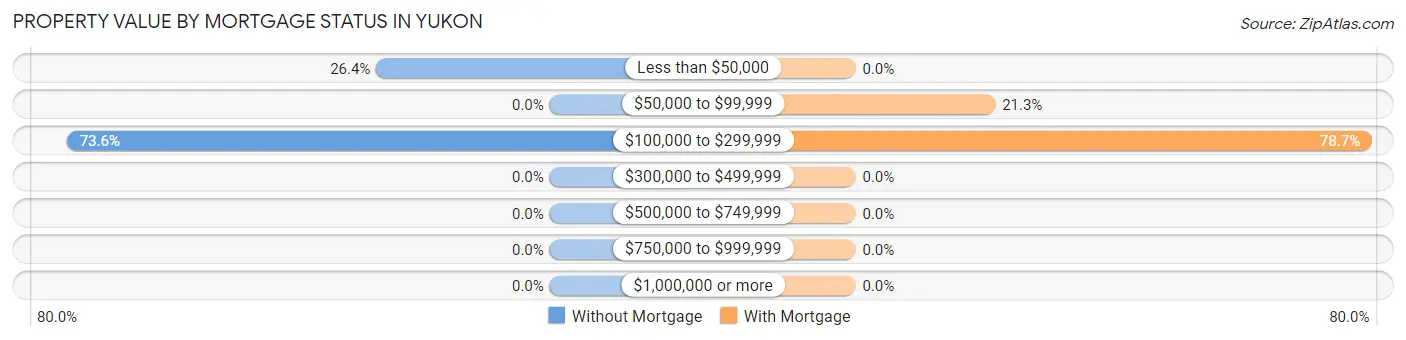
| Property Value | Without Mortgage | With Mortgage |
| Less than $50,000 | 42 (26.4%) | 0 (0.0%) |
| $50,000 to $99,999 | 0 (0.0%) | 10 (21.3%) |
| $100,000 to $299,999 | 117 (73.6%) | 37 (78.7%) |
| $300,000 to $499,999 | 0 (0.0%) | 0 (0.0%) |
| $500,000 to $749,999 | 0 (0.0%) | 0 (0.0%) |
| $750,000 to $999,999 | 0 (0.0%) | 0 (0.0%) |
| $1,000,000 or more | 0 (0.0%) | 0 (0.0%) |
| Total | 159 (100.0%) | 47 (100.0%) |
Household Income by Mortgage Status in Yukon
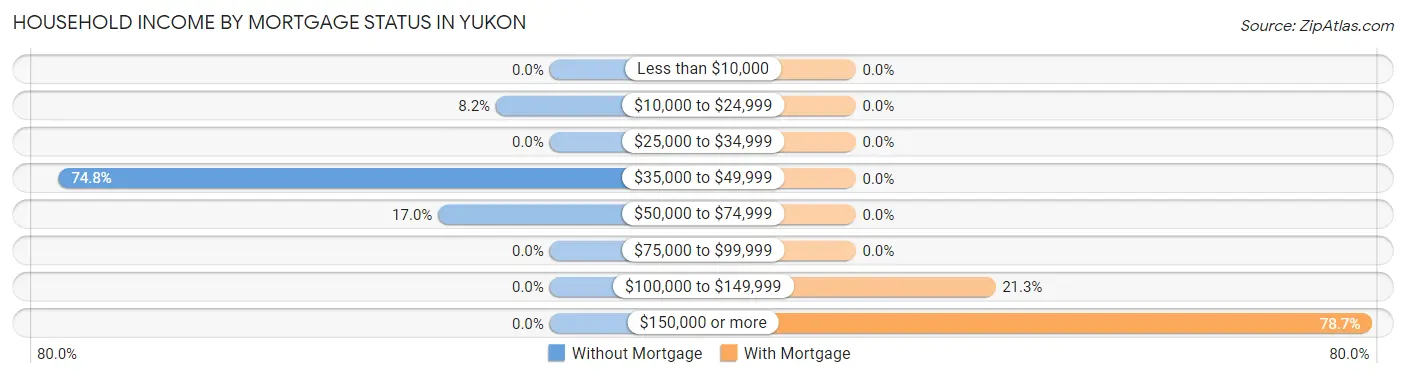
| Household Income | Without Mortgage | With Mortgage |
| Less than $10,000 | 0 (0.0%) | 0 (0.0%) |
| $10,000 to $24,999 | 13 (8.2%) | 0 (0.0%) |
| $25,000 to $34,999 | 0 (0.0%) | 0 (0.0%) |
| $35,000 to $49,999 | 119 (74.8%) | 0 (0.0%) |
| $50,000 to $74,999 | 27 (17.0%) | 0 (0.0%) |
| $75,000 to $99,999 | 0 (0.0%) | 0 (0.0%) |
| $100,000 to $149,999 | 0 (0.0%) | 10 (21.3%) |
| $150,000 or more | 0 (0.0%) | 37 (78.7%) |
| Total | 159 (100.0%) | 47 (100.0%) |
Property Value to Household Income Ratio in Yukon
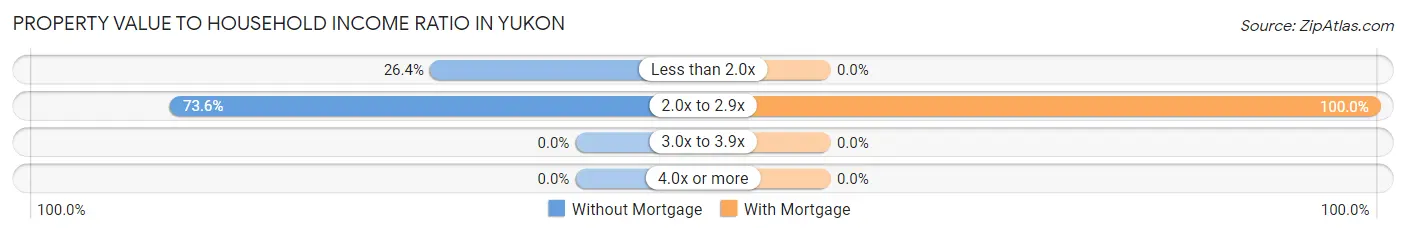
| Value-to-Income Ratio | Without Mortgage | With Mortgage |
| Less than 2.0x | 42 (26.4%) | 0 (0.0%) |
| 2.0x to 2.9x | 117 (73.6%) | 47 (100.0%) |
| 3.0x to 3.9x | 0 (0.0%) | 0 (0.0%) |
| 4.0x or more | 0 (0.0%) | 0 (0.0%) |
| Total | 159 (100.0%) | 47 (100.0%) |
Real Estate Taxes by Mortgage Status in Yukon
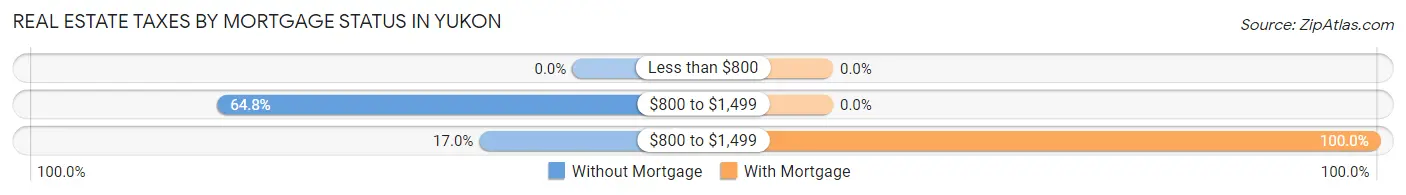
| Property Taxes | Without Mortgage | With Mortgage |
| Less than $800 | 0 (0.0%) | 0 (0.0%) |
| $800 to $1,499 | 103 (64.8%) | 0 (0.0%) |
| $800 to $1,499 | 27 (17.0%) | 47 (100.0%) |
| Total | 159 (100.0%) | 47 (100.0%) |
Health & Disability in Yukon
Health Insurance Coverage by Age in Yukon
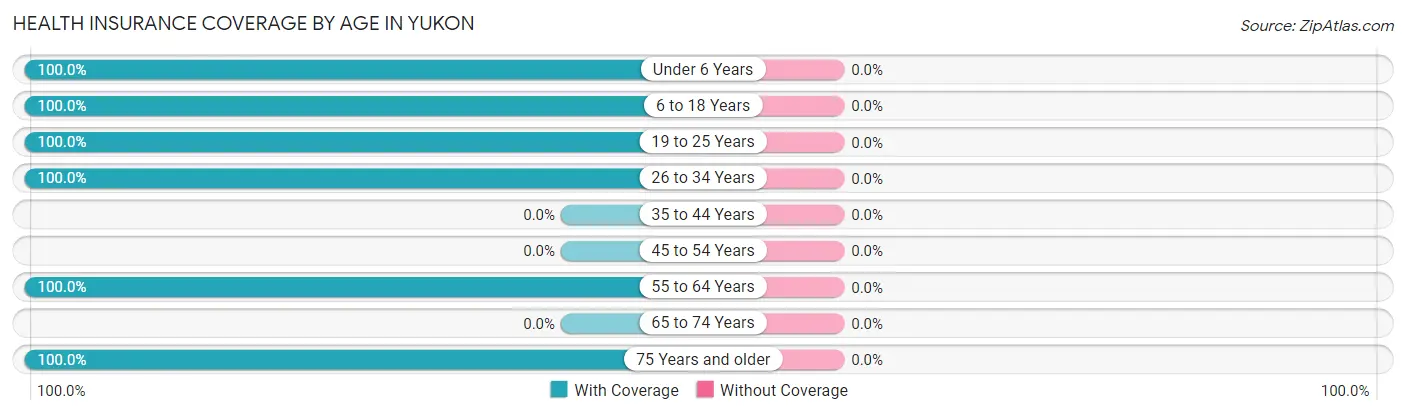
| Age Bracket | With Coverage | Without Coverage |
| Under 6 Years | 97 (100.0%) | 0 (0.0%) |
| 6 to 18 Years | 41 (100.0%) | 0 (0.0%) |
| 19 to 25 Years | 45 (100.0%) | 0 (0.0%) |
| 26 to 34 Years | 60 (100.0%) | 0 (0.0%) |
| 35 to 44 Years | 0 (0.0%) | 0 (0.0%) |
| 45 to 54 Years | 0 (0.0%) | 0 (0.0%) |
| 55 to 64 Years | 185 (100.0%) | 0 (0.0%) |
| 65 to 74 Years | 0 (0.0%) | 0 (0.0%) |
| 75 Years and older | 182 (100.0%) | 0 (0.0%) |
| Total | 610 (100.0%) | 0 (0.0%) |
Health Insurance Coverage by Citizenship Status in Yukon
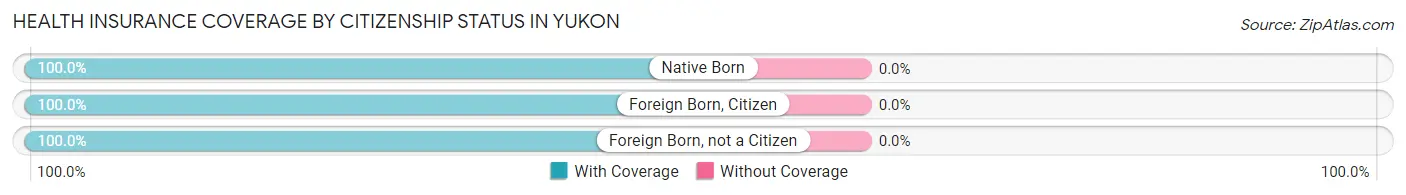
| Citizenship Status | With Coverage | Without Coverage |
| Native Born | 97 (100.0%) | 0 (0.0%) |
| Foreign Born, Citizen | 41 (100.0%) | 0 (0.0%) |
| Foreign Born, not a Citizen | 45 (100.0%) | 0 (0.0%) |
Health Insurance Coverage by Household Income in Yukon
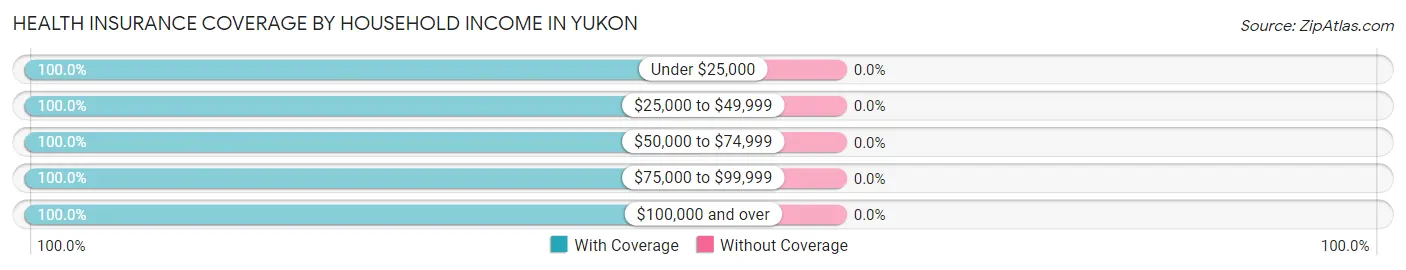
| Household Income | With Coverage | Without Coverage |
| Under $25,000 | 13 (100.0%) | 0 (0.0%) |
| $25,000 to $49,999 | 228 (100.0%) | 0 (0.0%) |
| $50,000 to $74,999 | 89 (100.0%) | 0 (0.0%) |
| $75,000 to $99,999 | 243 (100.0%) | 0 (0.0%) |
| $100,000 and over | 37 (100.0%) | 0 (0.0%) |
Public vs Private Health Insurance Coverage by Age in Yukon
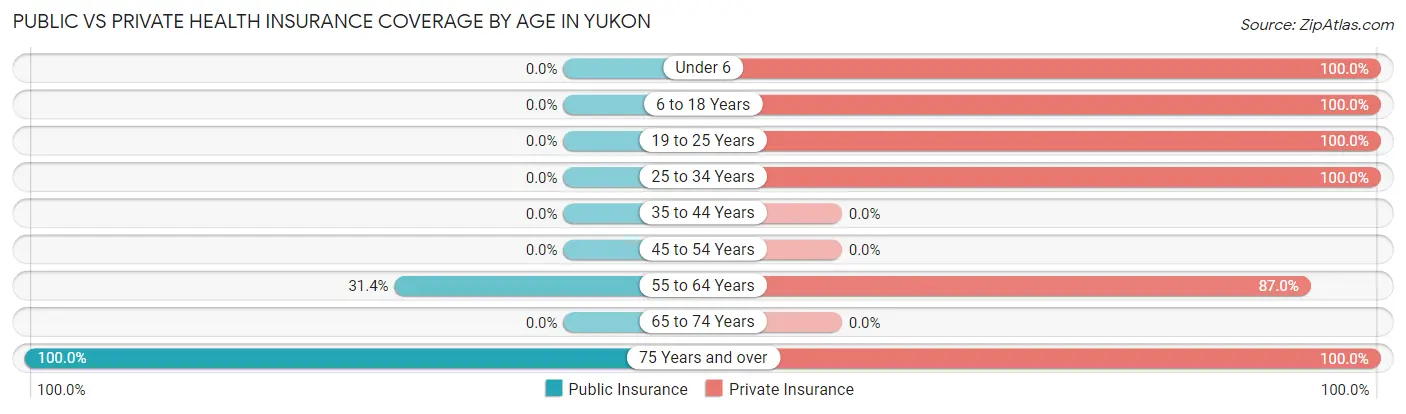
| Age Bracket | Public Insurance | Private Insurance |
| Under 6 | 0 (0.0%) | 97 (100.0%) |
| 6 to 18 Years | 0 (0.0%) | 41 (100.0%) |
| 19 to 25 Years | 0 (0.0%) | 45 (100.0%) |
| 25 to 34 Years | 0 (0.0%) | 60 (100.0%) |
| 35 to 44 Years | 0 (0.0%) | 0 (0.0%) |
| 45 to 54 Years | 0 (0.0%) | 0 (0.0%) |
| 55 to 64 Years | 58 (31.4%) | 161 (87.0%) |
| 65 to 74 Years | 0 (0.0%) | 0 (0.0%) |
| 75 Years and over | 182 (100.0%) | 182 (100.0%) |
| Total | 240 (39.3%) | 586 (96.1%) |
Disability Status by Sex by Age in Yukon
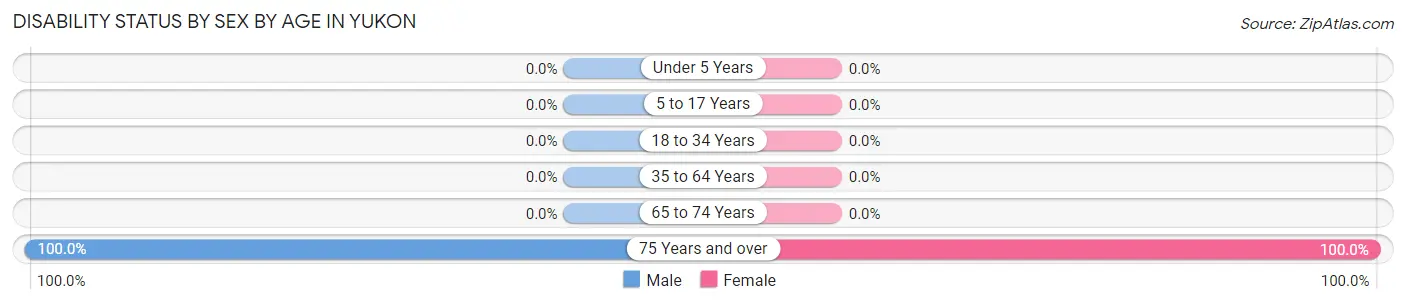
| Age Bracket | Male | Female |
| Under 5 Years | 0 (0.0%) | 0 (0.0%) |
| 5 to 17 Years | 0 (0.0%) | 0 (0.0%) |
| 18 to 34 Years | 0 (0.0%) | 0 (0.0%) |
| 35 to 64 Years | 0 (0.0%) | 0 (0.0%) |
| 65 to 74 Years | 0 (0.0%) | 0 (0.0%) |
| 75 Years and over | 57 (100.0%) | 125 (100.0%) |
Disability Class by Sex by Age in Yukon
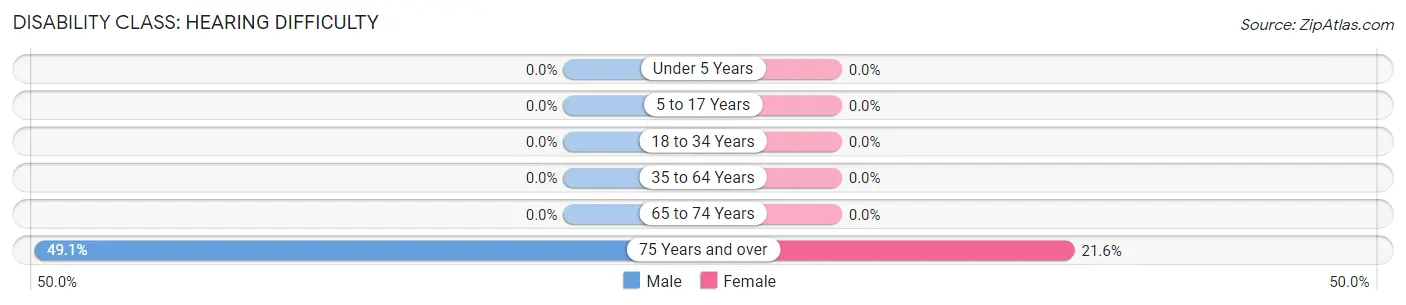
Disability Class: Hearing Difficulty
| Age Bracket | Male | Female |
| Under 5 Years | 0 (0.0%) | 0 (0.0%) |
| 5 to 17 Years | 0 (0.0%) | 0 (0.0%) |
| 18 to 34 Years | 0 (0.0%) | 0 (0.0%) |
| 35 to 64 Years | 0 (0.0%) | 0 (0.0%) |
| 65 to 74 Years | 0 (0.0%) | 0 (0.0%) |
| 75 Years and over | 28 (49.1%) | 27 (21.6%) |
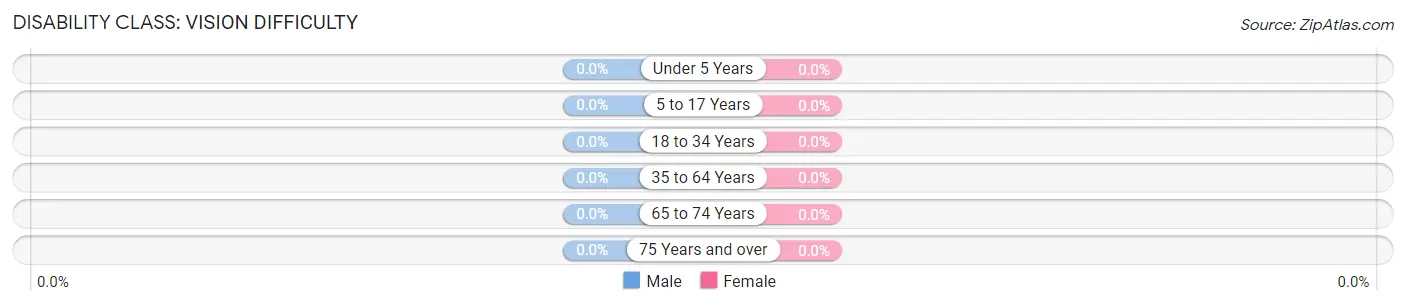
Disability Class: Vision Difficulty
| Age Bracket | Male | Female |
| Under 5 Years | 0 (0.0%) | 0 (0.0%) |
| 5 to 17 Years | 0 (0.0%) | 0 (0.0%) |
| 18 to 34 Years | 0 (0.0%) | 0 (0.0%) |
| 35 to 64 Years | 0 (0.0%) | 0 (0.0%) |
| 65 to 74 Years | 0 (0.0%) | 0 (0.0%) |
| 75 Years and over | 0 (0.0%) | 0 (0.0%) |
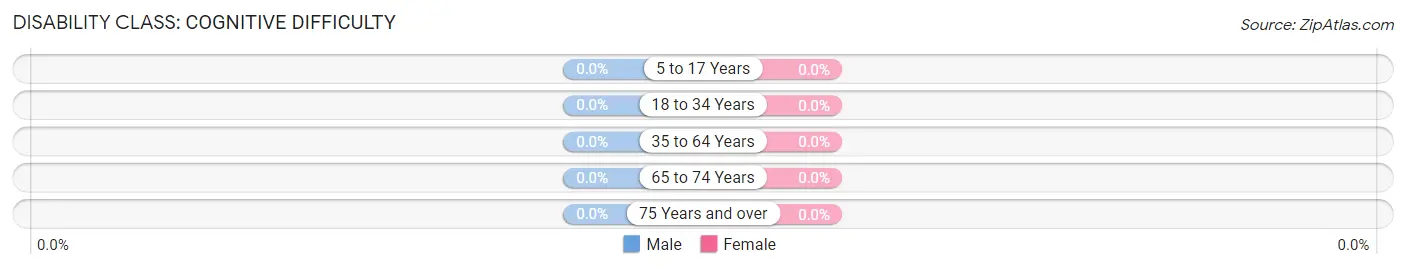
Disability Class: Cognitive Difficulty
| Age Bracket | Male | Female |
| 5 to 17 Years | 0 (0.0%) | 0 (0.0%) |
| 18 to 34 Years | 0 (0.0%) | 0 (0.0%) |
| 35 to 64 Years | 0 (0.0%) | 0 (0.0%) |
| 65 to 74 Years | 0 (0.0%) | 0 (0.0%) |
| 75 Years and over | 0 (0.0%) | 0 (0.0%) |
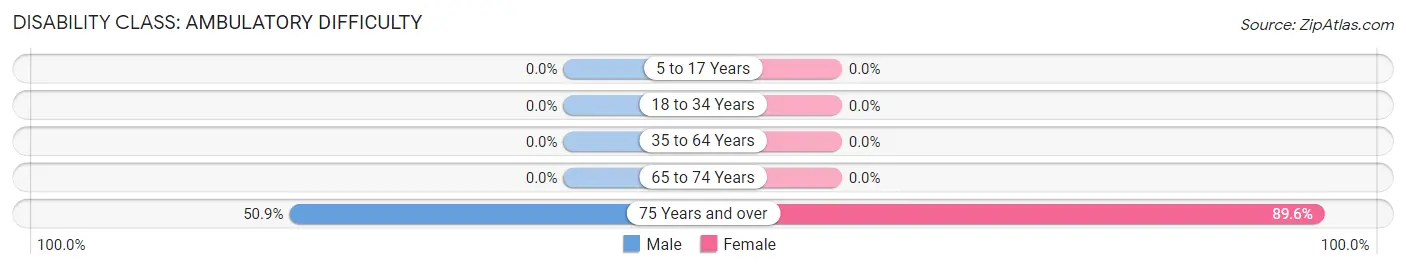
Disability Class: Ambulatory Difficulty
| Age Bracket | Male | Female |
| 5 to 17 Years | 0 (0.0%) | 0 (0.0%) |
| 18 to 34 Years | 0 (0.0%) | 0 (0.0%) |
| 35 to 64 Years | 0 (0.0%) | 0 (0.0%) |
| 65 to 74 Years | 0 (0.0%) | 0 (0.0%) |
| 75 Years and over | 29 (50.9%) | 112 (89.6%) |
Disability Class: Self-Care Difficulty
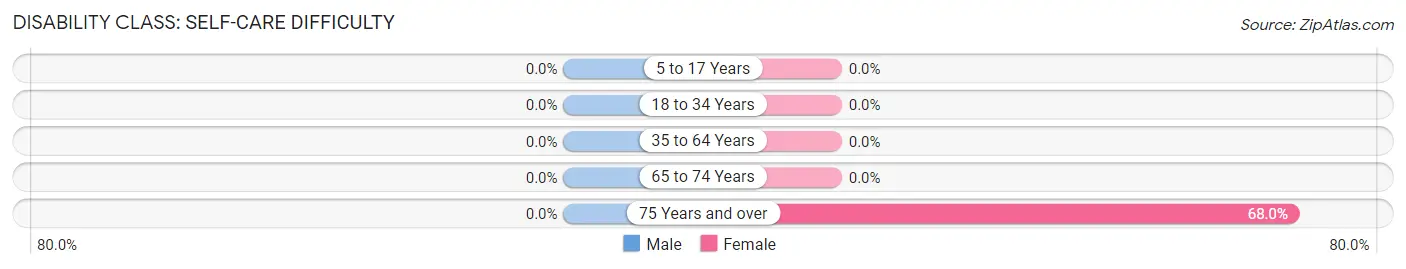
| Age Bracket | Male | Female |
| 5 to 17 Years | 0 (0.0%) | 0 (0.0%) |
| 18 to 34 Years | 0 (0.0%) | 0 (0.0%) |
| 35 to 64 Years | 0 (0.0%) | 0 (0.0%) |
| 65 to 74 Years | 0 (0.0%) | 0 (0.0%) |
| 75 Years and over | 0 (0.0%) | 85 (68.0%) |
Technology Access in Yukon
Computing Device Access in Yukon
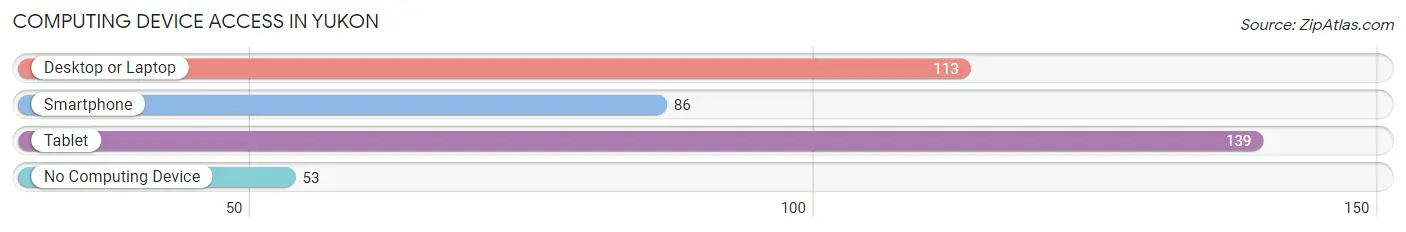
| Device Type | # Households | % Households |
| Desktop or Laptop | 113 | 44.1% |
| Smartphone | 86 | 33.6% |
| Tablet | 139 | 54.3% |
| No Computing Device | 53 | 20.7% |
| Total | 256 | 100.0% |
Internet Access in Yukon
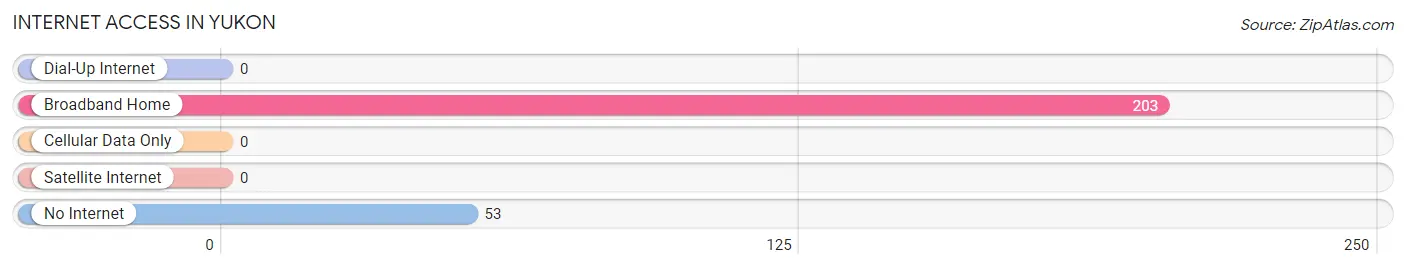
| Internet Type | # Households | % Households |
| Dial-Up Internet | 0 | 0.0% |
| Broadband Home | 203 | 79.3% |
| Cellular Data Only | 0 | 0.0% |
| Satellite Internet | 0 | 0.0% |
| No Internet | 53 | 20.7% |
| Total | 256 | 100.0% |
Yukon Summary
Yukon is a borough located in the western part of Pennsylvania in Beaver County. It is situated along the Ohio River, approximately 25 miles northwest of Pittsburgh. The population of Yukon was 1,845 at the 2010 census.
History
Yukon was founded in 1876 by a group of settlers from the nearby town of Economy. The town was named after the Yukon River in Alaska, which was made famous by the Klondike Gold Rush of 1897. The town was originally a farming community, but it soon became a center for the coal and steel industries. The first coal mine in the area was opened in 1877, and the first steel mill was built in 1883.
The town grew rapidly in the late 19th and early 20th centuries, and by the 1920s it had become a bustling industrial center. The population peaked at around 5,000 in the 1930s, but it began to decline after World War II as the coal and steel industries declined. The population has remained relatively stable since then, and today Yukon is a quiet residential community.
Geography
Yukon is located in western Pennsylvania, approximately 25 miles northwest of Pittsburgh. It is situated along the Ohio River, and is bordered by the towns of Economy, Baden, and Ambridge. The borough covers an area of 1.2 square miles, and is mostly flat with some rolling hills.
Economy
Yukon’s economy is largely based on the service industry. The town is home to several small businesses, including restaurants, retail stores, and professional services. The town also has a few manufacturing companies, including a steel mill and a coal mine.
Demographics
As of the 2010 census, Yukon had a population of 1,845. The racial makeup of the town was 95.3% White, 1.7% African American, 0.3% Native American, 0.7% Asian, 0.1% Pacific Islander, and 1.9% from other races. The median household income was $37,917, and the median family income was $45,938. The per capita income was $19,945. About 8.3% of the population was below the poverty line.
Common Questions
What is Per Capita Income in Yukon?
Per Capita income in Yukon is $28,607.
What is the Median Family Income in Yukon?
Median Family Income in Yukon is $44,806.
What is the Median Household income in Yukon?
Median Household Income in Yukon is $48,707.
What is Inequality or Gini Index in Yukon?
Inequality or Gini Index in Yukon is 0.28.
What is the Total Population of Yukon?
Total Population of Yukon is 610.
What is the Total Male Population of Yukon?
Total Male Population of Yukon is 365.
What is the Total Female Population of Yukon?
Total Female Population of Yukon is 245.
What is the Ratio of Males per 100 Females in Yukon?
There are 148.98 Males per 100 Females in Yukon.
What is the Ratio of Females per 100 Males in Yukon?
There are 67.12 Females per 100 Males in Yukon.
What is the Median Population Age in Yukon?
Median Population Age in Yukon is 58.8 Years.
What is the Average Family Size in Yukon
Average Family Size in Yukon is 3.0 People.
What is the Average Household Size in Yukon
Average Household Size in Yukon is 2.4 People.
How Large is the Labor Force in Yukon?
There are 221 People in the Labor Forcein in Yukon.
What is the Percentage of People in the Labor Force in Yukon?
46.8% of People are in the Labor Force in Yukon.