Camp Hill borough, PA Map & Demographics
Camp Hill borough Overview
$48,752
PER CAPITA INCOME
$128,259
AVG FAMILY INCOME
$104,959
AVG HOUSEHOLD INCOME
32.2%
WAGE / INCOME GAP [ % ]
67.8¢/ $1
WAGE / INCOME GAP [ $ ]
0.36
INEQUALITY / GINI INDEX
8,133
TOTAL POPULATION
3,823
MALE POPULATION
4,310
FEMALE POPULATION
88.70
MALES / 100 FEMALES
112.74
FEMALES / 100 MALES
42.5
MEDIAN AGE
3.1
AVG FAMILY SIZE
2.5
AVG HOUSEHOLD SIZE
4,576
LABOR FORCE [ PEOPLE ]
70.7%
PERCENT IN LABOR FORCE
2.6%
UNEMPLOYMENT RATE
Income in Camp Hill borough
Income Overview in Camp Hill borough
Per Capita Income in Camp Hill borough is $48,752, while median incomes of families and households are $128,259 and $104,959 respectively.
| Characteristic | Number | Measure |
| Per Capita Income | 8,133 | $48,752 |
| Median Family Income | 2,104 | $128,259 |
| Mean Family Income | 2,104 | $139,514 |
| Median Household Income | 3,245 | $104,959 |
| Mean Household Income | 3,245 | $117,553 |
| Income Deficit | 2,104 | $0 |
| Wage / Income Gap (%) | 8,133 | 32.24% |
| Wage / Income Gap ($) | 8,133 | 67.76¢ per $1 |
| Gini / Inequality Index | 8,133 | 0.36 |
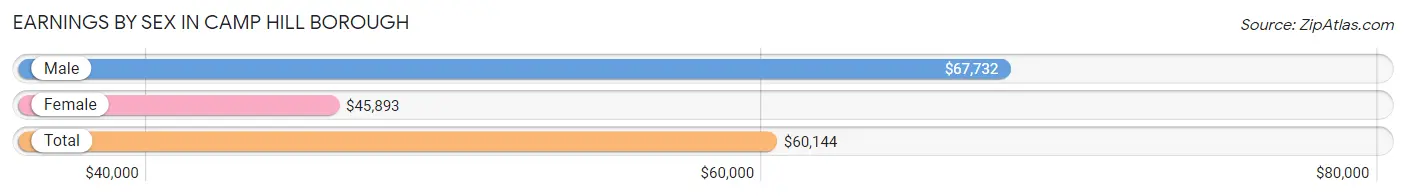
Earnings by Sex in Camp Hill borough
Average Earnings in Camp Hill borough are $60,144, $67,732 for men and $45,893 for women, a difference of 32.2%.
| Sex | Number | Average Earnings |
| Male | 2,429 (50.1%) | $67,732 |
| Female | 2,417 (49.9%) | $45,893 |
| Total | 4,846 (100.0%) | $60,144 |
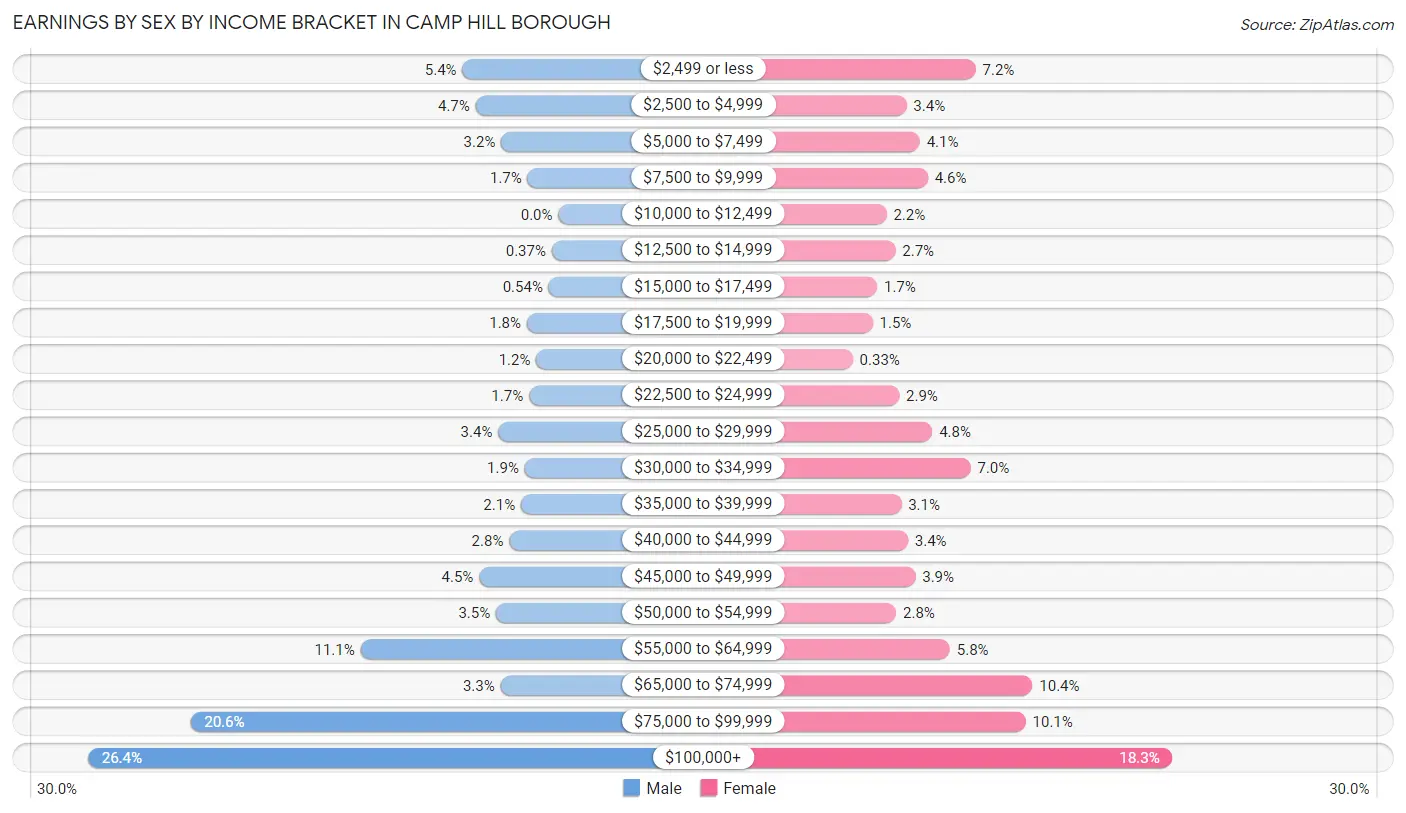
Earnings by Sex by Income Bracket in Camp Hill borough
The most common earnings brackets in Camp Hill borough are $100,000+ for men (641 | 26.4%) and $100,000+ for women (441 | 18.2%).
| Income | Male | Female |
| $2,499 or less | 131 (5.4%) | 175 (7.2%) |
| $2,500 to $4,999 | 113 (4.6%) | 81 (3.4%) |
| $5,000 to $7,499 | 78 (3.2%) | 99 (4.1%) |
| $7,500 to $9,999 | 42 (1.7%) | 110 (4.5%) |
| $10,000 to $12,499 | 0 (0.0%) | 54 (2.2%) |
| $12,500 to $14,999 | 9 (0.4%) | 66 (2.7%) |
| $15,000 to $17,499 | 13 (0.5%) | 41 (1.7%) |
| $17,500 to $19,999 | 43 (1.8%) | 35 (1.5%) |
| $20,000 to $22,499 | 30 (1.2%) | 8 (0.3%) |
| $22,500 to $24,999 | 40 (1.7%) | 71 (2.9%) |
| $25,000 to $29,999 | 82 (3.4%) | 116 (4.8%) |
| $30,000 to $34,999 | 46 (1.9%) | 168 (7.0%) |
| $35,000 to $39,999 | 51 (2.1%) | 74 (3.1%) |
| $40,000 to $44,999 | 67 (2.8%) | 83 (3.4%) |
| $45,000 to $49,999 | 108 (4.4%) | 93 (3.8%) |
| $50,000 to $54,999 | 85 (3.5%) | 67 (2.8%) |
| $55,000 to $64,999 | 270 (11.1%) | 140 (5.8%) |
| $65,000 to $74,999 | 79 (3.3%) | 252 (10.4%) |
| $75,000 to $99,999 | 501 (20.6%) | 243 (10.1%) |
| $100,000+ | 641 (26.4%) | 441 (18.2%) |
| Total | 2,429 (100.0%) | 2,417 (100.0%) |
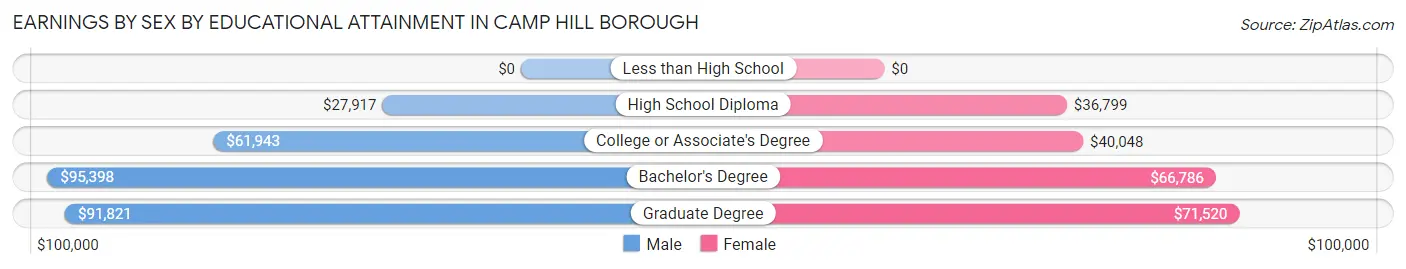
Earnings by Sex by Educational Attainment in Camp Hill borough
Average earnings in Camp Hill borough are $78,333 for men and $58,586 for women, a difference of 25.2%. Men with an educational attainment of bachelor's degree enjoy the highest average annual earnings of $95,398, while those with high school diploma education earn the least with $27,917. Women with an educational attainment of graduate degree earn the most with the average annual earnings of $71,520, while those with high school diploma education have the smallest earnings of $36,799.
| Educational Attainment | Male Income | Female Income |
| Less than High School | - | - |
| High School Diploma | $27,917 | $36,799 |
| College or Associate's Degree | $61,943 | $40,048 |
| Bachelor's Degree | $95,398 | $66,786 |
| Graduate Degree | $91,821 | $71,520 |
| Total | $78,333 | $58,586 |
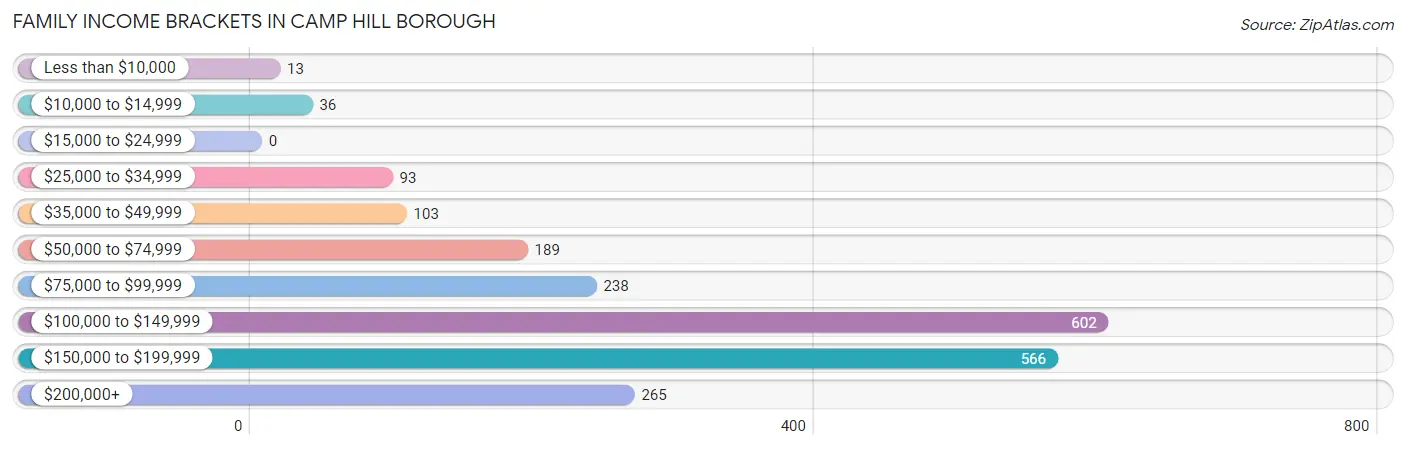
Family Income in Camp Hill borough
Family Income Brackets in Camp Hill borough
According to the Camp Hill borough family income data, there are 602 families falling into the $100,000 to $149,999 income range, which is the most common income bracket and makes up 28.6% of all families.
| Income Bracket | # Families | % Families |
| Less than $10,000 | 13 | 0.6% |
| $10,000 to $14,999 | 36 | 1.7% |
| $15,000 to $24,999 | 0 | 0.0% |
| $25,000 to $34,999 | 93 | 4.4% |
| $35,000 to $49,999 | 103 | 4.9% |
| $50,000 to $74,999 | 189 | 9.0% |
| $75,000 to $99,999 | 238 | 11.3% |
| $100,000 to $149,999 | 602 | 28.6% |
| $150,000 to $199,999 | 566 | 26.9% |
| $200,000+ | 265 | 12.6% |
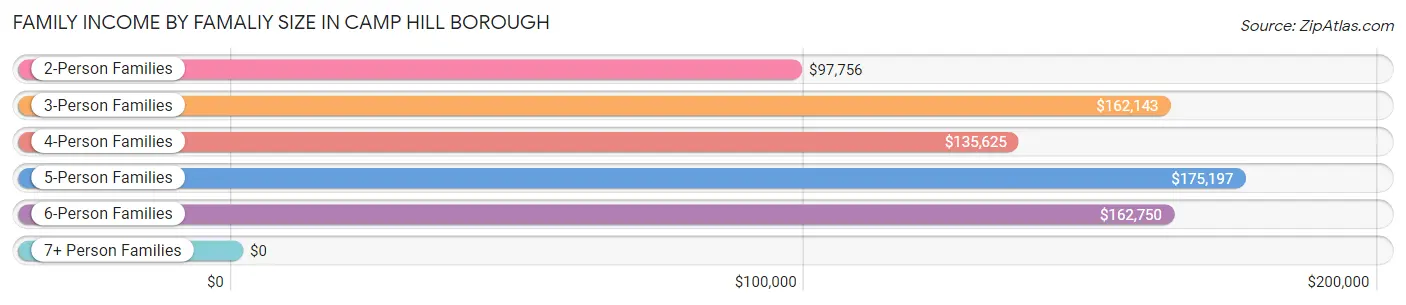
Family Income by Famaliy Size in Camp Hill borough
5-person families (193 | 9.2%) account for the highest median family income in Camp Hill borough with $175,197 per family, while 3-person families (678 | 32.2%) have the highest median income of $54,048 per family member.
| Income Bracket | # Families | Median Income |
| 2-Person Families | 831 (39.5%) | $97,756 |
| 3-Person Families | 678 (32.2%) | $162,143 |
| 4-Person Families | 375 (17.8%) | $135,625 |
| 5-Person Families | 193 (9.2%) | $175,197 |
| 6-Person Families | 27 (1.3%) | $162,750 |
| 7+ Person Families | 0 (0.0%) | $0 |
| Total | 2,104 (100.0%) | $128,259 |
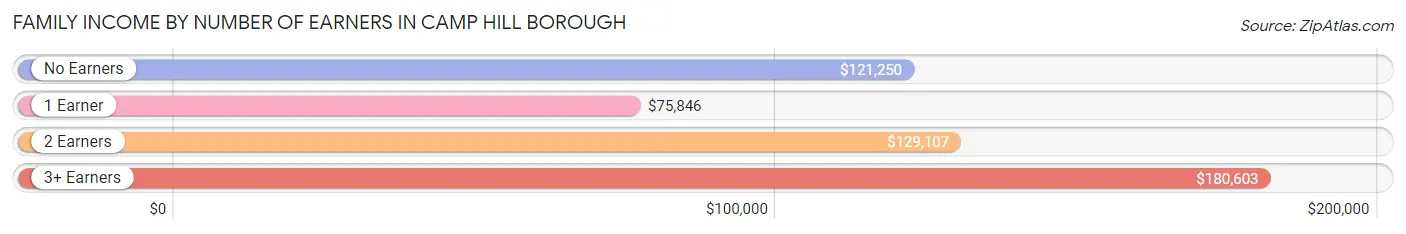
Family Income by Number of Earners in Camp Hill borough
The median family income in Camp Hill borough is $128,259, with families comprising 3+ earners (390) having the highest median family income of $180,603, while families with 1 earner (527) have the lowest median family income of $75,846, accounting for 18.5% and 25.1% of families, respectively.
| Number of Earners | # Families | Median Income |
| No Earners | 194 (9.2%) | $121,250 |
| 1 Earner | 527 (25.1%) | $75,846 |
| 2 Earners | 993 (47.2%) | $129,107 |
| 3+ Earners | 390 (18.5%) | $180,603 |
| Total | 2,104 (100.0%) | $128,259 |
Household Income in Camp Hill borough
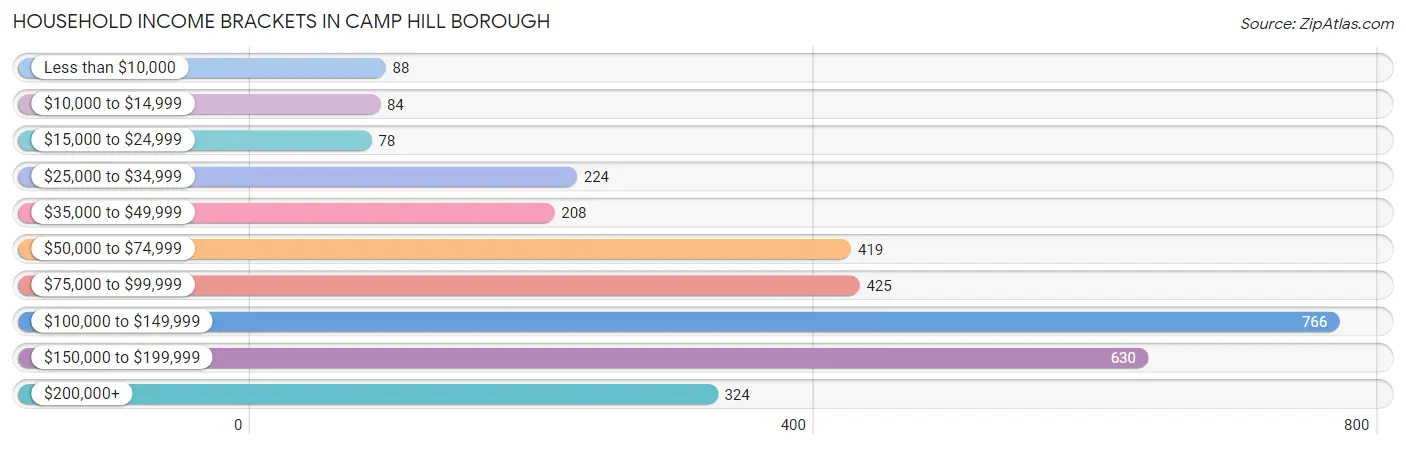
Household Income Brackets in Camp Hill borough
With 766 households falling in the category, the $100,000 to $149,999 income range is the most frequent in Camp Hill borough, accounting for 23.6% of all households. In contrast, only 78 households (2.4%) fall into the $15,000 to $24,999 income bracket, making it the least populous group.
| Income Bracket | # Households | % Households |
| Less than $10,000 | 88 | 2.7% |
| $10,000 to $14,999 | 84 | 2.6% |
| $15,000 to $24,999 | 78 | 2.4% |
| $25,000 to $34,999 | 224 | 6.9% |
| $35,000 to $49,999 | 208 | 6.4% |
| $50,000 to $74,999 | 419 | 12.9% |
| $75,000 to $99,999 | 425 | 13.1% |
| $100,000 to $149,999 | 766 | 23.6% |
| $150,000 to $199,999 | 630 | 19.4% |
| $200,000+ | 324 | 10.0% |
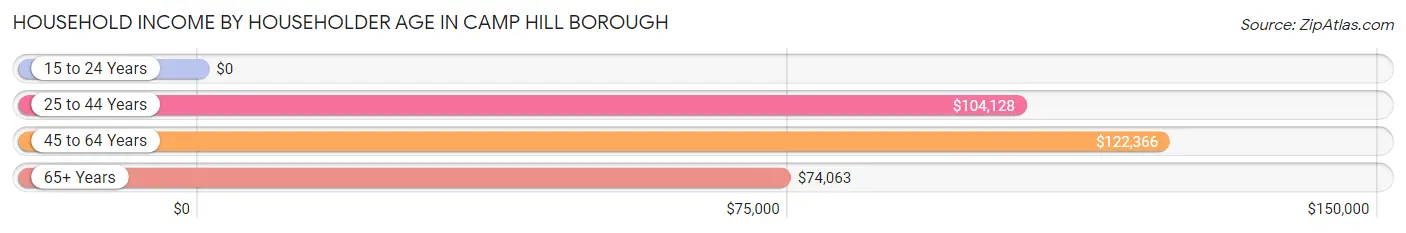
Household Income by Householder Age in Camp Hill borough
The median household income in Camp Hill borough is $104,959, with the highest median household income of $122,366 found in the 45 to 64 years age bracket for the primary householder. A total of 1,413 households (43.5%) fall into this category. Meanwhile, the 15 to 24 years age bracket for the primary householder has the lowest median household income of $0, with 78 households (2.4%) in this group.
| Income Bracket | # Households | Median Income |
| 15 to 24 Years | 78 (2.4%) | $0 |
| 25 to 44 Years | 954 (29.4%) | $104,128 |
| 45 to 64 Years | 1,413 (43.5%) | $122,366 |
| 65+ Years | 800 (24.6%) | $74,063 |
| Total | 3,245 (100.0%) | $104,959 |
Poverty in Camp Hill borough
Income Below Poverty by Sex and Age in Camp Hill borough
With 4.6% poverty level for males and 5.2% for females among the residents of Camp Hill borough, 5 year old males and 25 to 34 year old females are the most vulnerable to poverty, with 6 males (10.2%) and 38 females (10.3%) in their respective age groups living below the poverty level.
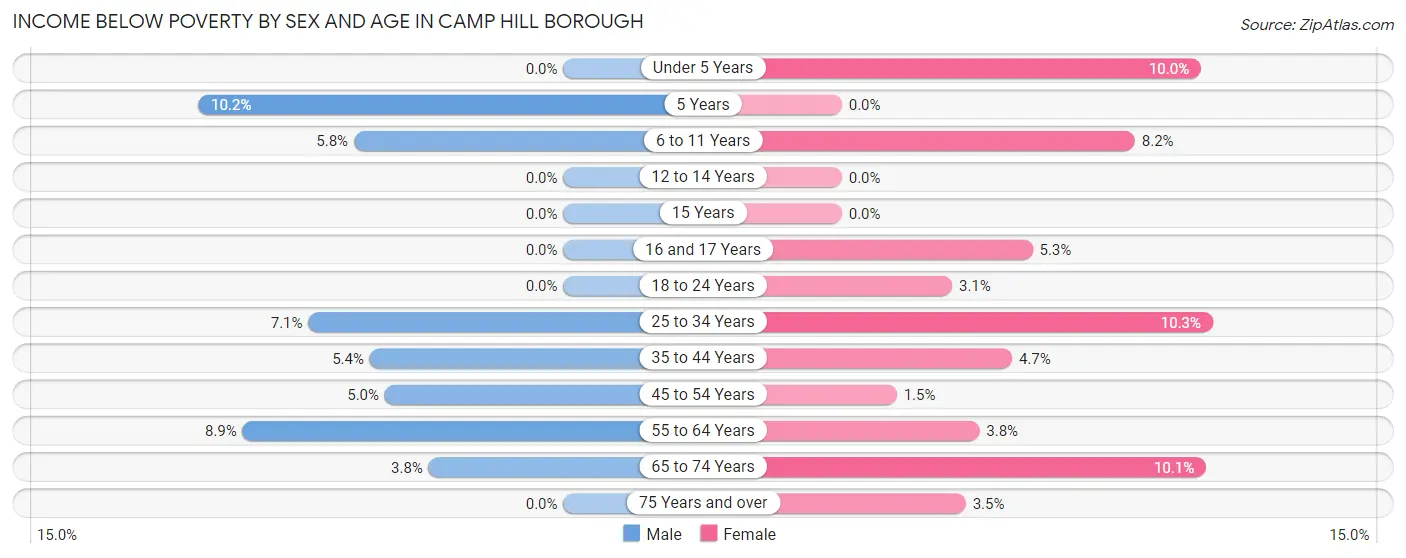
| Age Bracket | Male | Female |
| Under 5 Years | 0 (0.0%) | 28 (10.0%) |
| 5 Years | 6 (10.2%) | 0 (0.0%) |
| 6 to 11 Years | 18 (5.8%) | 23 (8.2%) |
| 12 to 14 Years | 0 (0.0%) | 0 (0.0%) |
| 15 Years | 0 (0.0%) | 0 (0.0%) |
| 16 and 17 Years | 0 (0.0%) | 11 (5.3%) |
| 18 to 24 Years | 0 (0.0%) | 9 (3.1%) |
| 25 to 34 Years | 33 (7.1%) | 38 (10.3%) |
| 35 to 44 Years | 27 (5.4%) | 26 (4.7%) |
| 45 to 54 Years | 29 (5.0%) | 10 (1.5%) |
| 55 to 64 Years | 51 (8.9%) | 21 (3.8%) |
| 65 to 74 Years | 10 (3.7%) | 44 (10.1%) |
| 75 Years and over | 0 (0.0%) | 9 (3.5%) |
| Total | 174 (4.6%) | 219 (5.2%) |
Income Above Poverty by Sex and Age in Camp Hill borough
According to the poverty statistics in Camp Hill borough, males aged under 5 years and females aged 5 years are the age groups that are most secure financially, with 100.0% of males and 100.0% of females in these age groups living above the poverty line.
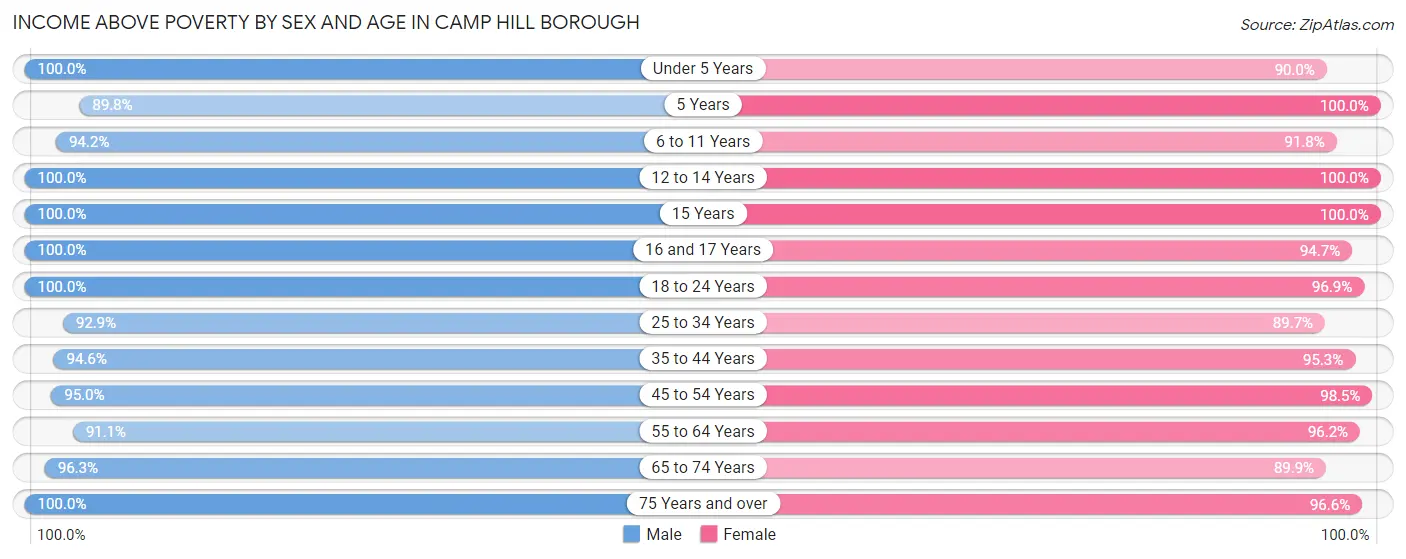
| Age Bracket | Male | Female |
| Under 5 Years | 141 (100.0%) | 252 (90.0%) |
| 5 Years | 53 (89.8%) | 50 (100.0%) |
| 6 to 11 Years | 291 (94.2%) | 259 (91.8%) |
| 12 to 14 Years | 200 (100.0%) | 171 (100.0%) |
| 15 Years | 31 (100.0%) | 116 (100.0%) |
| 16 and 17 Years | 148 (100.0%) | 196 (94.7%) |
| 18 to 24 Years | 233 (100.0%) | 284 (96.9%) |
| 25 to 34 Years | 432 (92.9%) | 330 (89.7%) |
| 35 to 44 Years | 474 (94.6%) | 523 (95.3%) |
| 45 to 54 Years | 554 (95.0%) | 643 (98.5%) |
| 55 to 64 Years | 520 (91.1%) | 528 (96.2%) |
| 65 to 74 Years | 257 (96.3%) | 390 (89.9%) |
| 75 Years and over | 263 (100.0%) | 252 (96.6%) |
| Total | 3,597 (95.4%) | 3,994 (94.8%) |
Income Below Poverty Among Married-Couple Families in Camp Hill borough
The poverty statistics for married-couple families in Camp Hill borough show that 1.1% or 19 of the total 1,686 families live below the poverty line. Families with 1 or 2 children have the highest poverty rate of 2.5%, comprising of 19 families. On the other hand, families with no children have the lowest poverty rate of 0.0%, which includes 0 families.
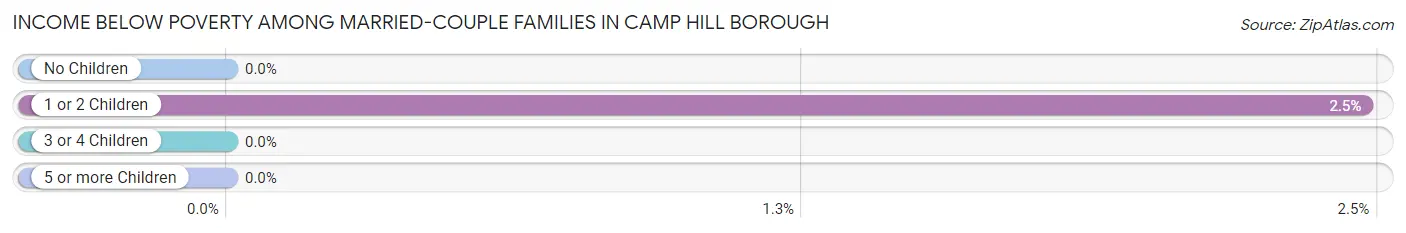
| Children | Above Poverty | Below Poverty |
| No Children | 760 (100.0%) | 0 (0.0%) |
| 1 or 2 Children | 749 (97.5%) | 19 (2.5%) |
| 3 or 4 Children | 158 (100.0%) | 0 (0.0%) |
| 5 or more Children | 0 (0.0%) | 0 (0.0%) |
| Total | 1,667 (98.9%) | 19 (1.1%) |
Income Below Poverty Among Single-Parent Households in Camp Hill borough
According to the poverty data in Camp Hill borough, 4.4% or 8 single-father households and 8.9% or 21 single-mother households are living below the poverty line. Among single-father households, those with 1 or 2 children have the highest poverty rate, with 8 households (6.5%) experiencing poverty. Likewise, among single-mother households, those with no children have the highest poverty rate, with 9 households (16.1%) falling below the poverty line.
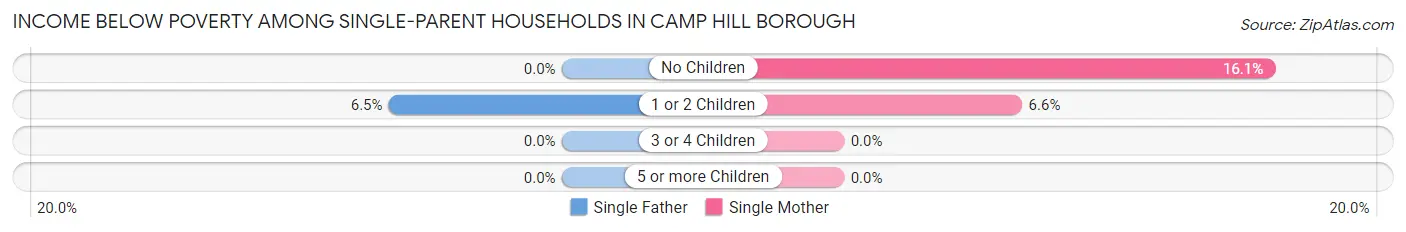
| Children | Single Father | Single Mother |
| No Children | 0 (0.0%) | 9 (16.1%) |
| 1 or 2 Children | 8 (6.5%) | 12 (6.6%) |
| 3 or 4 Children | 0 (0.0%) | 0 (0.0%) |
| 5 or more Children | 0 (0.0%) | 0 (0.0%) |
| Total | 8 (4.4%) | 21 (8.9%) |
Income Below Poverty Among Married-Couple vs Single-Parent Households in Camp Hill borough
The poverty data for Camp Hill borough shows that 19 of the married-couple family households (1.1%) and 29 of the single-parent households (6.9%) are living below the poverty level. Within the married-couple family households, those with 1 or 2 children have the highest poverty rate, with 19 households (2.5%) falling below the poverty line. Among the single-parent households, those with no children have the highest poverty rate, with 9 household (8.0%) living below poverty.
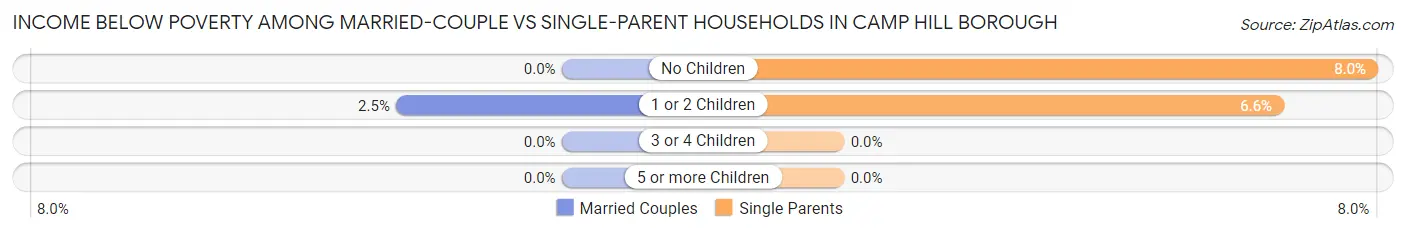
| Children | Married-Couple Families | Single-Parent Households |
| No Children | 0 (0.0%) | 9 (8.0%) |
| 1 or 2 Children | 19 (2.5%) | 20 (6.6%) |
| 3 or 4 Children | 0 (0.0%) | 0 (0.0%) |
| 5 or more Children | 0 (0.0%) | 0 (0.0%) |
| Total | 19 (1.1%) | 29 (6.9%) |
Race in Camp Hill borough
The most populous races in Camp Hill borough are White / Caucasian (6,913 | 85.0%), Asian (463 | 5.7%), and Hispanic or Latino (446 | 5.5%).
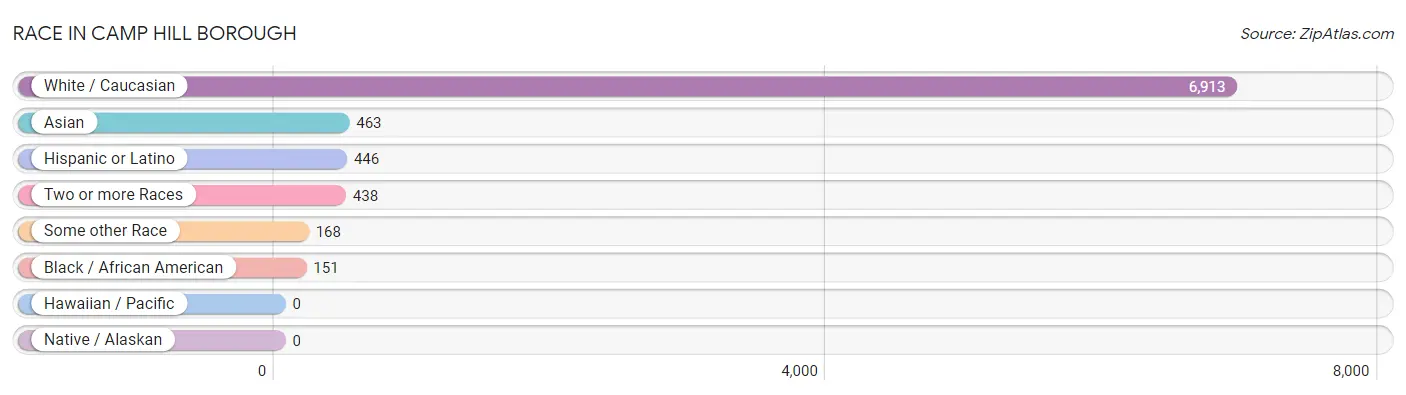
| Race | # Population | % Population |
| Asian | 463 | 5.7% |
| Black / African American | 151 | 1.9% |
| Hawaiian / Pacific | 0 | 0.0% |
| Hispanic or Latino | 446 | 5.5% |
| Native / Alaskan | 0 | 0.0% |
| White / Caucasian | 6,913 | 85.0% |
| Two or more Races | 438 | 5.4% |
| Some other Race | 168 | 2.1% |
| Total | 8,133 | 100.0% |
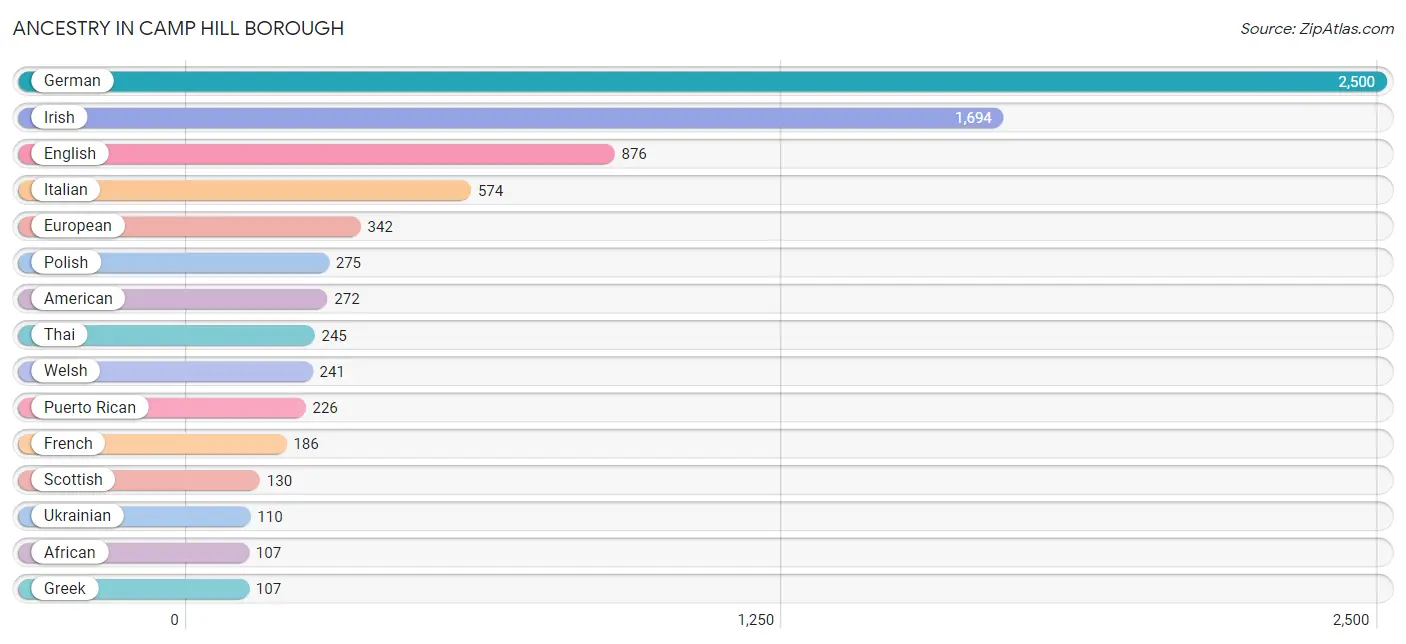
Ancestry in Camp Hill borough
The most populous ancestries reported in Camp Hill borough are German (2,500 | 30.7%), Irish (1,694 | 20.8%), English (876 | 10.8%), Italian (574 | 7.1%), and European (342 | 4.2%), together accounting for 73.6% of all Camp Hill borough residents.
| Ancestry | # Population | % Population |
| African | 107 | 1.3% |
| American | 272 | 3.3% |
| Arab | 66 | 0.8% |
| Armenian | 9 | 0.1% |
| Bhutanese | 44 | 0.5% |
| British | 28 | 0.3% |
| Burmese | 33 | 0.4% |
| Canadian | 6 | 0.1% |
| Celtic | 11 | 0.1% |
| Central American | 93 | 1.1% |
| Colombian | 12 | 0.2% |
| Croatian | 4 | 0.1% |
| Cuban | 9 | 0.1% |
| Danish | 35 | 0.4% |
| Delaware | 1 | 0.0% |
| Dominican | 13 | 0.2% |
| Dutch | 32 | 0.4% |
| Eastern European | 13 | 0.2% |
| Egyptian | 21 | 0.3% |
| English | 876 | 10.8% |
| European | 342 | 4.2% |
| Filipino | 6 | 0.1% |
| French | 186 | 2.3% |
| French Canadian | 18 | 0.2% |
| German | 2,500 | 30.7% |
| Greek | 107 | 1.3% |
| Honduran | 50 | 0.6% |
| Hungarian | 95 | 1.2% |
| Indian (Asian) | 82 | 1.0% |
| Irish | 1,694 | 20.8% |
| Israeli | 23 | 0.3% |
| Italian | 574 | 7.1% |
| Korean | 65 | 0.8% |
| Laotian | 4 | 0.1% |
| Lebanese | 38 | 0.5% |
| Lithuanian | 78 | 1.0% |
| Mexican | 56 | 0.7% |
| Native Hawaiian | 10 | 0.1% |
| Northern European | 52 | 0.6% |
| Norwegian | 80 | 1.0% |
| Ottawa | 8 | 0.1% |
| Pennsylvania German | 20 | 0.3% |
| Peruvian | 17 | 0.2% |
| Polish | 275 | 3.4% |
| Puerto Rican | 226 | 2.8% |
| Russian | 38 | 0.5% |
| Salvadoran | 43 | 0.5% |
| Scotch-Irish | 54 | 0.7% |
| Scottish | 130 | 1.6% |
| Serbian | 7 | 0.1% |
| Slavic | 11 | 0.1% |
| Slovak | 86 | 1.1% |
| Slovene | 47 | 0.6% |
| South American | 29 | 0.4% |
| Spaniard | 19 | 0.2% |
| Subsaharan African | 107 | 1.3% |
| Swedish | 24 | 0.3% |
| Swiss | 105 | 1.3% |
| Syrian | 7 | 0.1% |
| Thai | 245 | 3.0% |
| Turkish | 26 | 0.3% |
| Ukrainian | 110 | 1.3% |
| Welsh | 241 | 3.0% |
| Yugoslavian | 6 | 0.1% | View All 64 Rows |
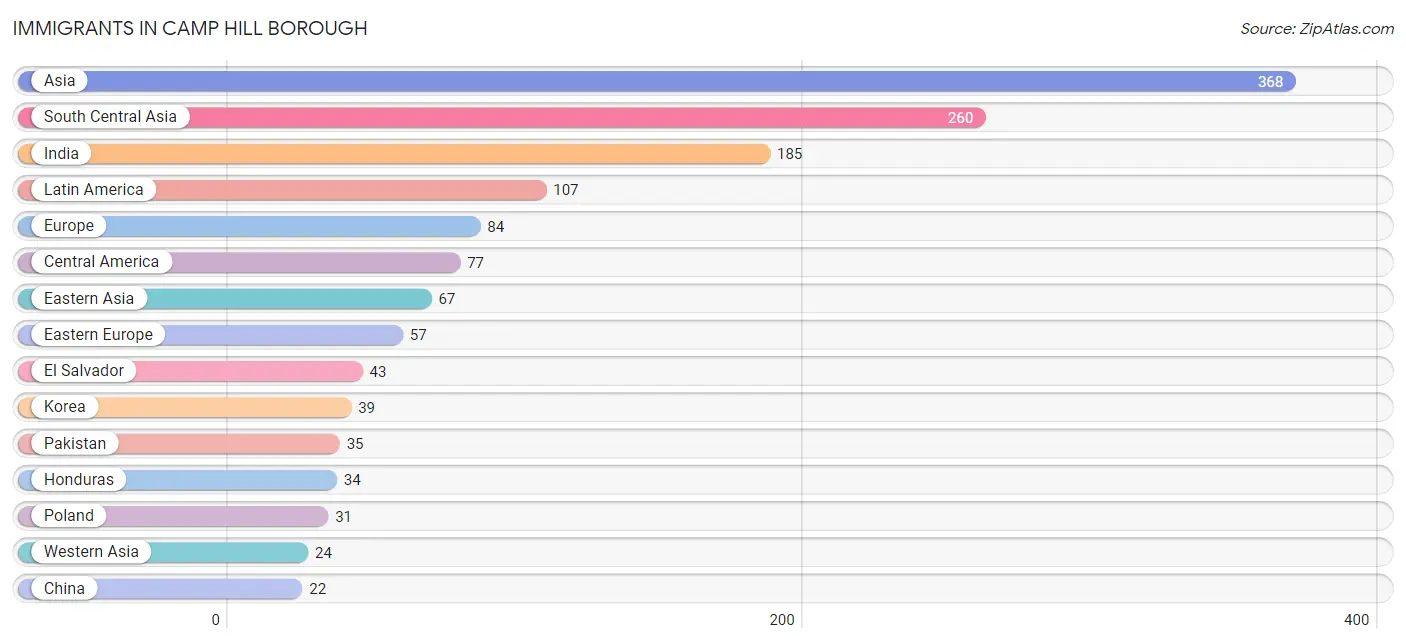
Immigrants in Camp Hill borough
The most numerous immigrant groups reported in Camp Hill borough came from Asia (368 | 4.5%), South Central Asia (260 | 3.2%), India (185 | 2.3%), Latin America (107 | 1.3%), and Europe (84 | 1.0%), together accounting for 12.3% of all Camp Hill borough residents.
| Immigration Origin | # Population | % Population |
| Africa | 13 | 0.2% |
| Asia | 368 | 4.5% |
| Caribbean | 13 | 0.2% |
| Central America | 77 | 0.9% |
| China | 22 | 0.3% |
| Dominican Republic | 13 | 0.2% |
| Eastern Asia | 67 | 0.8% |
| Eastern Europe | 57 | 0.7% |
| El Salvador | 43 | 0.5% |
| Europe | 84 | 1.0% |
| Germany | 8 | 0.1% |
| Greece | 9 | 0.1% |
| Honduras | 34 | 0.4% |
| India | 185 | 2.3% |
| Ireland | 1 | 0.0% |
| Japan | 6 | 0.1% |
| Korea | 39 | 0.5% |
| Latin America | 107 | 1.3% |
| Nepal | 20 | 0.3% |
| Northern Africa | 13 | 0.2% |
| Northern Europe | 10 | 0.1% |
| Oceania | 10 | 0.1% |
| Pakistan | 35 | 0.4% |
| Peru | 17 | 0.2% |
| Philippines | 17 | 0.2% |
| Poland | 31 | 0.4% |
| Russia | 10 | 0.1% |
| South America | 17 | 0.2% |
| South Central Asia | 260 | 3.2% |
| South Eastern Asia | 17 | 0.2% |
| Southern Europe | 9 | 0.1% |
| Sudan | 13 | 0.2% |
| Turkey | 9 | 0.1% |
| Ukraine | 7 | 0.1% |
| Western Asia | 24 | 0.3% |
| Western Europe | 8 | 0.1% |
| Yemen | 15 | 0.2% | View All 37 Rows |
Sex and Age in Camp Hill borough
Sex and Age in Camp Hill borough
The most populous age groups in Camp Hill borough are 55 to 59 Years (349 | 9.1%) for men and 15 to 19 Years (427 | 9.9%) for women.
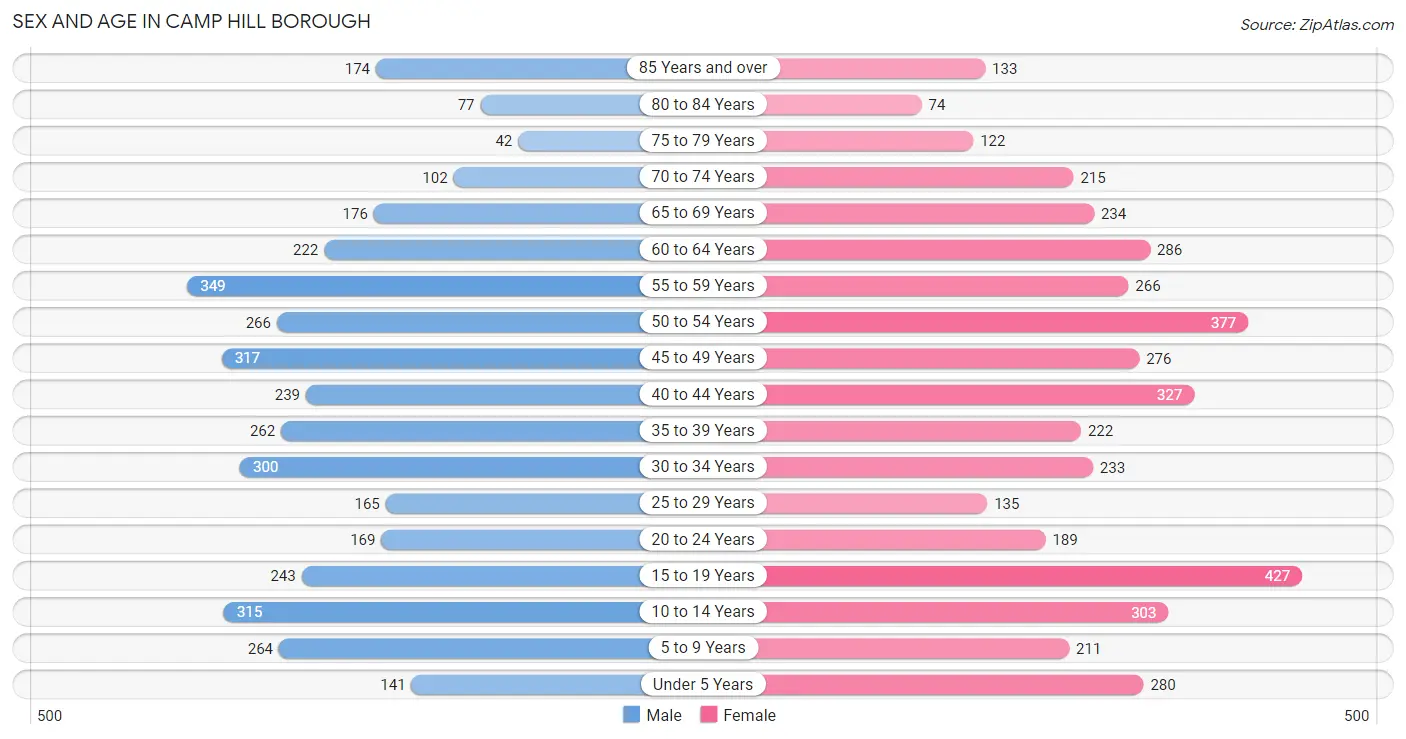
| Age Bracket | Male | Female |
| Under 5 Years | 141 (3.7%) | 280 (6.5%) |
| 5 to 9 Years | 264 (6.9%) | 211 (4.9%) |
| 10 to 14 Years | 315 (8.2%) | 303 (7.0%) |
| 15 to 19 Years | 243 (6.4%) | 427 (9.9%) |
| 20 to 24 Years | 169 (4.4%) | 189 (4.4%) |
| 25 to 29 Years | 165 (4.3%) | 135 (3.1%) |
| 30 to 34 Years | 300 (7.9%) | 233 (5.4%) |
| 35 to 39 Years | 262 (6.9%) | 222 (5.1%) |
| 40 to 44 Years | 239 (6.2%) | 327 (7.6%) |
| 45 to 49 Years | 317 (8.3%) | 276 (6.4%) |
| 50 to 54 Years | 266 (7.0%) | 377 (8.7%) |
| 55 to 59 Years | 349 (9.1%) | 266 (6.2%) |
| 60 to 64 Years | 222 (5.8%) | 286 (6.6%) |
| 65 to 69 Years | 176 (4.6%) | 234 (5.4%) |
| 70 to 74 Years | 102 (2.7%) | 215 (5.0%) |
| 75 to 79 Years | 42 (1.1%) | 122 (2.8%) |
| 80 to 84 Years | 77 (2.0%) | 74 (1.7%) |
| 85 Years and over | 174 (4.5%) | 133 (3.1%) |
| Total | 3,823 (100.0%) | 4,310 (100.0%) |
Families and Households in Camp Hill borough
Median Family Size in Camp Hill borough
The median family size in Camp Hill borough is 3.10 persons per family, with married-couple families (1,686 | 80.1%) accounting for the largest median family size of 3.24 persons per family. On the other hand, single male/father families (181 | 8.6%) represent the smallest median family size with 2.45 persons per family.
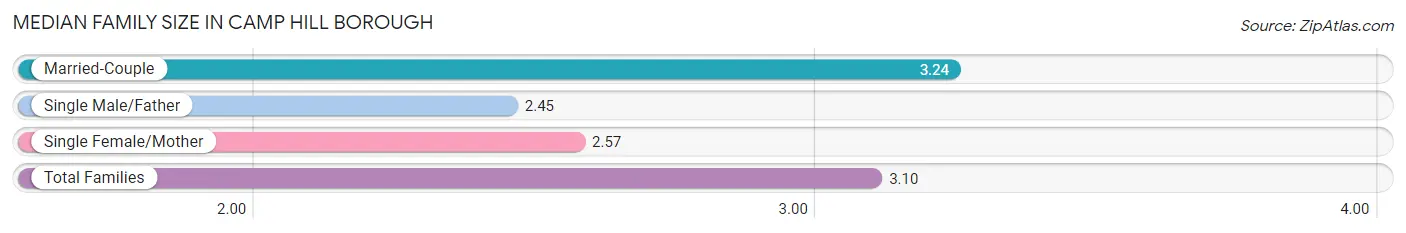
| Family Type | # Families | Family Size |
| Married-Couple | 1,686 (80.1%) | 3.24 |
| Single Male/Father | 181 (8.6%) | 2.45 |
| Single Female/Mother | 237 (11.3%) | 2.57 |
| Total Families | 2,104 (100.0%) | 3.10 |
Median Household Size in Camp Hill borough
The median household size in Camp Hill borough is 2.47 persons per household, with married-couple households (1,686 | 52.0%) accounting for the largest median household size of 3.26 persons per household. non-family households (1,141 | 35.2%) represent the smallest median household size with 1.19 persons per household.
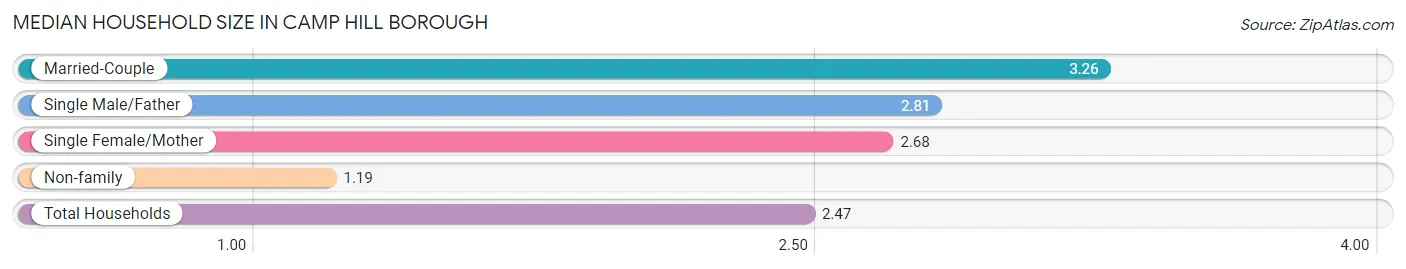
| Household Type | # Households | Household Size |
| Married-Couple | 1,686 (52.0%) | 3.26 |
| Single Male/Father | 181 (5.6%) | 2.81 |
| Single Female/Mother | 237 (7.3%) | 2.68 |
| Non-family | 1,141 (35.2%) | 1.19 |
| Total Households | 3,245 (100.0%) | 2.47 |
Household Size by Marriage Status in Camp Hill borough
Out of a total of 3,245 households in Camp Hill borough, 2,104 (64.8%) are family households, while 1,141 (35.2%) are nonfamily households. The most numerous type of family households are 2-person households, comprising 785, and the most common type of nonfamily households are 1-person households, comprising 962.
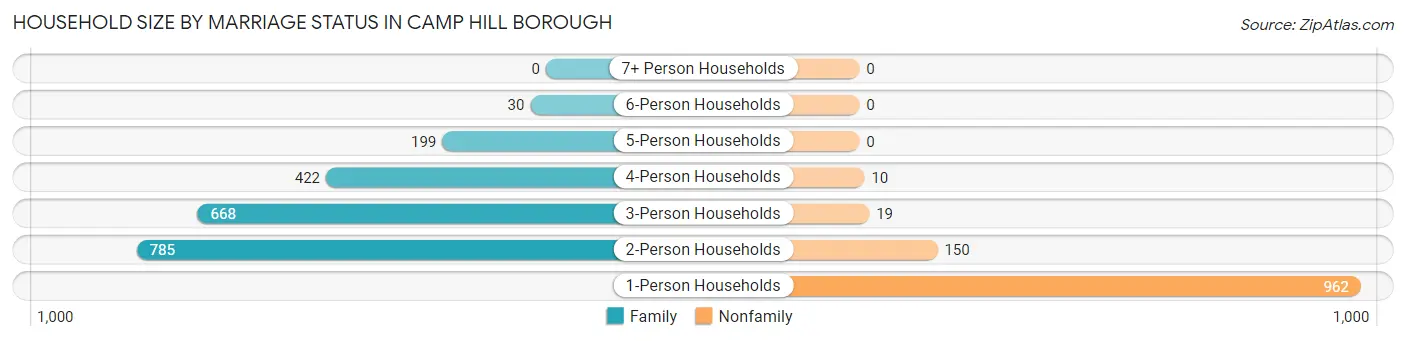
| Household Size | Family Households | Nonfamily Households |
| 1-Person Households | - | 962 (29.6%) |
| 2-Person Households | 785 (24.2%) | 150 (4.6%) |
| 3-Person Households | 668 (20.6%) | 19 (0.6%) |
| 4-Person Households | 422 (13.0%) | 10 (0.3%) |
| 5-Person Households | 199 (6.1%) | 0 (0.0%) |
| 6-Person Households | 30 (0.9%) | 0 (0.0%) |
| 7+ Person Households | 0 (0.0%) | 0 (0.0%) |
| Total | 2,104 (64.8%) | 1,141 (35.2%) |
Female Fertility in Camp Hill borough
Fertility by Age in Camp Hill borough
Average fertility rate in Camp Hill borough is 70.0 births per 1,000 women. Women in the age bracket of 20 to 34 years have the highest fertility rate with 156.0 births per 1,000 women. Women in the age bracket of 20 to 34 years acount for 67.4% of all women with births.
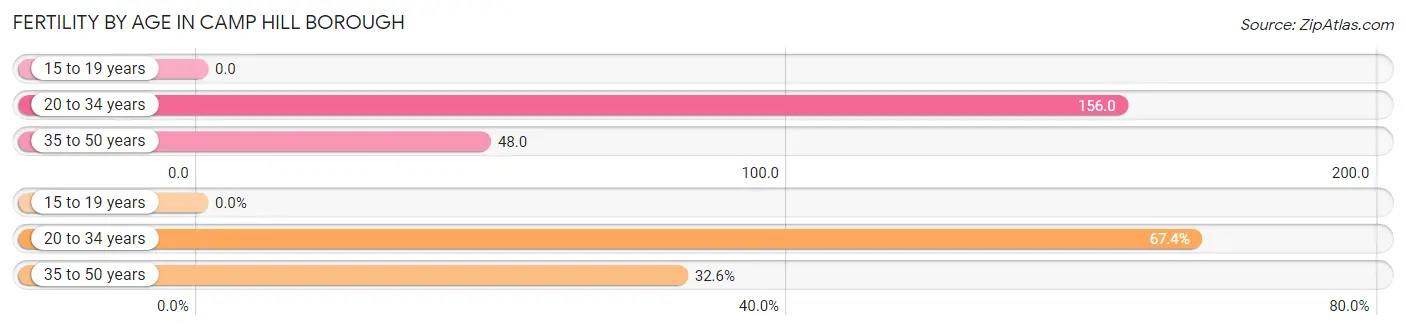
| Age Bracket | Women with Births | Births / 1,000 Women |
| 15 to 19 years | 0 (0.0%) | 0.0 |
| 20 to 34 years | 87 (67.4%) | 156.0 |
| 35 to 50 years | 42 (32.6%) | 48.0 |
| Total | 129 (100.0%) | 70.0 |
Fertility by Age by Marriage Status in Camp Hill borough
79.1% of women with births (129) in Camp Hill borough are married. The highest percentage of unmarried women with births falls into 35 to 50 years age bracket with 26.2% of them unmarried at the time of birth, while the lowest percentage of unmarried women with births belong to 20 to 34 years age bracket with 18.4% of them unmarried.
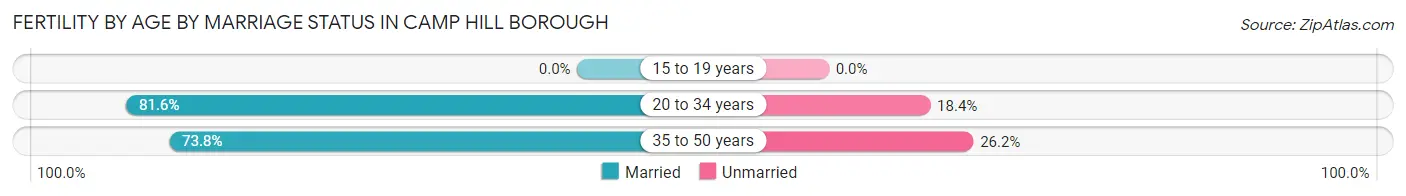
| Age Bracket | Married | Unmarried |
| 15 to 19 years | 0 (0.0%) | 0 (0.0%) |
| 20 to 34 years | 71 (81.6%) | 16 (18.4%) |
| 35 to 50 years | 31 (73.8%) | 11 (26.2%) |
| Total | 102 (79.1%) | 27 (20.9%) |
Fertility by Education in Camp Hill borough
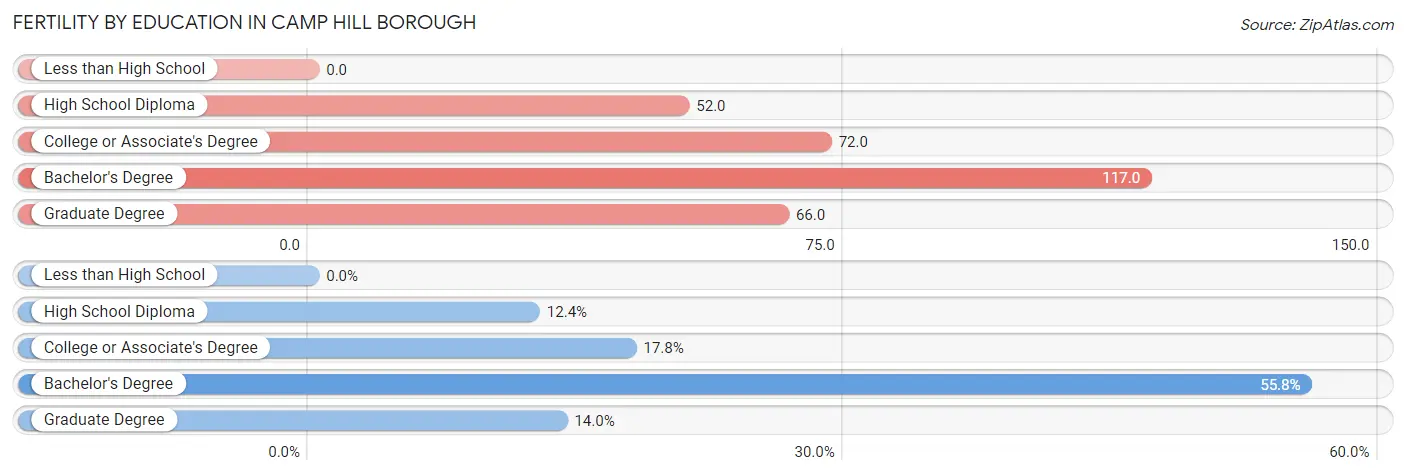
| Educational Attainment | Women with Births | Births / 1,000 Women |
| Less than High School | 0 (0.0%) | 0.0 |
| High School Diploma | 16 (12.4%) | 52.0 |
| College or Associate's Degree | 23 (17.8%) | 72.0 |
| Bachelor's Degree | 72 (55.8%) | 117.0 |
| Graduate Degree | 18 (14.0%) | 66.0 |
| Total | 129 (100.0%) | 70.0 |
Fertility by Education by Marriage Status in Camp Hill borough
20.9% of women with births in Camp Hill borough are unmarried. Women with the educational attainment of bachelor's degree are most likely to be married with 100.0% of them married at childbirth, while women with the educational attainment of high school diploma are least likely to be married with 100.0% of them unmarried at childbirth.
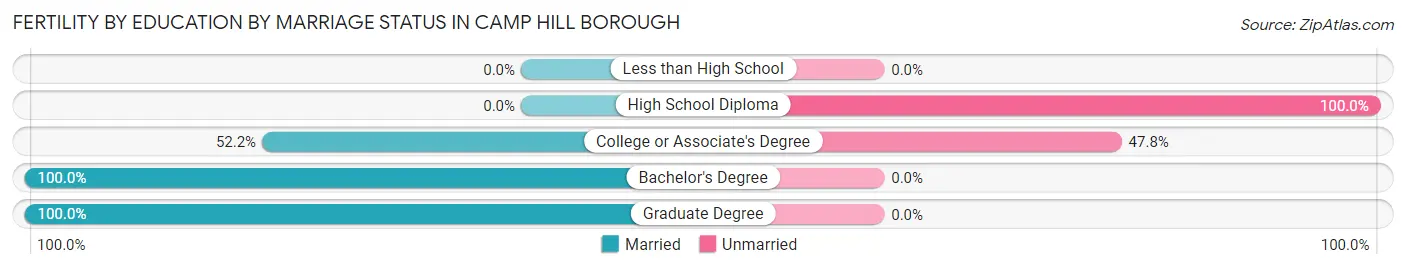
| Educational Attainment | Married | Unmarried |
| Less than High School | 0 (0.0%) | 0 (0.0%) |
| High School Diploma | 0 (0.0%) | 16 (100.0%) |
| College or Associate's Degree | 12 (52.2%) | 11 (47.8%) |
| Bachelor's Degree | 72 (100.0%) | 0 (0.0%) |
| Graduate Degree | 18 (100.0%) | 0 (0.0%) |
| Total | 102 (79.1%) | 27 (20.9%) |
Employment Characteristics in Camp Hill borough
Employment by Class of Employer in Camp Hill borough
Among the 4,339 employed individuals in Camp Hill borough, private company employees (2,312 | 53.3%), not-for-profit organizations (645 | 14.9%), and state government employees (486 | 11.2%) make up the most common classes of employment.
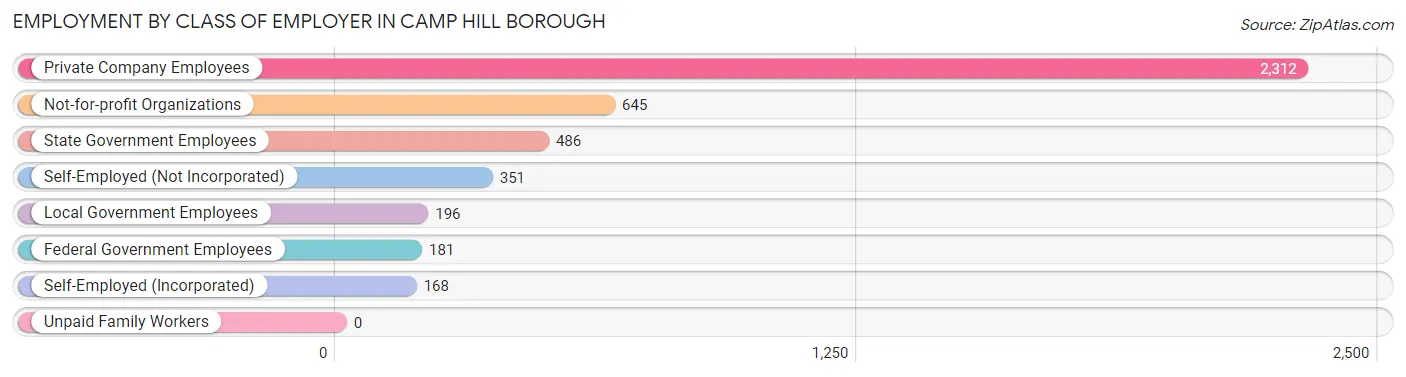
| Employer Class | # Employees | % Employees |
| Private Company Employees | 2,312 | 53.3% |
| Self-Employed (Incorporated) | 168 | 3.9% |
| Self-Employed (Not Incorporated) | 351 | 8.1% |
| Not-for-profit Organizations | 645 | 14.9% |
| Local Government Employees | 196 | 4.5% |
| State Government Employees | 486 | 11.2% |
| Federal Government Employees | 181 | 4.2% |
| Unpaid Family Workers | 0 | 0.0% |
| Total | 4,339 | 100.0% |
Employment Status by Age in Camp Hill borough
According to the labor force statistics for Camp Hill borough, out of the total population over 16 years of age (6,472), 70.7% or 4,576 individuals are in the labor force, with 2.6% or 119 of them unemployed. The age group with the highest labor force participation rate is 25 to 29 years, with 100.0% or 300 individuals in the labor force. Within the labor force, the 16 to 19 years age range has the highest percentage of unemployed individuals, with 17.7% or 37 of them being unemployed.
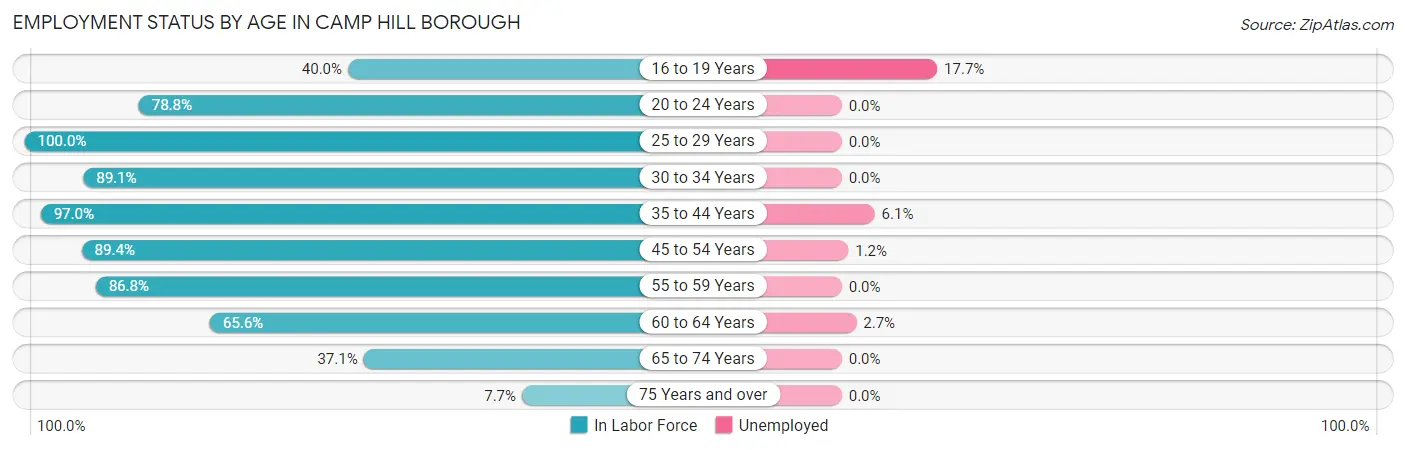
| Age Bracket | In Labor Force | Unemployed |
| 16 to 19 Years | 209 (40.0%) | 37 (17.7%) |
| 20 to 24 Years | 282 (78.8%) | 0 (0.0%) |
| 25 to 29 Years | 300 (100.0%) | 0 (0.0%) |
| 30 to 34 Years | 475 (89.1%) | 0 (0.0%) |
| 35 to 44 Years | 1,018 (97.0%) | 62 (6.1%) |
| 45 to 54 Years | 1,105 (89.4%) | 13 (1.2%) |
| 55 to 59 Years | 534 (86.8%) | 0 (0.0%) |
| 60 to 64 Years | 333 (65.6%) | 9 (2.7%) |
| 65 to 74 Years | 270 (37.1%) | 0 (0.0%) |
| 75 Years and over | 48 (7.7%) | 0 (0.0%) |
| Total | 4,576 (70.7%) | 119 (2.6%) |
Employment Status by Educational Attainment in Camp Hill borough
According to labor force statistics for Camp Hill borough, 88.8% of individuals (3,767) out of the total population between 25 and 64 years of age (4,242) are in the labor force, with 2.2% or 83 of them being unemployed. The group with the highest labor force participation rate are those with the educational attainment of bachelor's degree or higher, with 92.2% or 2,485 individuals in the labor force. Within the labor force, individuals with high school diploma education have the highest percentage of unemployment, with 6.1% or 19 of them being unemployed.
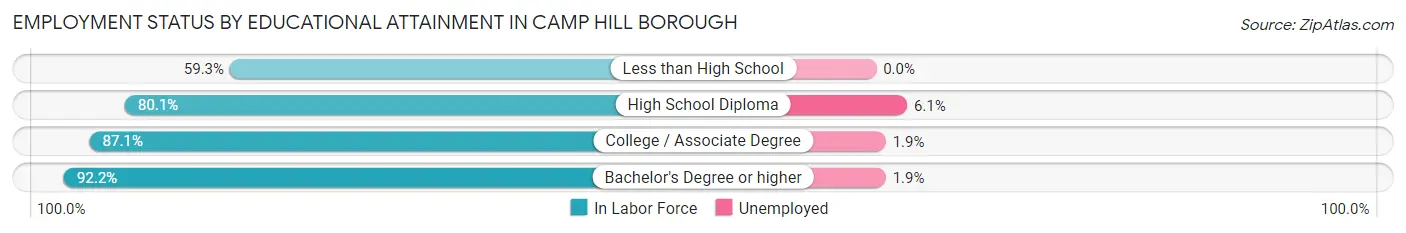
| Educational Attainment | In Labor Force | Unemployed |
| Less than High School | 86 (59.3%) | 0 (0.0%) |
| High School Diploma | 314 (80.1%) | 24 (6.1%) |
| College / Associate Degree | 880 (87.1%) | 19 (1.9%) |
| Bachelor's Degree or higher | 2,485 (92.2%) | 51 (1.9%) |
| Total | 3,767 (88.8%) | 93 (2.2%) |
Employment Occupations by Sex in Camp Hill borough
Management, Business, Science and Arts Occupations
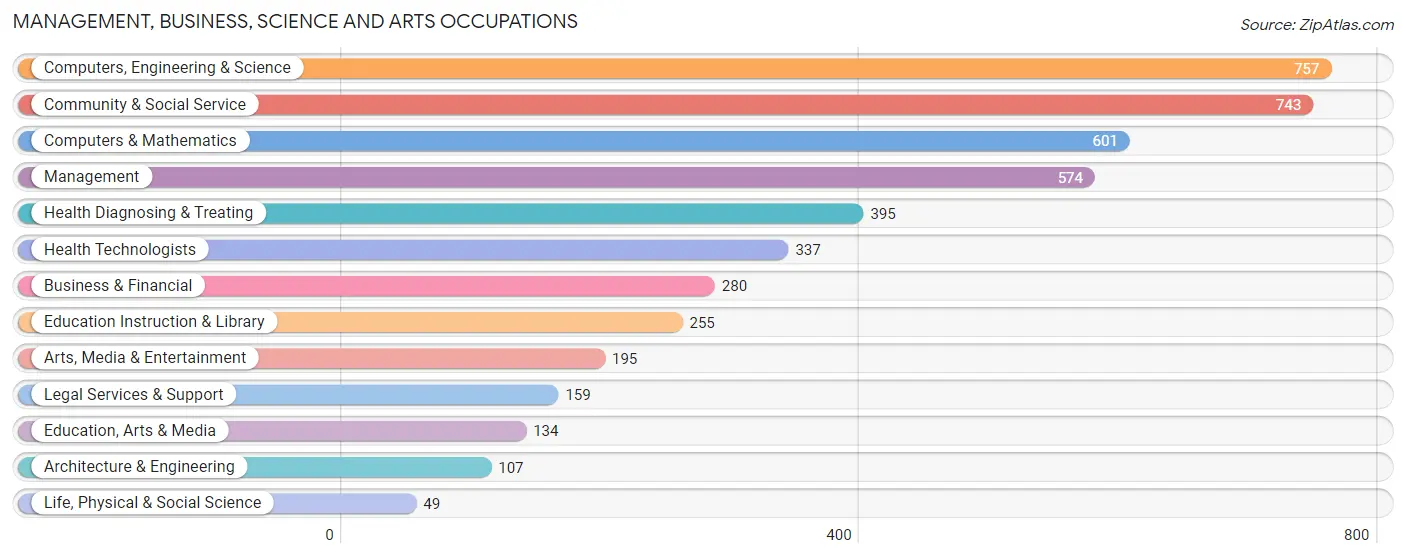
The most common Management, Business, Science and Arts occupations in Camp Hill borough are Computers, Engineering & Science (757 | 17.0%), Community & Social Service (743 | 16.7%), Computers & Mathematics (601 | 13.5%), Management (574 | 12.9%), and Health Diagnosing & Treating (395 | 8.9%).
Management, Business, Science and Arts Occupations by Sex
Within the Management, Business, Science and Arts occupations in Camp Hill borough, the most male-oriented occupations are Architecture & Engineering (71.0%), Life, Physical & Social Science (65.3%), and Computers, Engineering & Science (62.2%), while the most female-oriented occupations are Education, Arts & Media (84.3%), Education Instruction & Library (80.0%), and Community & Social Service (68.6%).
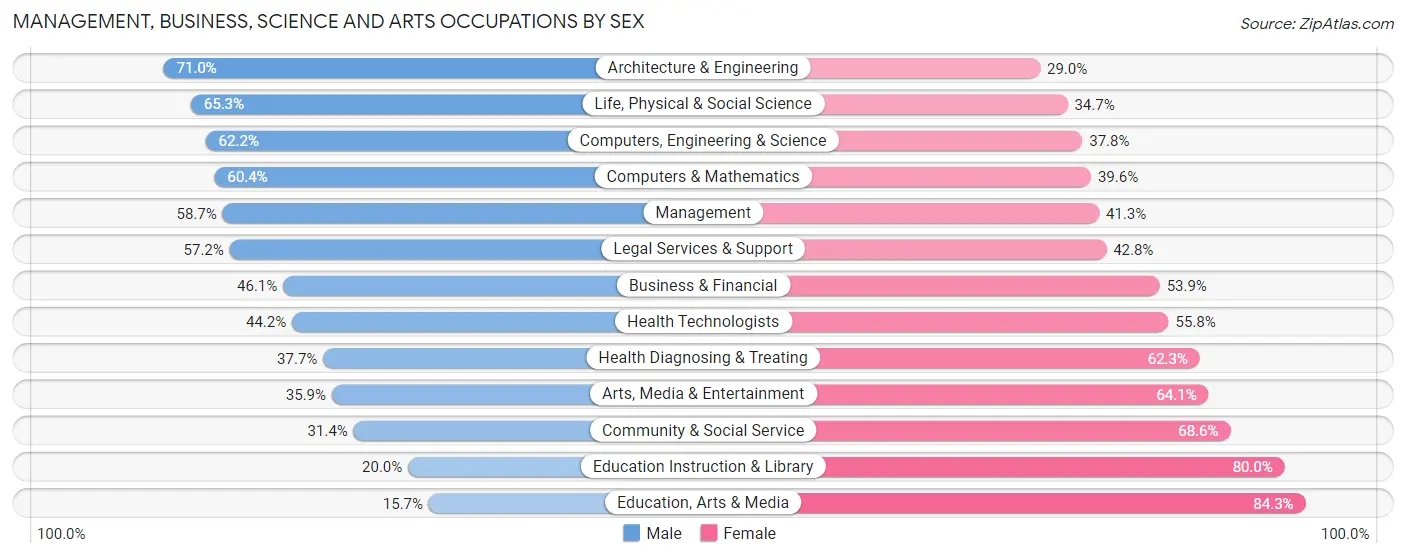
| Occupation | Male | Female |
| Management | 337 (58.7%) | 237 (41.3%) |
| Business & Financial | 129 (46.1%) | 151 (53.9%) |
| Computers, Engineering & Science | 471 (62.2%) | 286 (37.8%) |
| Computers & Mathematics | 363 (60.4%) | 238 (39.6%) |
| Architecture & Engineering | 76 (71.0%) | 31 (29.0%) |
| Life, Physical & Social Science | 32 (65.3%) | 17 (34.7%) |
| Community & Social Service | 233 (31.4%) | 510 (68.6%) |
| Education, Arts & Media | 21 (15.7%) | 113 (84.3%) |
| Legal Services & Support | 91 (57.2%) | 68 (42.8%) |
| Education Instruction & Library | 51 (20.0%) | 204 (80.0%) |
| Arts, Media & Entertainment | 70 (35.9%) | 125 (64.1%) |
| Health Diagnosing & Treating | 149 (37.7%) | 246 (62.3%) |
| Health Technologists | 149 (44.2%) | 188 (55.8%) |
| Total (Category) | 1,319 (48.0%) | 1,430 (52.0%) |
| Total (Overall) | 2,305 (51.7%) | 2,149 (48.2%) |
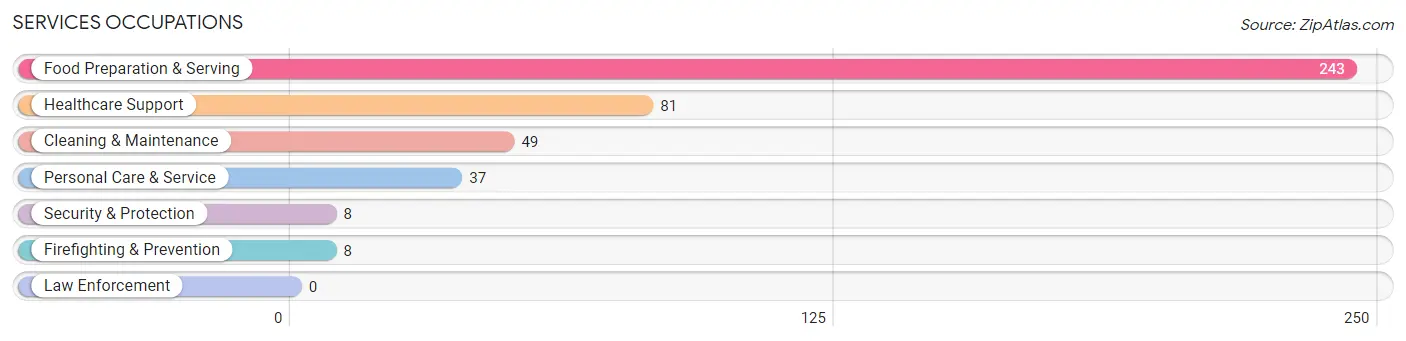
Services Occupations
The most common Services occupations in Camp Hill borough are Food Preparation & Serving (243 | 5.5%), Healthcare Support (81 | 1.8%), Cleaning & Maintenance (49 | 1.1%), Personal Care & Service (37 | 0.8%), and Security & Protection (8 | 0.2%).
Services Occupations by Sex
Within the Services occupations in Camp Hill borough, the most male-oriented occupations are Security & Protection (100.0%), Firefighting & Prevention (100.0%), and Cleaning & Maintenance (73.5%), while the most female-oriented occupations are Healthcare Support (85.2%), Food Preparation & Serving (68.7%), and Personal Care & Service (40.5%).
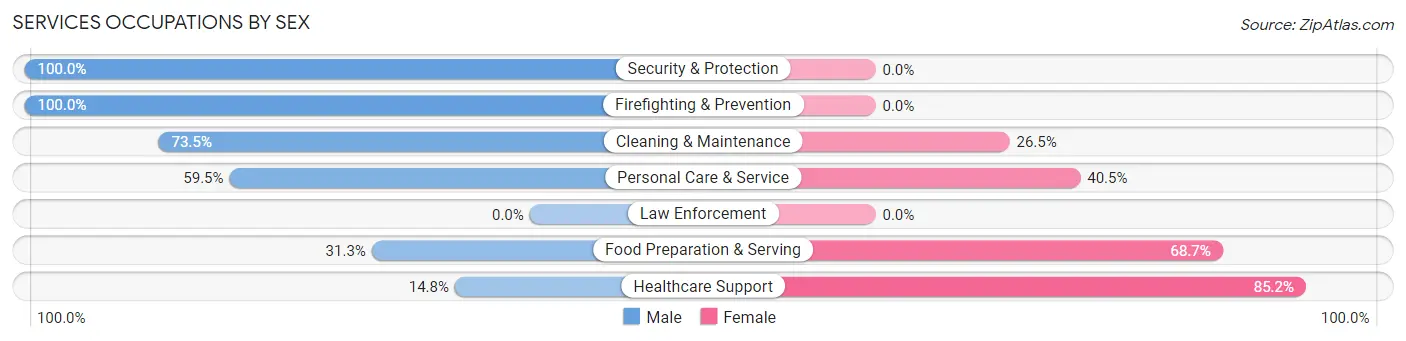
| Occupation | Male | Female |
| Healthcare Support | 12 (14.8%) | 69 (85.2%) |
| Security & Protection | 8 (100.0%) | 0 (0.0%) |
| Firefighting & Prevention | 8 (100.0%) | 0 (0.0%) |
| Law Enforcement | 0 (0.0%) | 0 (0.0%) |
| Food Preparation & Serving | 76 (31.3%) | 167 (68.7%) |
| Cleaning & Maintenance | 36 (73.5%) | 13 (26.5%) |
| Personal Care & Service | 22 (59.5%) | 15 (40.5%) |
| Total (Category) | 154 (36.8%) | 264 (63.2%) |
| Total (Overall) | 2,305 (51.7%) | 2,149 (48.2%) |
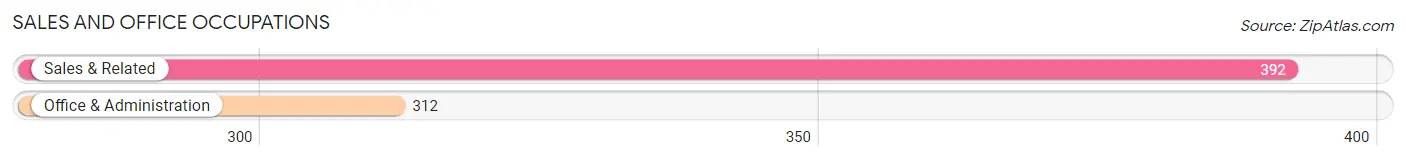
Sales and Office Occupations
The most common Sales and Office occupations in Camp Hill borough are Sales & Related (392 | 8.8%), and Office & Administration (312 | 7.0%).
Sales and Office Occupations by Sex
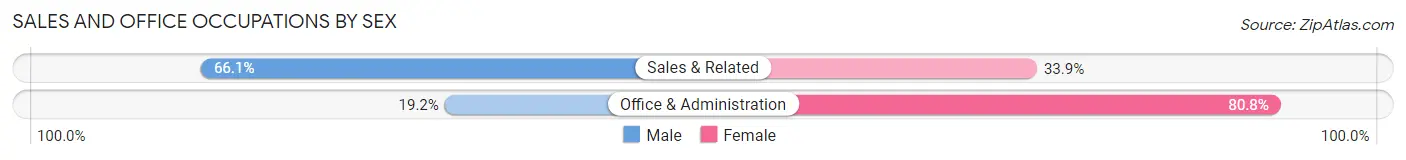
| Occupation | Male | Female |
| Sales & Related | 259 (66.1%) | 133 (33.9%) |
| Office & Administration | 60 (19.2%) | 252 (80.8%) |
| Total (Category) | 319 (45.3%) | 385 (54.7%) |
| Total (Overall) | 2,305 (51.7%) | 2,149 (48.2%) |
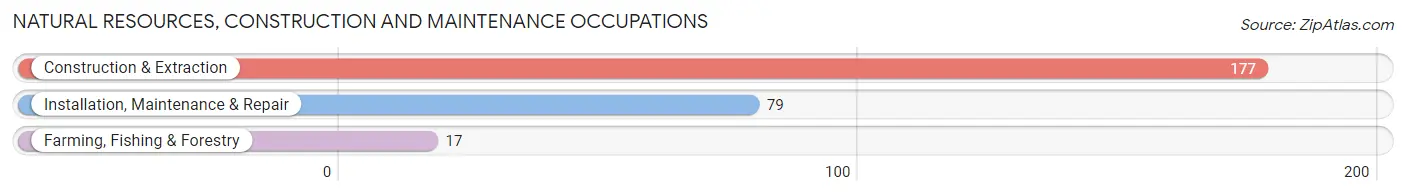
Natural Resources, Construction and Maintenance Occupations
The most common Natural Resources, Construction and Maintenance occupations in Camp Hill borough are Construction & Extraction (177 | 4.0%), Installation, Maintenance & Repair (79 | 1.8%), and Farming, Fishing & Forestry (17 | 0.4%).
Natural Resources, Construction and Maintenance Occupations by Sex
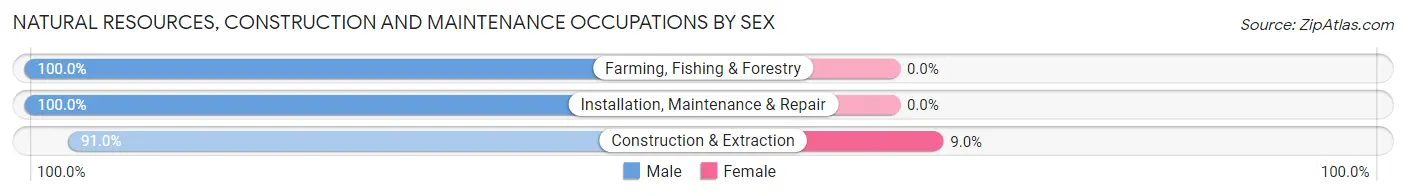
| Occupation | Male | Female |
| Farming, Fishing & Forestry | 17 (100.0%) | 0 (0.0%) |
| Construction & Extraction | 161 (91.0%) | 16 (9.0%) |
| Installation, Maintenance & Repair | 79 (100.0%) | 0 (0.0%) |
| Total (Category) | 257 (94.1%) | 16 (5.9%) |
| Total (Overall) | 2,305 (51.7%) | 2,149 (48.2%) |
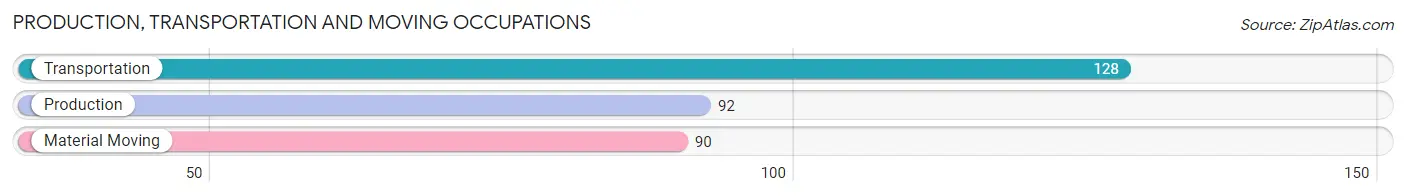
Production, Transportation and Moving Occupations
The most common Production, Transportation and Moving occupations in Camp Hill borough are Transportation (128 | 2.9%), Production (92 | 2.1%), and Material Moving (90 | 2.0%).
Production, Transportation and Moving Occupations by Sex
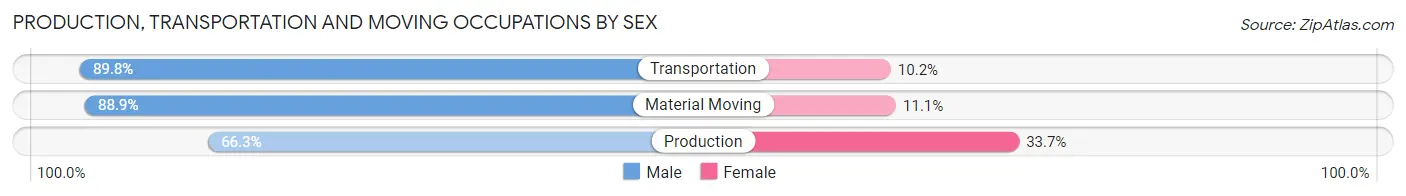
| Occupation | Male | Female |
| Production | 61 (66.3%) | 31 (33.7%) |
| Transportation | 115 (89.8%) | 13 (10.2%) |
| Material Moving | 80 (88.9%) | 10 (11.1%) |
| Total (Category) | 256 (82.6%) | 54 (17.4%) |
| Total (Overall) | 2,305 (51.7%) | 2,149 (48.2%) |
Employment Industries by Sex in Camp Hill borough
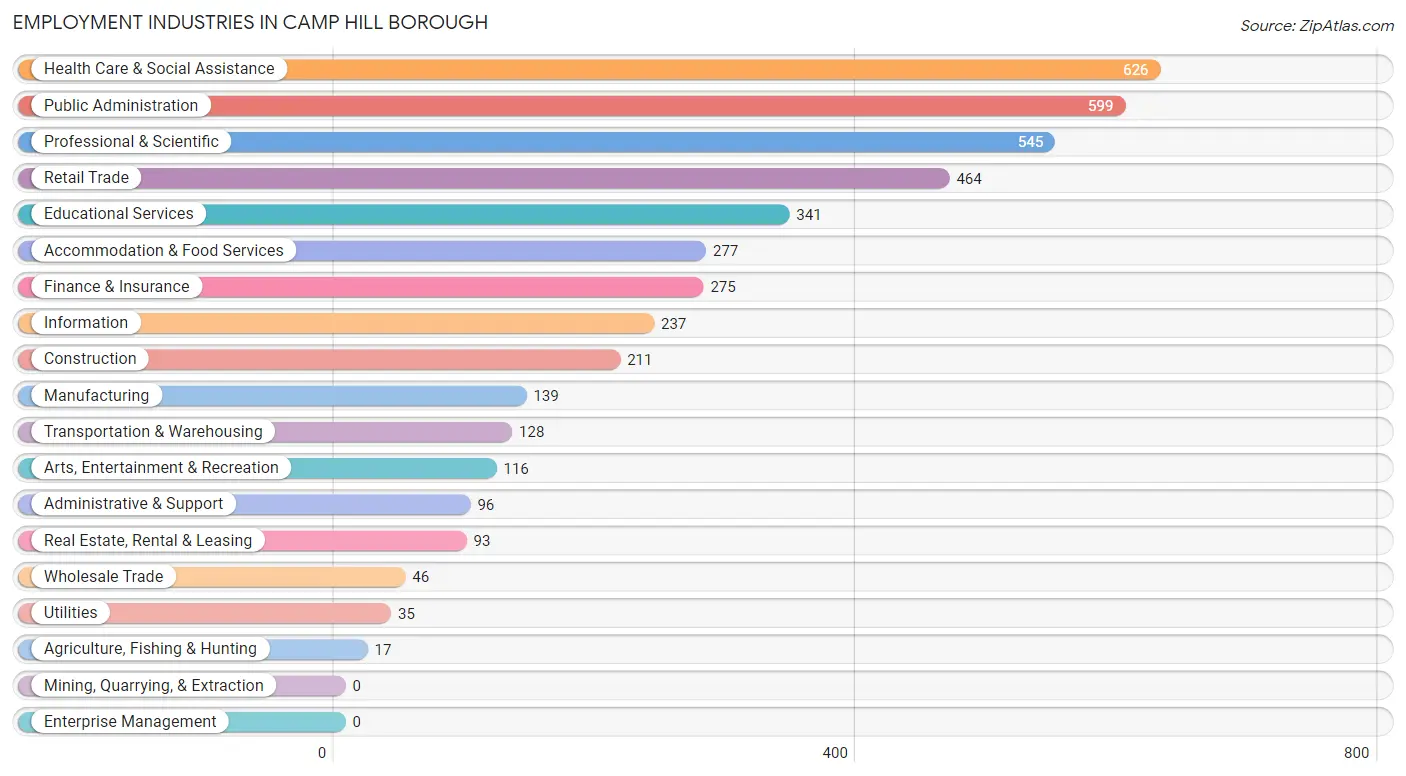
Employment Industries in Camp Hill borough
The major employment industries in Camp Hill borough include Health Care & Social Assistance (626 | 14.1%), Public Administration (599 | 13.5%), Professional & Scientific (545 | 12.2%), Retail Trade (464 | 10.4%), and Educational Services (341 | 7.7%).
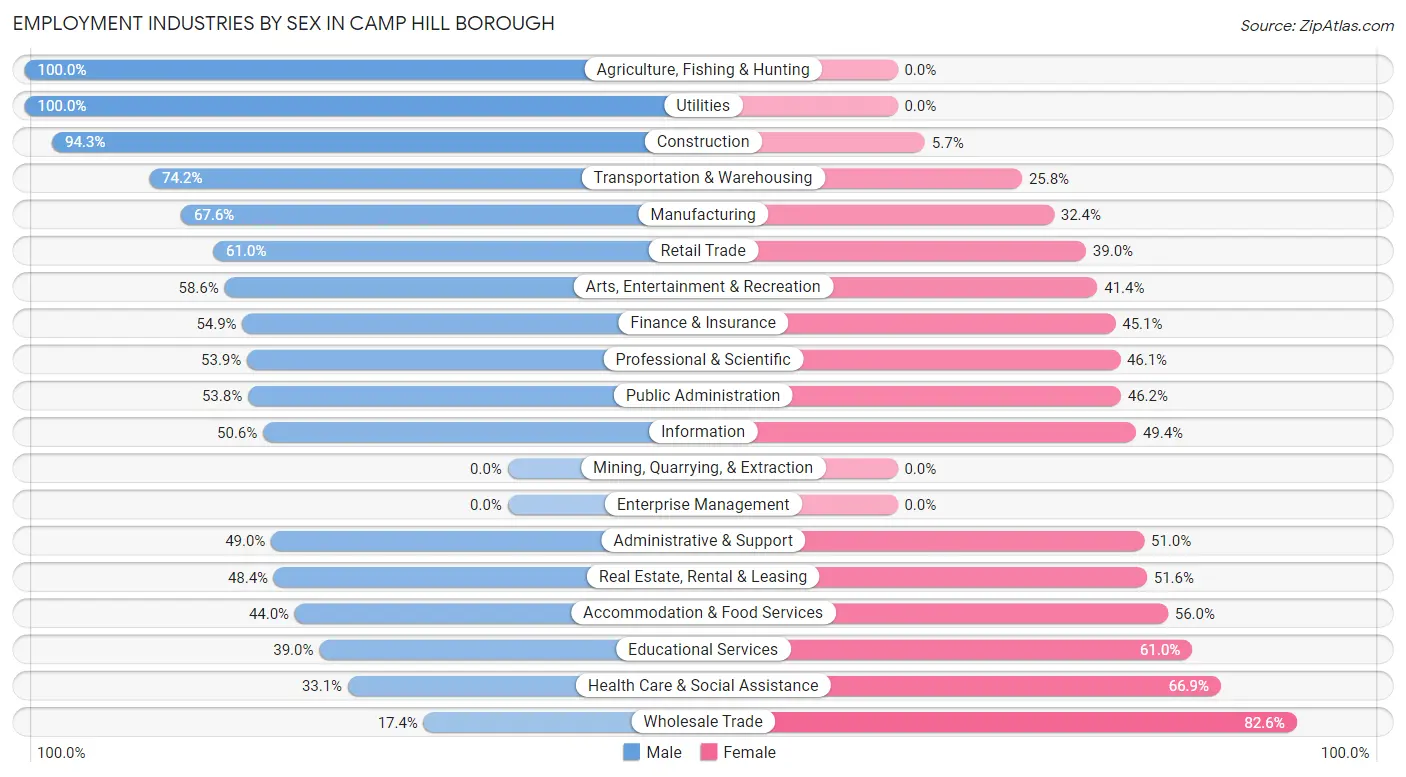
Employment Industries by Sex in Camp Hill borough
The Camp Hill borough industries that see more men than women are Agriculture, Fishing & Hunting (100.0%), Utilities (100.0%), and Construction (94.3%), whereas the industries that tend to have a higher number of women are Wholesale Trade (82.6%), Health Care & Social Assistance (66.9%), and Educational Services (61.0%).
| Industry | Male | Female |
| Agriculture, Fishing & Hunting | 17 (100.0%) | 0 (0.0%) |
| Mining, Quarrying, & Extraction | 0 (0.0%) | 0 (0.0%) |
| Construction | 199 (94.3%) | 12 (5.7%) |
| Manufacturing | 94 (67.6%) | 45 (32.4%) |
| Wholesale Trade | 8 (17.4%) | 38 (82.6%) |
| Retail Trade | 283 (61.0%) | 181 (39.0%) |
| Transportation & Warehousing | 95 (74.2%) | 33 (25.8%) |
| Utilities | 35 (100.0%) | 0 (0.0%) |
| Information | 120 (50.6%) | 117 (49.4%) |
| Finance & Insurance | 151 (54.9%) | 124 (45.1%) |
| Real Estate, Rental & Leasing | 45 (48.4%) | 48 (51.6%) |
| Professional & Scientific | 294 (53.9%) | 251 (46.1%) |
| Enterprise Management | 0 (0.0%) | 0 (0.0%) |
| Administrative & Support | 47 (49.0%) | 49 (51.0%) |
| Educational Services | 133 (39.0%) | 208 (61.0%) |
| Health Care & Social Assistance | 207 (33.1%) | 419 (66.9%) |
| Arts, Entertainment & Recreation | 68 (58.6%) | 48 (41.4%) |
| Accommodation & Food Services | 122 (44.0%) | 155 (56.0%) |
| Public Administration | 322 (53.8%) | 277 (46.2%) |
| Total | 2,305 (51.7%) | 2,149 (48.2%) |
Education in Camp Hill borough
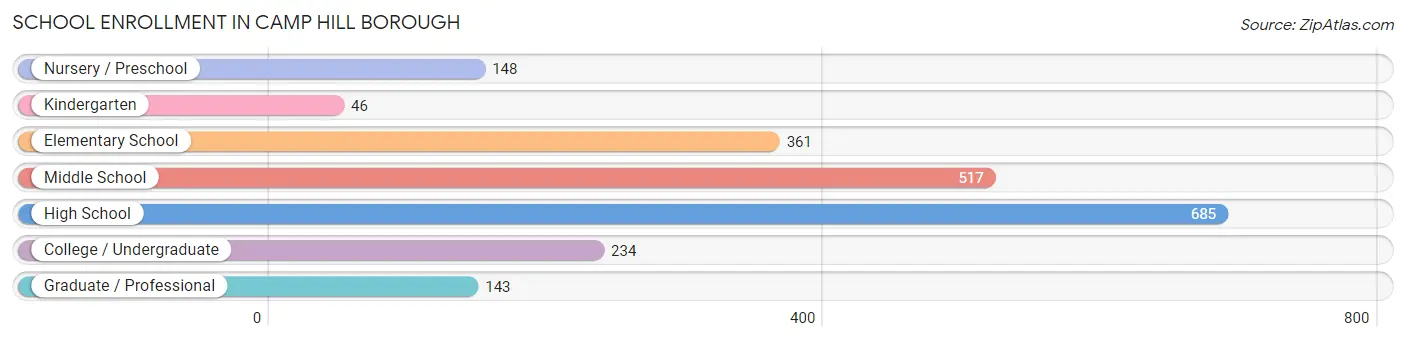
School Enrollment in Camp Hill borough
The most common levels of schooling among the 2,134 students in Camp Hill borough are high school (685 | 32.1%), middle school (517 | 24.2%), and elementary school (361 | 16.9%).
| School Level | # Students | % Students |
| Nursery / Preschool | 148 | 6.9% |
| Kindergarten | 46 | 2.2% |
| Elementary School | 361 | 16.9% |
| Middle School | 517 | 24.2% |
| High School | 685 | 32.1% |
| College / Undergraduate | 234 | 11.0% |
| Graduate / Professional | 143 | 6.7% |
| Total | 2,134 | 100.0% |
School Enrollment by Age by Funding Source in Camp Hill borough
Out of a total of 2,134 students who are enrolled in schools in Camp Hill borough, 363 (17.0%) attend a private institution, while the remaining 1,771 (83.0%) are enrolled in public schools. The age group of 35 years and over has the highest likelihood of being enrolled in private schools, with 95 (73.6% in the age bracket) enrolled. Conversely, the age group of 25 to 34 year olds has the lowest likelihood of being enrolled in a private school, with 69 (100.0% in the age bracket) attending a public institution.
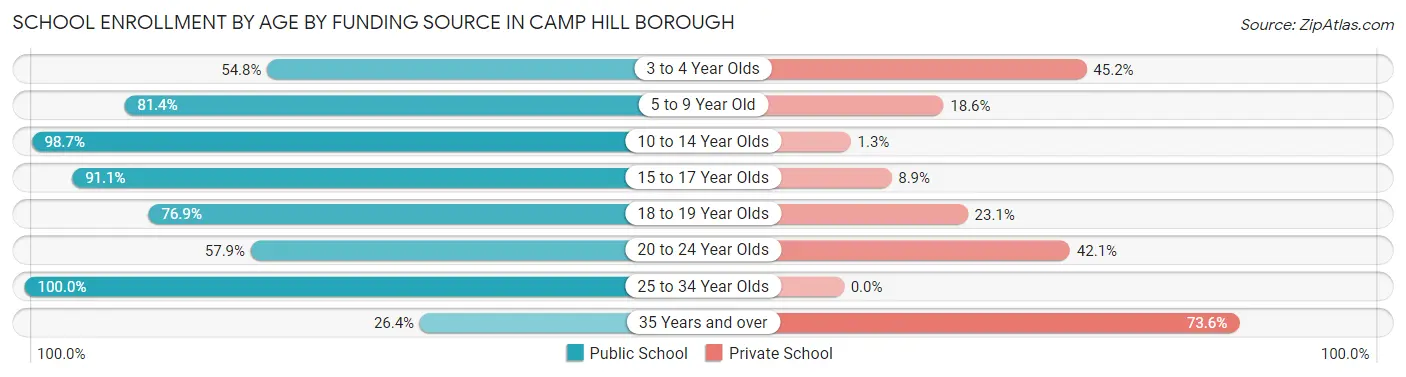
| Age Bracket | Public School | Private School |
| 3 to 4 Year Olds | 40 (54.8%) | 33 (45.2%) |
| 5 to 9 Year Old | 364 (81.4%) | 83 (18.6%) |
| 10 to 14 Year Olds | 610 (98.7%) | 8 (1.3%) |
| 15 to 17 Year Olds | 452 (91.1%) | 44 (8.9%) |
| 18 to 19 Year Olds | 110 (76.9%) | 33 (23.1%) |
| 20 to 24 Year Olds | 92 (57.9%) | 67 (42.1%) |
| 25 to 34 Year Olds | 69 (100.0%) | 0 (0.0%) |
| 35 Years and over | 34 (26.4%) | 95 (73.6%) |
| Total | 1,771 (83.0%) | 363 (17.0%) |
Educational Attainment by Field of Study in Camp Hill borough
Business (528 | 13.7%), education (425 | 11.0%), social sciences (347 | 9.0%), science & technology (338 | 8.8%), and liberal arts & history (336 | 8.7%) are the most common fields of study among 3,853 individuals in Camp Hill borough who have obtained a bachelor's degree or higher.
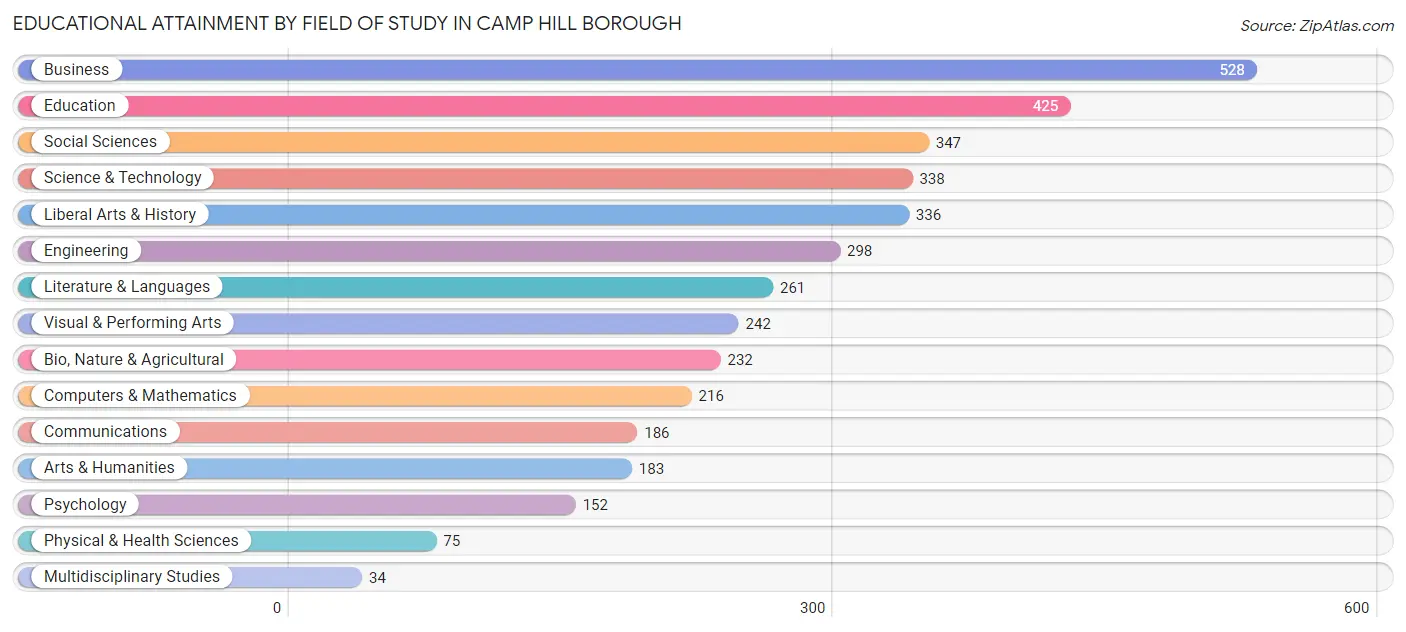
| Field of Study | # Graduates | % Graduates |
| Computers & Mathematics | 216 | 5.6% |
| Bio, Nature & Agricultural | 232 | 6.0% |
| Physical & Health Sciences | 75 | 1.9% |
| Psychology | 152 | 3.9% |
| Social Sciences | 347 | 9.0% |
| Engineering | 298 | 7.7% |
| Multidisciplinary Studies | 34 | 0.9% |
| Science & Technology | 338 | 8.8% |
| Business | 528 | 13.7% |
| Education | 425 | 11.0% |
| Literature & Languages | 261 | 6.8% |
| Liberal Arts & History | 336 | 8.7% |
| Visual & Performing Arts | 242 | 6.3% |
| Communications | 186 | 4.8% |
| Arts & Humanities | 183 | 4.8% |
| Total | 3,853 | 100.0% |
Transportation & Commute in Camp Hill borough
Vehicle Availability by Sex in Camp Hill borough
The most prevalent vehicle ownership categories in Camp Hill borough are males with 2 vehicles (1,168, accounting for 51.5%) and females with 2 vehicles (963, making up 56.4%).
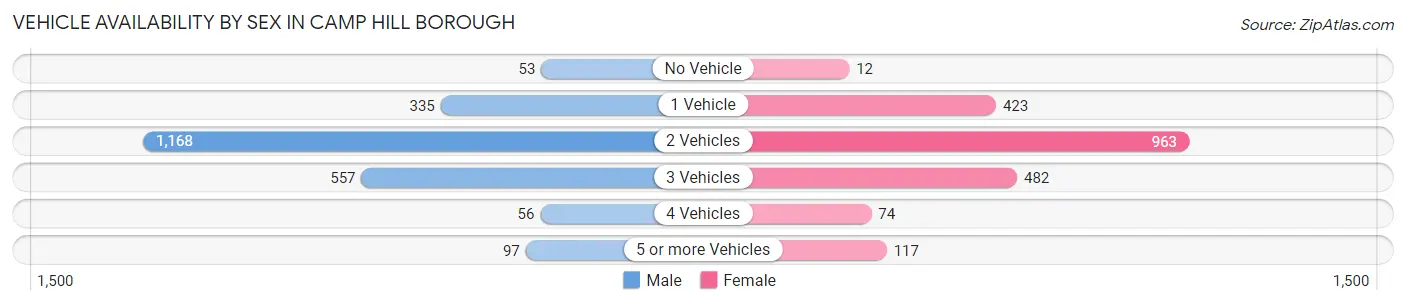
| Vehicles Available | Male | Female |
| No Vehicle | 53 (2.3%) | 12 (0.6%) |
| 1 Vehicle | 335 (14.8%) | 423 (20.4%) |
| 2 Vehicles | 1,168 (51.5%) | 963 (46.5%) |
| 3 Vehicles | 557 (24.6%) | 482 (23.3%) |
| 4 Vehicles | 56 (2.5%) | 74 (3.6%) |
| 5 or more Vehicles | 97 (4.3%) | 117 (5.7%) |
| Total | 2,266 (100.0%) | 2,071 (100.0%) |
Commute Time in Camp Hill borough
The most frequently occuring commute durations in Camp Hill borough are 15 to 19 minutes (934 commuters, 27.7%), 10 to 14 minutes (765 commuters, 22.7%), and 5 to 9 minutes (433 commuters, 12.8%).
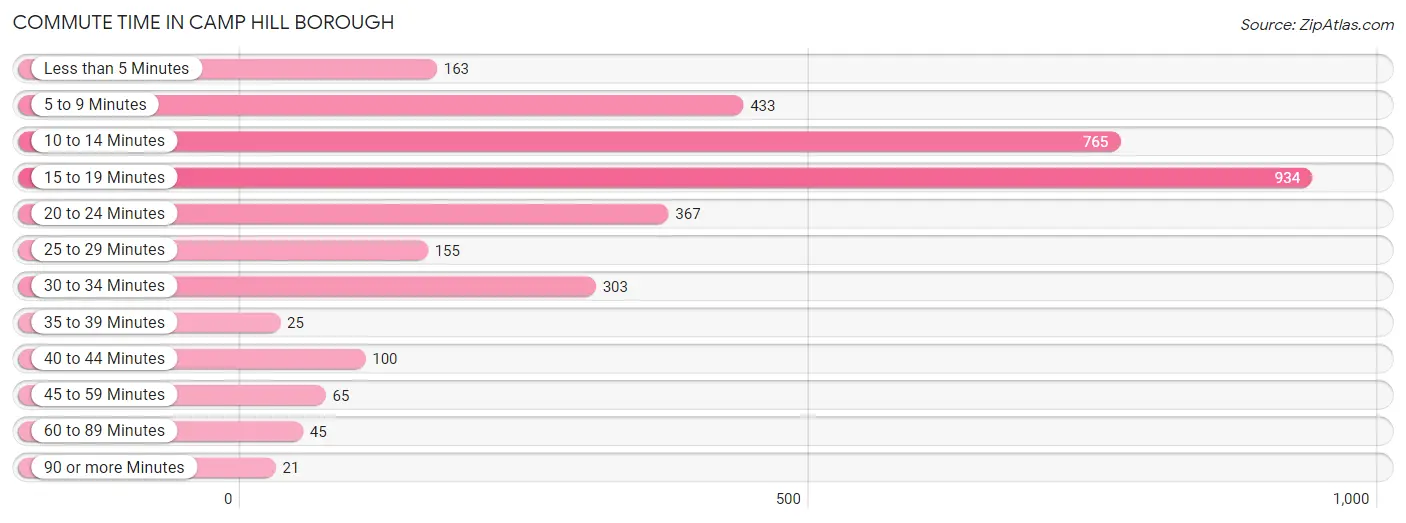
| Commute Time | # Commuters | % Commuters |
| Less than 5 Minutes | 163 | 4.8% |
| 5 to 9 Minutes | 433 | 12.8% |
| 10 to 14 Minutes | 765 | 22.7% |
| 15 to 19 Minutes | 934 | 27.7% |
| 20 to 24 Minutes | 367 | 10.9% |
| 25 to 29 Minutes | 155 | 4.6% |
| 30 to 34 Minutes | 303 | 9.0% |
| 35 to 39 Minutes | 25 | 0.7% |
| 40 to 44 Minutes | 100 | 3.0% |
| 45 to 59 Minutes | 65 | 1.9% |
| 60 to 89 Minutes | 45 | 1.3% |
| 90 or more Minutes | 21 | 0.6% |
Commute Time by Sex in Camp Hill borough
The most common commute times in Camp Hill borough are 10 to 14 minutes (506 commuters, 28.2%) for males and 15 to 19 minutes (461 commuters, 29.1%) for females.
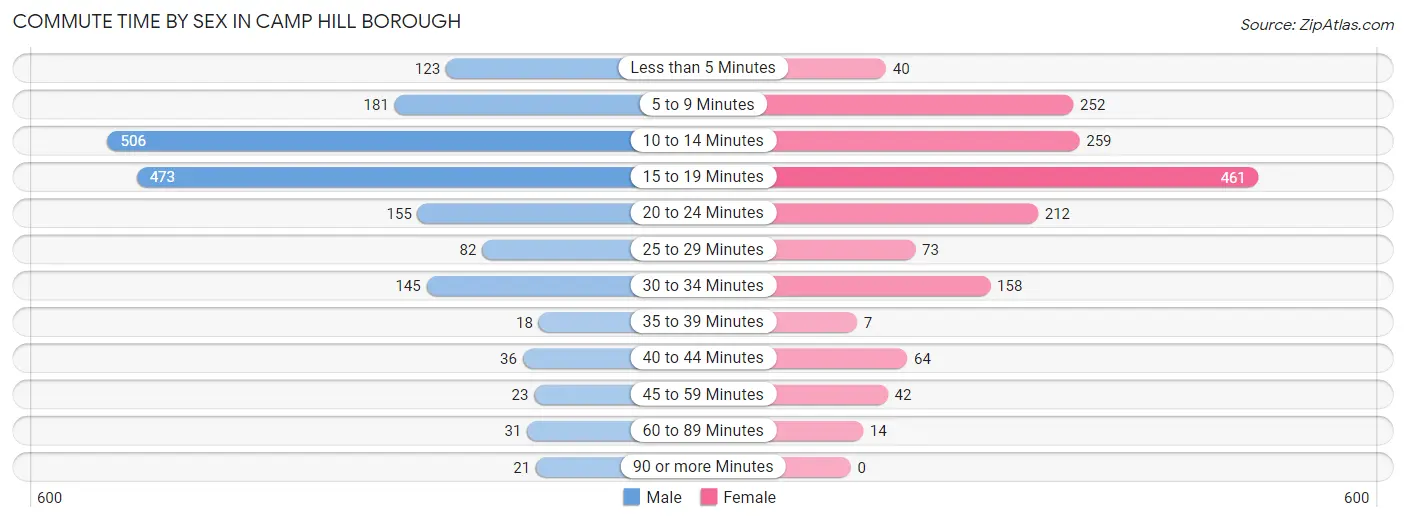
| Commute Time | Male | Female |
| Less than 5 Minutes | 123 (6.9%) | 40 (2.5%) |
| 5 to 9 Minutes | 181 (10.1%) | 252 (15.9%) |
| 10 to 14 Minutes | 506 (28.2%) | 259 (16.4%) |
| 15 to 19 Minutes | 473 (26.4%) | 461 (29.1%) |
| 20 to 24 Minutes | 155 (8.6%) | 212 (13.4%) |
| 25 to 29 Minutes | 82 (4.6%) | 73 (4.6%) |
| 30 to 34 Minutes | 145 (8.1%) | 158 (10.0%) |
| 35 to 39 Minutes | 18 (1.0%) | 7 (0.4%) |
| 40 to 44 Minutes | 36 (2.0%) | 64 (4.1%) |
| 45 to 59 Minutes | 23 (1.3%) | 42 (2.6%) |
| 60 to 89 Minutes | 31 (1.7%) | 14 (0.9%) |
| 90 or more Minutes | 21 (1.2%) | 0 (0.0%) |
Time of Departure to Work by Sex in Camp Hill borough
The most frequent times of departure to work in Camp Hill borough are 7:30 AM to 7:59 AM (393, 21.9%) for males and 7:30 AM to 7:59 AM (264, 16.7%) for females.
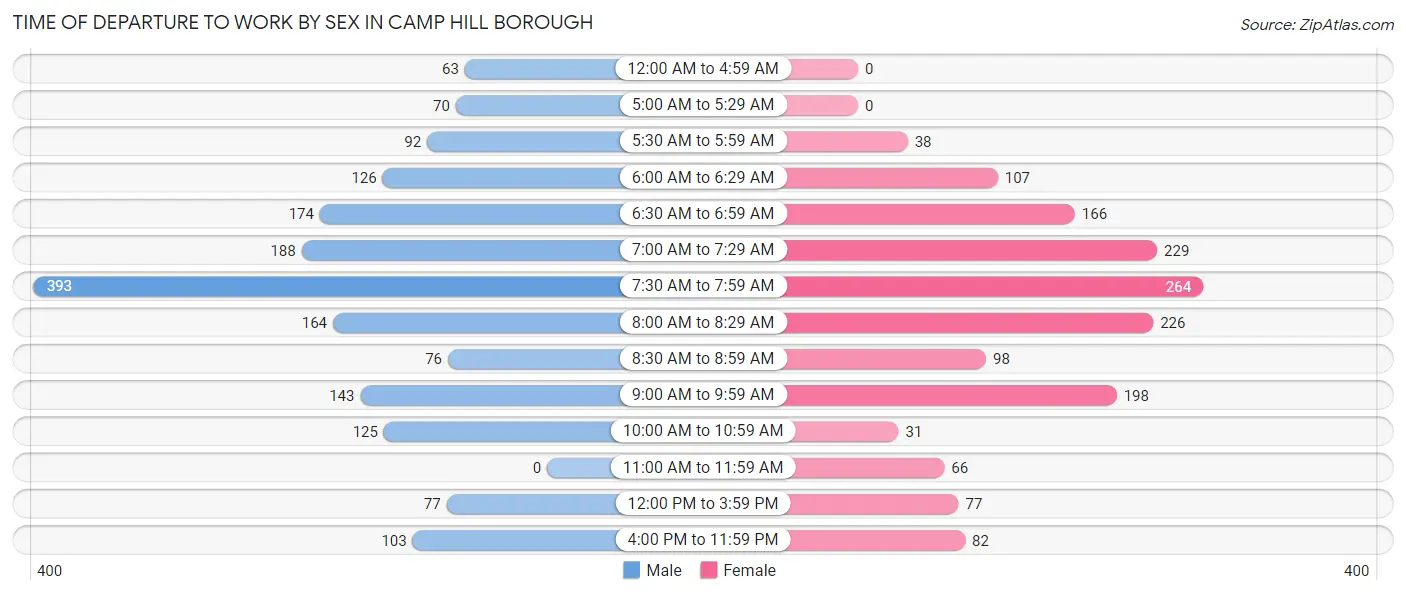
| Time of Departure | Male | Female |
| 12:00 AM to 4:59 AM | 63 (3.5%) | 0 (0.0%) |
| 5:00 AM to 5:29 AM | 70 (3.9%) | 0 (0.0%) |
| 5:30 AM to 5:59 AM | 92 (5.1%) | 38 (2.4%) |
| 6:00 AM to 6:29 AM | 126 (7.0%) | 107 (6.8%) |
| 6:30 AM to 6:59 AM | 174 (9.7%) | 166 (10.5%) |
| 7:00 AM to 7:29 AM | 188 (10.5%) | 229 (14.5%) |
| 7:30 AM to 7:59 AM | 393 (21.9%) | 264 (16.7%) |
| 8:00 AM to 8:29 AM | 164 (9.1%) | 226 (14.3%) |
| 8:30 AM to 8:59 AM | 76 (4.2%) | 98 (6.2%) |
| 9:00 AM to 9:59 AM | 143 (8.0%) | 198 (12.5%) |
| 10:00 AM to 10:59 AM | 125 (7.0%) | 31 (2.0%) |
| 11:00 AM to 11:59 AM | 0 (0.0%) | 66 (4.2%) |
| 12:00 PM to 3:59 PM | 77 (4.3%) | 77 (4.9%) |
| 4:00 PM to 11:59 PM | 103 (5.7%) | 82 (5.2%) |
| Total | 1,794 (100.0%) | 1,582 (100.0%) |
Housing Occupancy in Camp Hill borough
Occupancy by Ownership in Camp Hill borough
Of the total 3,245 dwellings in Camp Hill borough, owner-occupied units account for 2,223 (68.5%), while renter-occupied units make up 1,022 (31.5%).
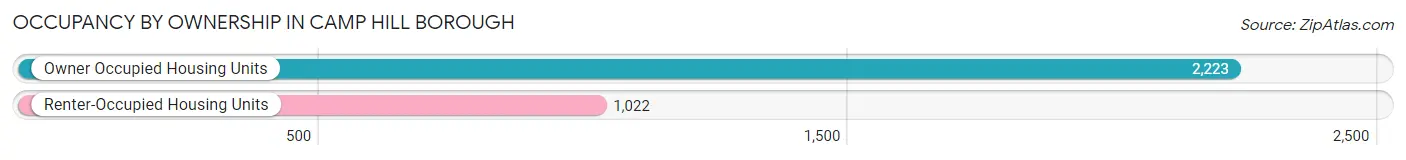
| Occupancy | # Housing Units | % Housing Units |
| Owner Occupied Housing Units | 2,223 | 68.5% |
| Renter-Occupied Housing Units | 1,022 | 31.5% |
| Total Occupied Housing Units | 3,245 | 100.0% |
Occupancy by Household Size in Camp Hill borough
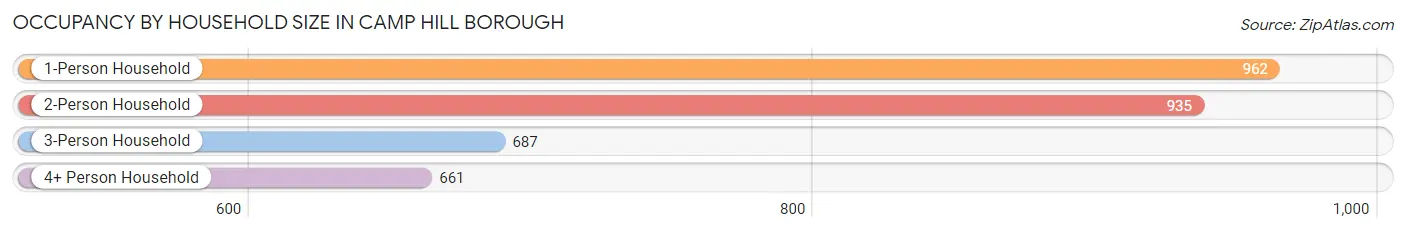
| Household Size | # Housing Units | % Housing Units |
| 1-Person Household | 962 | 29.6% |
| 2-Person Household | 935 | 28.8% |
| 3-Person Household | 687 | 21.2% |
| 4+ Person Household | 661 | 20.4% |
| Total Housing Units | 3,245 | 100.0% |
Occupancy by Ownership by Household Size in Camp Hill borough
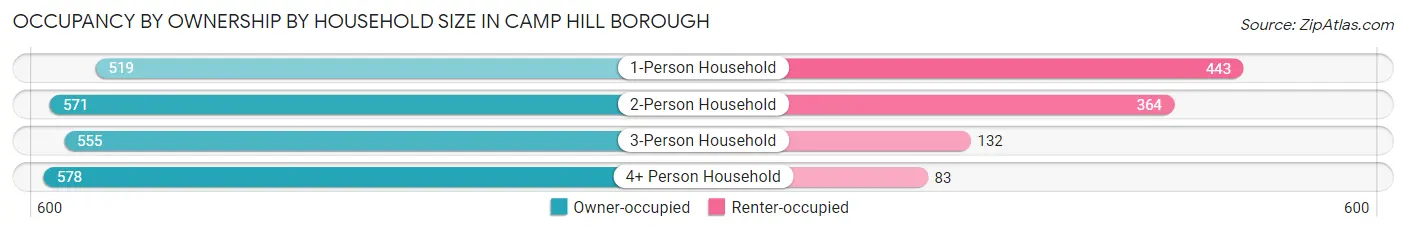
| Household Size | Owner-occupied | Renter-occupied |
| 1-Person Household | 519 (53.9%) | 443 (46.1%) |
| 2-Person Household | 571 (61.1%) | 364 (38.9%) |
| 3-Person Household | 555 (80.8%) | 132 (19.2%) |
| 4+ Person Household | 578 (87.4%) | 83 (12.6%) |
| Total Housing Units | 2,223 (68.5%) | 1,022 (31.5%) |
Occupancy by Educational Attainment in Camp Hill borough
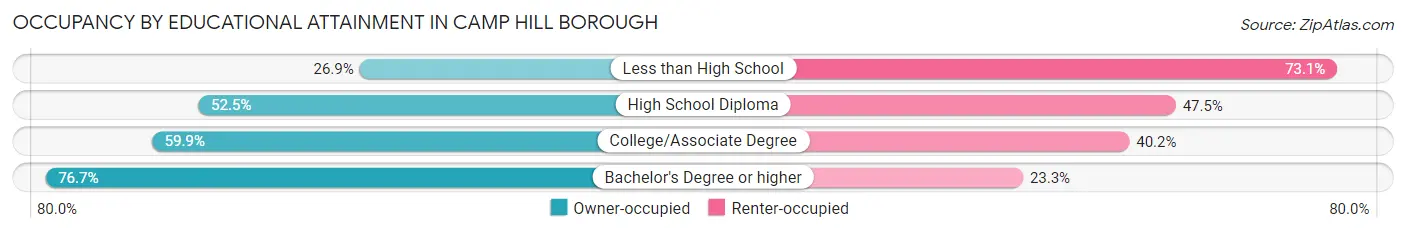
| Household Size | Owner-occupied | Renter-occupied |
| Less than High School | 25 (26.9%) | 68 (73.1%) |
| High School Diploma | 232 (52.5%) | 210 (47.5%) |
| College/Associate Degree | 401 (59.9%) | 269 (40.2%) |
| Bachelor's Degree or higher | 1,565 (76.7%) | 475 (23.3%) |
Occupancy by Age of Householder in Camp Hill borough
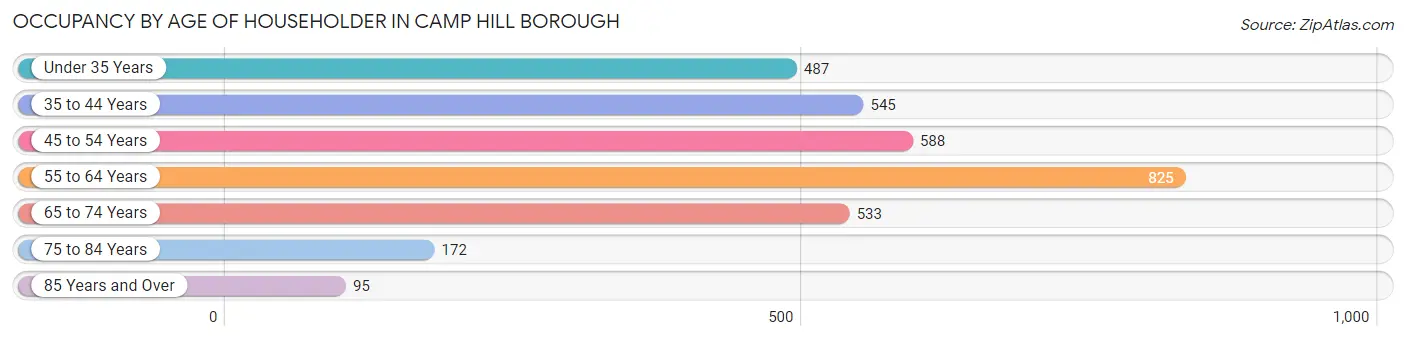
| Age Bracket | # Households | % Households |
| Under 35 Years | 487 | 15.0% |
| 35 to 44 Years | 545 | 16.8% |
| 45 to 54 Years | 588 | 18.1% |
| 55 to 64 Years | 825 | 25.4% |
| 65 to 74 Years | 533 | 16.4% |
| 75 to 84 Years | 172 | 5.3% |
| 85 Years and Over | 95 | 2.9% |
| Total | 3,245 | 100.0% |
Housing Finances in Camp Hill borough
Median Income by Occupancy in Camp Hill borough
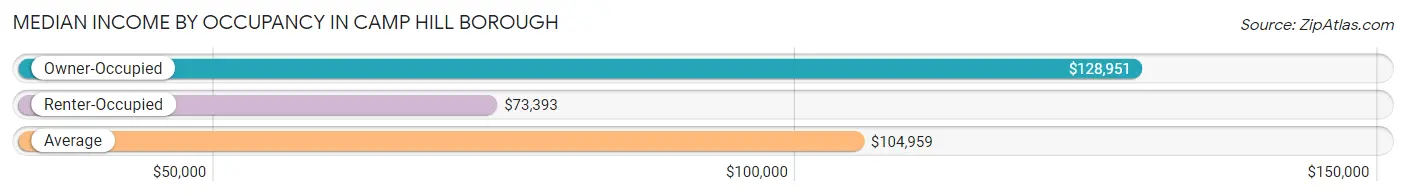
| Occupancy Type | # Households | Median Income |
| Owner-Occupied | 2,223 (68.5%) | $128,951 |
| Renter-Occupied | 1,022 (31.5%) | $73,393 |
| Average | 3,245 (100.0%) | $104,959 |
Occupancy by Householder Income Bracket in Camp Hill borough
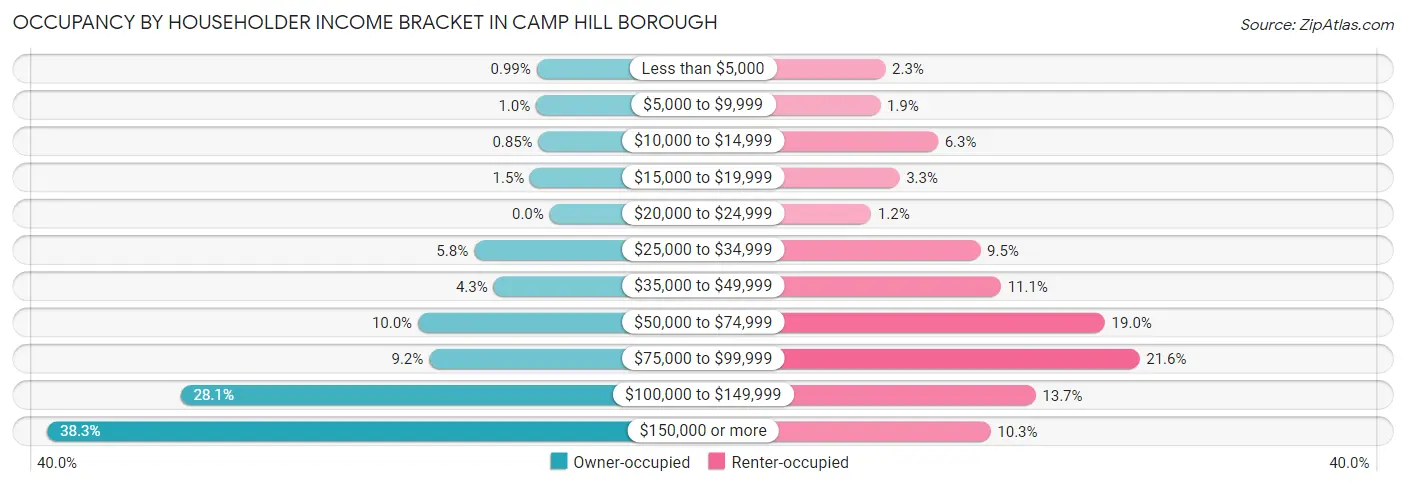
| Income Bracket | Owner-occupied | Renter-occupied |
| Less than $5,000 | 22 (1.0%) | 23 (2.2%) |
| $5,000 to $9,999 | 23 (1.0%) | 19 (1.9%) |
| $10,000 to $14,999 | 19 (0.9%) | 64 (6.3%) |
| $15,000 to $19,999 | 33 (1.5%) | 34 (3.3%) |
| $20,000 to $24,999 | 0 (0.0%) | 12 (1.2%) |
| $25,000 to $34,999 | 128 (5.8%) | 97 (9.5%) |
| $35,000 to $49,999 | 95 (4.3%) | 113 (11.1%) |
| $50,000 to $74,999 | 223 (10.0%) | 194 (19.0%) |
| $75,000 to $99,999 | 204 (9.2%) | 221 (21.6%) |
| $100,000 to $149,999 | 625 (28.1%) | 140 (13.7%) |
| $150,000 or more | 851 (38.3%) | 105 (10.3%) |
| Total | 2,223 (100.0%) | 1,022 (100.0%) |
Monthly Housing Cost Tiers in Camp Hill borough
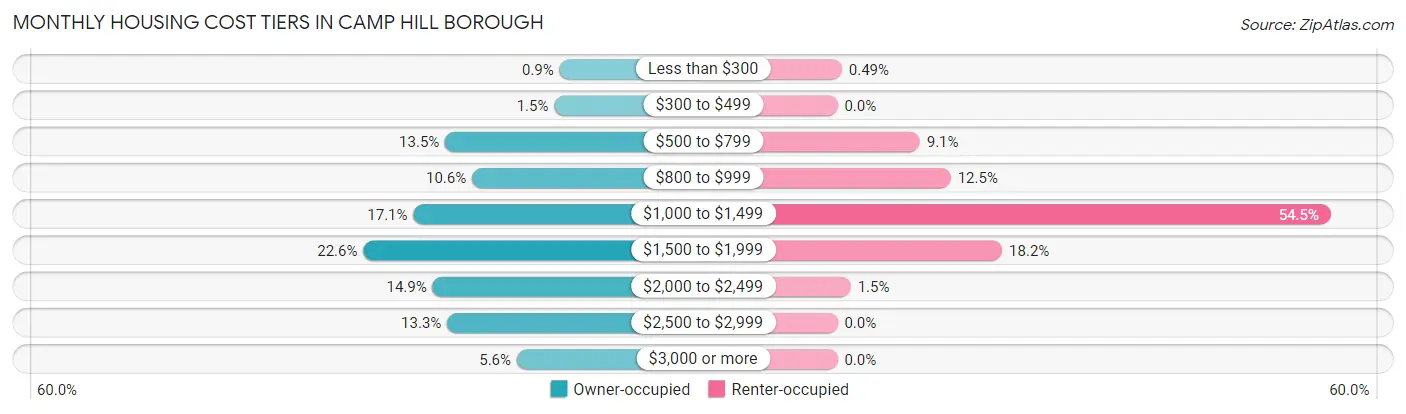
| Monthly Cost | Owner-occupied | Renter-occupied |
| Less than $300 | 20 (0.9%) | 5 (0.5%) |
| $300 to $499 | 33 (1.5%) | 0 (0.0%) |
| $500 to $799 | 301 (13.5%) | 93 (9.1%) |
| $800 to $999 | 235 (10.6%) | 128 (12.5%) |
| $1,000 to $1,499 | 379 (17.1%) | 557 (54.5%) |
| $1,500 to $1,999 | 502 (22.6%) | 186 (18.2%) |
| $2,000 to $2,499 | 332 (14.9%) | 15 (1.5%) |
| $2,500 to $2,999 | 296 (13.3%) | 0 (0.0%) |
| $3,000 or more | 125 (5.6%) | 0 (0.0%) |
| Total | 2,223 (100.0%) | 1,022 (100.0%) |
Physical Housing Characteristics in Camp Hill borough
Housing Structures in Camp Hill borough
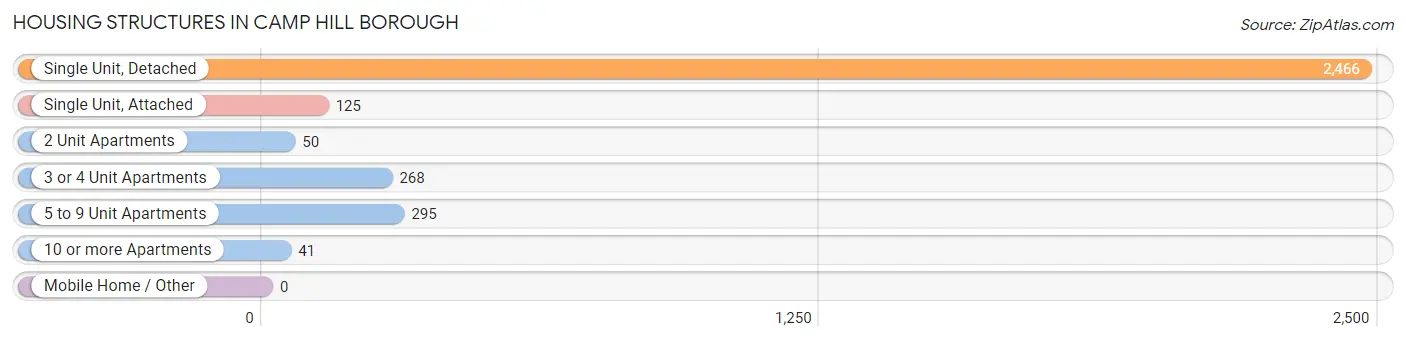
| Structure Type | # Housing Units | % Housing Units |
| Single Unit, Detached | 2,466 | 76.0% |
| Single Unit, Attached | 125 | 3.8% |
| 2 Unit Apartments | 50 | 1.5% |
| 3 or 4 Unit Apartments | 268 | 8.3% |
| 5 to 9 Unit Apartments | 295 | 9.1% |
| 10 or more Apartments | 41 | 1.3% |
| Mobile Home / Other | 0 | 0.0% |
| Total | 3,245 | 100.0% |
Housing Structures by Occupancy in Camp Hill borough
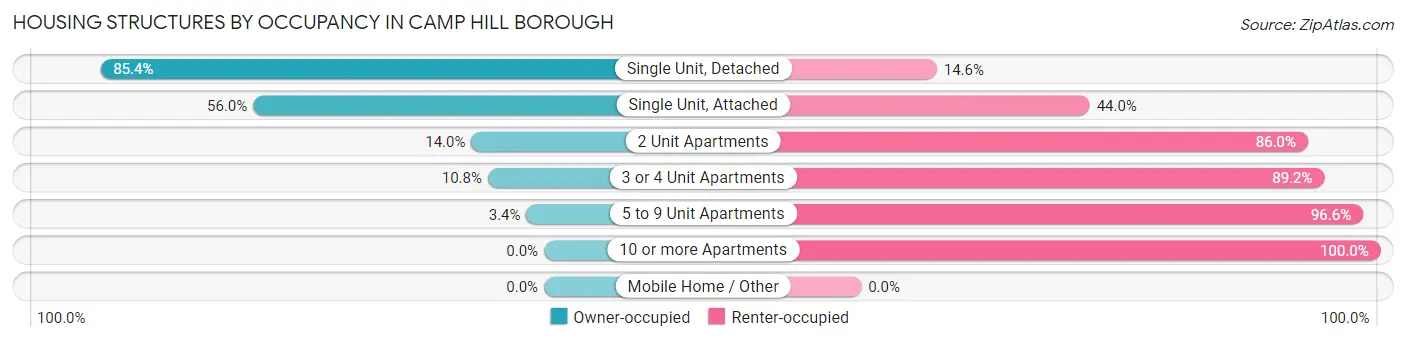
| Structure Type | Owner-occupied | Renter-occupied |
| Single Unit, Detached | 2,107 (85.4%) | 359 (14.6%) |
| Single Unit, Attached | 70 (56.0%) | 55 (44.0%) |
| 2 Unit Apartments | 7 (14.0%) | 43 (86.0%) |
| 3 or 4 Unit Apartments | 29 (10.8%) | 239 (89.2%) |
| 5 to 9 Unit Apartments | 10 (3.4%) | 285 (96.6%) |
| 10 or more Apartments | 0 (0.0%) | 41 (100.0%) |
| Mobile Home / Other | 0 (0.0%) | 0 (0.0%) |
| Total | 2,223 (68.5%) | 1,022 (31.5%) |
Housing Structures by Number of Rooms in Camp Hill borough
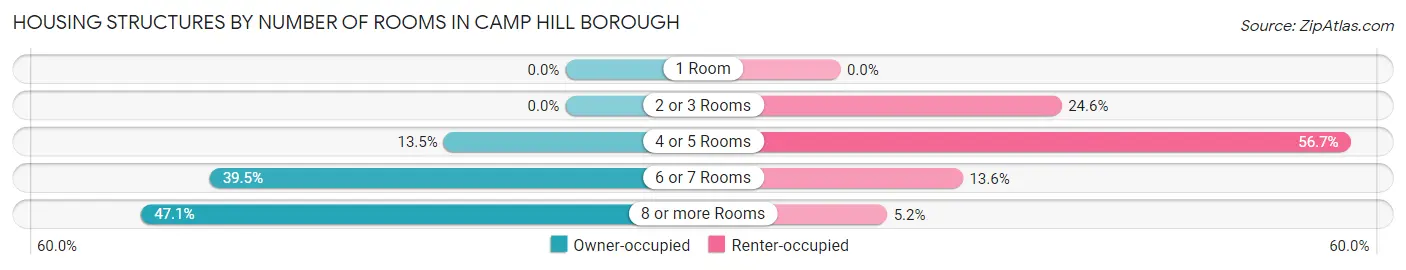
| Number of Rooms | Owner-occupied | Renter-occupied |
| 1 Room | 0 (0.0%) | 0 (0.0%) |
| 2 or 3 Rooms | 0 (0.0%) | 251 (24.6%) |
| 4 or 5 Rooms | 300 (13.5%) | 579 (56.7%) |
| 6 or 7 Rooms | 877 (39.5%) | 139 (13.6%) |
| 8 or more Rooms | 1,046 (47.0%) | 53 (5.2%) |
| Total | 2,223 (100.0%) | 1,022 (100.0%) |
Housing Structure by Heating Type in Camp Hill borough
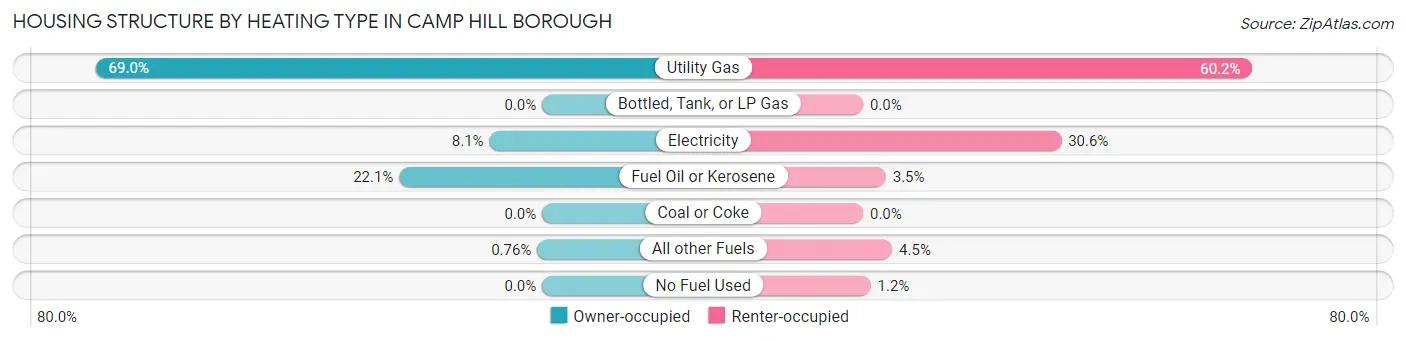
| Heating Type | Owner-occupied | Renter-occupied |
| Utility Gas | 1,534 (69.0%) | 615 (60.2%) |
| Bottled, Tank, or LP Gas | 0 (0.0%) | 0 (0.0%) |
| Electricity | 181 (8.1%) | 313 (30.6%) |
| Fuel Oil or Kerosene | 491 (22.1%) | 36 (3.5%) |
| Coal or Coke | 0 (0.0%) | 0 (0.0%) |
| All other Fuels | 17 (0.8%) | 46 (4.5%) |
| No Fuel Used | 0 (0.0%) | 12 (1.2%) |
| Total | 2,223 (100.0%) | 1,022 (100.0%) |
Household Vehicle Usage in Camp Hill borough
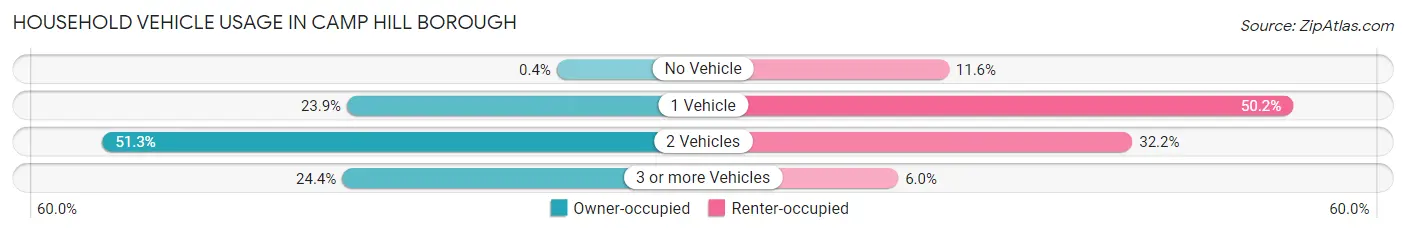
| Vehicles per Household | Owner-occupied | Renter-occupied |
| No Vehicle | 9 (0.4%) | 119 (11.6%) |
| 1 Vehicle | 531 (23.9%) | 513 (50.2%) |
| 2 Vehicles | 1,140 (51.3%) | 329 (32.2%) |
| 3 or more Vehicles | 543 (24.4%) | 61 (6.0%) |
| Total | 2,223 (100.0%) | 1,022 (100.0%) |
Real Estate & Mortgages in Camp Hill borough
Real Estate and Mortgage Overview in Camp Hill borough
| Characteristic | Without Mortgage | With Mortgage |
| Housing Units | 620 | 1,603 |
| Median Property Value | $258,100 | $281,600 |
| Median Household Income | $108,846 | $674 |
| Monthly Housing Costs | $808 | $125 |
| Real Estate Taxes | $4,310 | $0 |
Property Value by Mortgage Status in Camp Hill borough
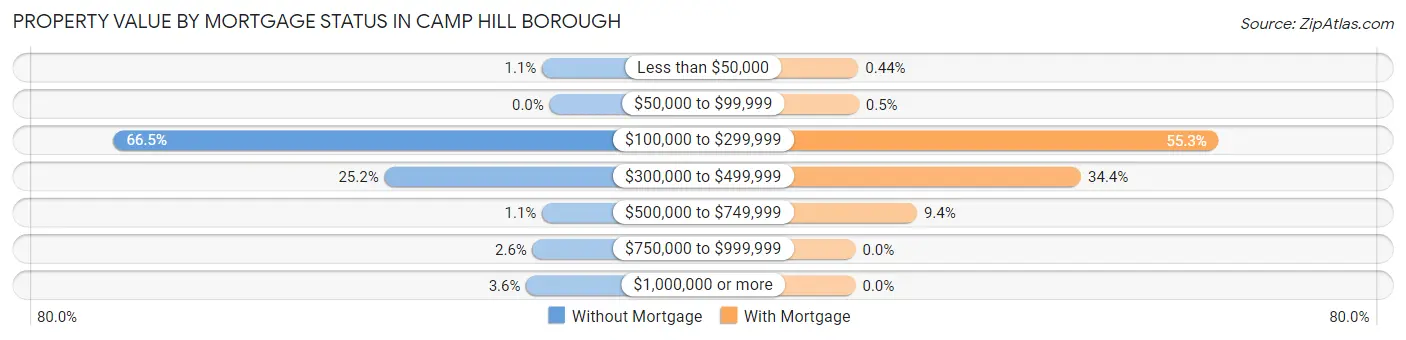
| Property Value | Without Mortgage | With Mortgage |
| Less than $50,000 | 7 (1.1%) | 7 (0.4%) |
| $50,000 to $99,999 | 0 (0.0%) | 8 (0.5%) |
| $100,000 to $299,999 | 412 (66.4%) | 887 (55.3%) |
| $300,000 to $499,999 | 156 (25.2%) | 551 (34.4%) |
| $500,000 to $749,999 | 7 (1.1%) | 150 (9.4%) |
| $750,000 to $999,999 | 16 (2.6%) | 0 (0.0%) |
| $1,000,000 or more | 22 (3.5%) | 0 (0.0%) |
| Total | 620 (100.0%) | 1,603 (100.0%) |
Household Income by Mortgage Status in Camp Hill borough
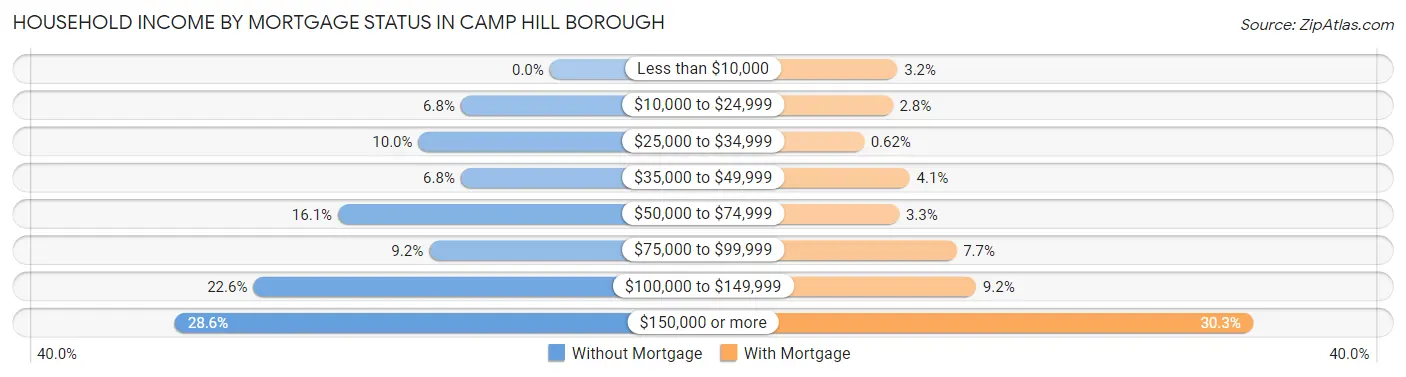
| Household Income | Without Mortgage | With Mortgage |
| Less than $10,000 | 0 (0.0%) | 51 (3.2%) |
| $10,000 to $24,999 | 42 (6.8%) | 45 (2.8%) |
| $25,000 to $34,999 | 62 (10.0%) | 10 (0.6%) |
| $35,000 to $49,999 | 42 (6.8%) | 66 (4.1%) |
| $50,000 to $74,999 | 100 (16.1%) | 53 (3.3%) |
| $75,000 to $99,999 | 57 (9.2%) | 123 (7.7%) |
| $100,000 to $149,999 | 140 (22.6%) | 147 (9.2%) |
| $150,000 or more | 177 (28.5%) | 485 (30.3%) |
| Total | 620 (100.0%) | 1,603 (100.0%) |
Property Value to Household Income Ratio in Camp Hill borough
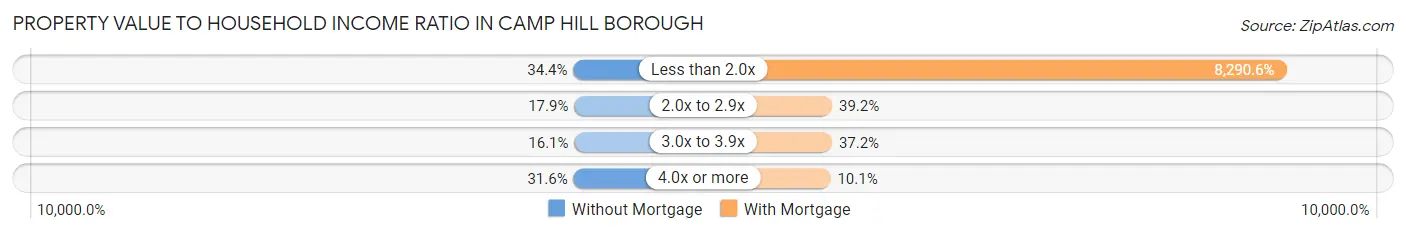
| Value-to-Income Ratio | Without Mortgage | With Mortgage |
| Less than 2.0x | 213 (34.4%) | 132,898 (8,290.6%) |
| 2.0x to 2.9x | 111 (17.9%) | 629 (39.2%) |
| 3.0x to 3.9x | 100 (16.1%) | 597 (37.2%) |
| 4.0x or more | 196 (31.6%) | 162 (10.1%) |
| Total | 620 (100.0%) | 1,603 (100.0%) |
Real Estate Taxes by Mortgage Status in Camp Hill borough
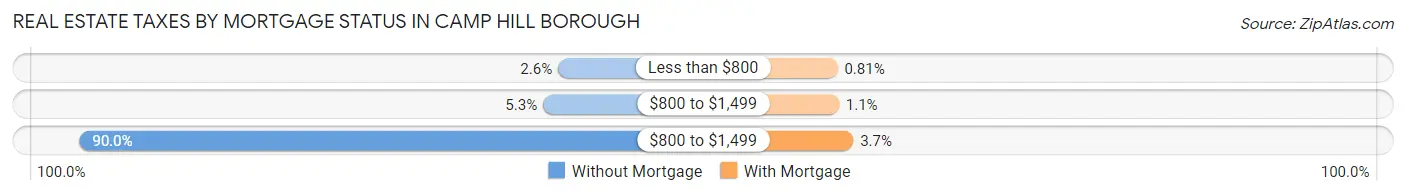
| Property Taxes | Without Mortgage | With Mortgage |
| Less than $800 | 16 (2.6%) | 13 (0.8%) |
| $800 to $1,499 | 33 (5.3%) | 17 (1.1%) |
| $800 to $1,499 | 558 (90.0%) | 59 (3.7%) |
| Total | 620 (100.0%) | 1,603 (100.0%) |
Health & Disability in Camp Hill borough
Health Insurance Coverage by Age in Camp Hill borough
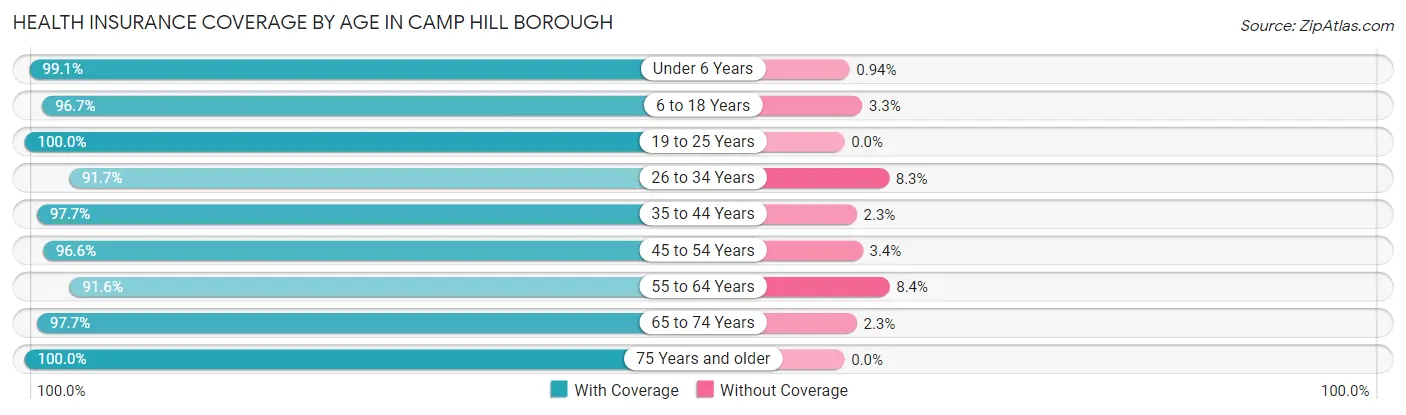
| Age Bracket | With Coverage | Without Coverage |
| Under 6 Years | 525 (99.1%) | 5 (0.9%) |
| 6 to 18 Years | 1,556 (96.7%) | 53 (3.3%) |
| 19 to 25 Years | 488 (100.0%) | 0 (0.0%) |
| 26 to 34 Years | 686 (91.7%) | 62 (8.3%) |
| 35 to 44 Years | 1,026 (97.7%) | 24 (2.3%) |
| 45 to 54 Years | 1,194 (96.6%) | 42 (3.4%) |
| 55 to 64 Years | 1,026 (91.6%) | 94 (8.4%) |
| 65 to 74 Years | 685 (97.7%) | 16 (2.3%) |
| 75 Years and older | 524 (100.0%) | 0 (0.0%) |
| Total | 7,710 (96.3%) | 296 (3.7%) |
Health Insurance Coverage by Citizenship Status in Camp Hill borough
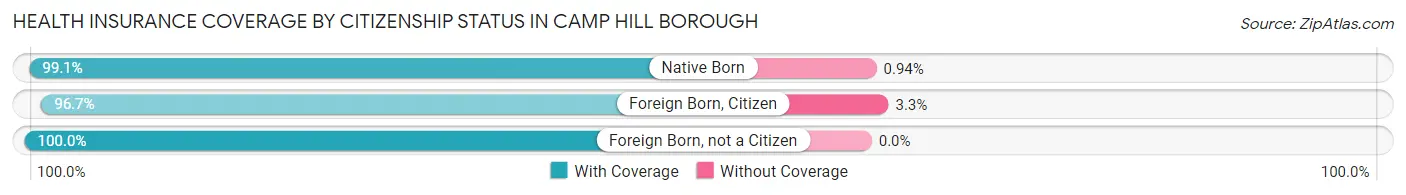
| Citizenship Status | With Coverage | Without Coverage |
| Native Born | 525 (99.1%) | 5 (0.9%) |
| Foreign Born, Citizen | 1,556 (96.7%) | 53 (3.3%) |
| Foreign Born, not a Citizen | 488 (100.0%) | 0 (0.0%) |
Health Insurance Coverage by Household Income in Camp Hill borough
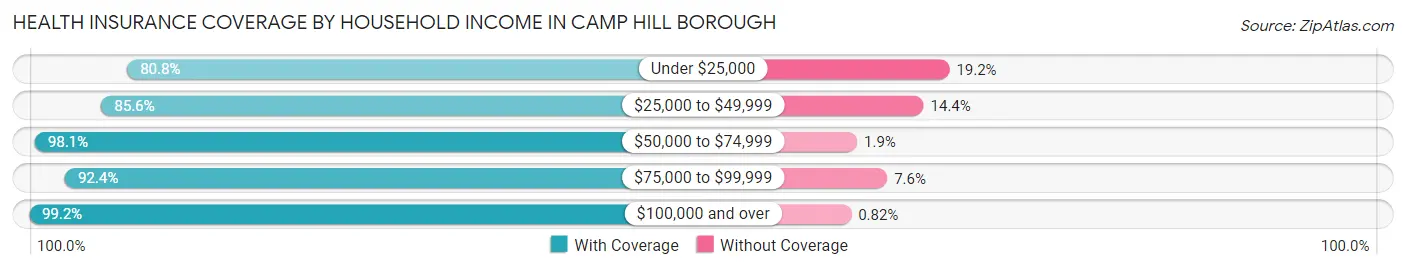
| Household Income | With Coverage | Without Coverage |
| Under $25,000 | 294 (80.8%) | 70 (19.2%) |
| $25,000 to $49,999 | 601 (85.6%) | 101 (14.4%) |
| $50,000 to $74,999 | 661 (98.1%) | 13 (1.9%) |
| $75,000 to $99,999 | 818 (92.4%) | 67 (7.6%) |
| $100,000 and over | 5,331 (99.2%) | 44 (0.8%) |
Public vs Private Health Insurance Coverage by Age in Camp Hill borough
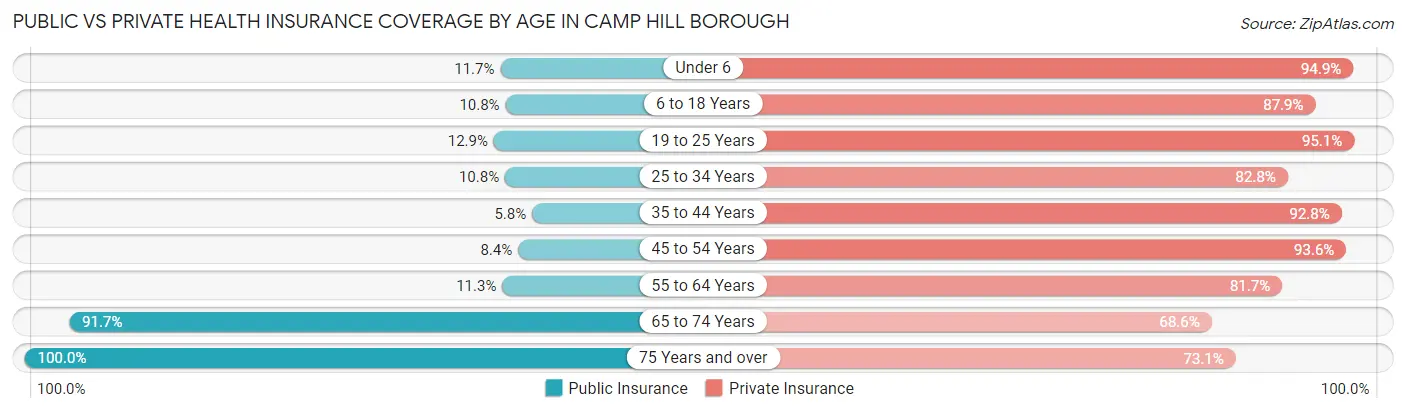
| Age Bracket | Public Insurance | Private Insurance |
| Under 6 | 62 (11.7%) | 503 (94.9%) |
| 6 to 18 Years | 173 (10.7%) | 1,414 (87.9%) |
| 19 to 25 Years | 63 (12.9%) | 464 (95.1%) |
| 25 to 34 Years | 81 (10.8%) | 619 (82.8%) |
| 35 to 44 Years | 61 (5.8%) | 974 (92.8%) |
| 45 to 54 Years | 104 (8.4%) | 1,157 (93.6%) |
| 55 to 64 Years | 127 (11.3%) | 915 (81.7%) |
| 65 to 74 Years | 643 (91.7%) | 481 (68.6%) |
| 75 Years and over | 524 (100.0%) | 383 (73.1%) |
| Total | 1,838 (23.0%) | 6,910 (86.3%) |
Disability Status by Sex by Age in Camp Hill borough
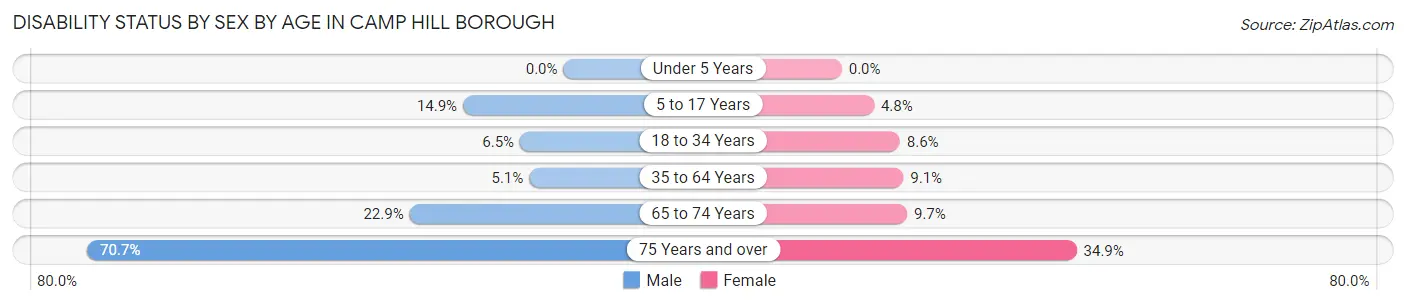
| Age Bracket | Male | Female |
| Under 5 Years | 0 (0.0%) | 0 (0.0%) |
| 5 to 17 Years | 113 (14.9%) | 40 (4.8%) |
| 18 to 34 Years | 45 (6.5%) | 57 (8.6%) |
| 35 to 64 Years | 84 (5.1%) | 160 (9.1%) |
| 65 to 74 Years | 61 (22.9%) | 42 (9.7%) |
| 75 Years and over | 186 (70.7%) | 91 (34.9%) |
Disability Class by Sex by Age in Camp Hill borough
Disability Class: Hearing Difficulty
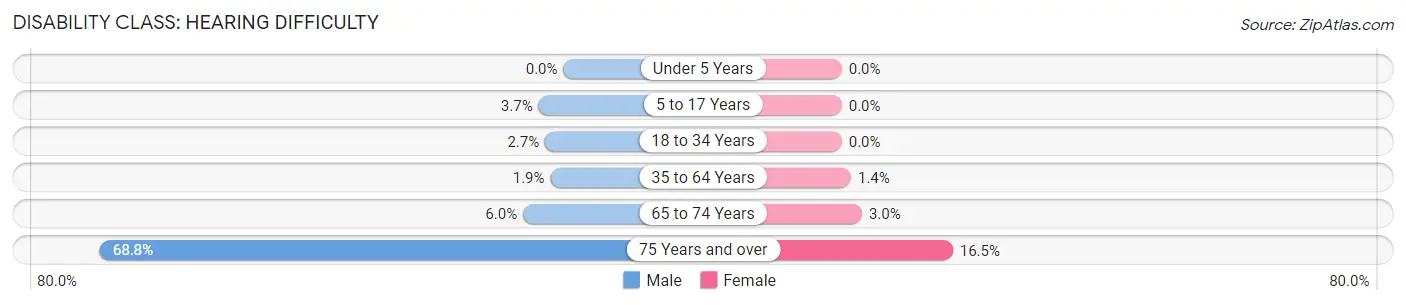
| Age Bracket | Male | Female |
| Under 5 Years | 0 (0.0%) | 0 (0.0%) |
| 5 to 17 Years | 28 (3.7%) | 0 (0.0%) |
| 18 to 34 Years | 19 (2.7%) | 0 (0.0%) |
| 35 to 64 Years | 32 (1.9%) | 24 (1.4%) |
| 65 to 74 Years | 16 (6.0%) | 13 (3.0%) |
| 75 Years and over | 181 (68.8%) | 43 (16.5%) |
Disability Class: Vision Difficulty
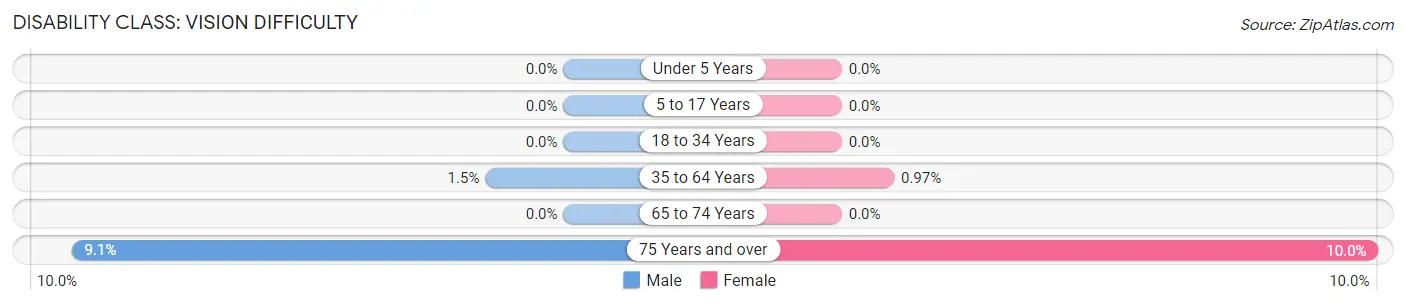
| Age Bracket | Male | Female |
| Under 5 Years | 0 (0.0%) | 0 (0.0%) |
| 5 to 17 Years | 0 (0.0%) | 0 (0.0%) |
| 18 to 34 Years | 0 (0.0%) | 0 (0.0%) |
| 35 to 64 Years | 24 (1.5%) | 17 (1.0%) |
| 65 to 74 Years | 0 (0.0%) | 0 (0.0%) |
| 75 Years and over | 24 (9.1%) | 26 (10.0%) |
Disability Class: Cognitive Difficulty
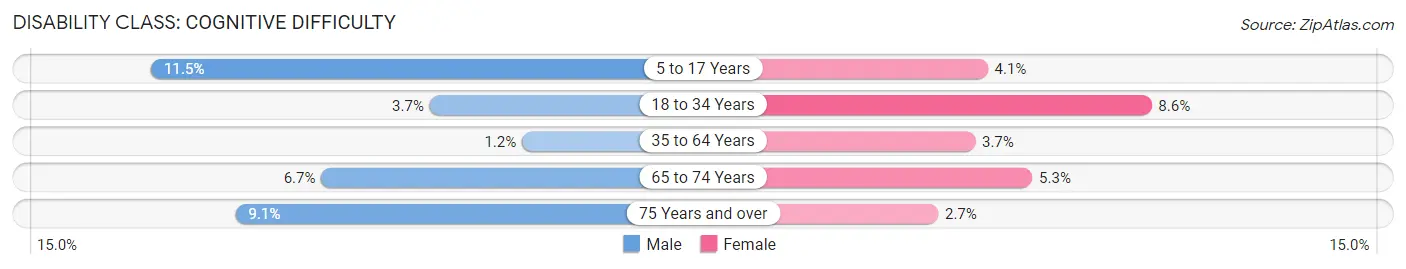
| Age Bracket | Male | Female |
| 5 to 17 Years | 87 (11.5%) | 34 (4.1%) |
| 18 to 34 Years | 26 (3.7%) | 57 (8.6%) |
| 35 to 64 Years | 19 (1.1%) | 65 (3.7%) |
| 65 to 74 Years | 18 (6.7%) | 23 (5.3%) |
| 75 Years and over | 24 (9.1%) | 7 (2.7%) |
Disability Class: Ambulatory Difficulty
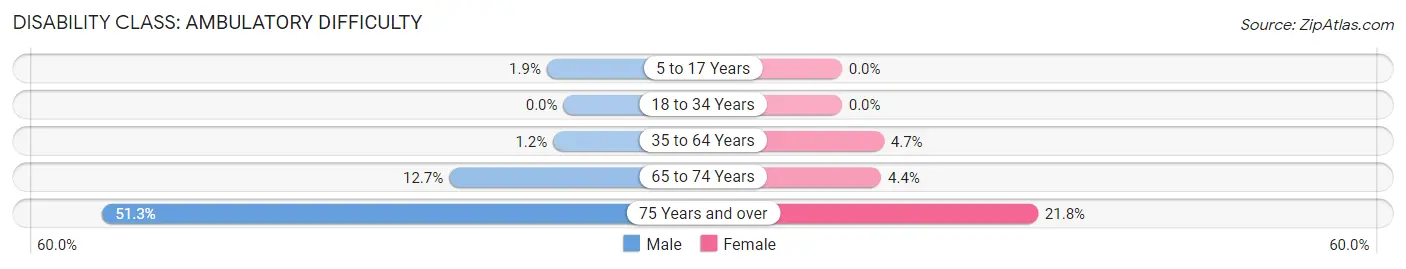
| Age Bracket | Male | Female |
| 5 to 17 Years | 14 (1.8%) | 0 (0.0%) |
| 18 to 34 Years | 0 (0.0%) | 0 (0.0%) |
| 35 to 64 Years | 19 (1.1%) | 82 (4.7%) |
| 65 to 74 Years | 34 (12.7%) | 19 (4.4%) |
| 75 Years and over | 135 (51.3%) | 57 (21.8%) |
Disability Class: Self-Care Difficulty
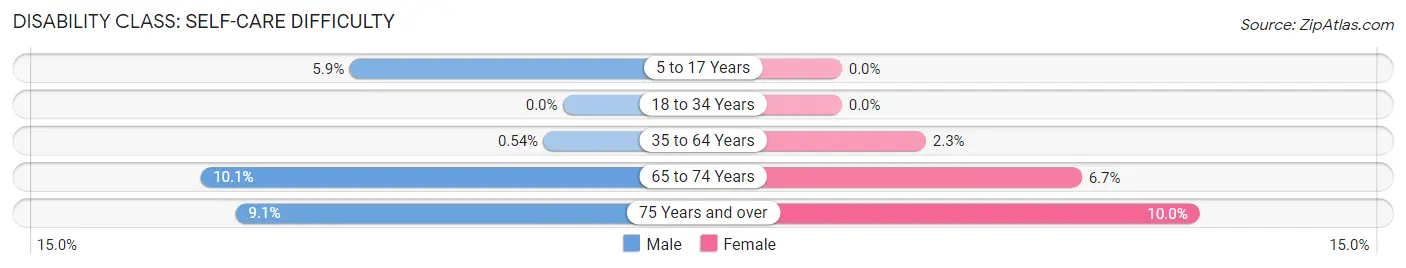
| Age Bracket | Male | Female |
| 5 to 17 Years | 45 (5.9%) | 0 (0.0%) |
| 18 to 34 Years | 0 (0.0%) | 0 (0.0%) |
| 35 to 64 Years | 9 (0.5%) | 41 (2.3%) |
| 65 to 74 Years | 27 (10.1%) | 29 (6.7%) |
| 75 Years and over | 24 (9.1%) | 26 (10.0%) |
Technology Access in Camp Hill borough
Computing Device Access in Camp Hill borough
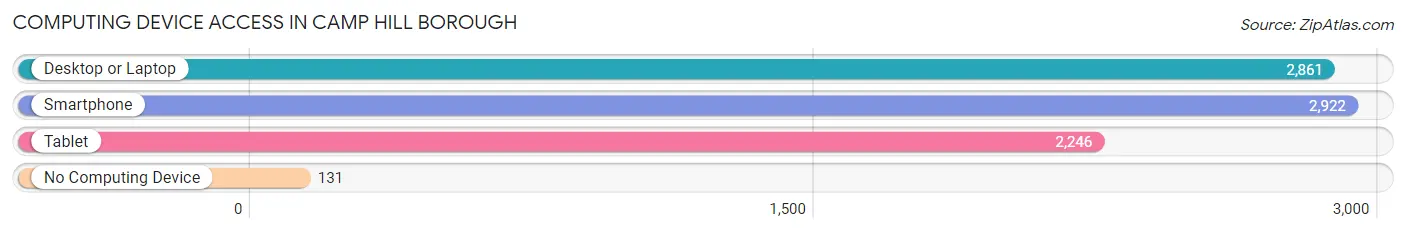
| Device Type | # Households | % Households |
| Desktop or Laptop | 2,861 | 88.2% |
| Smartphone | 2,922 | 90.0% |
| Tablet | 2,246 | 69.2% |
| No Computing Device | 131 | 4.0% |
| Total | 3,245 | 100.0% |
Internet Access in Camp Hill borough
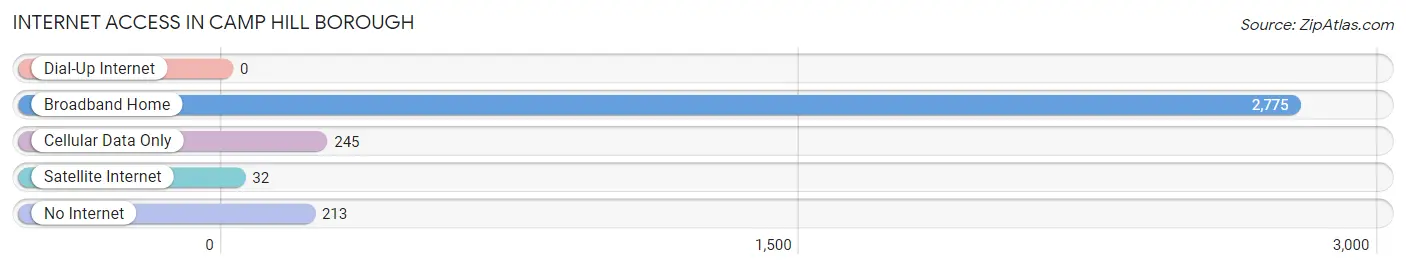
| Internet Type | # Households | % Households |
| Dial-Up Internet | 0 | 0.0% |
| Broadband Home | 2,775 | 85.5% |
| Cellular Data Only | 245 | 7.5% |
| Satellite Internet | 32 | 1.0% |
| No Internet | 213 | 6.6% |
| Total | 3,245 | 100.0% |
Camp Hill borough Summary
Introduction
Camp Hill Borough is a borough located in Cumberland County, Pennsylvania. It is a suburb of the state capital, Harrisburg, and is located just east of the city. The borough has a population of 7,888 as of the 2010 census. It is part of the Harrisburg-Carlisle Metropolitan Statistical Area.
History
Camp Hill was first settled in 1750 by a group of German immigrants. The town was originally known as “Kamp Hill”, which is German for “Camp Hill”. The town was officially incorporated in 1814.
In the late 19th century, Camp Hill was a popular summer resort for wealthy Harrisburg residents. The town was known for its mineral springs, which were believed to have healing properties. The town also had several hotels and resorts, as well as a racetrack.
In the early 20th century, Camp Hill began to transition from a resort town to a residential community. The town was annexed by the city of Harrisburg in 1921, but was later reincorporated as a borough in 1945.
Geography
Camp Hill is located in Cumberland County, Pennsylvania. It is situated on the east side of the Susquehanna River, just east of the city of Harrisburg. The borough has a total area of 2.2 square miles, all of which is land.
The borough is located in the Ridge and Valley physiographic province, which is characterized by long, narrow ridges and valleys. The borough is located on the Cumberland Valley Ridge, which is part of the Appalachian Mountains.
Economy
Camp Hill is primarily a residential community, but it does have a few businesses. The largest employer in the borough is the Giant Food Store, which is located in the Camp Hill Shopping Center. Other businesses in the borough include a variety of restaurants, retail stores, and professional services.
Demographics
As of the 2010 census, the population of Camp Hill was 7,888. The racial makeup of the borough was 94.3% White, 2.2% African American, 0.3% Native American, 1.2% Asian, 0.1% Pacific Islander, 0.7% from other races, and 1.3% from two or more races. Hispanic or Latino of any race were 2.2% of the population.
The median household income in Camp Hill was $60,945, and the median family income was $71,917. The per capita income was $30,945. About 4.2% of families and 5.3% of the population were below the poverty line.
Conclusion
Camp Hill is a borough located in Cumberland County, Pennsylvania. It is a suburb of the state capital, Harrisburg, and is located just east of the city. The borough has a population of 7,888 as of the 2010 census. It is part of the Harrisburg-Carlisle Metropolitan Statistical Area. Camp Hill was first settled in 1750 by a group of German immigrants, and was officially incorporated in 1814. The borough is primarily a residential community, but it does have a few businesses. The largest employer in the borough is the Giant Food Store. The racial makeup of the borough was 94.3% White, 2.2% African American, 0.3% Native American, 1.2% Asian, 0.1% Pacific Islander, 0.7% from other races, and 1.3% from two or more races. The median household income in Camp Hill was $60,945, and the median family income was $71,917.
Common Questions
What is Per Capita Income in Camp Hill borough?
Per Capita income in Camp Hill borough is $48,752.
What is the Median Family Income in Camp Hill borough?
Median Family Income in Camp Hill borough is $128,259.
What is the Median Household income in Camp Hill borough?
Median Household Income in Camp Hill borough is $104,959.
What is Income or Wage Gap in Camp Hill borough?
Income or Wage Gap in Camp Hill borough is 32.2%.
Women in Camp Hill borough earn 67.8 cents for every dollar earned by a man.
What is Inequality or Gini Index in Camp Hill borough?
Inequality or Gini Index in Camp Hill borough is 0.36.
What is the Total Population of Camp Hill borough?
Total Population of Camp Hill borough is 8,133.
What is the Total Male Population of Camp Hill borough?
Total Male Population of Camp Hill borough is 3,823.
What is the Total Female Population of Camp Hill borough?
Total Female Population of Camp Hill borough is 4,310.
What is the Ratio of Males per 100 Females in Camp Hill borough?
There are 88.70 Males per 100 Females in Camp Hill borough.
What is the Ratio of Females per 100 Males in Camp Hill borough?
There are 112.74 Females per 100 Males in Camp Hill borough.
What is the Median Population Age in Camp Hill borough?
Median Population Age in Camp Hill borough is 42.5 Years.
What is the Average Family Size in Camp Hill borough
Average Family Size in Camp Hill borough is 3.1 People.
What is the Average Household Size in Camp Hill borough
Average Household Size in Camp Hill borough is 2.5 People.
How Large is the Labor Force in Camp Hill borough?
There are 4,576 People in the Labor Forcein in Camp Hill borough.
What is the Percentage of People in the Labor Force in Camp Hill borough?
70.7% of People are in the Labor Force in Camp Hill borough.
What is the Unemployment Rate in Camp Hill borough?
Unemployment Rate in Camp Hill borough is 2.6%.