Mifflinville, PA Map & Demographics
Mifflinville Map
Mifflinville Overview
$30,647
PER CAPITA INCOME
$80,441
AVG FAMILY INCOME
$52,153
AVG HOUSEHOLD INCOME
8.5%
WAGE / INCOME GAP [ % ]
91.5¢/ $1
WAGE / INCOME GAP [ $ ]
0.44
INEQUALITY / GINI INDEX
1,204
TOTAL POPULATION
651
MALE POPULATION
553
FEMALE POPULATION
117.72
MALES / 100 FEMALES
84.95
FEMALES / 100 MALES
46.7
MEDIAN AGE
3.1
AVG FAMILY SIZE
2.3
AVG HOUSEHOLD SIZE
629
LABOR FORCE [ PEOPLE ]
61.1%
PERCENT IN LABOR FORCE
Mifflinville Zip Codes
Mifflinville Area Codes
Income in Mifflinville
Income Overview in Mifflinville
Per Capita Income in Mifflinville is $30,647, while median incomes of families and households are $80,441 and $52,153 respectively.
| Characteristic | Number | Measure |
| Per Capita Income | 1,204 | $30,647 |
| Median Family Income | 292 | $80,441 |
| Mean Family Income | 292 | $91,373 |
| Median Household Income | 528 | $52,153 |
| Mean Household Income | 528 | $65,502 |
| Income Deficit | 292 | $0 |
| Wage / Income Gap (%) | 1,204 | 8.55% |
| Wage / Income Gap ($) | 1,204 | 91.45¢ per $1 |
| Gini / Inequality Index | 1,204 | 0.44 |
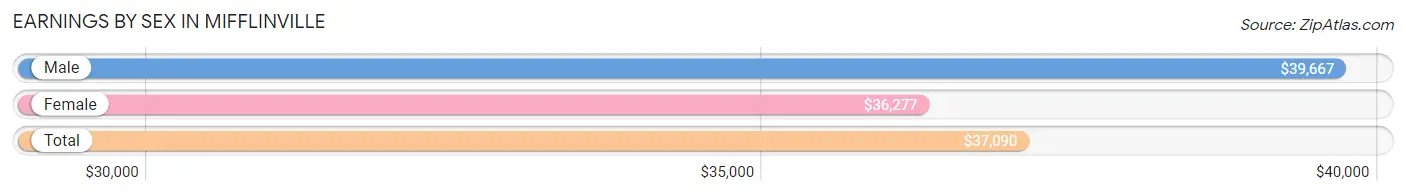
Earnings by Sex in Mifflinville
Average Earnings in Mifflinville are $37,090, $39,667 for men and $36,277 for women, a difference of 8.6%.
| Sex | Number | Average Earnings |
| Male | 388 (60.1%) | $39,667 |
| Female | 258 (39.9%) | $36,277 |
| Total | 646 (100.0%) | $37,090 |
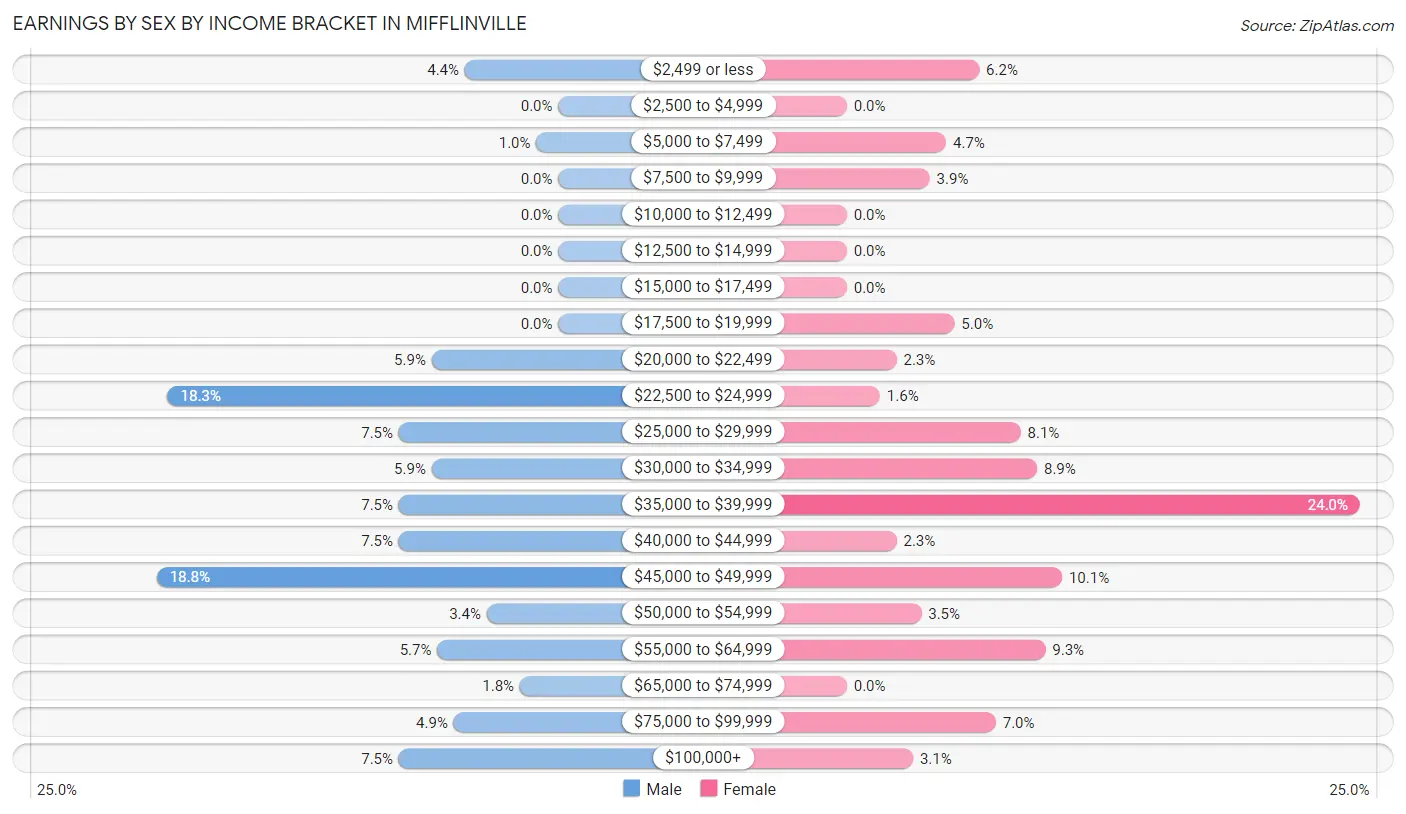
Earnings by Sex by Income Bracket in Mifflinville
The most common earnings brackets in Mifflinville are $45,000 to $49,999 for men (73 | 18.8%) and $35,000 to $39,999 for women (62 | 24.0%).
| Income | Male | Female |
| $2,499 or less | 17 (4.4%) | 16 (6.2%) |
| $2,500 to $4,999 | 0 (0.0%) | 0 (0.0%) |
| $5,000 to $7,499 | 4 (1.0%) | 12 (4.6%) |
| $7,500 to $9,999 | 0 (0.0%) | 10 (3.9%) |
| $10,000 to $12,499 | 0 (0.0%) | 0 (0.0%) |
| $12,500 to $14,999 | 0 (0.0%) | 0 (0.0%) |
| $15,000 to $17,499 | 0 (0.0%) | 0 (0.0%) |
| $17,500 to $19,999 | 0 (0.0%) | 13 (5.0%) |
| $20,000 to $22,499 | 23 (5.9%) | 6 (2.3%) |
| $22,500 to $24,999 | 71 (18.3%) | 4 (1.5%) |
| $25,000 to $29,999 | 29 (7.5%) | 21 (8.1%) |
| $30,000 to $34,999 | 23 (5.9%) | 23 (8.9%) |
| $35,000 to $39,999 | 29 (7.5%) | 62 (24.0%) |
| $40,000 to $44,999 | 29 (7.5%) | 6 (2.3%) |
| $45,000 to $49,999 | 73 (18.8%) | 26 (10.1%) |
| $50,000 to $54,999 | 13 (3.4%) | 9 (3.5%) |
| $55,000 to $64,999 | 22 (5.7%) | 24 (9.3%) |
| $65,000 to $74,999 | 7 (1.8%) | 0 (0.0%) |
| $75,000 to $99,999 | 19 (4.9%) | 18 (7.0%) |
| $100,000+ | 29 (7.5%) | 8 (3.1%) |
| Total | 388 (100.0%) | 258 (100.0%) |
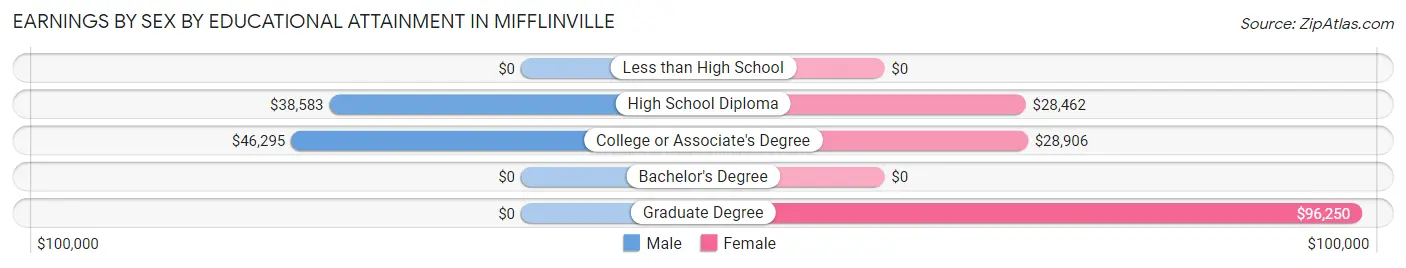
Earnings by Sex by Educational Attainment in Mifflinville
Average earnings in Mifflinville are $40,966 for men and $34,659 for women, a difference of 15.4%. Men with an educational attainment of college or associate's degree enjoy the highest average annual earnings of $46,295, while those with high school diploma education earn the least with $38,583. Women with an educational attainment of graduate degree earn the most with the average annual earnings of $96,250, while those with high school diploma education have the smallest earnings of $28,462.
| Educational Attainment | Male Income | Female Income |
| Less than High School | - | - |
| High School Diploma | $38,583 | $28,462 |
| College or Associate's Degree | $46,295 | $28,906 |
| Bachelor's Degree | - | - |
| Graduate Degree | - | - |
| Total | $40,966 | $34,659 |
Family Income in Mifflinville
Family Income Brackets in Mifflinville
According to the Mifflinville family income data, there are 112 families falling into the $50,000 to $74,999 income range, which is the most common income bracket and makes up 38.4% of all families.
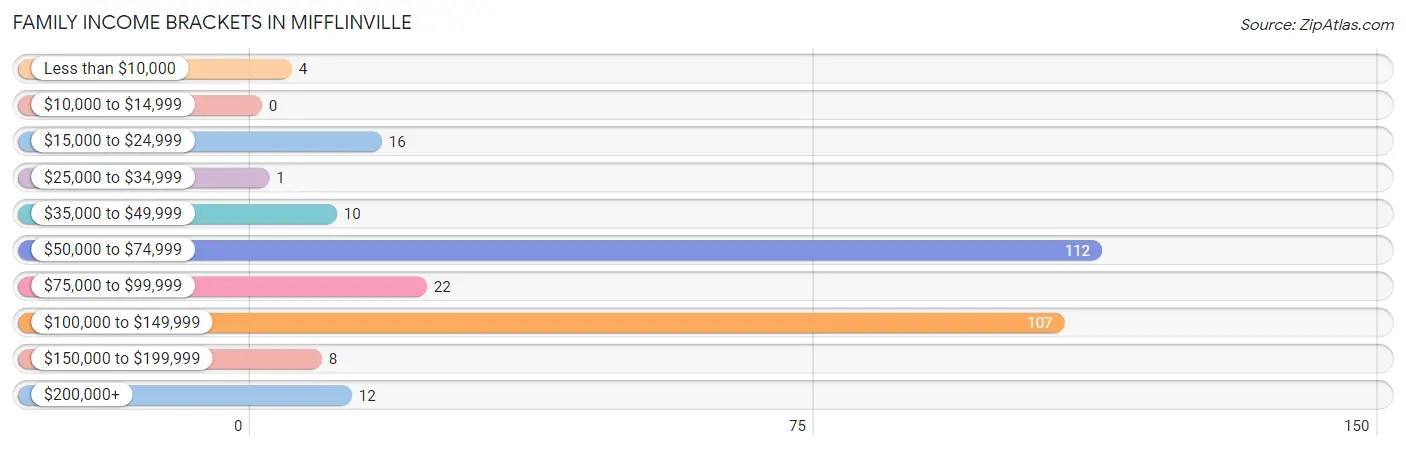
| Income Bracket | # Families | % Families |
| Less than $10,000 | 4 | 1.4% |
| $10,000 to $14,999 | 0 | 0.0% |
| $15,000 to $24,999 | 16 | 5.5% |
| $25,000 to $34,999 | 1 | 0.3% |
| $35,000 to $49,999 | 10 | 3.4% |
| $50,000 to $74,999 | 112 | 38.4% |
| $75,000 to $99,999 | 22 | 7.5% |
| $100,000 to $149,999 | 107 | 36.6% |
| $150,000 to $199,999 | 8 | 2.7% |
| $200,000+ | 12 | 4.1% |
Family Income by Famaliy Size in Mifflinville
4-person families (45 | 15.4%) account for the highest median family income in Mifflinville with $132,604 per family, while 4-person families (45 | 15.4%) have the highest median income of $33,151 per family member.
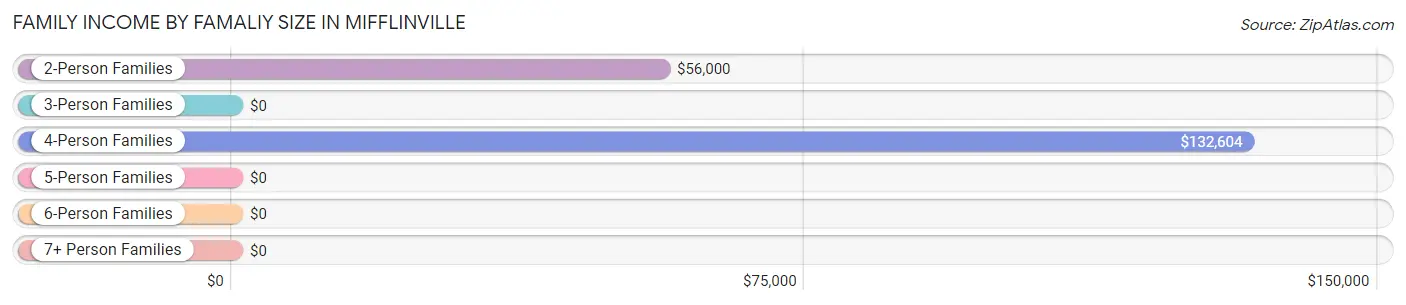
| Income Bracket | # Families | Median Income |
| 2-Person Families | 142 (48.6%) | $56,000 |
| 3-Person Families | 82 (28.1%) | $0 |
| 4-Person Families | 45 (15.4%) | $132,604 |
| 5-Person Families | 8 (2.7%) | $0 |
| 6-Person Families | 15 (5.1%) | $0 |
| 7+ Person Families | 0 (0.0%) | $0 |
| Total | 292 (100.0%) | $80,441 |
Family Income by Number of Earners in Mifflinville
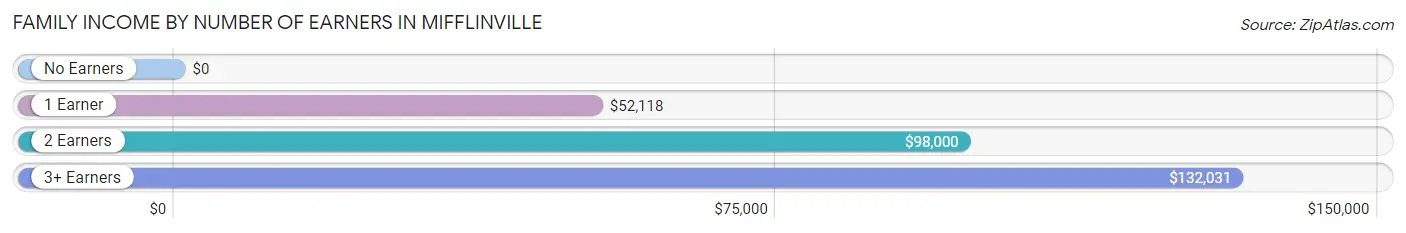
| Number of Earners | # Families | Median Income |
| No Earners | 56 (19.2%) | $0 |
| 1 Earner | 69 (23.6%) | $52,118 |
| 2 Earners | 122 (41.8%) | $98,000 |
| 3+ Earners | 45 (15.4%) | $132,031 |
| Total | 292 (100.0%) | $80,441 |
Household Income in Mifflinville
Household Income Brackets in Mifflinville
With 129 households falling in the category, the $100,000 to $149,999 income range is the most frequent in Mifflinville, accounting for 24.4% of all households. In contrast, only 8 households (1.5%) fall into the $150,000 to $199,999 income bracket, making it the least populous group.
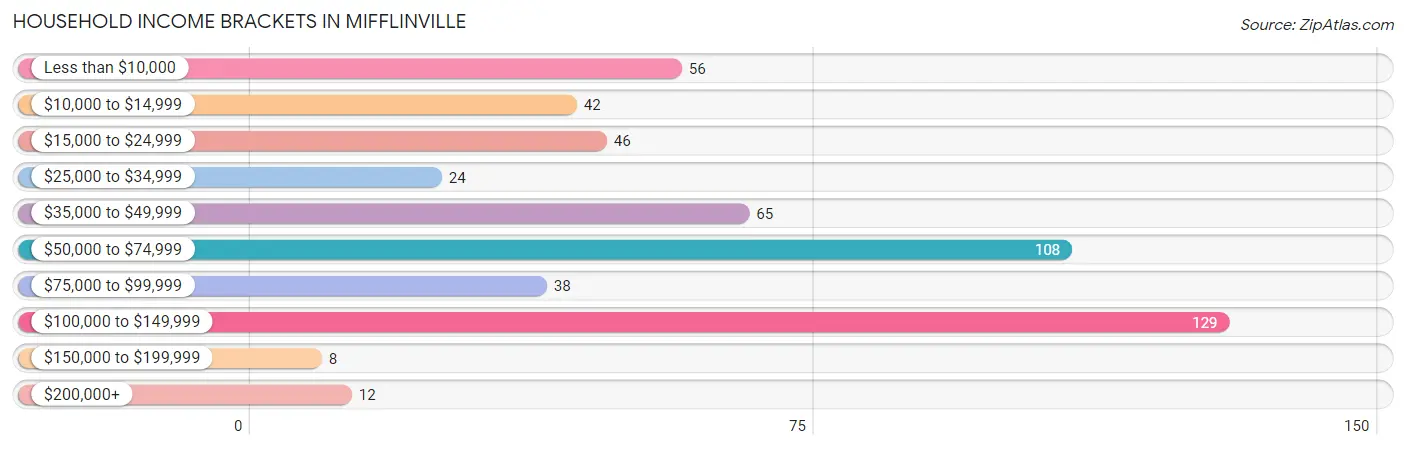
| Income Bracket | # Households | % Households |
| Less than $10,000 | 56 | 10.6% |
| $10,000 to $14,999 | 42 | 8.0% |
| $15,000 to $24,999 | 46 | 8.7% |
| $25,000 to $34,999 | 24 | 4.5% |
| $35,000 to $49,999 | 65 | 12.3% |
| $50,000 to $74,999 | 108 | 20.5% |
| $75,000 to $99,999 | 38 | 7.2% |
| $100,000 to $149,999 | 129 | 24.4% |
| $150,000 to $199,999 | 8 | 1.5% |
| $200,000+ | 12 | 2.3% |
Household Income by Householder Age in Mifflinville
The median household income in Mifflinville is $52,153, with the highest median household income of $111,500 found in the 25 to 44 years age bracket for the primary householder. A total of 106 households (20.1%) fall into this category.
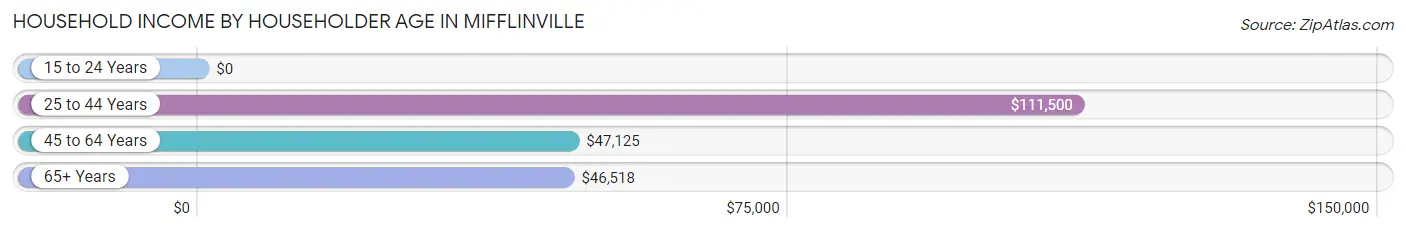
| Income Bracket | # Households | Median Income |
| 15 to 24 Years | 0 (0.0%) | $0 |
| 25 to 44 Years | 106 (20.1%) | $111,500 |
| 45 to 64 Years | 251 (47.5%) | $47,125 |
| 65+ Years | 171 (32.4%) | $46,518 |
| Total | 528 (100.0%) | $52,153 |
Poverty in Mifflinville
Income Below Poverty by Sex and Age in Mifflinville
With 7.4% poverty level for males and 13.0% for females among the residents of Mifflinville, 45 to 54 year old males and 65 to 74 year old females are the most vulnerable to poverty, with 48 males (47.5%) and 35 females (47.9%) in their respective age groups living below the poverty level.
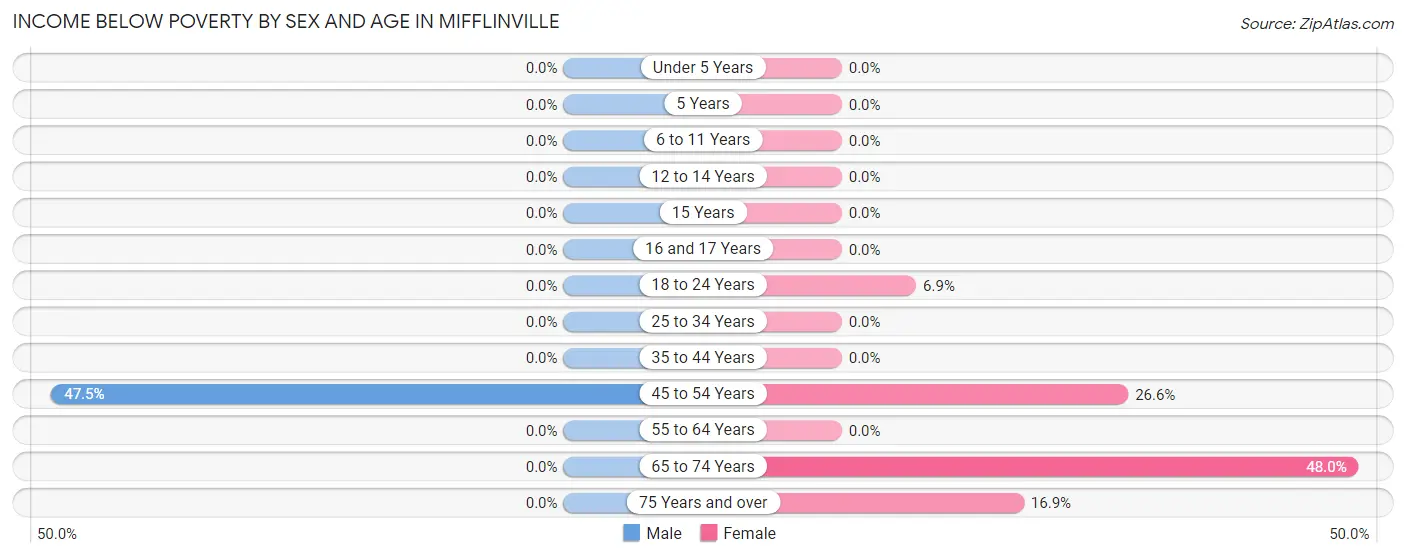
| Age Bracket | Male | Female |
| Under 5 Years | 0 (0.0%) | 0 (0.0%) |
| 5 Years | 0 (0.0%) | 0 (0.0%) |
| 6 to 11 Years | 0 (0.0%) | 0 (0.0%) |
| 12 to 14 Years | 0 (0.0%) | 0 (0.0%) |
| 15 Years | 0 (0.0%) | 0 (0.0%) |
| 16 and 17 Years | 0 (0.0%) | 0 (0.0%) |
| 18 to 24 Years | 0 (0.0%) | 4 (6.9%) |
| 25 to 34 Years | 0 (0.0%) | 0 (0.0%) |
| 35 to 44 Years | 0 (0.0%) | 0 (0.0%) |
| 45 to 54 Years | 48 (47.5%) | 21 (26.6%) |
| 55 to 64 Years | 0 (0.0%) | 0 (0.0%) |
| 65 to 74 Years | 0 (0.0%) | 35 (47.9%) |
| 75 Years and over | 0 (0.0%) | 12 (16.9%) |
| Total | 48 (7.4%) | 72 (13.0%) |
Income Above Poverty by Sex and Age in Mifflinville
According to the poverty statistics in Mifflinville, males aged under 5 years and females aged under 5 years are the age groups that are most secure financially, with 100.0% of males and 100.0% of females in these age groups living above the poverty line.
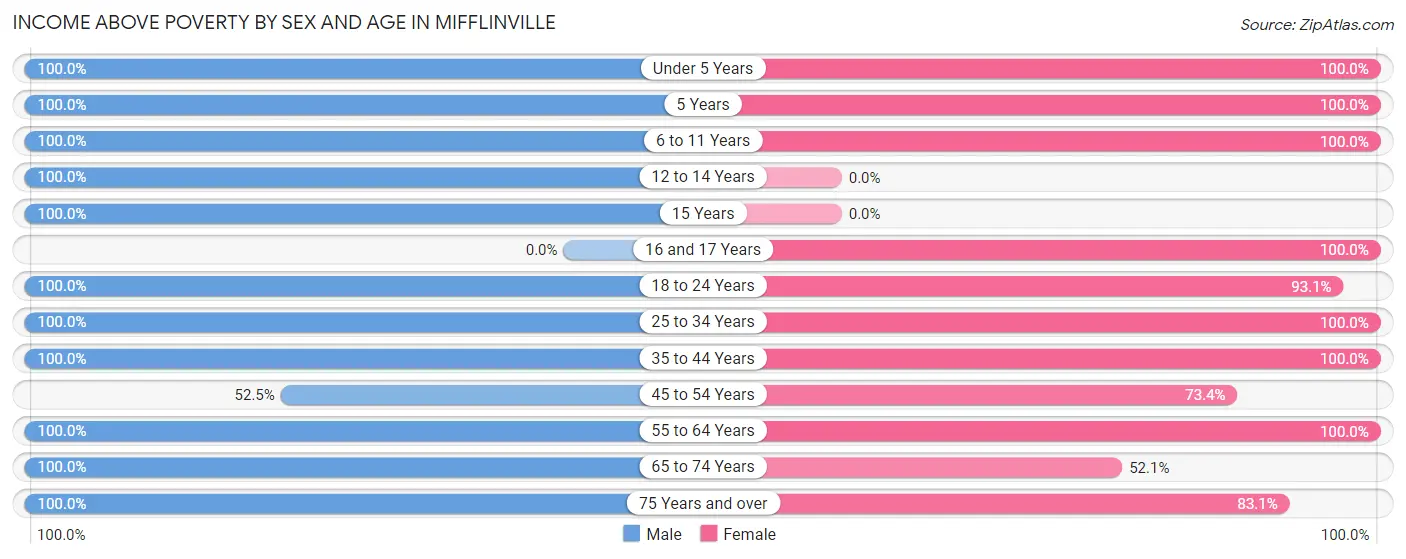
| Age Bracket | Male | Female |
| Under 5 Years | 25 (100.0%) | 16 (100.0%) |
| 5 Years | 16 (100.0%) | 7 (100.0%) |
| 6 to 11 Years | 47 (100.0%) | 38 (100.0%) |
| 12 to 14 Years | 12 (100.0%) | 0 (0.0%) |
| 15 Years | 14 (100.0%) | 0 (0.0%) |
| 16 and 17 Years | 0 (0.0%) | 21 (100.0%) |
| 18 to 24 Years | 39 (100.0%) | 54 (93.1%) |
| 25 to 34 Years | 89 (100.0%) | 65 (100.0%) |
| 35 to 44 Years | 114 (100.0%) | 1 (100.0%) |
| 45 to 54 Years | 53 (52.5%) | 58 (73.4%) |
| 55 to 64 Years | 107 (100.0%) | 124 (100.0%) |
| 65 to 74 Years | 66 (100.0%) | 38 (52.0%) |
| 75 Years and over | 21 (100.0%) | 59 (83.1%) |
| Total | 603 (92.6%) | 481 (87.0%) |
Income Below Poverty Among Married-Couple Families in Mifflinville
The poverty statistics for married-couple families in Mifflinville show that 1.8% or 4 of the total 227 families live below the poverty line. Families with no children have the highest poverty rate of 2.4%, comprising of 4 families. On the other hand, families with 1 or 2 children have the lowest poverty rate of 0.0%, which includes 0 families.
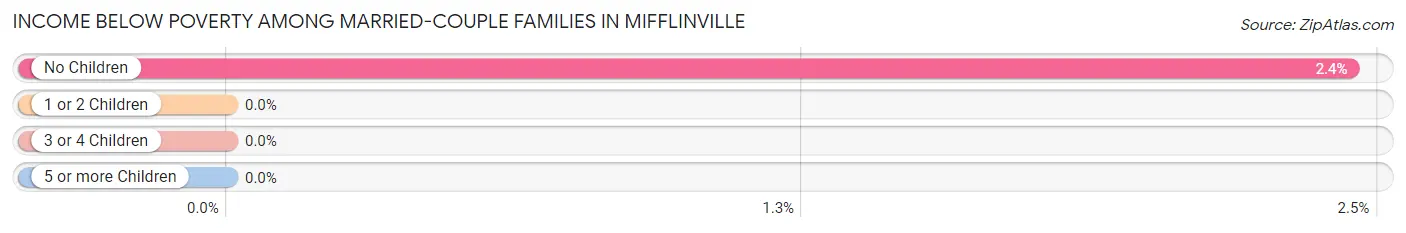
| Children | Above Poverty | Below Poverty |
| No Children | 160 (97.6%) | 4 (2.4%) |
| 1 or 2 Children | 40 (100.0%) | 0 (0.0%) |
| 3 or 4 Children | 23 (100.0%) | 0 (0.0%) |
| 5 or more Children | 0 (0.0%) | 0 (0.0%) |
| Total | 223 (98.2%) | 4 (1.8%) |
Income Below Poverty Among Single-Parent Households in Mifflinville
| Children | Single Father | Single Mother |
| No Children | 0 (0.0%) | 0 (0.0%) |
| 1 or 2 Children | 0 (0.0%) | 0 (0.0%) |
| 3 or 4 Children | 0 (0.0%) | 0 (0.0%) |
| 5 or more Children | 0 (0.0%) | 0 (0.0%) |
| Total | 0 (0.0%) | 0 (0.0%) |
Income Below Poverty Among Married-Couple vs Single-Parent Households in Mifflinville
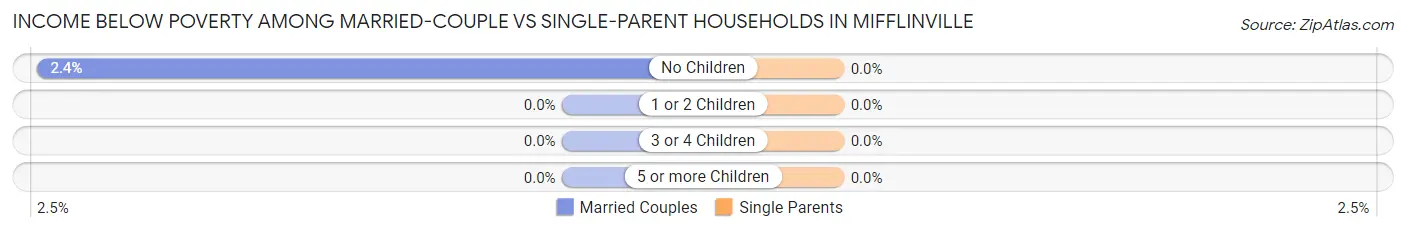
| Children | Married-Couple Families | Single-Parent Households |
| No Children | 4 (2.4%) | 0 (0.0%) |
| 1 or 2 Children | 0 (0.0%) | 0 (0.0%) |
| 3 or 4 Children | 0 (0.0%) | 0 (0.0%) |
| 5 or more Children | 0 (0.0%) | 0 (0.0%) |
| Total | 4 (1.8%) | 0 (0.0%) |
Race in Mifflinville
The most populous races in Mifflinville are White / Caucasian (1,183 | 98.3%), Black / African American (17 | 1.4%), and Hispanic or Latino (16 | 1.3%).
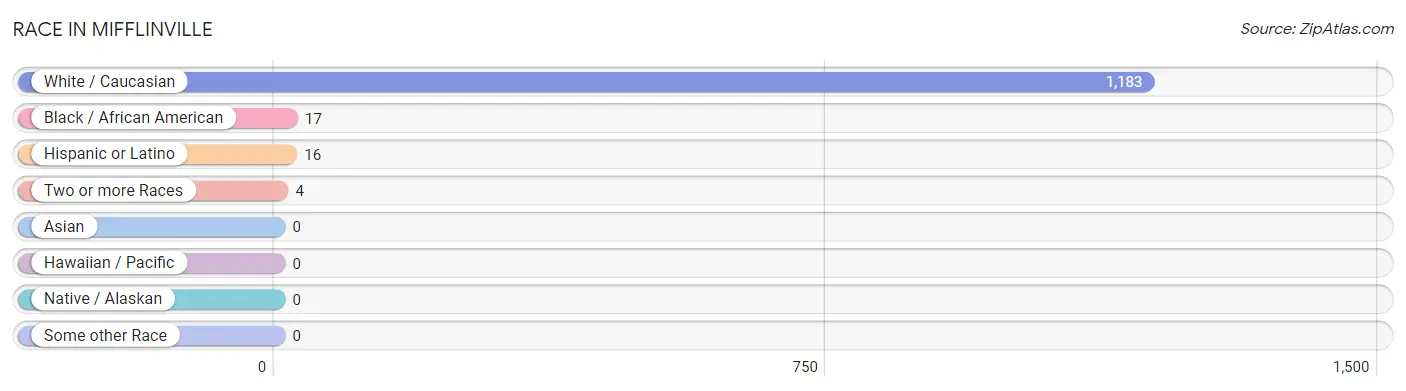
| Race | # Population | % Population |
| Asian | 0 | 0.0% |
| Black / African American | 17 | 1.4% |
| Hawaiian / Pacific | 0 | 0.0% |
| Hispanic or Latino | 16 | 1.3% |
| Native / Alaskan | 0 | 0.0% |
| White / Caucasian | 1,183 | 98.3% |
| Two or more Races | 4 | 0.3% |
| Some other Race | 0 | 0.0% |
| Total | 1,204 | 100.0% |
Ancestry in Mifflinville
The most populous ancestries reported in Mifflinville are English (378 | 31.4%), German (256 | 21.3%), Italian (156 | 13.0%), Irish (104 | 8.6%), and French (72 | 6.0%), together accounting for 80.2% of all Mifflinville residents.
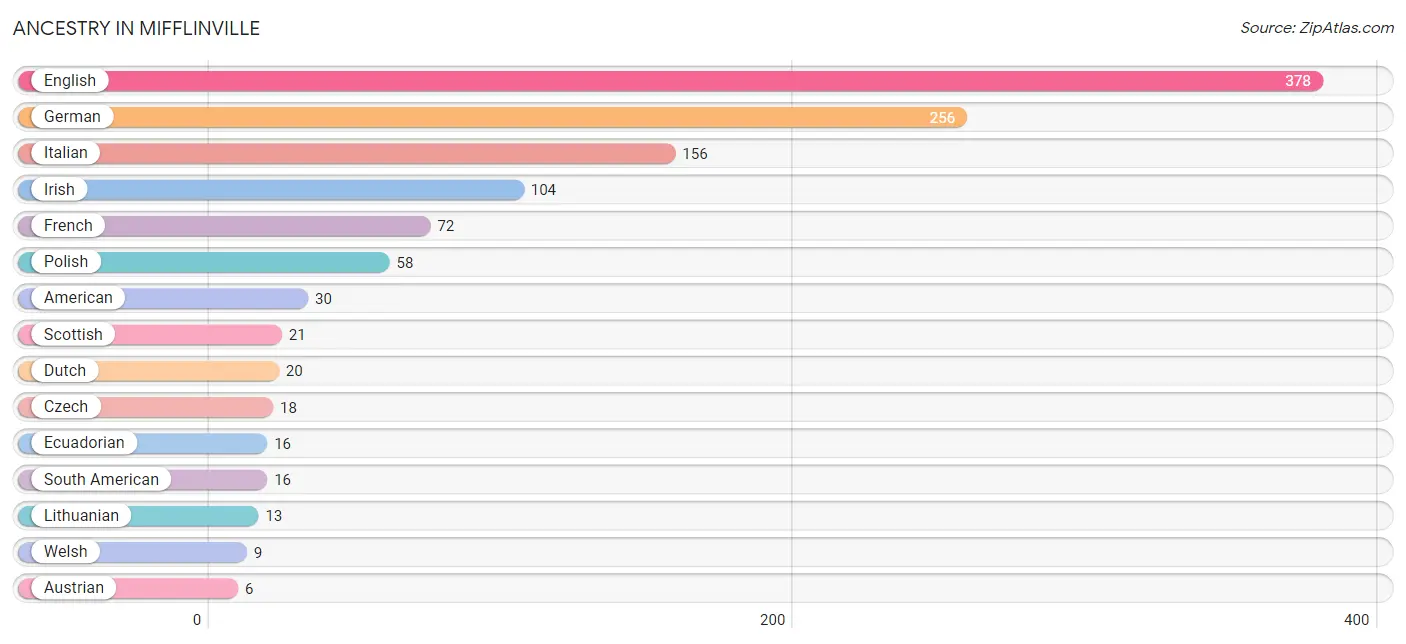
| Ancestry | # Population | % Population |
| American | 30 | 2.5% |
| Austrian | 6 | 0.5% |
| Cherokee | 4 | 0.3% |
| Czech | 18 | 1.5% |
| Dutch | 20 | 1.7% |
| Ecuadorian | 16 | 1.3% |
| English | 378 | 31.4% |
| French | 72 | 6.0% |
| German | 256 | 21.3% |
| Irish | 104 | 8.6% |
| Italian | 156 | 13.0% |
| Lithuanian | 13 | 1.1% |
| Polish | 58 | 4.8% |
| Scottish | 21 | 1.7% |
| South American | 16 | 1.3% |
| Welsh | 9 | 0.7% | View All 16 Rows |
Immigrants in Mifflinville
The most numerous immigrant groups reported in Mifflinville came from Ecuador (16 | 1.3%), Latin America (16 | 1.3%), and South America (16 | 1.3%), together accounting for 4.0% of all Mifflinville residents.
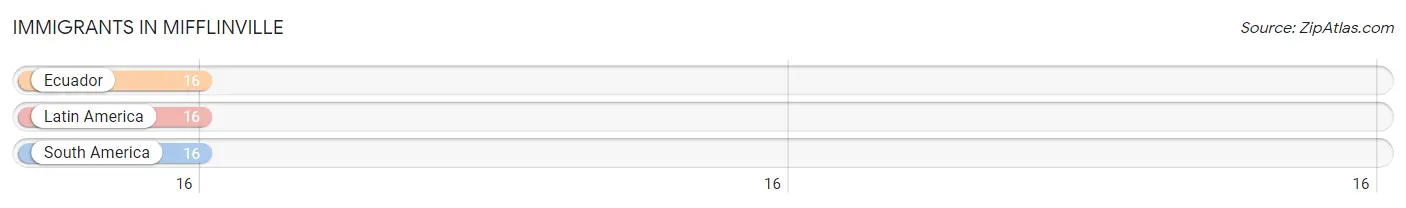
| Immigration Origin | # Population | % Population |
| Ecuador | 16 | 1.3% |
| Latin America | 16 | 1.3% |
| South America | 16 | 1.3% | View All 3 Rows |
Sex and Age in Mifflinville
Sex and Age in Mifflinville
The most populous age groups in Mifflinville are 35 to 39 Years (88 | 13.5%) for men and 60 to 64 Years (88 | 15.9%) for women.
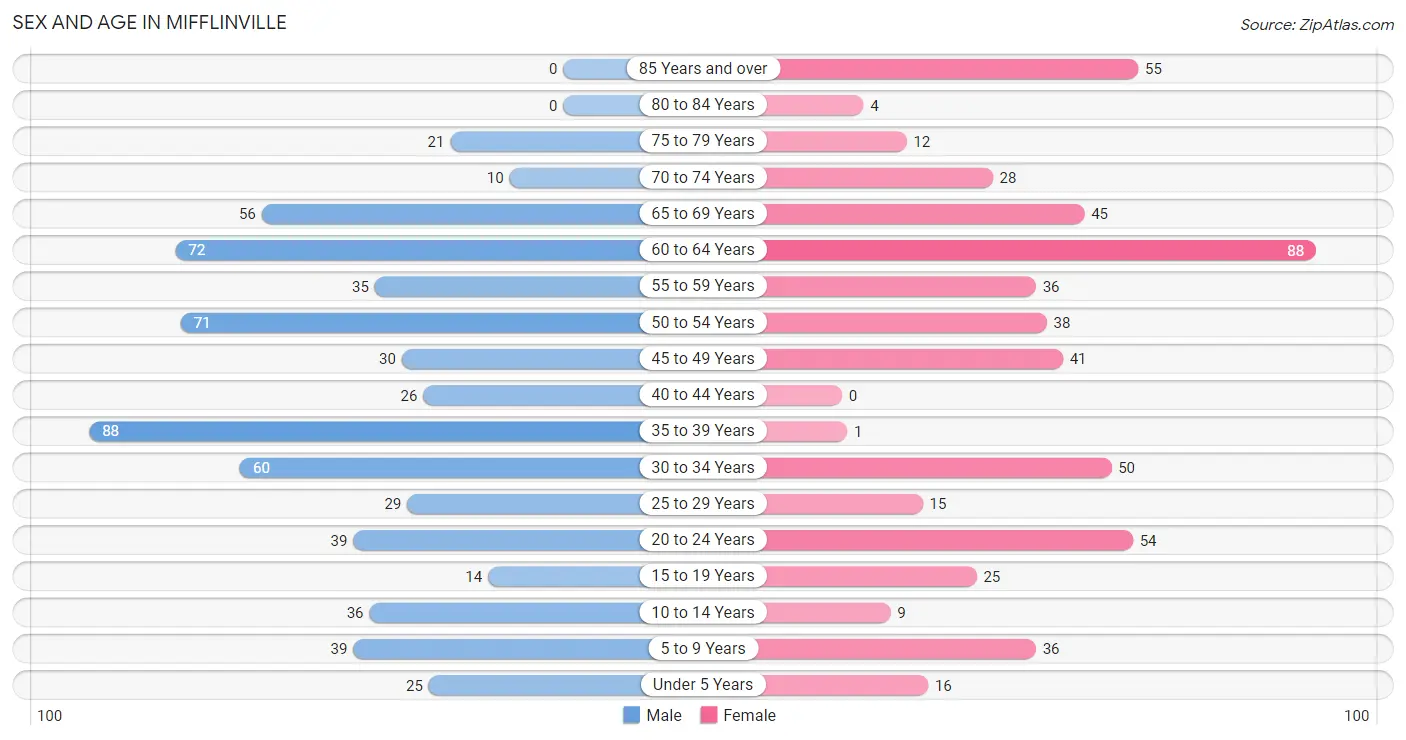
| Age Bracket | Male | Female |
| Under 5 Years | 25 (3.8%) | 16 (2.9%) |
| 5 to 9 Years | 39 (6.0%) | 36 (6.5%) |
| 10 to 14 Years | 36 (5.5%) | 9 (1.6%) |
| 15 to 19 Years | 14 (2.1%) | 25 (4.5%) |
| 20 to 24 Years | 39 (6.0%) | 54 (9.8%) |
| 25 to 29 Years | 29 (4.4%) | 15 (2.7%) |
| 30 to 34 Years | 60 (9.2%) | 50 (9.0%) |
| 35 to 39 Years | 88 (13.5%) | 1 (0.2%) |
| 40 to 44 Years | 26 (4.0%) | 0 (0.0%) |
| 45 to 49 Years | 30 (4.6%) | 41 (7.4%) |
| 50 to 54 Years | 71 (10.9%) | 38 (6.9%) |
| 55 to 59 Years | 35 (5.4%) | 36 (6.5%) |
| 60 to 64 Years | 72 (11.1%) | 88 (15.9%) |
| 65 to 69 Years | 56 (8.6%) | 45 (8.1%) |
| 70 to 74 Years | 10 (1.5%) | 28 (5.1%) |
| 75 to 79 Years | 21 (3.2%) | 12 (2.2%) |
| 80 to 84 Years | 0 (0.0%) | 4 (0.7%) |
| 85 Years and over | 0 (0.0%) | 55 (10.0%) |
| Total | 651 (100.0%) | 553 (100.0%) |
Families and Households in Mifflinville
Median Family Size in Mifflinville
The median family size in Mifflinville is 3.11 persons per family, with single female/mother families (44 | 15.1%) accounting for the largest median family size of 3.16 persons per family. On the other hand, single male/father families (21 | 7.2%) represent the smallest median family size with 2.71 persons per family.
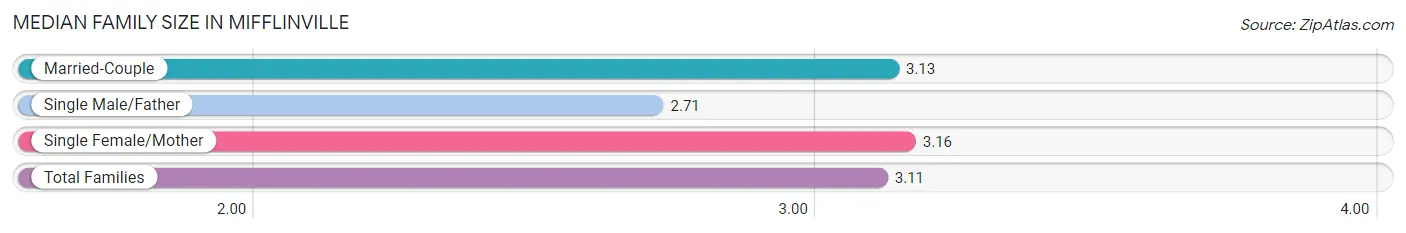
| Family Type | # Families | Family Size |
| Married-Couple | 227 (77.7%) | 3.13 |
| Single Male/Father | 21 (7.2%) | 2.71 |
| Single Female/Mother | 44 (15.1%) | 3.16 |
| Total Families | 292 (100.0%) | 3.11 |
Median Household Size in Mifflinville
The median household size in Mifflinville is 2.28 persons per household, with single female/mother households (44 | 8.3%) accounting for the largest median household size of 3.34 persons per household. non-family households (236 | 44.7%) represent the smallest median household size with 1.22 persons per household.
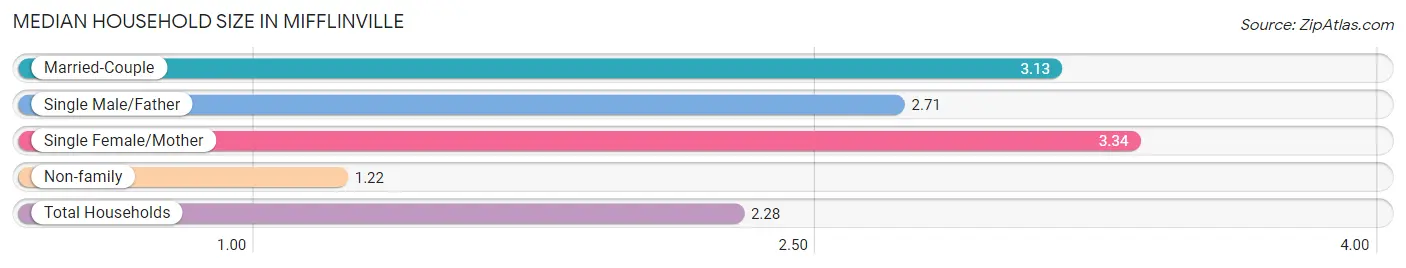
| Household Type | # Households | Household Size |
| Married-Couple | 227 (43.0%) | 3.13 |
| Single Male/Father | 21 (4.0%) | 2.71 |
| Single Female/Mother | 44 (8.3%) | 3.34 |
| Non-family | 236 (44.7%) | 1.22 |
| Total Households | 528 (100.0%) | 2.28 |
Household Size by Marriage Status in Mifflinville
Out of a total of 528 households in Mifflinville, 292 (55.3%) are family households, while 236 (44.7%) are nonfamily households. The most numerous type of family households are 2-person households, comprising 142, and the most common type of nonfamily households are 1-person households, comprising 187.
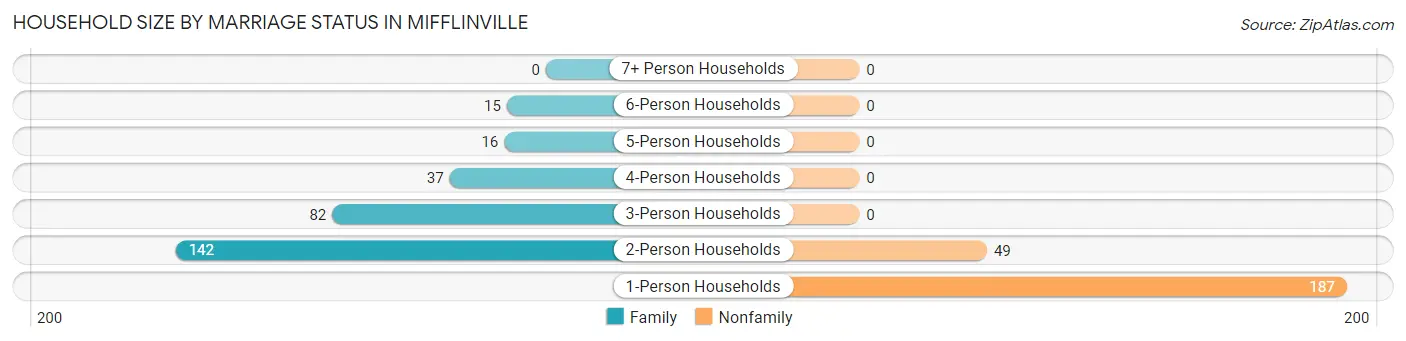
| Household Size | Family Households | Nonfamily Households |
| 1-Person Households | - | 187 (35.4%) |
| 2-Person Households | 142 (26.9%) | 49 (9.3%) |
| 3-Person Households | 82 (15.5%) | 0 (0.0%) |
| 4-Person Households | 37 (7.0%) | 0 (0.0%) |
| 5-Person Households | 16 (3.0%) | 0 (0.0%) |
| 6-Person Households | 15 (2.8%) | 0 (0.0%) |
| 7+ Person Households | 0 (0.0%) | 0 (0.0%) |
| Total | 292 (55.3%) | 236 (44.7%) |
Female Fertility in Mifflinville
Fertility by Age in Mifflinville
Average fertility rate in Mifflinville is 108.0 births per 1,000 women. Women in the age bracket of 20 to 34 years have the highest fertility rate with 168.0 births per 1,000 women. Women in the age bracket of 20 to 34 years acount for 100.0% of all women with births.
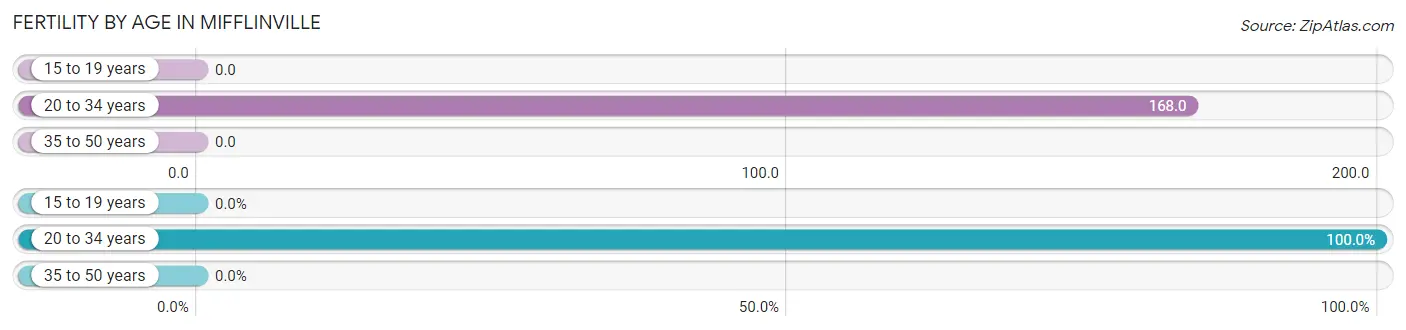
| Age Bracket | Women with Births | Births / 1,000 Women |
| 15 to 19 years | 0 (0.0%) | 0.0 |
| 20 to 34 years | 20 (100.0%) | 168.0 |
| 35 to 50 years | 0 (0.0%) | 0.0 |
| Total | 20 (100.0%) | 108.0 |
Fertility by Age by Marriage Status in Mifflinville
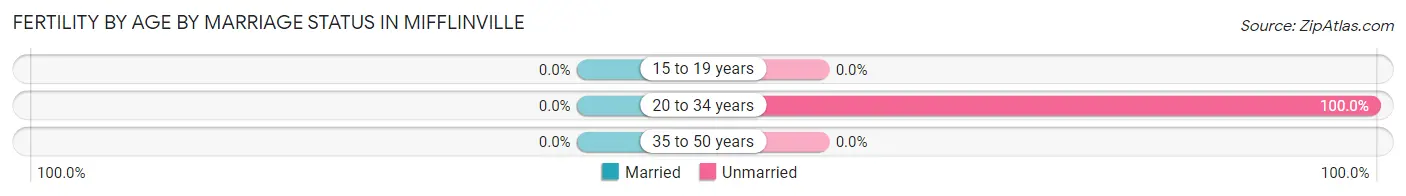
| Age Bracket | Married | Unmarried |
| 15 to 19 years | 0 (0.0%) | 0 (0.0%) |
| 20 to 34 years | 0 (0.0%) | 20 (100.0%) |
| 35 to 50 years | 0 (0.0%) | 0 (0.0%) |
| Total | 0 (0.0%) | 20 (100.0%) |
Fertility by Education in Mifflinville
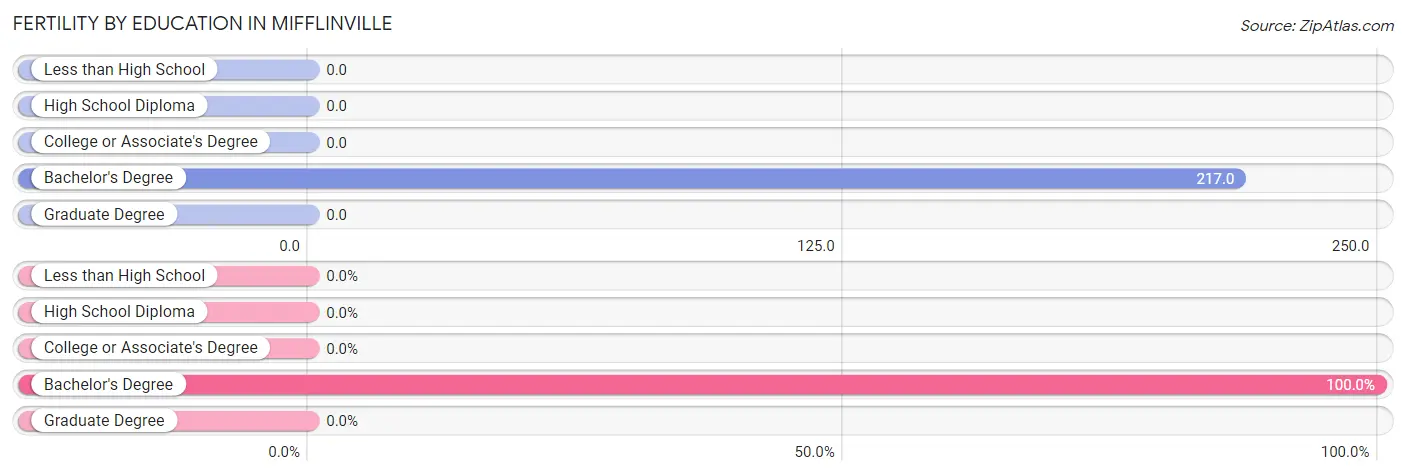
| Educational Attainment | Women with Births | Births / 1,000 Women |
| Less than High School | 0 (0.0%) | 0.0 |
| High School Diploma | 0 (0.0%) | 0.0 |
| College or Associate's Degree | 0 (0.0%) | 0.0 |
| Bachelor's Degree | 20 (100.0%) | 217.0 |
| Graduate Degree | 0 (0.0%) | 0.0 |
| Total | 20 (100.0%) | 108.0 |
Fertility by Education by Marriage Status in Mifflinville
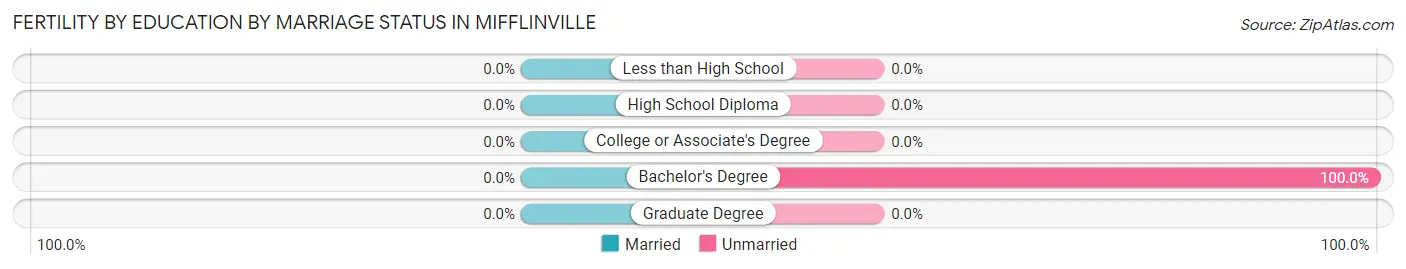
| Educational Attainment | Married | Unmarried |
| Less than High School | 0 (0.0%) | 0 (0.0%) |
| High School Diploma | 0 (0.0%) | 0 (0.0%) |
| College or Associate's Degree | 0 (0.0%) | 0 (0.0%) |
| Bachelor's Degree | 0 (0.0%) | 20 (100.0%) |
| Graduate Degree | 0 (0.0%) | 0 (0.0%) |
| Total | 0 (0.0%) | 20 (100.0%) |
Employment Characteristics in Mifflinville
Employment by Class of Employer in Mifflinville
Among the 629 employed individuals in Mifflinville, private company employees (370 | 58.8%), not-for-profit organizations (124 | 19.7%), and local government employees (58 | 9.2%) make up the most common classes of employment.
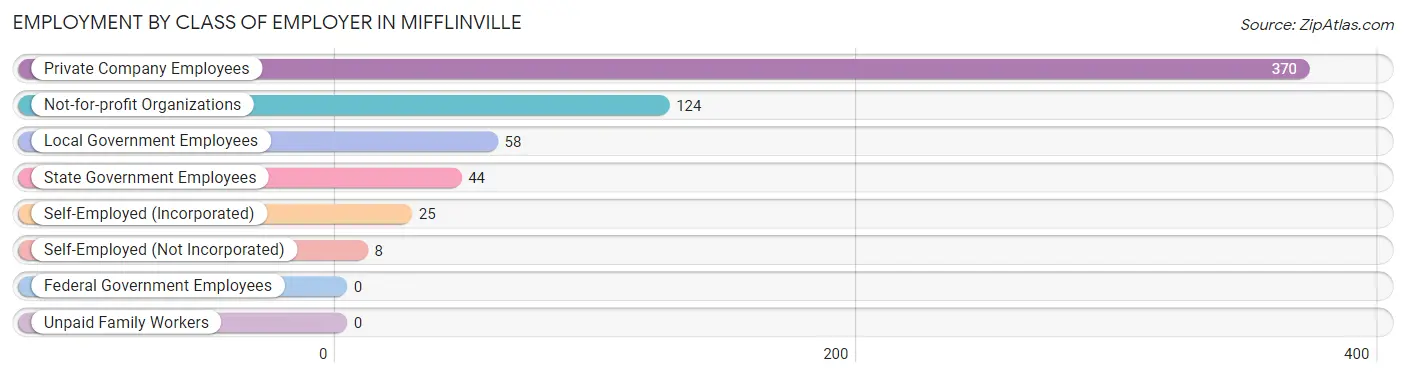
| Employer Class | # Employees | % Employees |
| Private Company Employees | 370 | 58.8% |
| Self-Employed (Incorporated) | 25 | 4.0% |
| Self-Employed (Not Incorporated) | 8 | 1.3% |
| Not-for-profit Organizations | 124 | 19.7% |
| Local Government Employees | 58 | 9.2% |
| State Government Employees | 44 | 7.0% |
| Federal Government Employees | 0 | 0.0% |
| Unpaid Family Workers | 0 | 0.0% |
| Total | 629 | 100.0% |
Employment Status by Age in Mifflinville
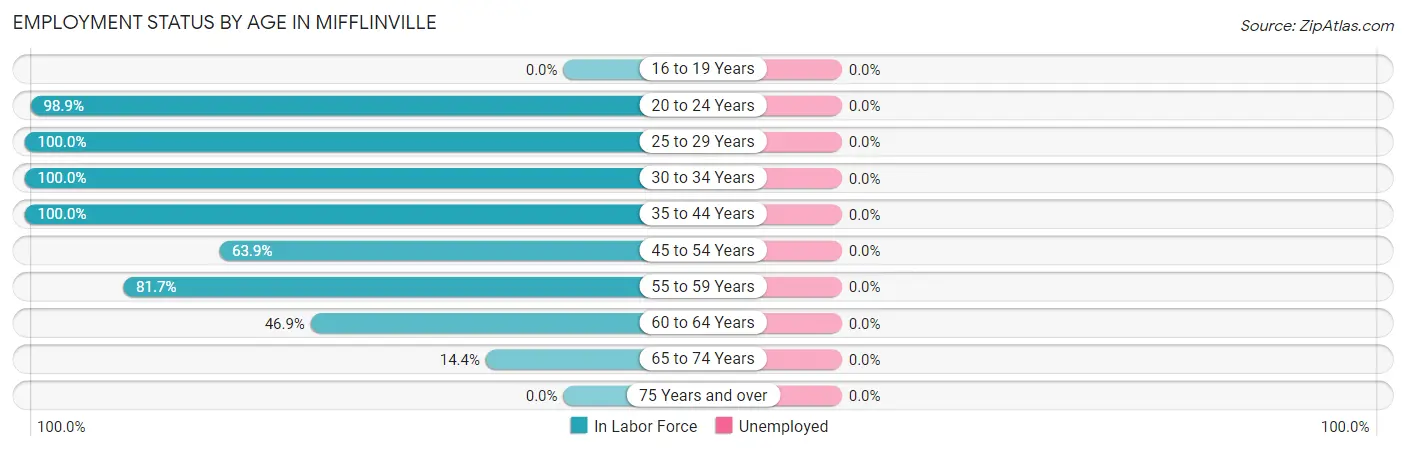
| Age Bracket | In Labor Force | Unemployed |
| 16 to 19 Years | 0 (0.0%) | 0 (0.0%) |
| 20 to 24 Years | 92 (98.9%) | 0 (0.0%) |
| 25 to 29 Years | 44 (100.0%) | 0 (0.0%) |
| 30 to 34 Years | 110 (100.0%) | 0 (0.0%) |
| 35 to 44 Years | 115 (100.0%) | 0 (0.0%) |
| 45 to 54 Years | 115 (63.9%) | 0 (0.0%) |
| 55 to 59 Years | 58 (81.7%) | 0 (0.0%) |
| 60 to 64 Years | 75 (46.9%) | 0 (0.0%) |
| 65 to 74 Years | 20 (14.4%) | 0 (0.0%) |
| 75 Years and over | 0 (0.0%) | 0 (0.0%) |
| Total | 629 (61.1%) | 0 (0.0%) |
Employment Status by Educational Attainment in Mifflinville
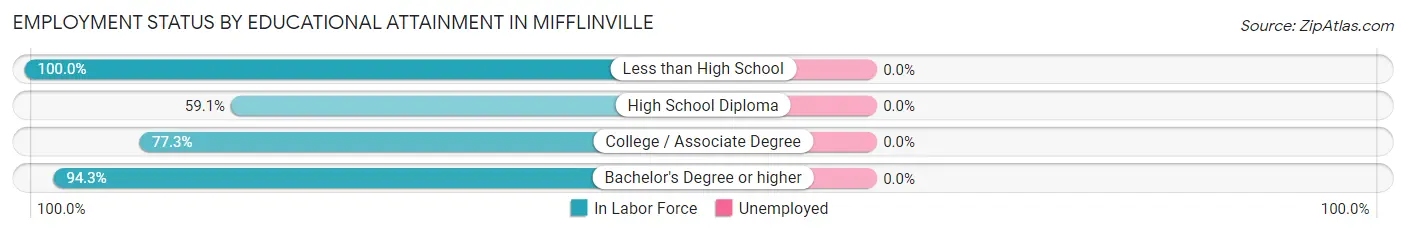
| Educational Attainment | In Labor Force | Unemployed |
| Less than High School | 14 (100.0%) | 0 (0.0%) |
| High School Diploma | 163 (59.1%) | 0 (0.0%) |
| College / Associate Degree | 126 (77.3%) | 0 (0.0%) |
| Bachelor's Degree or higher | 214 (94.3%) | 0 (0.0%) |
| Total | 517 (76.0%) | 0 (0.0%) |
Employment Occupations by Sex in Mifflinville
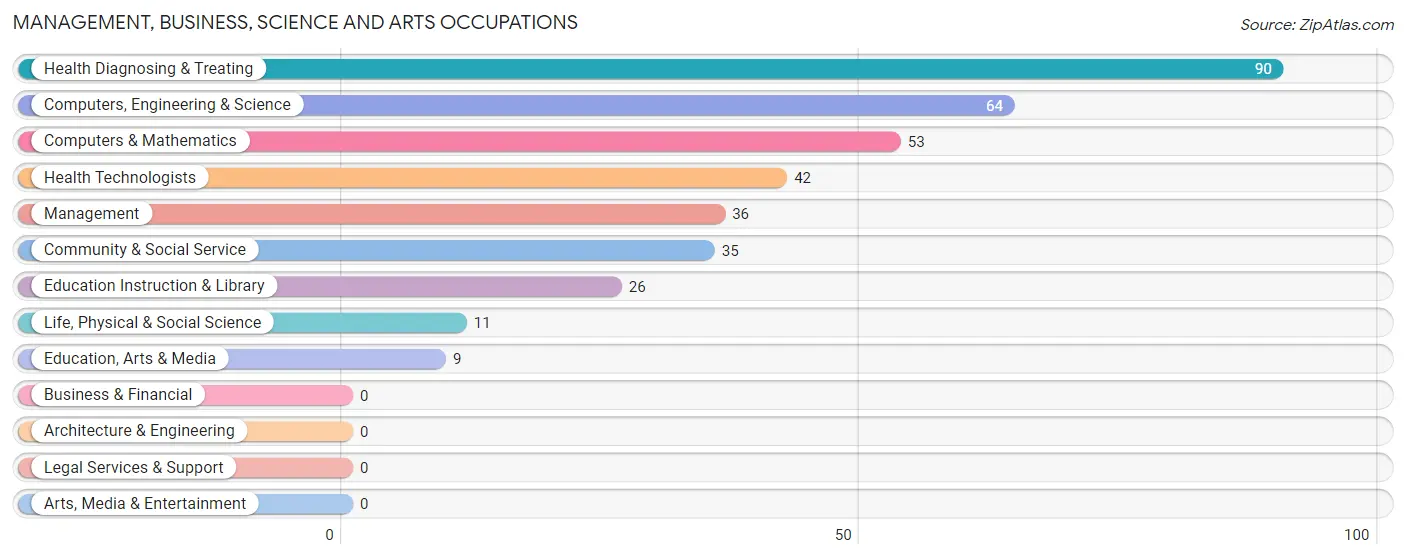
Management, Business, Science and Arts Occupations
The most common Management, Business, Science and Arts occupations in Mifflinville are Health Diagnosing & Treating (90 | 14.3%), Computers, Engineering & Science (64 | 10.2%), Computers & Mathematics (53 | 8.4%), Health Technologists (42 | 6.7%), and Management (36 | 5.7%).
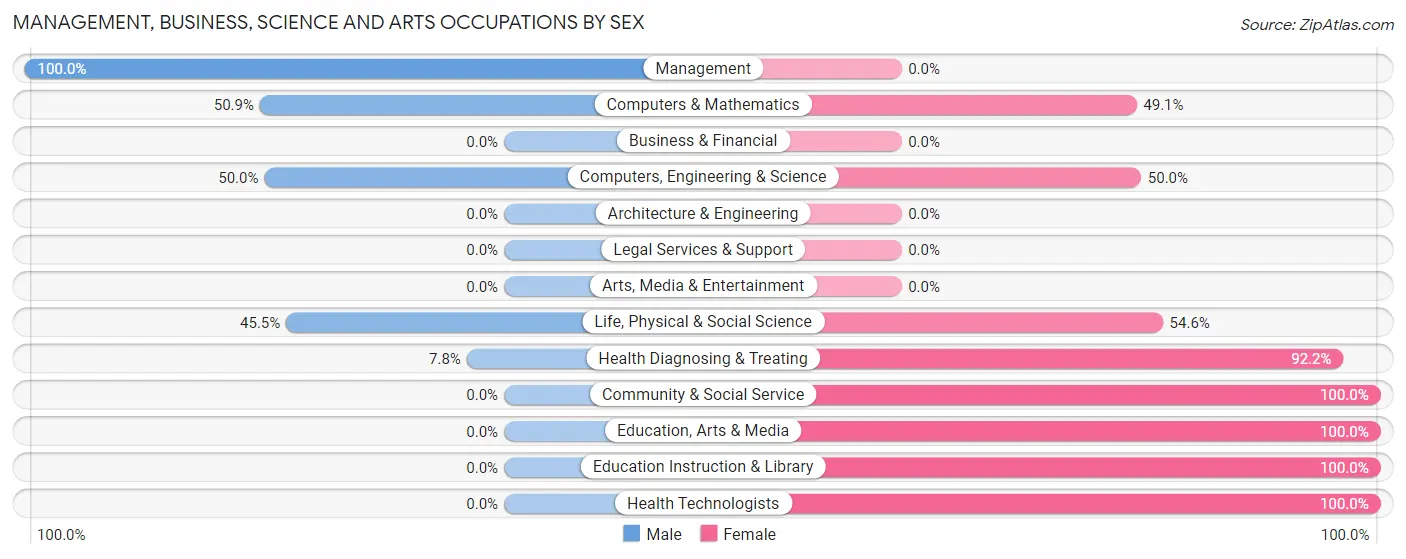
Management, Business, Science and Arts Occupations by Sex
Within the Management, Business, Science and Arts occupations in Mifflinville, the most male-oriented occupations are Management (100.0%), Computers & Mathematics (50.9%), and Computers, Engineering & Science (50.0%), while the most female-oriented occupations are Community & Social Service (100.0%), Education, Arts & Media (100.0%), and Education Instruction & Library (100.0%).
| Occupation | Male | Female |
| Management | 36 (100.0%) | 0 (0.0%) |
| Business & Financial | 0 (0.0%) | 0 (0.0%) |
| Computers, Engineering & Science | 32 (50.0%) | 32 (50.0%) |
| Computers & Mathematics | 27 (50.9%) | 26 (49.1%) |
| Architecture & Engineering | 0 (0.0%) | 0 (0.0%) |
| Life, Physical & Social Science | 5 (45.5%) | 6 (54.5%) |
| Community & Social Service | 0 (0.0%) | 35 (100.0%) |
| Education, Arts & Media | 0 (0.0%) | 9 (100.0%) |
| Legal Services & Support | 0 (0.0%) | 0 (0.0%) |
| Education Instruction & Library | 0 (0.0%) | 26 (100.0%) |
| Arts, Media & Entertainment | 0 (0.0%) | 0 (0.0%) |
| Health Diagnosing & Treating | 7 (7.8%) | 83 (92.2%) |
| Health Technologists | 0 (0.0%) | 42 (100.0%) |
| Total (Category) | 75 (33.3%) | 150 (66.7%) |
| Total (Overall) | 371 (59.0%) | 258 (41.0%) |
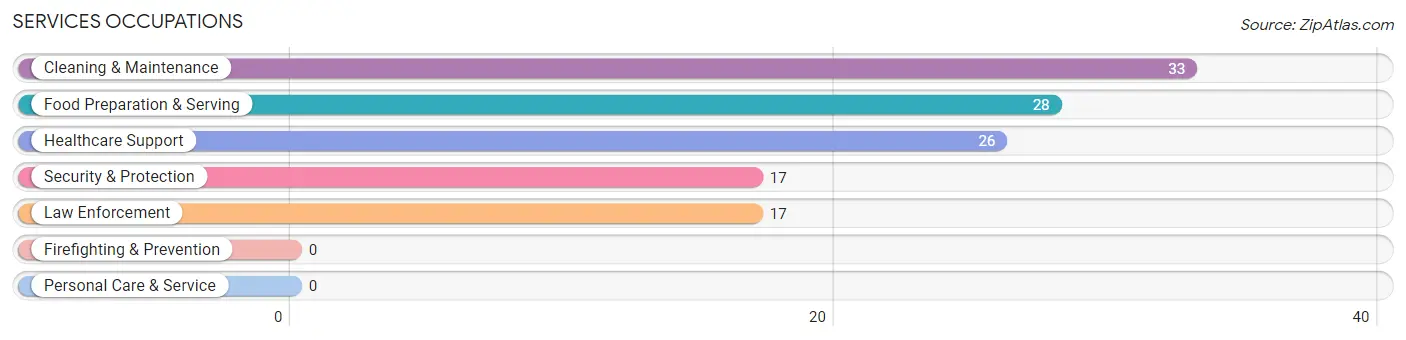
Services Occupations
The most common Services occupations in Mifflinville are Cleaning & Maintenance (33 | 5.2%), Food Preparation & Serving (28 | 4.4%), Healthcare Support (26 | 4.1%), Security & Protection (17 | 2.7%), and Law Enforcement (17 | 2.7%).
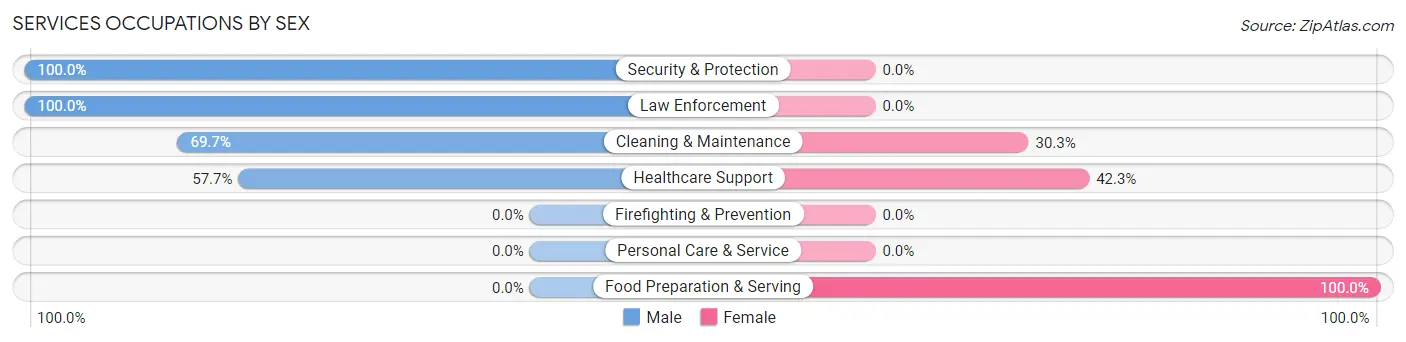
Services Occupations by Sex
Within the Services occupations in Mifflinville, the most male-oriented occupations are Security & Protection (100.0%), Law Enforcement (100.0%), and Cleaning & Maintenance (69.7%), while the most female-oriented occupations are Food Preparation & Serving (100.0%), Healthcare Support (42.3%), and Cleaning & Maintenance (30.3%).
| Occupation | Male | Female |
| Healthcare Support | 15 (57.7%) | 11 (42.3%) |
| Security & Protection | 17 (100.0%) | 0 (0.0%) |
| Firefighting & Prevention | 0 (0.0%) | 0 (0.0%) |
| Law Enforcement | 17 (100.0%) | 0 (0.0%) |
| Food Preparation & Serving | 0 (0.0%) | 28 (100.0%) |
| Cleaning & Maintenance | 23 (69.7%) | 10 (30.3%) |
| Personal Care & Service | 0 (0.0%) | 0 (0.0%) |
| Total (Category) | 55 (52.9%) | 49 (47.1%) |
| Total (Overall) | 371 (59.0%) | 258 (41.0%) |
Sales and Office Occupations
The most common Sales and Office occupations in Mifflinville are Office & Administration (117 | 18.6%), and Sales & Related (32 | 5.1%).
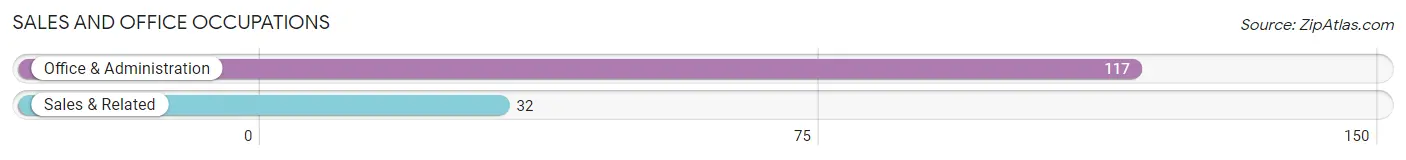
Sales and Office Occupations by Sex
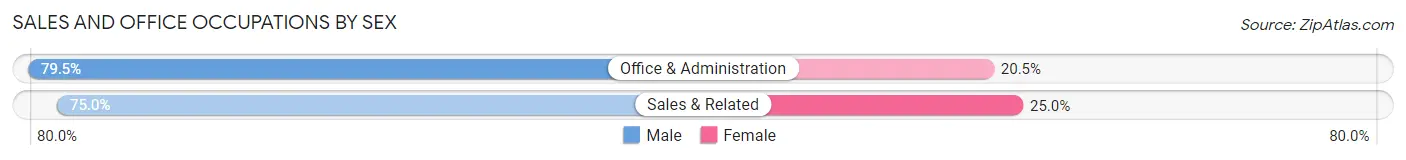
| Occupation | Male | Female |
| Sales & Related | 24 (75.0%) | 8 (25.0%) |
| Office & Administration | 93 (79.5%) | 24 (20.5%) |
| Total (Category) | 117 (78.5%) | 32 (21.5%) |
| Total (Overall) | 371 (59.0%) | 258 (41.0%) |
Natural Resources, Construction and Maintenance Occupations
The most common Natural Resources, Construction and Maintenance occupations in Mifflinville are Installation, Maintenance & Repair (11 | 1.8%), and Construction & Extraction (8 | 1.3%).
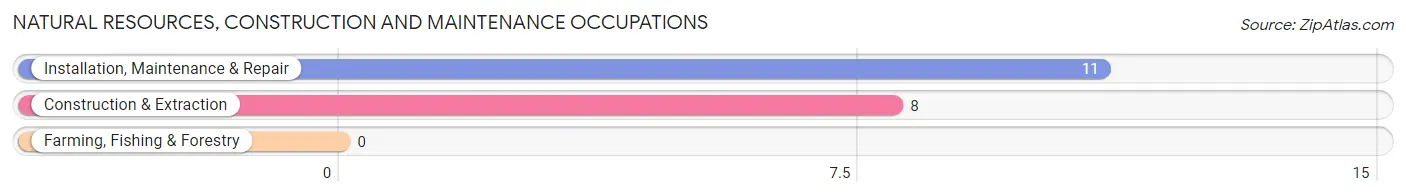
Natural Resources, Construction and Maintenance Occupations by Sex
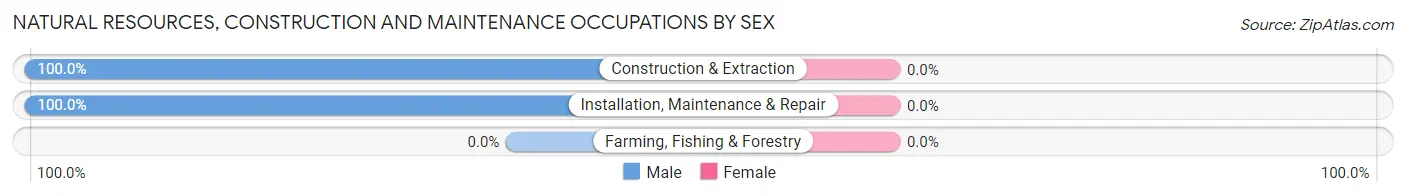
| Occupation | Male | Female |
| Farming, Fishing & Forestry | 0 (0.0%) | 0 (0.0%) |
| Construction & Extraction | 8 (100.0%) | 0 (0.0%) |
| Installation, Maintenance & Repair | 11 (100.0%) | 0 (0.0%) |
| Total (Category) | 19 (100.0%) | 0 (0.0%) |
| Total (Overall) | 371 (59.0%) | 258 (41.0%) |
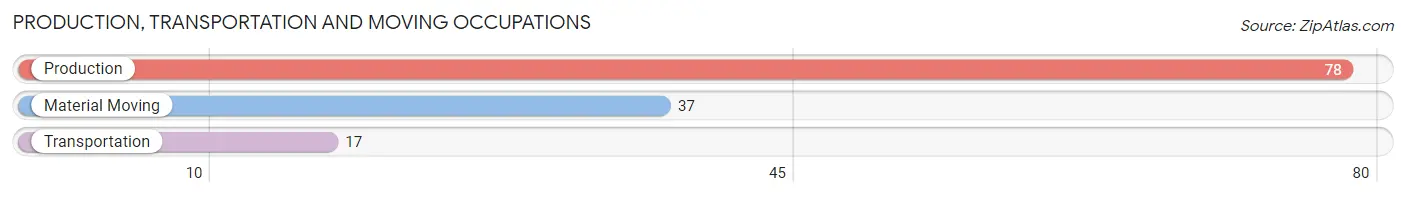
Production, Transportation and Moving Occupations
The most common Production, Transportation and Moving occupations in Mifflinville are Production (78 | 12.4%), Material Moving (37 | 5.9%), and Transportation (17 | 2.7%).
Production, Transportation and Moving Occupations by Sex
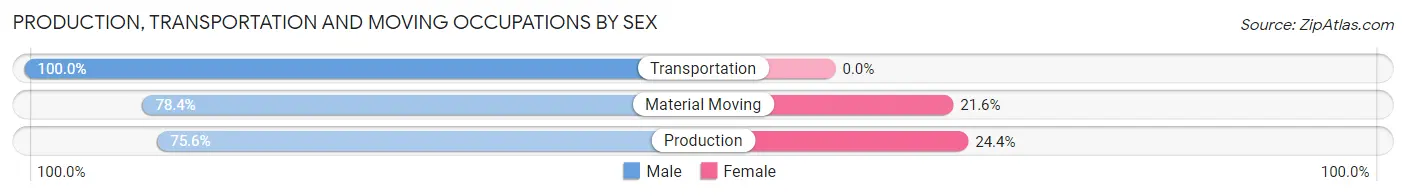
| Occupation | Male | Female |
| Production | 59 (75.6%) | 19 (24.4%) |
| Transportation | 17 (100.0%) | 0 (0.0%) |
| Material Moving | 29 (78.4%) | 8 (21.6%) |
| Total (Category) | 105 (79.5%) | 27 (20.4%) |
| Total (Overall) | 371 (59.0%) | 258 (41.0%) |
Employment Industries by Sex in Mifflinville
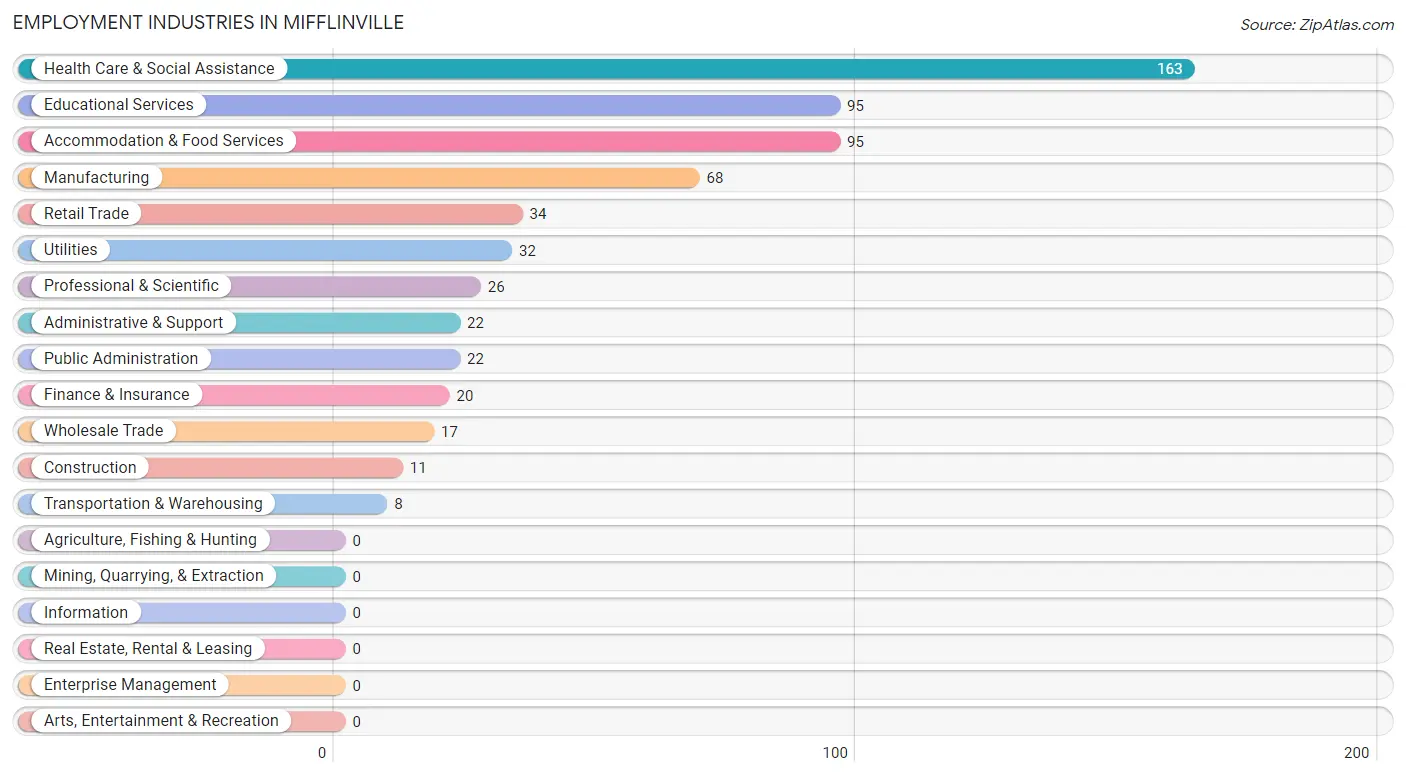
Employment Industries in Mifflinville
The major employment industries in Mifflinville include Health Care & Social Assistance (163 | 25.9%), Educational Services (95 | 15.1%), Accommodation & Food Services (95 | 15.1%), Manufacturing (68 | 10.8%), and Retail Trade (34 | 5.4%).
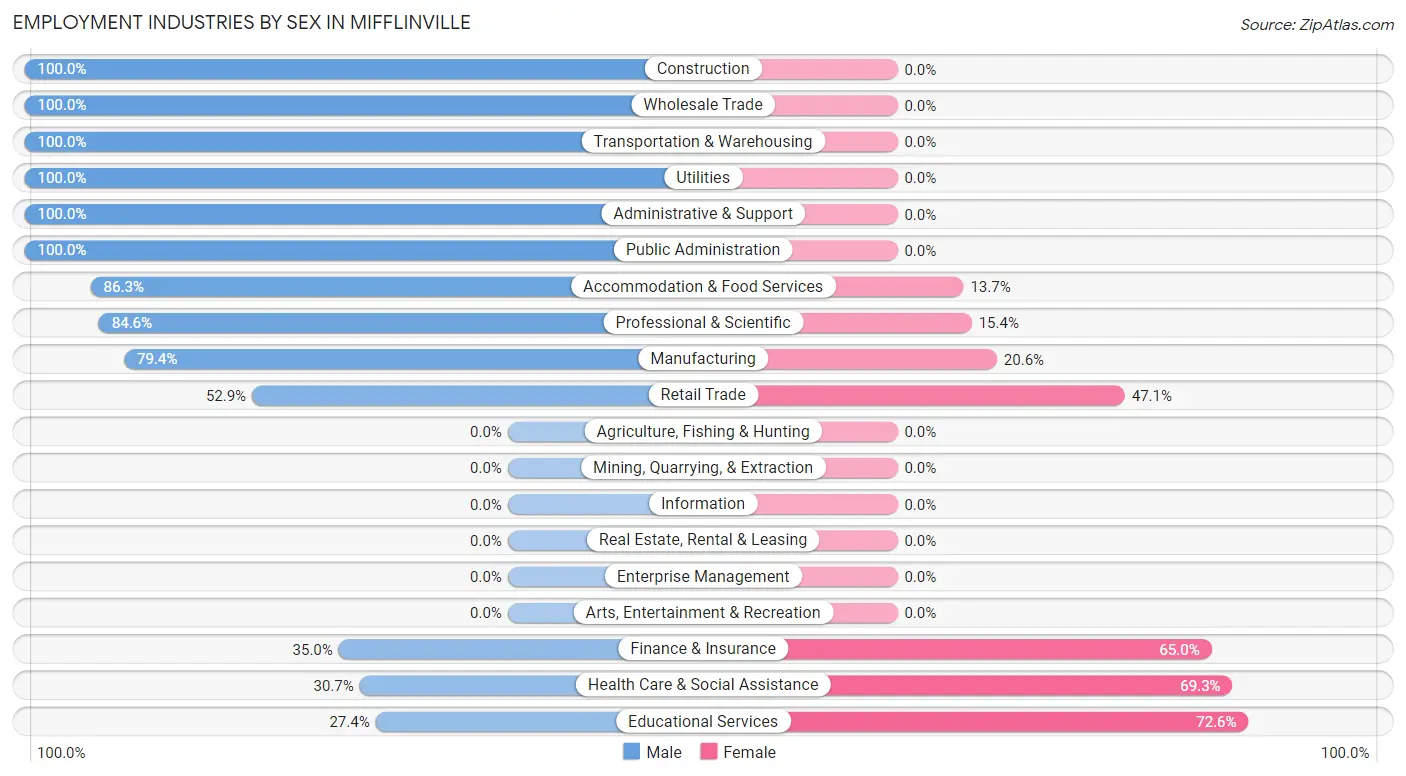
Employment Industries by Sex in Mifflinville
The Mifflinville industries that see more men than women are Construction (100.0%), Wholesale Trade (100.0%), and Transportation & Warehousing (100.0%), whereas the industries that tend to have a higher number of women are Educational Services (72.6%), Health Care & Social Assistance (69.3%), and Finance & Insurance (65.0%).
| Industry | Male | Female |
| Agriculture, Fishing & Hunting | 0 (0.0%) | 0 (0.0%) |
| Mining, Quarrying, & Extraction | 0 (0.0%) | 0 (0.0%) |
| Construction | 11 (100.0%) | 0 (0.0%) |
| Manufacturing | 54 (79.4%) | 14 (20.6%) |
| Wholesale Trade | 17 (100.0%) | 0 (0.0%) |
| Retail Trade | 18 (52.9%) | 16 (47.1%) |
| Transportation & Warehousing | 8 (100.0%) | 0 (0.0%) |
| Utilities | 32 (100.0%) | 0 (0.0%) |
| Information | 0 (0.0%) | 0 (0.0%) |
| Finance & Insurance | 7 (35.0%) | 13 (65.0%) |
| Real Estate, Rental & Leasing | 0 (0.0%) | 0 (0.0%) |
| Professional & Scientific | 22 (84.6%) | 4 (15.4%) |
| Enterprise Management | 0 (0.0%) | 0 (0.0%) |
| Administrative & Support | 22 (100.0%) | 0 (0.0%) |
| Educational Services | 26 (27.4%) | 69 (72.6%) |
| Health Care & Social Assistance | 50 (30.7%) | 113 (69.3%) |
| Arts, Entertainment & Recreation | 0 (0.0%) | 0 (0.0%) |
| Accommodation & Food Services | 82 (86.3%) | 13 (13.7%) |
| Public Administration | 22 (100.0%) | 0 (0.0%) |
| Total | 371 (59.0%) | 258 (41.0%) |
Education in Mifflinville
School Enrollment in Mifflinville
The most common levels of schooling among the 182 students in Mifflinville are elementary school (52 | 28.6%), middle school (45 | 24.7%), and high school (24 | 13.2%).
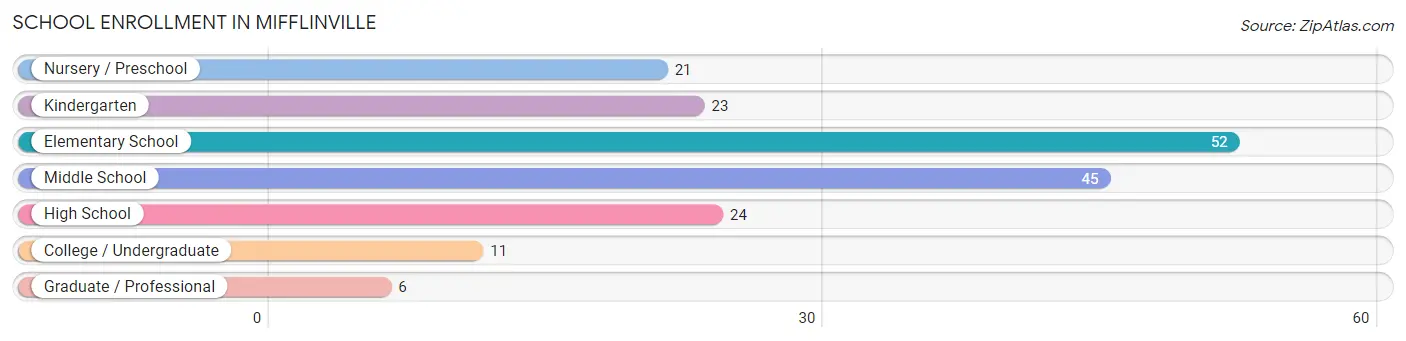
| School Level | # Students | % Students |
| Nursery / Preschool | 21 | 11.5% |
| Kindergarten | 23 | 12.6% |
| Elementary School | 52 | 28.6% |
| Middle School | 45 | 24.7% |
| High School | 24 | 13.2% |
| College / Undergraduate | 11 | 6.0% |
| Graduate / Professional | 6 | 3.3% |
| Total | 182 | 100.0% |
School Enrollment by Age by Funding Source in Mifflinville
Out of a total of 182 students who are enrolled in schools in Mifflinville, 14 (7.7%) attend a private institution, while the remaining 168 (92.3%) are enrolled in public schools. The age group of 5 to 9 year old has the highest likelihood of being enrolled in private schools, with 14 (18.7% in the age bracket) enrolled. Conversely, the age group of 3 to 4 year olds has the lowest likelihood of being enrolled in a private school, with 21 (100.0% in the age bracket) attending a public institution.
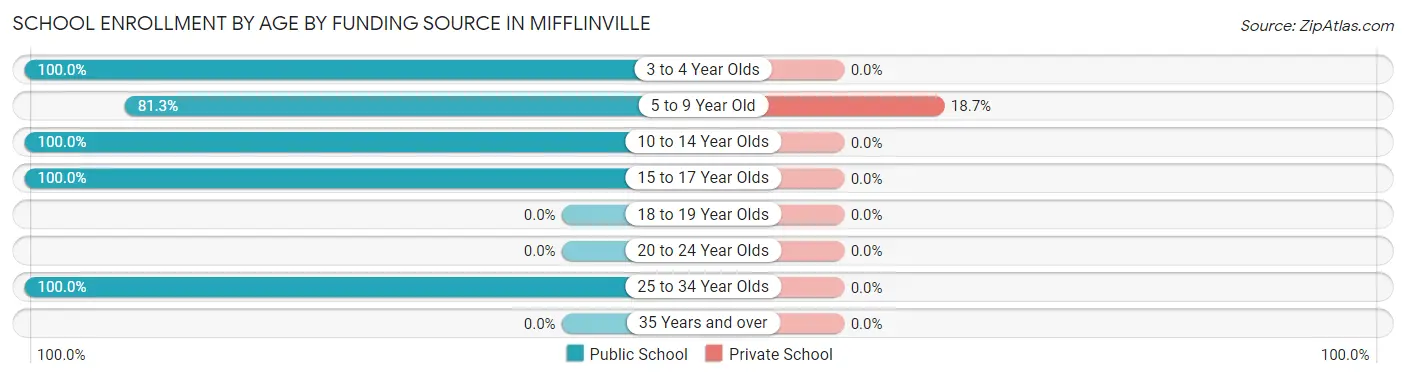
| Age Bracket | Public School | Private School |
| 3 to 4 Year Olds | 21 (100.0%) | 0 (0.0%) |
| 5 to 9 Year Old | 61 (81.3%) | 14 (18.7%) |
| 10 to 14 Year Olds | 45 (100.0%) | 0 (0.0%) |
| 15 to 17 Year Olds | 35 (100.0%) | 0 (0.0%) |
| 18 to 19 Year Olds | 0 (0.0%) | 0 (0.0%) |
| 20 to 24 Year Olds | 0 (0.0%) | 0 (0.0%) |
| 25 to 34 Year Olds | 6 (100.0%) | 0 (0.0%) |
| 35 Years and over | 0 (0.0%) | 0 (0.0%) |
| Total | 168 (92.3%) | 14 (7.7%) |
Educational Attainment by Field of Study in Mifflinville
Communications (72 | 27.9%), science & technology (46 | 17.8%), business (42 | 16.3%), education (39 | 15.1%), and social sciences (15 | 5.8%) are the most common fields of study among 258 individuals in Mifflinville who have obtained a bachelor's degree or higher.
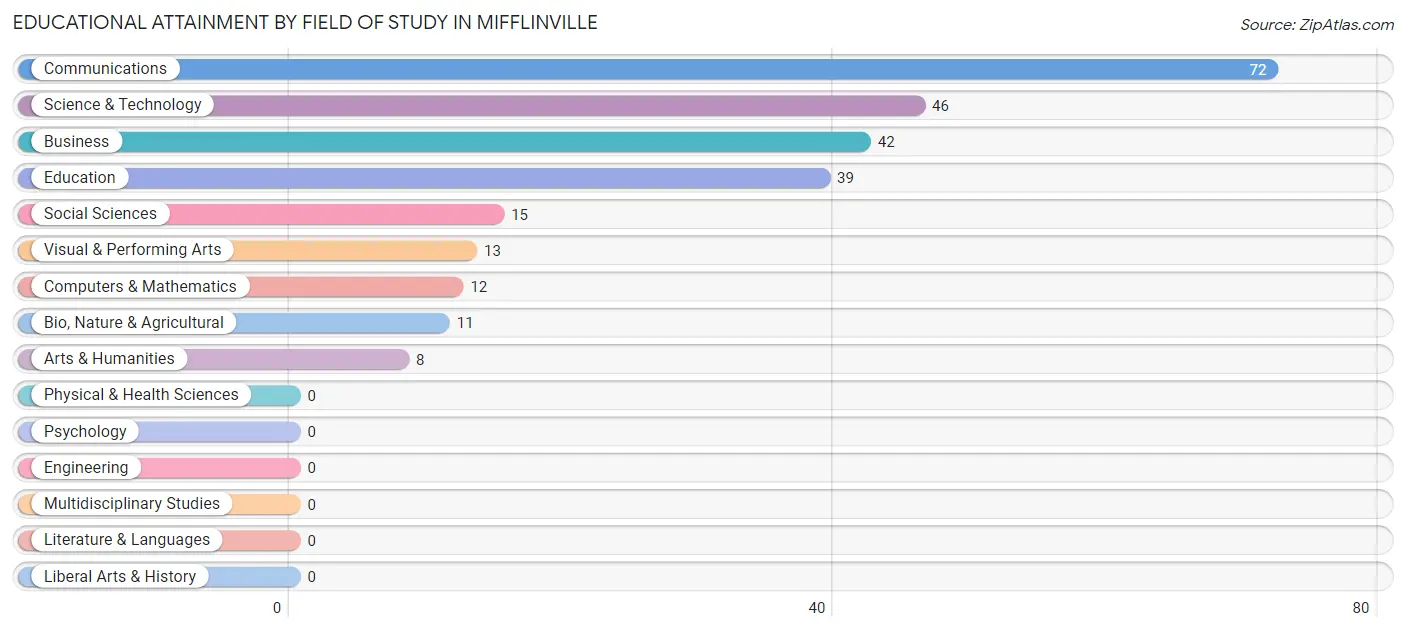
| Field of Study | # Graduates | % Graduates |
| Computers & Mathematics | 12 | 4.6% |
| Bio, Nature & Agricultural | 11 | 4.3% |
| Physical & Health Sciences | 0 | 0.0% |
| Psychology | 0 | 0.0% |
| Social Sciences | 15 | 5.8% |
| Engineering | 0 | 0.0% |
| Multidisciplinary Studies | 0 | 0.0% |
| Science & Technology | 46 | 17.8% |
| Business | 42 | 16.3% |
| Education | 39 | 15.1% |
| Literature & Languages | 0 | 0.0% |
| Liberal Arts & History | 0 | 0.0% |
| Visual & Performing Arts | 13 | 5.0% |
| Communications | 72 | 27.9% |
| Arts & Humanities | 8 | 3.1% |
| Total | 258 | 100.0% |
Transportation & Commute in Mifflinville
Vehicle Availability by Sex in Mifflinville
The most prevalent vehicle ownership categories in Mifflinville are males with 2 vehicles (257, accounting for 69.3%) and females with 2 vehicles (168, making up 99.6%).
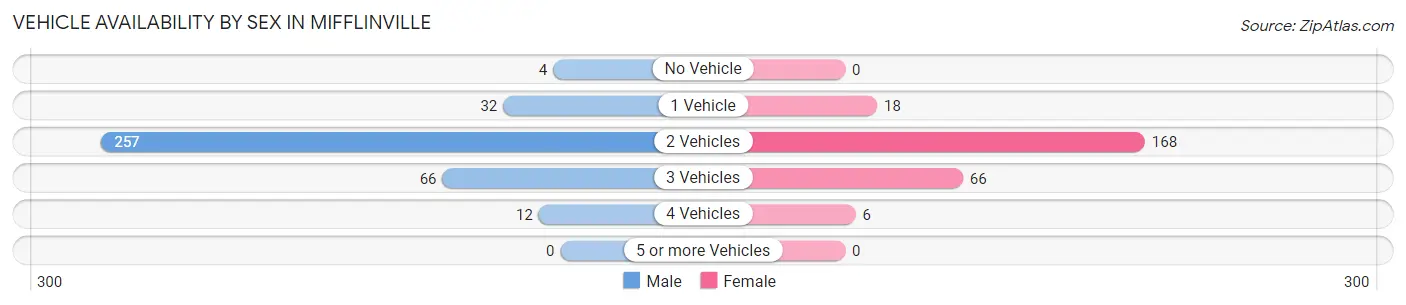
| Vehicles Available | Male | Female |
| No Vehicle | 4 (1.1%) | 0 (0.0%) |
| 1 Vehicle | 32 (8.6%) | 18 (7.0%) |
| 2 Vehicles | 257 (69.3%) | 168 (65.1%) |
| 3 Vehicles | 66 (17.8%) | 66 (25.6%) |
| 4 Vehicles | 12 (3.2%) | 6 (2.3%) |
| 5 or more Vehicles | 0 (0.0%) | 0 (0.0%) |
| Total | 371 (100.0%) | 258 (100.0%) |
Commute Time in Mifflinville
The most frequently occuring commute durations in Mifflinville are 25 to 29 minutes (147 commuters, 26.0%), 15 to 19 minutes (136 commuters, 24.0%), and 10 to 14 minutes (81 commuters, 14.3%).
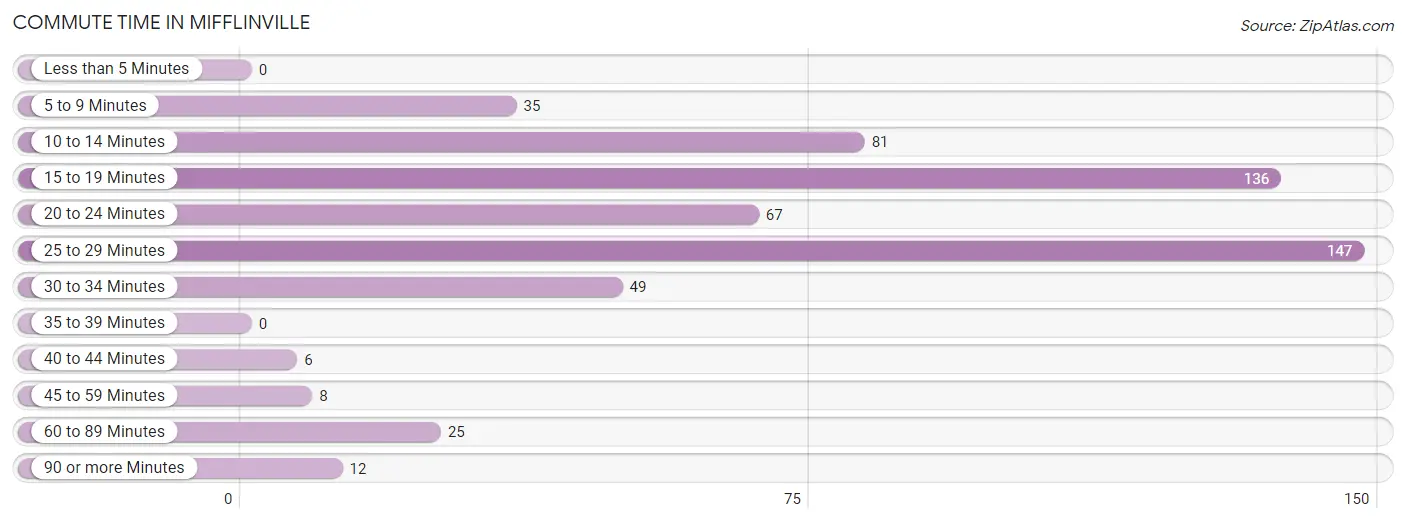
| Commute Time | # Commuters | % Commuters |
| Less than 5 Minutes | 0 | 0.0% |
| 5 to 9 Minutes | 35 | 6.2% |
| 10 to 14 Minutes | 81 | 14.3% |
| 15 to 19 Minutes | 136 | 24.0% |
| 20 to 24 Minutes | 67 | 11.8% |
| 25 to 29 Minutes | 147 | 26.0% |
| 30 to 34 Minutes | 49 | 8.7% |
| 35 to 39 Minutes | 0 | 0.0% |
| 40 to 44 Minutes | 6 | 1.1% |
| 45 to 59 Minutes | 8 | 1.4% |
| 60 to 89 Minutes | 25 | 4.4% |
| 90 or more Minutes | 12 | 2.1% |
Commute Time by Sex in Mifflinville
The most common commute times in Mifflinville are 25 to 29 minutes (114 commuters, 35.1%) for males and 15 to 19 minutes (49 commuters, 20.3%) for females.
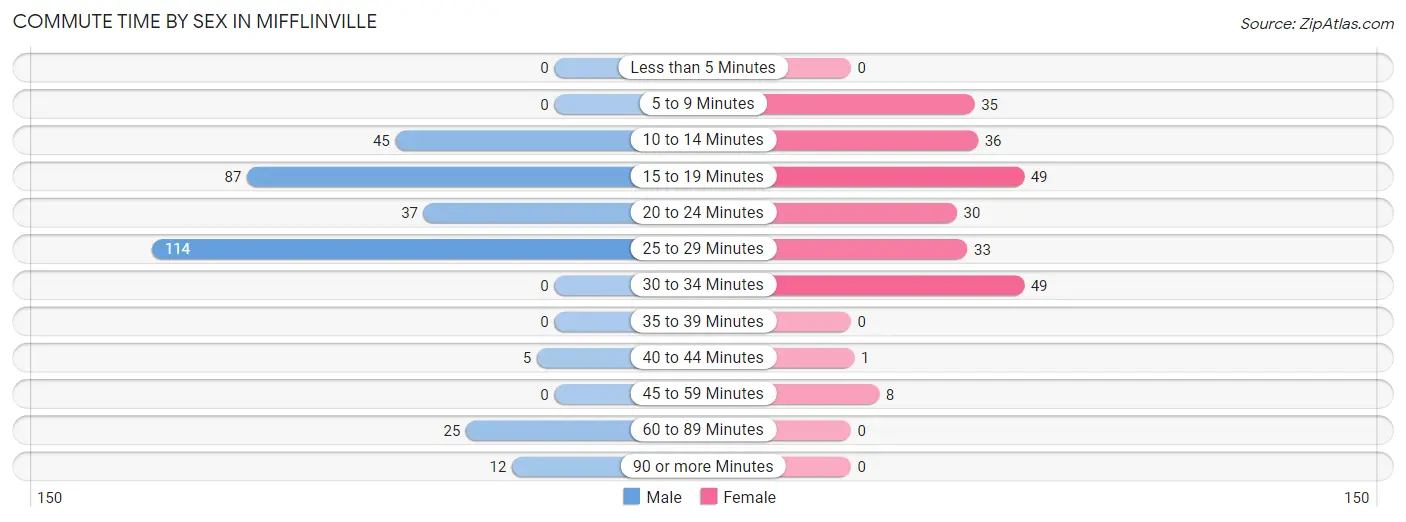
| Commute Time | Male | Female |
| Less than 5 Minutes | 0 (0.0%) | 0 (0.0%) |
| 5 to 9 Minutes | 0 (0.0%) | 35 (14.5%) |
| 10 to 14 Minutes | 45 (13.9%) | 36 (14.9%) |
| 15 to 19 Minutes | 87 (26.8%) | 49 (20.3%) |
| 20 to 24 Minutes | 37 (11.4%) | 30 (12.4%) |
| 25 to 29 Minutes | 114 (35.1%) | 33 (13.7%) |
| 30 to 34 Minutes | 0 (0.0%) | 49 (20.3%) |
| 35 to 39 Minutes | 0 (0.0%) | 0 (0.0%) |
| 40 to 44 Minutes | 5 (1.5%) | 1 (0.4%) |
| 45 to 59 Minutes | 0 (0.0%) | 8 (3.3%) |
| 60 to 89 Minutes | 25 (7.7%) | 0 (0.0%) |
| 90 or more Minutes | 12 (3.7%) | 0 (0.0%) |
Time of Departure to Work by Sex in Mifflinville
The most frequent times of departure to work in Mifflinville are 7:00 AM to 7:29 AM (93, 28.6%) for males and 7:00 AM to 7:29 AM (71, 29.5%) for females.
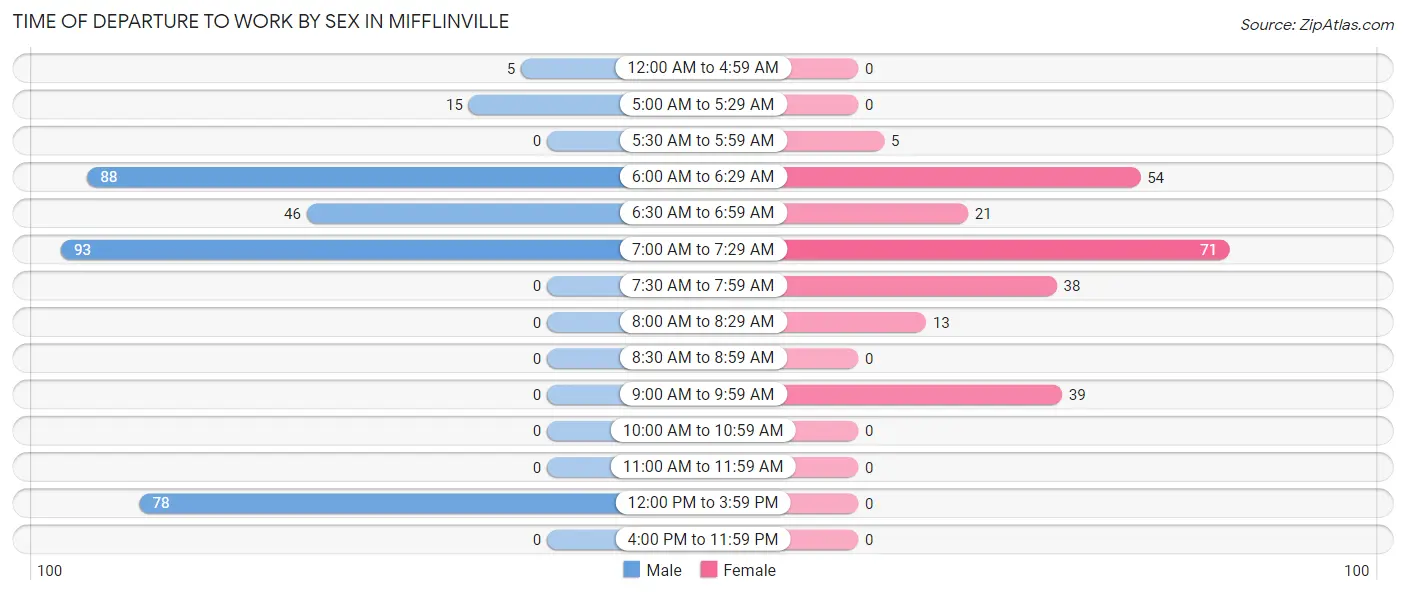
| Time of Departure | Male | Female |
| 12:00 AM to 4:59 AM | 5 (1.5%) | 0 (0.0%) |
| 5:00 AM to 5:29 AM | 15 (4.6%) | 0 (0.0%) |
| 5:30 AM to 5:59 AM | 0 (0.0%) | 5 (2.1%) |
| 6:00 AM to 6:29 AM | 88 (27.1%) | 54 (22.4%) |
| 6:30 AM to 6:59 AM | 46 (14.1%) | 21 (8.7%) |
| 7:00 AM to 7:29 AM | 93 (28.6%) | 71 (29.5%) |
| 7:30 AM to 7:59 AM | 0 (0.0%) | 38 (15.8%) |
| 8:00 AM to 8:29 AM | 0 (0.0%) | 13 (5.4%) |
| 8:30 AM to 8:59 AM | 0 (0.0%) | 0 (0.0%) |
| 9:00 AM to 9:59 AM | 0 (0.0%) | 39 (16.2%) |
| 10:00 AM to 10:59 AM | 0 (0.0%) | 0 (0.0%) |
| 11:00 AM to 11:59 AM | 0 (0.0%) | 0 (0.0%) |
| 12:00 PM to 3:59 PM | 78 (24.0%) | 0 (0.0%) |
| 4:00 PM to 11:59 PM | 0 (0.0%) | 0 (0.0%) |
| Total | 325 (100.0%) | 241 (100.0%) |
Housing Occupancy in Mifflinville
Occupancy by Ownership in Mifflinville
Of the total 528 dwellings in Mifflinville, owner-occupied units account for 408 (77.3%), while renter-occupied units make up 120 (22.7%).
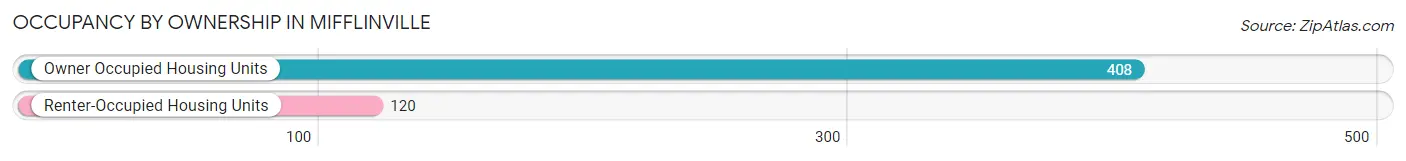
| Occupancy | # Housing Units | % Housing Units |
| Owner Occupied Housing Units | 408 | 77.3% |
| Renter-Occupied Housing Units | 120 | 22.7% |
| Total Occupied Housing Units | 528 | 100.0% |
Occupancy by Household Size in Mifflinville
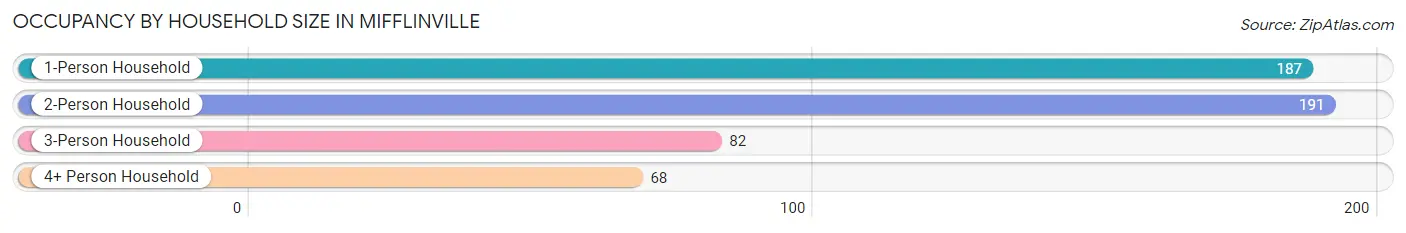
| Household Size | # Housing Units | % Housing Units |
| 1-Person Household | 187 | 35.4% |
| 2-Person Household | 191 | 36.2% |
| 3-Person Household | 82 | 15.5% |
| 4+ Person Household | 68 | 12.9% |
| Total Housing Units | 528 | 100.0% |
Occupancy by Ownership by Household Size in Mifflinville
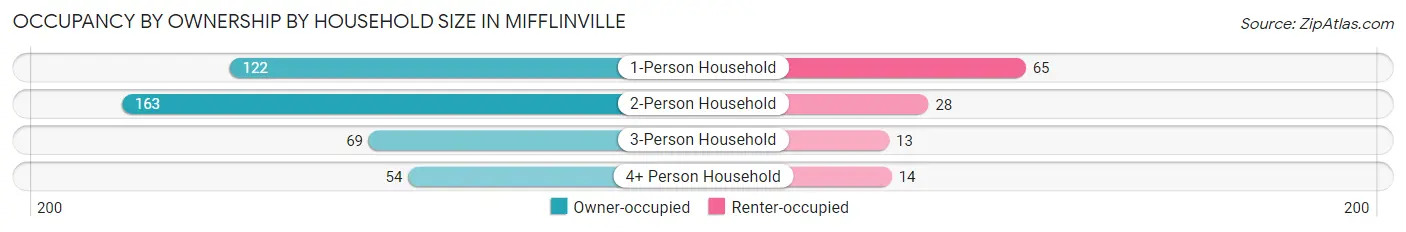
| Household Size | Owner-occupied | Renter-occupied |
| 1-Person Household | 122 (65.2%) | 65 (34.8%) |
| 2-Person Household | 163 (85.3%) | 28 (14.7%) |
| 3-Person Household | 69 (84.2%) | 13 (15.9%) |
| 4+ Person Household | 54 (79.4%) | 14 (20.6%) |
| Total Housing Units | 408 (77.3%) | 120 (22.7%) |
Occupancy by Educational Attainment in Mifflinville
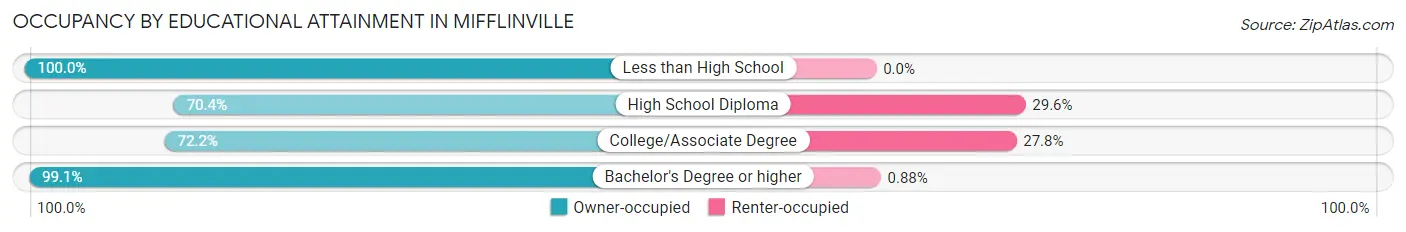
| Household Size | Owner-occupied | Renter-occupied |
| Less than High School | 4 (100.0%) | 0 (0.0%) |
| High School Diploma | 200 (70.4%) | 84 (29.6%) |
| College/Associate Degree | 91 (72.2%) | 35 (27.8%) |
| Bachelor's Degree or higher | 113 (99.1%) | 1 (0.9%) |
Occupancy by Age of Householder in Mifflinville
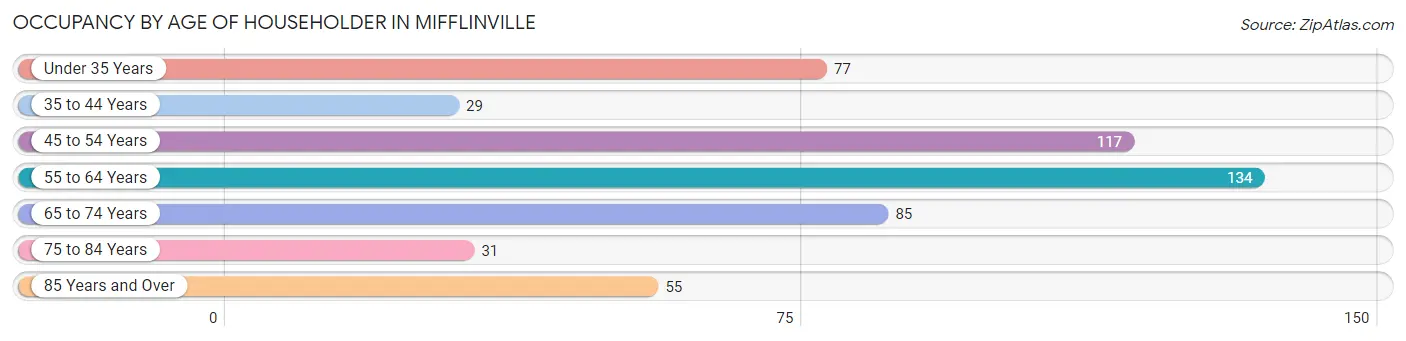
| Age Bracket | # Households | % Households |
| Under 35 Years | 77 | 14.6% |
| 35 to 44 Years | 29 | 5.5% |
| 45 to 54 Years | 117 | 22.2% |
| 55 to 64 Years | 134 | 25.4% |
| 65 to 74 Years | 85 | 16.1% |
| 75 to 84 Years | 31 | 5.9% |
| 85 Years and Over | 55 | 10.4% |
| Total | 528 | 100.0% |
Housing Finances in Mifflinville
Median Income by Occupancy in Mifflinville
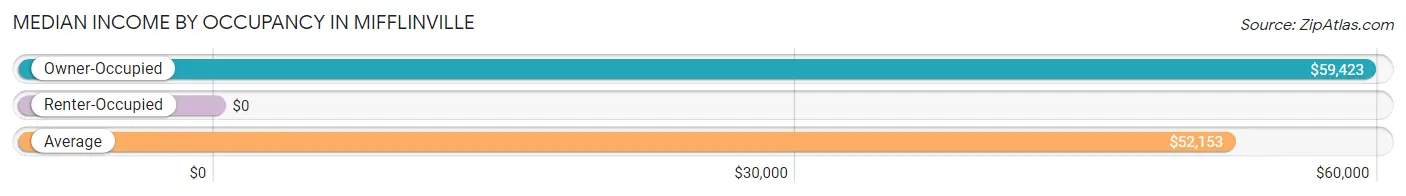
| Occupancy Type | # Households | Median Income |
| Owner-Occupied | 408 (77.3%) | $59,423 |
| Renter-Occupied | 120 (22.7%) | $0 |
| Average | 528 (100.0%) | $52,153 |
Occupancy by Householder Income Bracket in Mifflinville
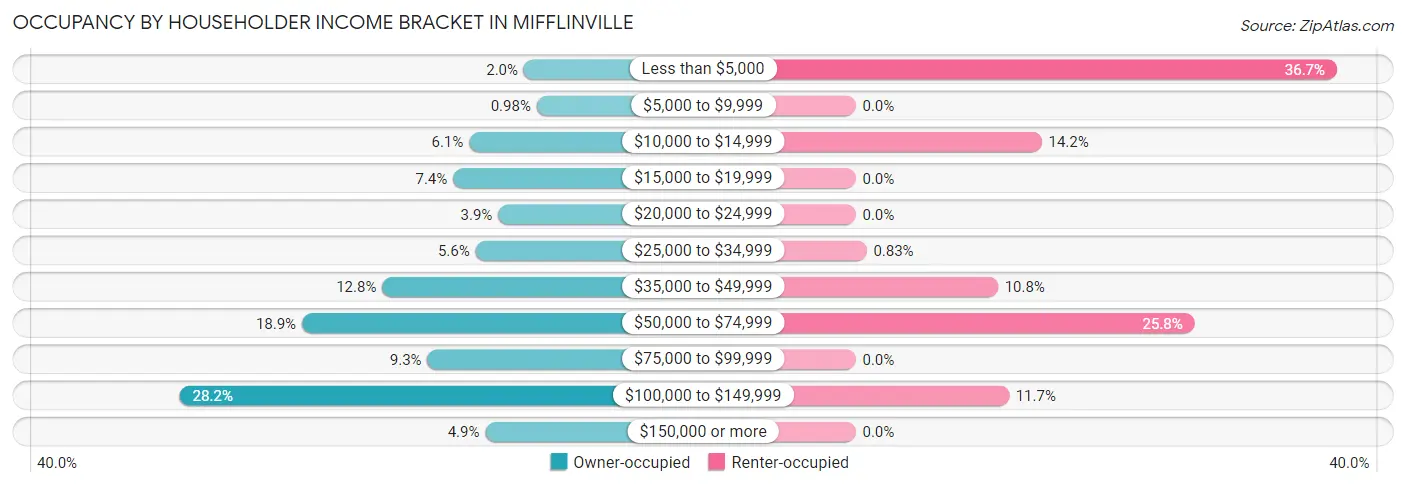
| Income Bracket | Owner-occupied | Renter-occupied |
| Less than $5,000 | 8 (2.0%) | 44 (36.7%) |
| $5,000 to $9,999 | 4 (1.0%) | 0 (0.0%) |
| $10,000 to $14,999 | 25 (6.1%) | 17 (14.2%) |
| $15,000 to $19,999 | 30 (7.3%) | 0 (0.0%) |
| $20,000 to $24,999 | 16 (3.9%) | 0 (0.0%) |
| $25,000 to $34,999 | 23 (5.6%) | 1 (0.8%) |
| $35,000 to $49,999 | 52 (12.8%) | 13 (10.8%) |
| $50,000 to $74,999 | 77 (18.9%) | 31 (25.8%) |
| $75,000 to $99,999 | 38 (9.3%) | 0 (0.0%) |
| $100,000 to $149,999 | 115 (28.2%) | 14 (11.7%) |
| $150,000 or more | 20 (4.9%) | 0 (0.0%) |
| Total | 408 (100.0%) | 120 (100.0%) |
Monthly Housing Cost Tiers in Mifflinville
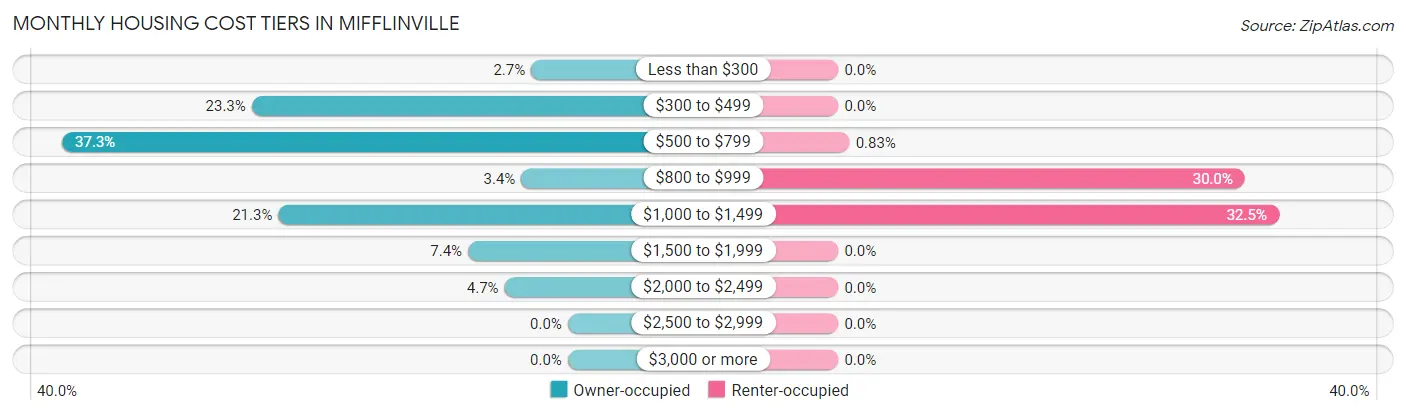
| Monthly Cost | Owner-occupied | Renter-occupied |
| Less than $300 | 11 (2.7%) | 0 (0.0%) |
| $300 to $499 | 95 (23.3%) | 0 (0.0%) |
| $500 to $799 | 152 (37.2%) | 1 (0.8%) |
| $800 to $999 | 14 (3.4%) | 36 (30.0%) |
| $1,000 to $1,499 | 87 (21.3%) | 39 (32.5%) |
| $1,500 to $1,999 | 30 (7.3%) | 0 (0.0%) |
| $2,000 to $2,499 | 19 (4.7%) | 0 (0.0%) |
| $2,500 to $2,999 | 0 (0.0%) | 0 (0.0%) |
| $3,000 or more | 0 (0.0%) | 0 (0.0%) |
| Total | 408 (100.0%) | 120 (100.0%) |
Physical Housing Characteristics in Mifflinville
Housing Structures in Mifflinville
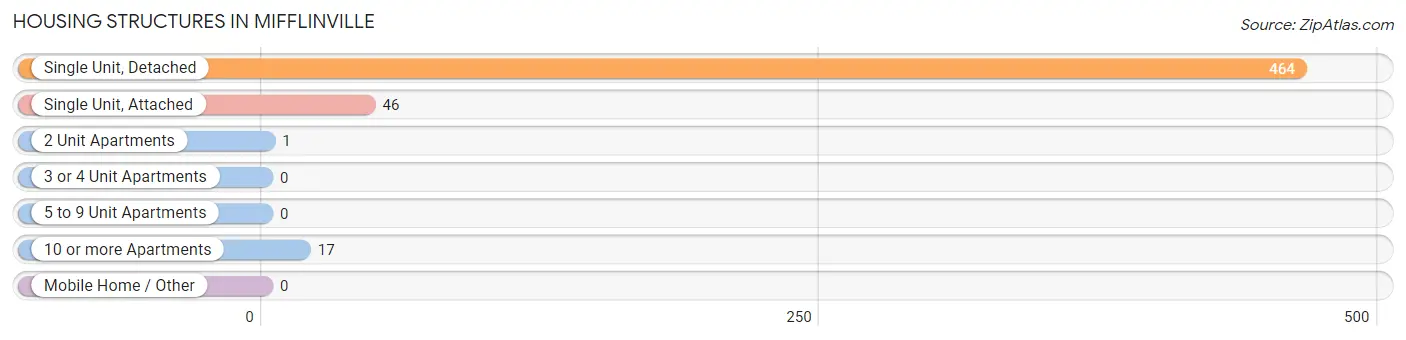
| Structure Type | # Housing Units | % Housing Units |
| Single Unit, Detached | 464 | 87.9% |
| Single Unit, Attached | 46 | 8.7% |
| 2 Unit Apartments | 1 | 0.2% |
| 3 or 4 Unit Apartments | 0 | 0.0% |
| 5 to 9 Unit Apartments | 0 | 0.0% |
| 10 or more Apartments | 17 | 3.2% |
| Mobile Home / Other | 0 | 0.0% |
| Total | 528 | 100.0% |
Housing Structures by Occupancy in Mifflinville
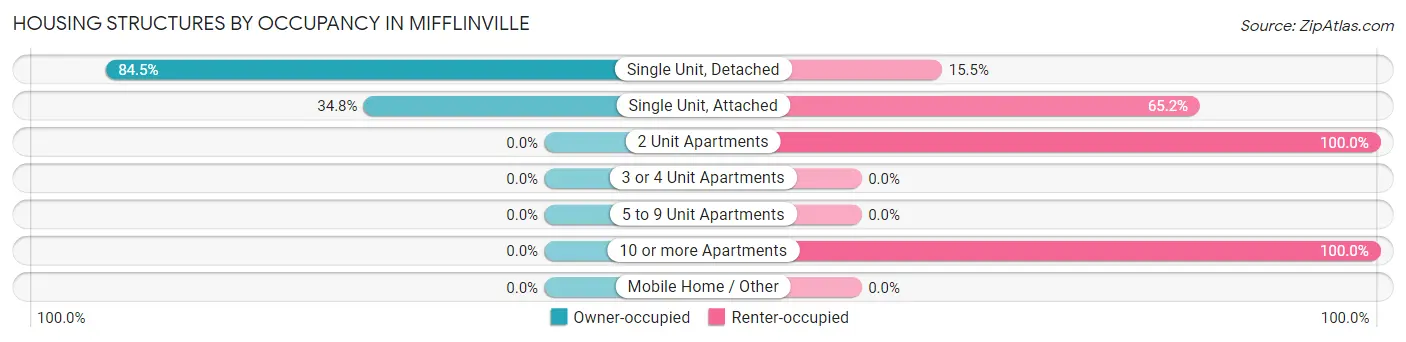
| Structure Type | Owner-occupied | Renter-occupied |
| Single Unit, Detached | 392 (84.5%) | 72 (15.5%) |
| Single Unit, Attached | 16 (34.8%) | 30 (65.2%) |
| 2 Unit Apartments | 0 (0.0%) | 1 (100.0%) |
| 3 or 4 Unit Apartments | 0 (0.0%) | 0 (0.0%) |
| 5 to 9 Unit Apartments | 0 (0.0%) | 0 (0.0%) |
| 10 or more Apartments | 0 (0.0%) | 17 (100.0%) |
| Mobile Home / Other | 0 (0.0%) | 0 (0.0%) |
| Total | 408 (77.3%) | 120 (22.7%) |
Housing Structures by Number of Rooms in Mifflinville
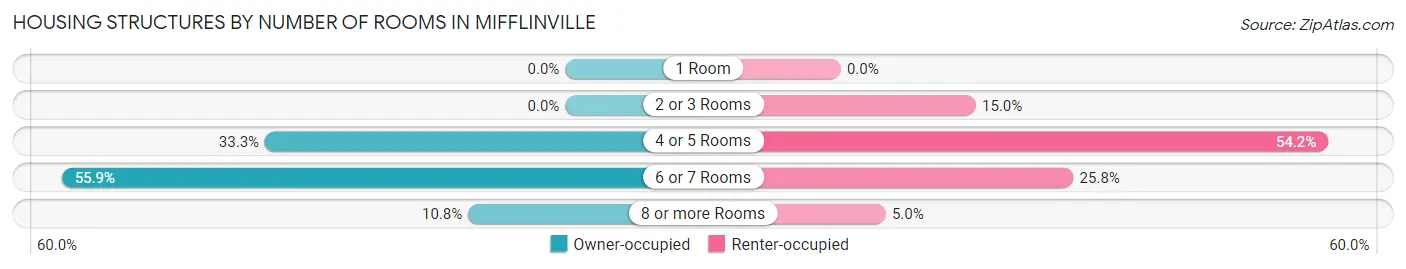
| Number of Rooms | Owner-occupied | Renter-occupied |
| 1 Room | 0 (0.0%) | 0 (0.0%) |
| 2 or 3 Rooms | 0 (0.0%) | 18 (15.0%) |
| 4 or 5 Rooms | 136 (33.3%) | 65 (54.2%) |
| 6 or 7 Rooms | 228 (55.9%) | 31 (25.8%) |
| 8 or more Rooms | 44 (10.8%) | 6 (5.0%) |
| Total | 408 (100.0%) | 120 (100.0%) |
Housing Structure by Heating Type in Mifflinville
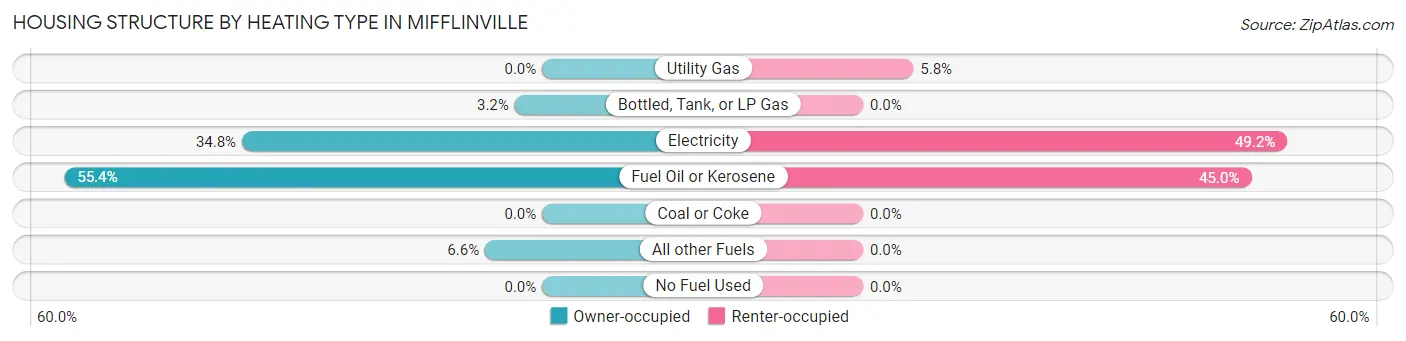
| Heating Type | Owner-occupied | Renter-occupied |
| Utility Gas | 0 (0.0%) | 7 (5.8%) |
| Bottled, Tank, or LP Gas | 13 (3.2%) | 0 (0.0%) |
| Electricity | 142 (34.8%) | 59 (49.2%) |
| Fuel Oil or Kerosene | 226 (55.4%) | 54 (45.0%) |
| Coal or Coke | 0 (0.0%) | 0 (0.0%) |
| All other Fuels | 27 (6.6%) | 0 (0.0%) |
| No Fuel Used | 0 (0.0%) | 0 (0.0%) |
| Total | 408 (100.0%) | 120 (100.0%) |
Household Vehicle Usage in Mifflinville
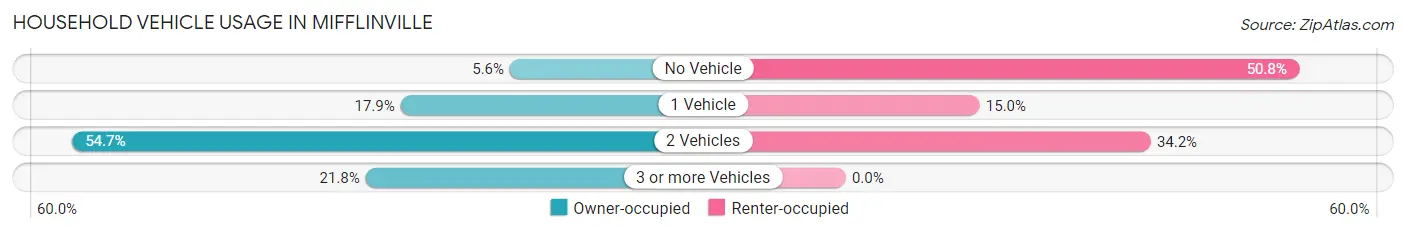
| Vehicles per Household | Owner-occupied | Renter-occupied |
| No Vehicle | 23 (5.6%) | 61 (50.8%) |
| 1 Vehicle | 73 (17.9%) | 18 (15.0%) |
| 2 Vehicles | 223 (54.7%) | 41 (34.2%) |
| 3 or more Vehicles | 89 (21.8%) | 0 (0.0%) |
| Total | 408 (100.0%) | 120 (100.0%) |
Real Estate & Mortgages in Mifflinville
Real Estate and Mortgage Overview in Mifflinville
| Characteristic | Without Mortgage | With Mortgage |
| Housing Units | 267 | 141 |
| Median Property Value | $185,800 | $177,100 |
| Median Household Income | $45,847 | $20 |
| Monthly Housing Costs | $530 | $0 |
| Real Estate Taxes | $2,509 | $0 |
Property Value by Mortgage Status in Mifflinville
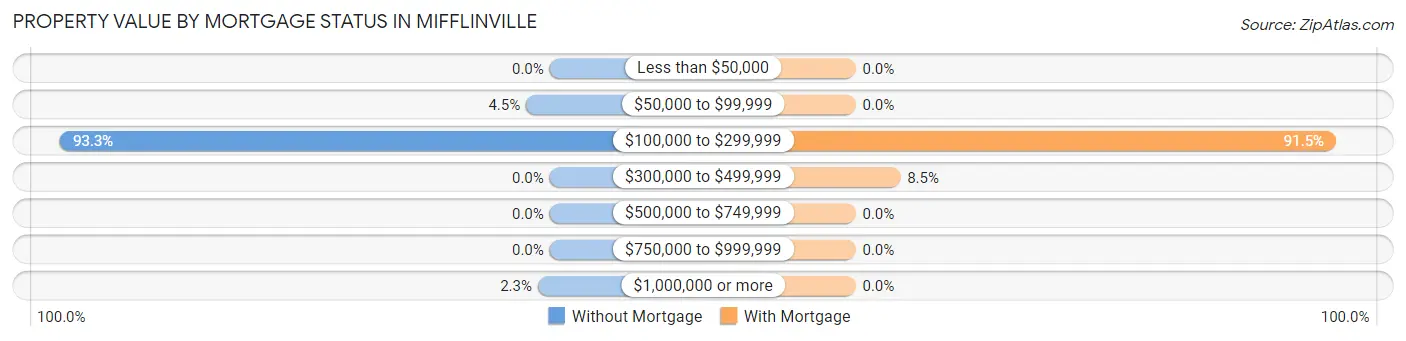
| Property Value | Without Mortgage | With Mortgage |
| Less than $50,000 | 0 (0.0%) | 0 (0.0%) |
| $50,000 to $99,999 | 12 (4.5%) | 0 (0.0%) |
| $100,000 to $299,999 | 249 (93.3%) | 129 (91.5%) |
| $300,000 to $499,999 | 0 (0.0%) | 12 (8.5%) |
| $500,000 to $749,999 | 0 (0.0%) | 0 (0.0%) |
| $750,000 to $999,999 | 0 (0.0%) | 0 (0.0%) |
| $1,000,000 or more | 6 (2.2%) | 0 (0.0%) |
| Total | 267 (100.0%) | 141 (100.0%) |
Household Income by Mortgage Status in Mifflinville
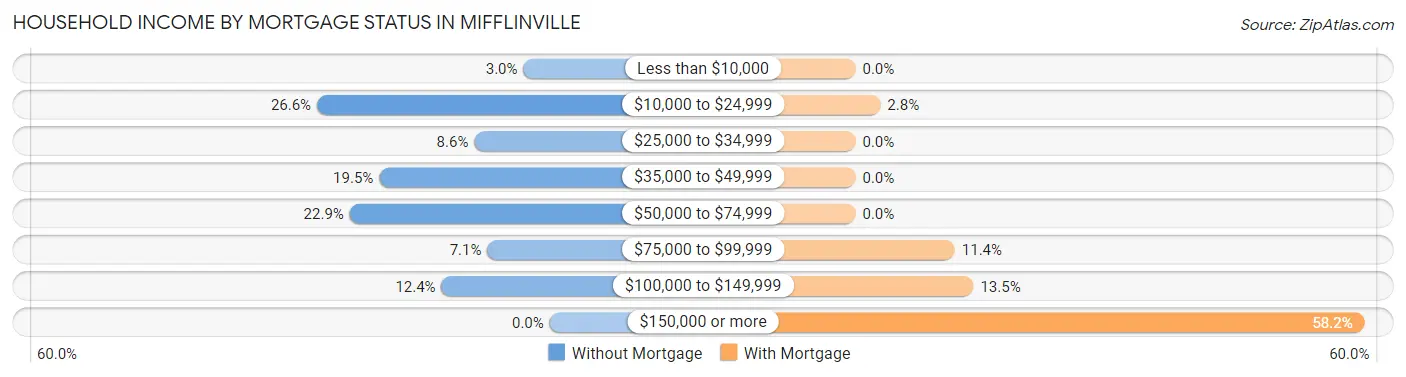
| Household Income | Without Mortgage | With Mortgage |
| Less than $10,000 | 8 (3.0%) | 0 (0.0%) |
| $10,000 to $24,999 | 71 (26.6%) | 4 (2.8%) |
| $25,000 to $34,999 | 23 (8.6%) | 0 (0.0%) |
| $35,000 to $49,999 | 52 (19.5%) | 0 (0.0%) |
| $50,000 to $74,999 | 61 (22.9%) | 0 (0.0%) |
| $75,000 to $99,999 | 19 (7.1%) | 16 (11.4%) |
| $100,000 to $149,999 | 33 (12.4%) | 19 (13.5%) |
| $150,000 or more | 0 (0.0%) | 82 (58.2%) |
| Total | 267 (100.0%) | 141 (100.0%) |
Property Value to Household Income Ratio in Mifflinville
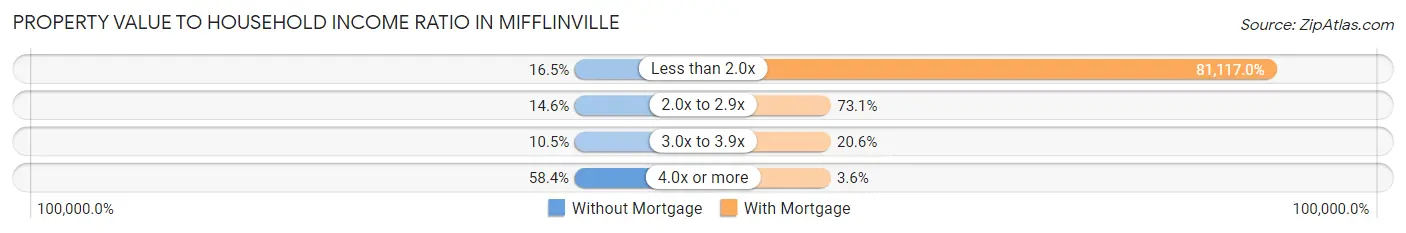
| Value-to-Income Ratio | Without Mortgage | With Mortgage |
| Less than 2.0x | 44 (16.5%) | 114,375 (81,117.0%) |
| 2.0x to 2.9x | 39 (14.6%) | 103 (73.1%) |
| 3.0x to 3.9x | 28 (10.5%) | 29 (20.6%) |
| 4.0x or more | 156 (58.4%) | 5 (3.5%) |
| Total | 267 (100.0%) | 141 (100.0%) |
Real Estate Taxes by Mortgage Status in Mifflinville
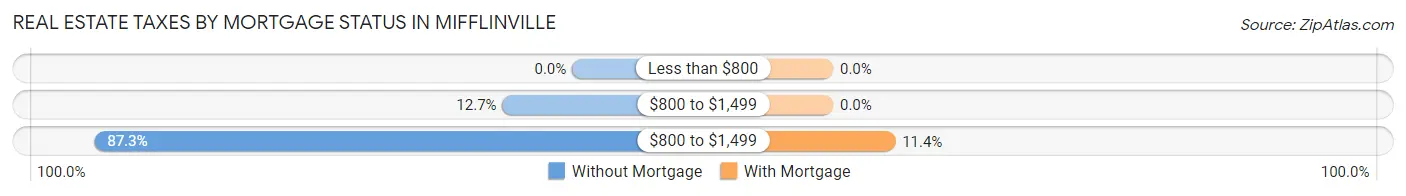
| Property Taxes | Without Mortgage | With Mortgage |
| Less than $800 | 0 (0.0%) | 0 (0.0%) |
| $800 to $1,499 | 34 (12.7%) | 0 (0.0%) |
| $800 to $1,499 | 233 (87.3%) | 16 (11.4%) |
| Total | 267 (100.0%) | 141 (100.0%) |
Health & Disability in Mifflinville
Health Insurance Coverage by Age in Mifflinville
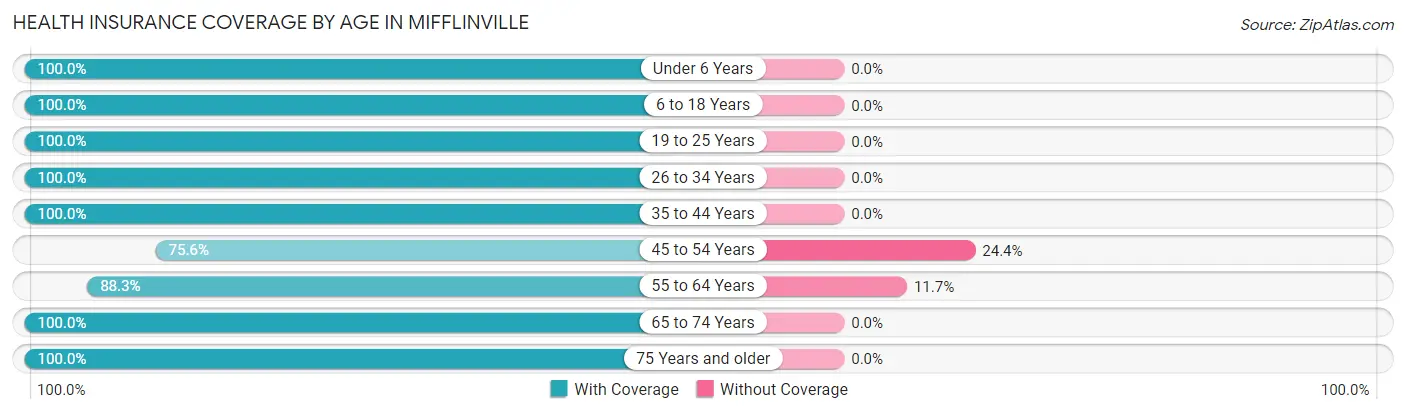
| Age Bracket | With Coverage | Without Coverage |
| Under 6 Years | 64 (100.0%) | 0 (0.0%) |
| 6 to 18 Years | 132 (100.0%) | 0 (0.0%) |
| 19 to 25 Years | 104 (100.0%) | 0 (0.0%) |
| 26 to 34 Years | 147 (100.0%) | 0 (0.0%) |
| 35 to 44 Years | 115 (100.0%) | 0 (0.0%) |
| 45 to 54 Years | 136 (75.6%) | 44 (24.4%) |
| 55 to 64 Years | 204 (88.3%) | 27 (11.7%) |
| 65 to 74 Years | 139 (100.0%) | 0 (0.0%) |
| 75 Years and older | 92 (100.0%) | 0 (0.0%) |
| Total | 1,133 (94.1%) | 71 (5.9%) |
Health Insurance Coverage by Citizenship Status in Mifflinville
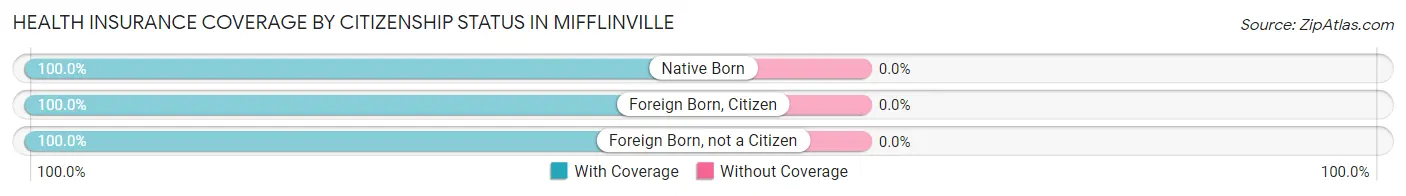
| Citizenship Status | With Coverage | Without Coverage |
| Native Born | 64 (100.0%) | 0 (0.0%) |
| Foreign Born, Citizen | 132 (100.0%) | 0 (0.0%) |
| Foreign Born, not a Citizen | 104 (100.0%) | 0 (0.0%) |
Health Insurance Coverage by Household Income in Mifflinville
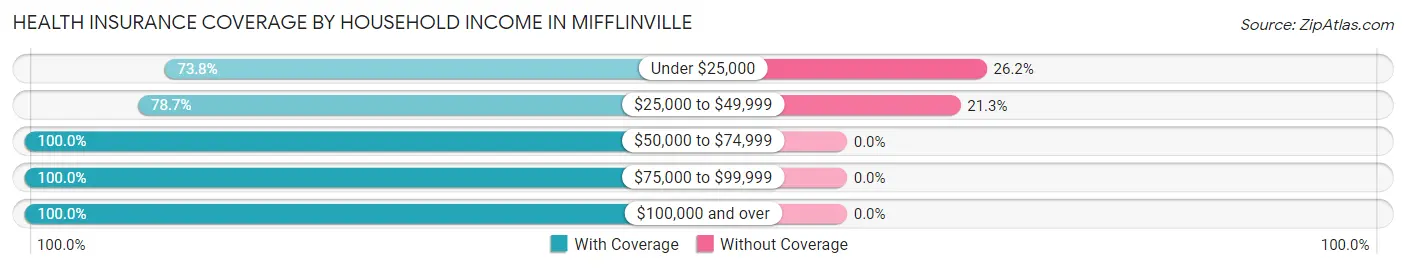
| Household Income | With Coverage | Without Coverage |
| Under $25,000 | 124 (73.8%) | 44 (26.2%) |
| $25,000 to $49,999 | 100 (78.7%) | 27 (21.3%) |
| $50,000 to $74,999 | 292 (100.0%) | 0 (0.0%) |
| $75,000 to $99,999 | 93 (100.0%) | 0 (0.0%) |
| $100,000 and over | 524 (100.0%) | 0 (0.0%) |
Public vs Private Health Insurance Coverage by Age in Mifflinville
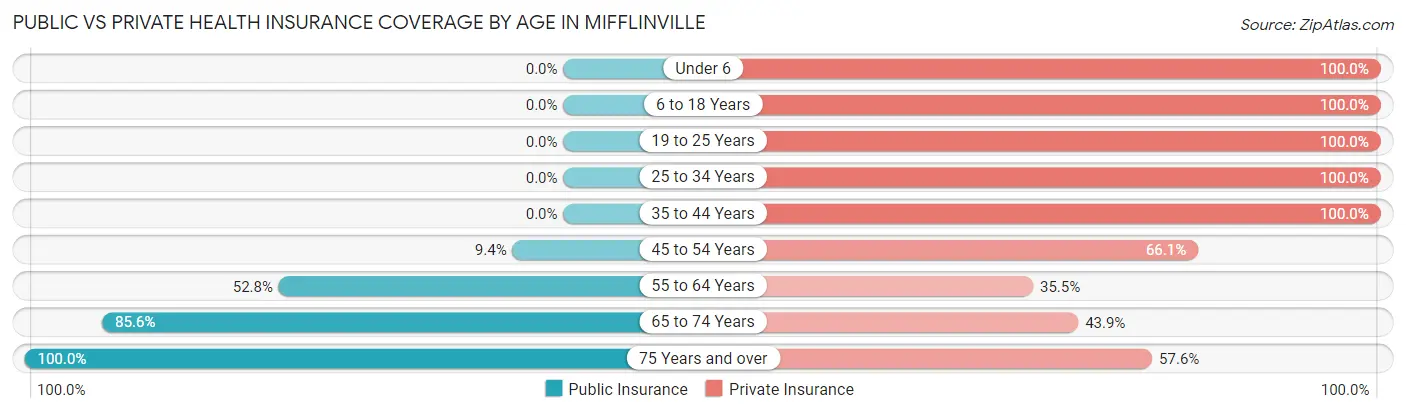
| Age Bracket | Public Insurance | Private Insurance |
| Under 6 | 0 (0.0%) | 64 (100.0%) |
| 6 to 18 Years | 0 (0.0%) | 132 (100.0%) |
| 19 to 25 Years | 0 (0.0%) | 104 (100.0%) |
| 25 to 34 Years | 0 (0.0%) | 147 (100.0%) |
| 35 to 44 Years | 0 (0.0%) | 115 (100.0%) |
| 45 to 54 Years | 17 (9.4%) | 119 (66.1%) |
| 55 to 64 Years | 122 (52.8%) | 82 (35.5%) |
| 65 to 74 Years | 119 (85.6%) | 61 (43.9%) |
| 75 Years and over | 92 (100.0%) | 53 (57.6%) |
| Total | 350 (29.1%) | 877 (72.8%) |
Disability Status by Sex by Age in Mifflinville
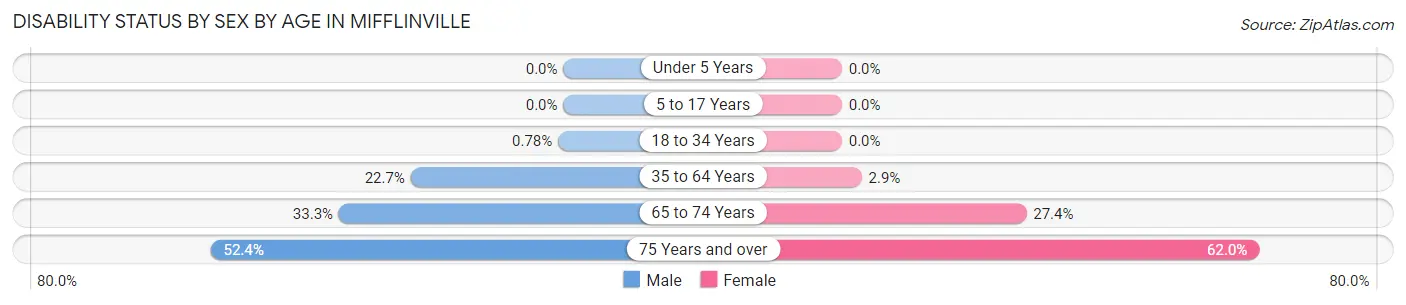
| Age Bracket | Male | Female |
| Under 5 Years | 0 (0.0%) | 0 (0.0%) |
| 5 to 17 Years | 0 (0.0%) | 0 (0.0%) |
| 18 to 34 Years | 1 (0.8%) | 0 (0.0%) |
| 35 to 64 Years | 73 (22.7%) | 6 (2.9%) |
| 65 to 74 Years | 22 (33.3%) | 20 (27.4%) |
| 75 Years and over | 11 (52.4%) | 44 (62.0%) |
Disability Class by Sex by Age in Mifflinville
Disability Class: Hearing Difficulty
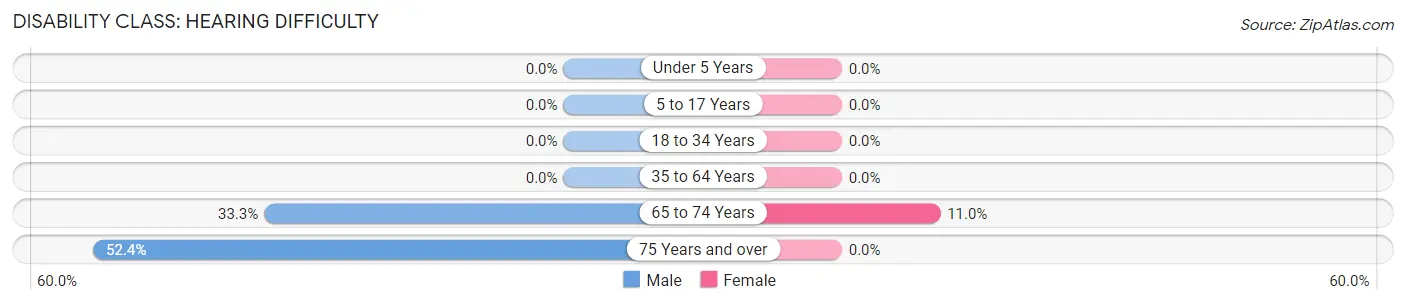
| Age Bracket | Male | Female |
| Under 5 Years | 0 (0.0%) | 0 (0.0%) |
| 5 to 17 Years | 0 (0.0%) | 0 (0.0%) |
| 18 to 34 Years | 0 (0.0%) | 0 (0.0%) |
| 35 to 64 Years | 0 (0.0%) | 0 (0.0%) |
| 65 to 74 Years | 22 (33.3%) | 8 (11.0%) |
| 75 Years and over | 11 (52.4%) | 0 (0.0%) |
Disability Class: Vision Difficulty
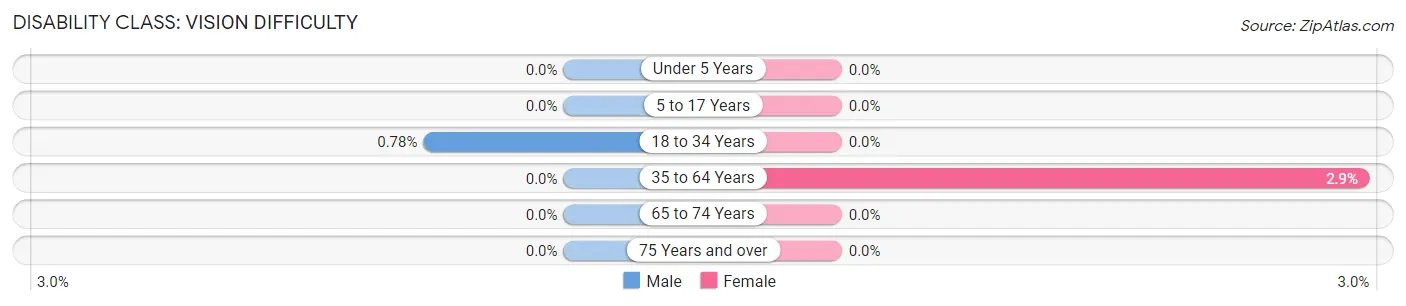
| Age Bracket | Male | Female |
| Under 5 Years | 0 (0.0%) | 0 (0.0%) |
| 5 to 17 Years | 0 (0.0%) | 0 (0.0%) |
| 18 to 34 Years | 1 (0.8%) | 0 (0.0%) |
| 35 to 64 Years | 0 (0.0%) | 6 (2.9%) |
| 65 to 74 Years | 0 (0.0%) | 0 (0.0%) |
| 75 Years and over | 0 (0.0%) | 0 (0.0%) |
Disability Class: Cognitive Difficulty
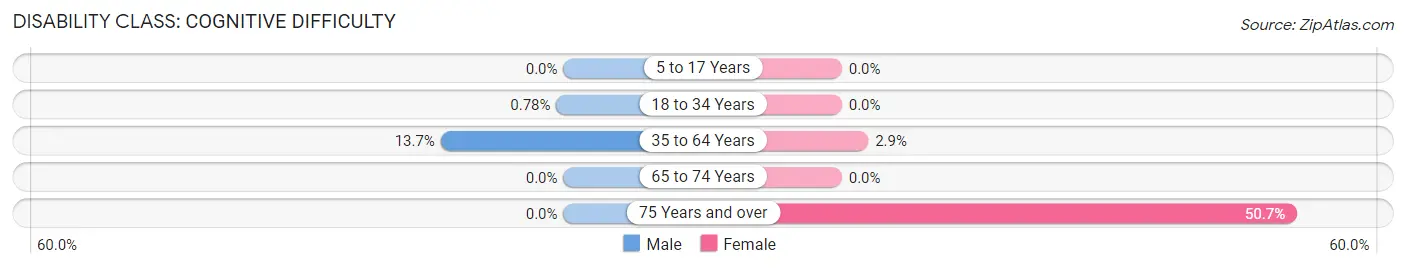
| Age Bracket | Male | Female |
| 5 to 17 Years | 0 (0.0%) | 0 (0.0%) |
| 18 to 34 Years | 1 (0.8%) | 0 (0.0%) |
| 35 to 64 Years | 44 (13.7%) | 6 (2.9%) |
| 65 to 74 Years | 0 (0.0%) | 0 (0.0%) |
| 75 Years and over | 0 (0.0%) | 36 (50.7%) |
Disability Class: Ambulatory Difficulty
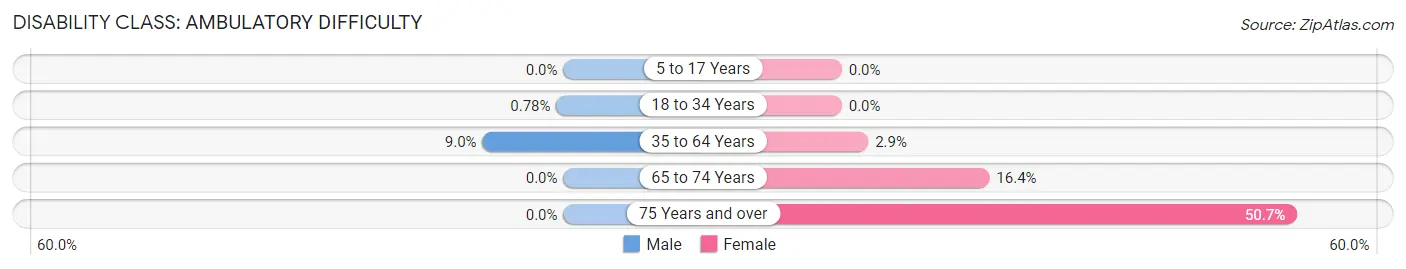
| Age Bracket | Male | Female |
| 5 to 17 Years | 0 (0.0%) | 0 (0.0%) |
| 18 to 34 Years | 1 (0.8%) | 0 (0.0%) |
| 35 to 64 Years | 29 (9.0%) | 6 (2.9%) |
| 65 to 74 Years | 0 (0.0%) | 12 (16.4%) |
| 75 Years and over | 0 (0.0%) | 36 (50.7%) |
Disability Class: Self-Care Difficulty
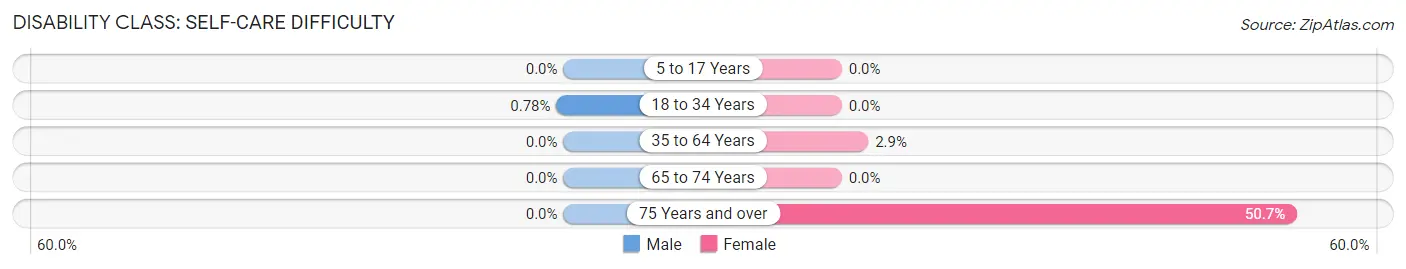
| Age Bracket | Male | Female |
| 5 to 17 Years | 0 (0.0%) | 0 (0.0%) |
| 18 to 34 Years | 1 (0.8%) | 0 (0.0%) |
| 35 to 64 Years | 0 (0.0%) | 6 (2.9%) |
| 65 to 74 Years | 0 (0.0%) | 0 (0.0%) |
| 75 Years and over | 0 (0.0%) | 36 (50.7%) |
Technology Access in Mifflinville
Computing Device Access in Mifflinville
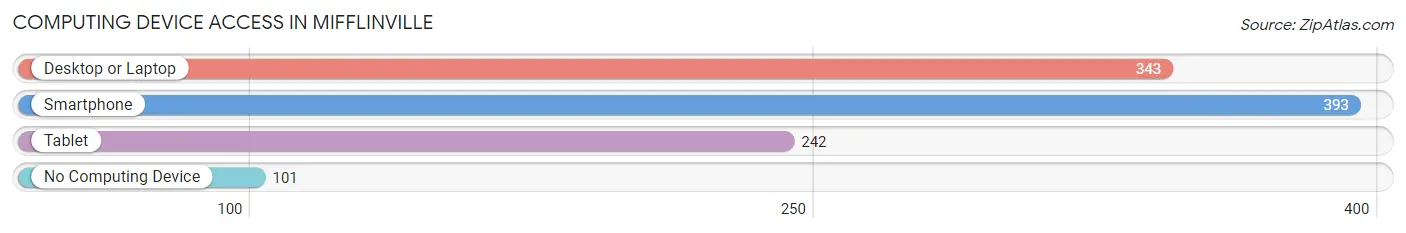
| Device Type | # Households | % Households |
| Desktop or Laptop | 343 | 65.0% |
| Smartphone | 393 | 74.4% |
| Tablet | 242 | 45.8% |
| No Computing Device | 101 | 19.1% |
| Total | 528 | 100.0% |
Internet Access in Mifflinville
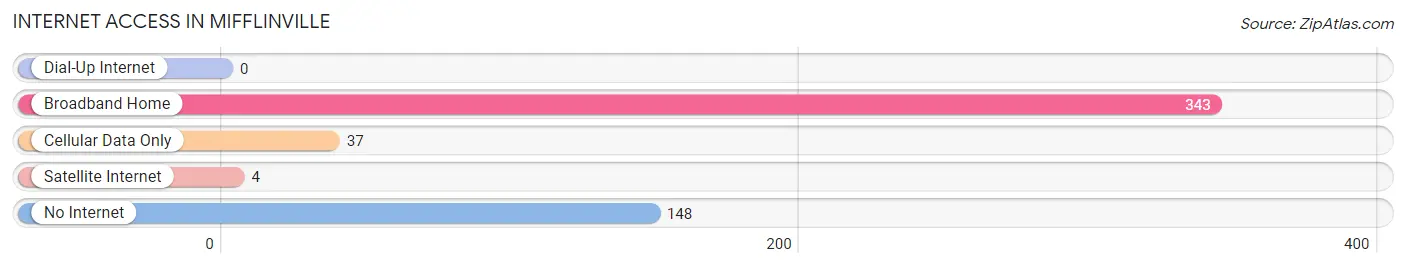
| Internet Type | # Households | % Households |
| Dial-Up Internet | 0 | 0.0% |
| Broadband Home | 343 | 65.0% |
| Cellular Data Only | 37 | 7.0% |
| Satellite Internet | 4 | 0.8% |
| No Internet | 148 | 28.0% |
| Total | 528 | 100.0% |
Mifflinville Summary
Mifflinville is a borough located in Columbia County, Pennsylvania, United States. The population was 1,093 at the 2010 census. It is part of the Bloomsburg–Berwick Metropolitan Statistical Area.
History
Mifflinville was founded in 1832 by John Mifflin, a local landowner. The town was originally known as Mifflin's Crossroads, and was later renamed Mifflinville. The town was incorporated in 1867.
Mifflinville was a major stop on the Bloomsburg and Sullivan Railroad, which ran from Bloomsburg to Sullivan County. The railroad was built in 1871 and operated until the 1950s.
Geography
Mifflinville is located at 40 59 45 North 76 25 45 West 40 995833 76 429167
According to the United States Census Bureau, the borough has a total area of 0.3 square miles (0.8 km2), all of it land.
Demographics
As of the census of 2000, there were 1,093 people, 441 households, and 298 families residing in the borough. The population density was 3,717.2 people per square mile (1,437.2/km2). There were 471 housing units at an average density of 1,597.2 per square mile (616.2/km2). The racial makeup of the borough was 98.90% White, 0.09% African American, 0.09% Native American, 0.09% Asian, 0.09% from other races, and 0.73% from two or more races. Hispanic or Latino of any race were 0.37% of the population.
There were 441 households, out of which 30.2% had children under the age of 18 living with them, 51.6% were married couples living together, 10.2% had a female householder with no husband present, and 33.7% were non-families. 29.2% of all households were made up of individuals, and 14.3% had someone living alone who was 65 years of age or older. The average household size was 2.48 and the average family size was 3.06.
In the borough the population was spread out, with 24.7% under the age of 18, 8.2% from 18 to 24, 28.2% from 25 to 44, 22.2% from 45 to 64, and 16.7% who were 65 years of age or older. The median age was 38 years. For every 100 females, there were 91.2 males. For every 100 females age 18 and over, there were 87.2 males.
The median income for a household in the borough was $35,000, and the median income for a family was $41,250. Males had a median income of $30,000 versus $21,250 for females. The per capita income for the borough was $16,845. About 6.2% of families and 8.2% of the population were below the poverty line, including 8.3% of those under age 18 and 8.3% of those age 65 or over.
Economy
Mifflinville is home to several small businesses, including a grocery store, a hardware store, a pharmacy, and a few restaurants. The town is also home to a number of manufacturing companies, including a plastics manufacturer, a metal fabricator, and a paper mill.
The town is served by the Bloomsburg-Berwick Airport, which is located just outside of town. The airport offers flights to Philadelphia, Pittsburgh, and other cities in the region.
The town is also home to a number of recreational facilities, including a golf course, a swimming pool, and a number of parks. The town also hosts a number of annual events, including a Fourth of July celebration and a Christmas parade.
Common Questions
What is Per Capita Income in Mifflinville?
Per Capita income in Mifflinville is $30,647.
What is the Median Family Income in Mifflinville?
Median Family Income in Mifflinville is $80,441.
What is the Median Household income in Mifflinville?
Median Household Income in Mifflinville is $52,153.
What is Income or Wage Gap in Mifflinville?
Income or Wage Gap in Mifflinville is 8.5%.
Women in Mifflinville earn 91.5 cents for every dollar earned by a man.
What is Inequality or Gini Index in Mifflinville?
Inequality or Gini Index in Mifflinville is 0.44.
What is the Total Population of Mifflinville?
Total Population of Mifflinville is 1,204.
What is the Total Male Population of Mifflinville?
Total Male Population of Mifflinville is 651.
What is the Total Female Population of Mifflinville?
Total Female Population of Mifflinville is 553.
What is the Ratio of Males per 100 Females in Mifflinville?
There are 117.72 Males per 100 Females in Mifflinville.
What is the Ratio of Females per 100 Males in Mifflinville?
There are 84.95 Females per 100 Males in Mifflinville.
What is the Median Population Age in Mifflinville?
Median Population Age in Mifflinville is 46.7 Years.
What is the Average Family Size in Mifflinville
Average Family Size in Mifflinville is 3.1 People.
What is the Average Household Size in Mifflinville
Average Household Size in Mifflinville is 2.3 People.
How Large is the Labor Force in Mifflinville?
There are 629 People in the Labor Forcein in Mifflinville.
What is the Percentage of People in the Labor Force in Mifflinville?
61.1% of People are in the Labor Force in Mifflinville.