Zip Codes with the Highest Percentage of Population with a Degree in Education in Illinois
RELATED REPORTS & OPTIONS
Education
Illinois
Compare Zip Codes
Map of Zip Codes with the Highest Percentage of Population with a Degree in Education in Illinois
30.0%
100.0%
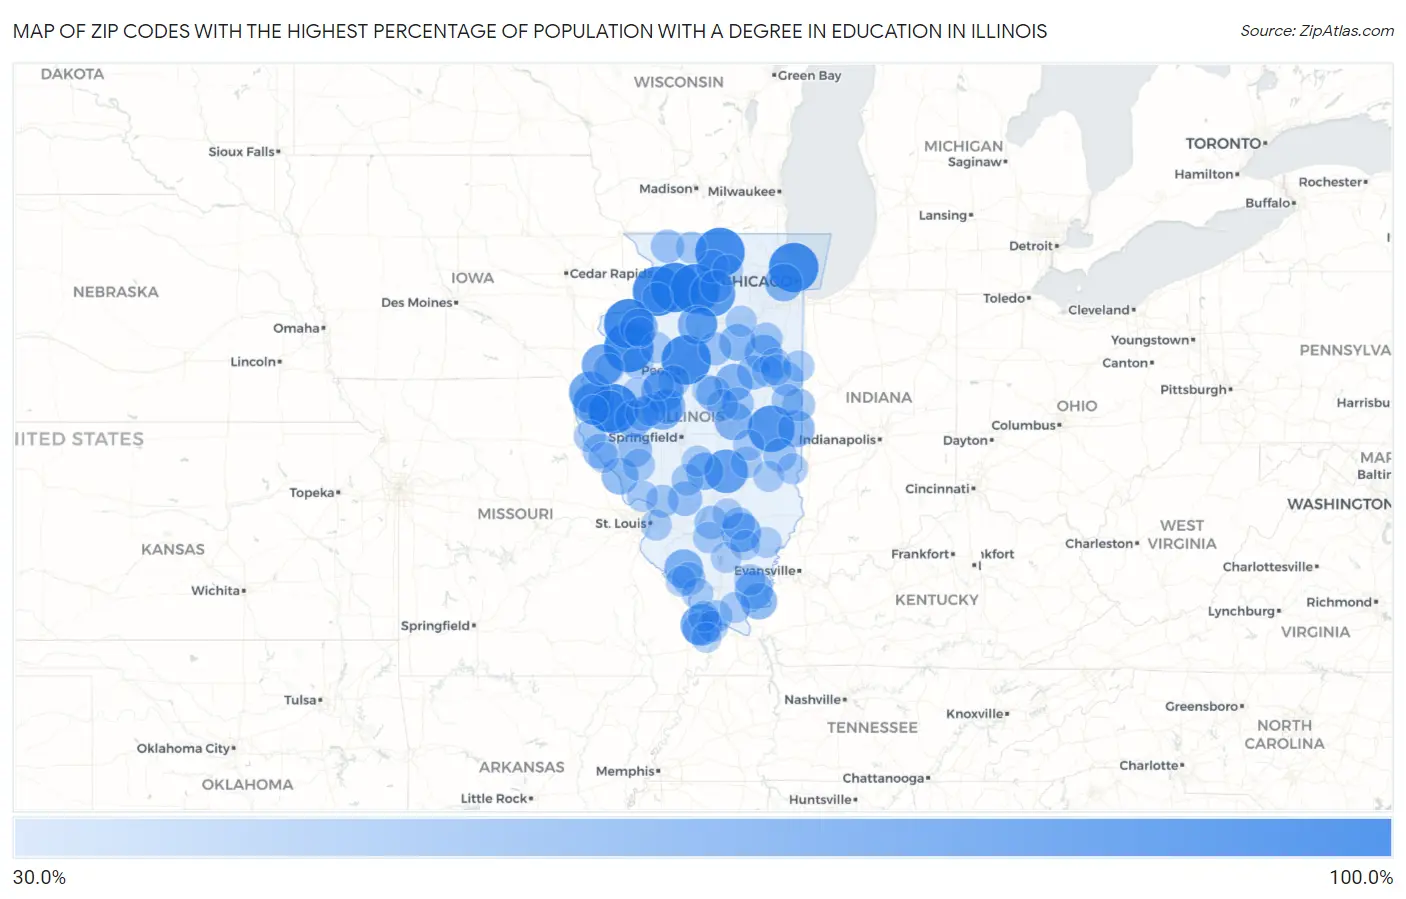
Zip Codes with the Highest Percentage of Population with a Degree in Education in Illinois
| Zip Code | % Graduates | vs State | vs National | |
| 1. | 61251 | 100.0% | 11.6% (+88.4)#1 | 11.1% (+88.9)#84 |
| 2. | 61552 | 100.0% | 11.6% (+88.4)#2 | 11.1% (+88.9)#140 |
| 3. | 60208 | 100.0% | 11.6% (+88.4)#3 | 11.1% (+88.9)#151 |
| 4. | 61435 | 100.0% | 11.6% (+88.4)#4 | 11.1% (+88.9)#173 |
| 5. | 61112 | 100.0% | 11.6% (+88.4)#5 | 11.1% (+88.9)#205 |
| 6. | 61037 | 100.0% | 11.6% (+88.4)#6 | 11.1% (+88.9)#214 |
| 7. | 61324 | 100.0% | 11.6% (+88.4)#7 | 11.1% (+88.9)#233 |
| 8. | 61276 | 100.0% | 11.6% (+88.4)#8 | 11.1% (+88.9)#238 |
| 9. | 62344 | 100.0% | 11.6% (+88.4)#9 | 11.1% (+88.9)#299 |
| 10. | 61852 | 90.3% | 11.6% (+78.8)#10 | 11.1% (+79.3)#327 |
| 11. | 61318 | 86.7% | 11.6% (+75.1)#11 | 11.1% (+75.6)#343 |
| 12. | 62438 | 80.4% | 11.6% (+68.9)#12 | 11.1% (+69.4)#390 |
| 13. | 62380 | 75.0% | 11.6% (+63.4)#13 | 11.1% (+63.9)#447 |
| 14. | 62334 | 75.0% | 11.6% (+63.4)#14 | 11.1% (+63.9)#455 |
| 15. | 61543 | 75.0% | 11.6% (+63.4)#15 | 11.1% (+63.9)#456 |
| 16. | 62346 | 74.1% | 11.6% (+62.5)#16 | 11.1% (+63.0)#466 |
| 17. | 61425 | 73.5% | 11.6% (+61.9)#17 | 11.1% (+62.4)#468 |
| 18. | 62988 | 73.0% | 11.6% (+61.5)#18 | 11.1% (+62.0)#477 |
| 19. | 62655 | 66.7% | 11.6% (+55.1)#19 | 11.1% (+55.6)#551 |
| 20. | 62850 | 66.7% | 11.6% (+55.1)#20 | 11.1% (+55.6)#552 |
| 21. | 61315 | 66.7% | 11.6% (+55.1)#21 | 11.1% (+55.6)#560 |
| 22. | 62272 | 64.6% | 11.6% (+53.0)#22 | 11.1% (+53.5)#621 |
| 23. | 61830 | 62.5% | 11.6% (+50.9)#23 | 11.1% (+51.4)#672 |
| 24. | 61468 | 62.2% | 11.6% (+50.7)#24 | 11.1% (+51.2)#684 |
| 25. | 60141 | 61.7% | 11.6% (+50.2)#25 | 11.1% (+50.7)#697 |
| 26. | 62934 | 61.6% | 11.6% (+50.1)#26 | 11.1% (+50.6)#700 |
| 27. | 60946 | 61.2% | 11.6% (+49.7)#27 | 11.1% (+50.2)#711 |
| 28. | 62639 | 60.9% | 11.6% (+49.3)#28 | 11.1% (+49.8)#724 |
| 29. | 61730 | 60.0% | 11.6% (+48.4)#29 | 11.1% (+48.9)#742 |
| 30. | 62076 | 60.0% | 11.6% (+48.4)#30 | 11.1% (+48.9)#752 |
| 31. | 61870 | 59.0% | 11.6% (+47.5)#31 | 11.1% (+48.0)#782 |
| 32. | 62045 | 58.0% | 11.6% (+46.4)#32 | 11.1% (+46.9)#813 |
| 33. | 61313 | 57.5% | 11.6% (+45.9)#33 | 11.1% (+46.4)#829 |
| 34. | 62931 | 57.4% | 11.6% (+45.9)#34 | 11.1% (+46.4)#830 |
| 35. | 62633 | 54.5% | 11.6% (+43.0)#35 | 11.1% (+43.5)#935 |
| 36. | 61772 | 52.9% | 11.6% (+41.4)#36 | 11.1% (+41.9)#1,011 |
| 37. | 62356 | 51.2% | 11.6% (+39.6)#37 | 11.1% (+40.1)#1,090 |
| 38. | 62086 | 50.6% | 11.6% (+39.1)#38 | 11.1% (+39.6)#1,120 |
| 39. | 62694 | 50.3% | 11.6% (+38.8)#39 | 11.1% (+39.2)#1,131 |
| 40. | 62624 | 50.0% | 11.6% (+38.4)#40 | 11.1% (+38.9)#1,192 |
| 41. | 61775 | 50.0% | 11.6% (+38.4)#41 | 11.1% (+38.9)#1,196 |
| 42. | 60926 | 50.0% | 11.6% (+38.4)#42 | 11.1% (+38.9)#1,242 |
| 43. | 62882 | 47.6% | 11.6% (+36.1)#43 | 11.1% (+36.6)#1,357 |
| 44. | 62907 | 47.6% | 11.6% (+36.0)#44 | 11.1% (+36.5)#1,363 |
| 45. | 61044 | 47.5% | 11.6% (+36.0)#45 | 11.1% (+36.5)#1,364 |
| 46. | 61933 | 47.4% | 11.6% (+35.8)#46 | 11.1% (+36.3)#1,368 |
| 47. | 61358 | 47.4% | 11.6% (+35.8)#47 | 11.1% (+36.3)#1,370 |
| 48. | 61043 | 46.2% | 11.6% (+34.6)#48 | 11.1% (+35.1)#1,472 |
| 49. | 62899 | 46.0% | 11.6% (+34.4)#49 | 11.1% (+34.9)#1,479 |
| 50. | 61842 | 45.8% | 11.6% (+34.2)#50 | 11.1% (+34.7)#1,494 |
| 51. | 62067 | 45.6% | 11.6% (+34.0)#51 | 11.1% (+34.5)#1,506 |
| 52. | 60553 | 45.5% | 11.6% (+34.0)#52 | 11.1% (+34.5)#1,512 |
| 53. | 62969 | 45.5% | 11.6% (+33.9)#53 | 11.1% (+34.4)#1,517 |
| 54. | 61814 | 45.4% | 11.6% (+33.8)#54 | 11.1% (+34.3)#1,535 |
| 55. | 60969 | 44.4% | 11.6% (+32.9)#55 | 11.1% (+33.4)#1,625 |
| 56. | 62092 | 44.4% | 11.6% (+32.8)#56 | 11.1% (+33.3)#1,630 |
| 57. | 61322 | 44.3% | 11.6% (+32.7)#57 | 11.1% (+33.2)#1,634 |
| 58. | 62360 | 44.3% | 11.6% (+32.7)#58 | 11.1% (+33.2)#1,635 |
| 59. | 62617 | 43.9% | 11.6% (+32.3)#59 | 11.1% (+32.8)#1,677 |
| 60. | 62923 | 43.2% | 11.6% (+31.7)#60 | 11.1% (+32.2)#1,734 |
| 61. | 61539 | 42.9% | 11.6% (+31.3)#61 | 11.1% (+31.8)#1,780 |
| 62. | 62015 | 42.7% | 11.6% (+31.1)#62 | 11.1% (+31.6)#1,798 |
| 63. | 61865 | 42.4% | 11.6% (+30.9)#63 | 11.1% (+31.3)#1,823 |
| 64. | 61777 | 42.3% | 11.6% (+30.8)#64 | 11.1% (+31.3)#1,830 |
| 65. | 61410 | 42.1% | 11.6% (+30.5)#65 | 11.1% (+31.0)#1,861 |
| 66. | 60938 | 41.7% | 11.6% (+30.1)#66 | 11.1% (+30.6)#1,897 |
| 67. | 61067 | 41.7% | 11.6% (+30.1)#67 | 11.1% (+30.6)#1,900 |
| 68. | 61485 | 41.5% | 11.6% (+30.0)#68 | 11.1% (+30.5)#1,928 |
| 69. | 60966 | 41.2% | 11.6% (+29.7)#69 | 11.1% (+30.2)#1,964 |
| 70. | 62848 | 41.2% | 11.6% (+29.6)#70 | 11.1% (+30.1)#1,971 |
| 71. | 61928 | 41.1% | 11.6% (+29.5)#71 | 11.1% (+30.0)#1,983 |
| 72. | 62975 | 41.1% | 11.6% (+29.5)#72 | 11.1% (+30.0)#1,989 |
| 73. | 62930 | 41.0% | 11.6% (+29.5)#73 | 11.1% (+30.0)#1,994 |
| 74. | 60968 | 41.0% | 11.6% (+29.4)#74 | 11.1% (+29.9)#2,005 |
| 75. | 62022 | 41.0% | 11.6% (+29.4)#75 | 11.1% (+29.9)#2,007 |
| 76. | 60955 | 40.7% | 11.6% (+29.2)#76 | 11.1% (+29.7)#2,048 |
| 77. | 61911 | 40.4% | 11.6% (+28.9)#77 | 11.1% (+29.4)#2,083 |
| 78. | 61360 | 40.2% | 11.6% (+28.6)#78 | 11.1% (+29.1)#2,113 |
| 79. | 62970 | 40.0% | 11.6% (+28.4)#79 | 11.1% (+28.9)#2,142 |
| 80. | 62556 | 40.0% | 11.6% (+28.4)#80 | 11.1% (+28.9)#2,145 |
| 81. | 62961 | 40.0% | 11.6% (+28.4)#81 | 11.1% (+28.9)#2,179 |
| 82. | 62203 | 40.0% | 11.6% (+28.4)#82 | 11.1% (+28.9)#2,185 |
| 83. | 62441 | 39.9% | 11.6% (+28.3)#83 | 11.1% (+28.8)#2,189 |
| 84. | 61480 | 39.8% | 11.6% (+28.2)#84 | 11.1% (+28.7)#2,193 |
| 85. | 62985 | 39.8% | 11.6% (+28.2)#85 | 11.1% (+28.7)#2,201 |
| 86. | 62428 | 39.7% | 11.6% (+28.2)#86 | 11.1% (+28.7)#2,205 |
| 87. | 60111 | 39.7% | 11.6% (+28.1)#87 | 11.1% (+28.6)#2,211 |
| 88. | 62846 | 39.3% | 11.6% (+27.8)#88 | 11.1% (+28.3)#2,248 |
| 89. | 61413 | 39.3% | 11.6% (+27.8)#89 | 11.1% (+28.3)#2,255 |
| 90. | 62833 | 39.3% | 11.6% (+27.7)#90 | 11.1% (+28.2)#2,267 |
| 91. | 62280 | 39.1% | 11.6% (+27.6)#91 | 11.1% (+28.1)#2,292 |
| 92. | 62370 | 39.1% | 11.6% (+27.6)#92 | 11.1% (+28.1)#2,295 |
| 93. | 62854 | 38.8% | 11.6% (+27.2)#93 | 11.1% (+27.7)#2,348 |
| 94. | 61774 | 38.8% | 11.6% (+27.2)#94 | 11.1% (+27.7)#2,353 |
| 95. | 61482 | 38.6% | 11.6% (+27.1)#95 | 11.1% (+27.6)#2,373 |
| 96. | 61524 | 38.5% | 11.6% (+26.9)#96 | 11.1% (+27.4)#2,395 |
| 97. | 62349 | 38.0% | 11.6% (+26.4)#97 | 11.1% (+26.9)#2,481 |
| 98. | 61250 | 37.9% | 11.6% (+26.3)#98 | 11.1% (+26.8)#2,505 |
| 99. | 62914 | 37.8% | 11.6% (+26.2)#99 | 11.1% (+26.7)#2,526 |
| 100. | 62895 | 37.6% | 11.6% (+26.0)#100 | 11.1% (+26.5)#2,549 |
Common Questions
What are the Top 10 Zip Codes with the Highest Percentage of Population with a Degree in Education in Illinois?
Top 10 Zip Codes with the Highest Percentage of Population with a Degree in Education in Illinois are:
What zip code has the Highest Percentage of Population with a Degree in Education in Illinois?
61251 has the Highest Percentage of Population with a Degree in Education in Illinois with 100.0%.
What is the Percentage of Population with a Degree in Education in the State of Illinois?
Percentage of Population with a Degree in Education in Illinois is 11.6%.
What is the Percentage of Population with a Degree in Education in the United States?
Percentage of Population with a Degree in Education in the United States is 11.1%.