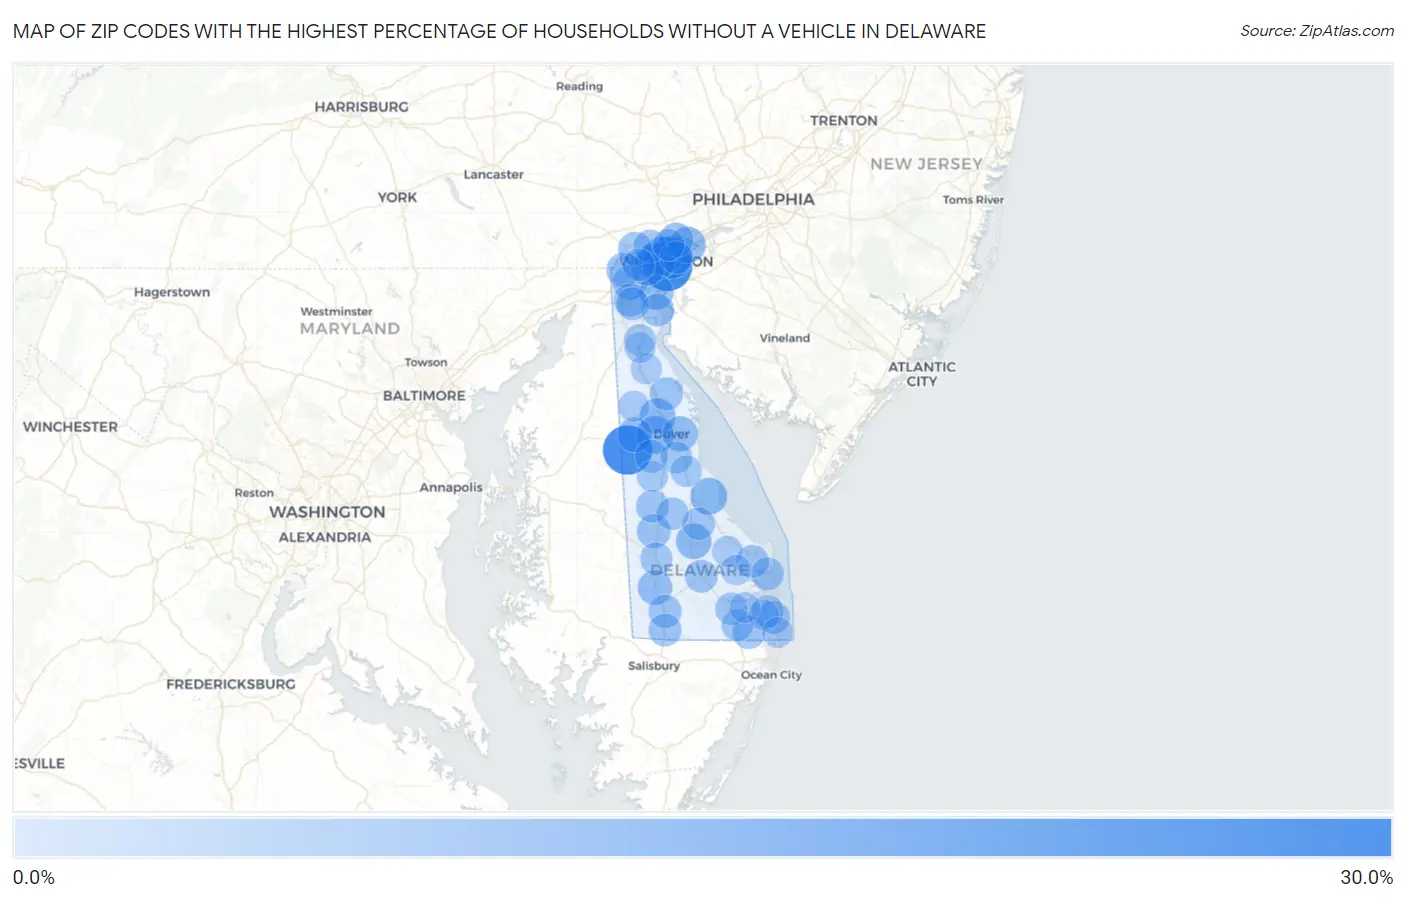
Zip Codes with the Highest Percentage of Households Without a Vehicle in Delaware
RELATED REPORTS & OPTIONS
Households without a Cars
Delaware
Compare Zip Codes
Map of Zip Codes with the Highest Percentage of Households Without a Vehicle in Delaware
0.0%
30.0%
Zip Codes with the Highest Percentage of Households Without a Vehicle in Delaware
| Zip Code | Housholds Without a Car | vs State | vs National | |
| 1. | 19801 | 29.4% | 6.1%(+23.3)#1 | 8.3%(+21.1)#830 |
| 2. | 19964 | 28.9% | 6.1%(+22.8)#2 | 8.3%(+20.6)#850 |
| 3. | 19802 | 18.7% | 6.1%(+12.6)#3 | 8.3%(+10.4)#1,679 |
| 4. | 19806 | 13.3% | 6.1%(+7.20)#4 | 8.3%(+5.00)#2,977 |
| 5. | 19805 | 11.8% | 6.1%(+5.70)#5 | 8.3%(+3.50)#3,660 |
| 6. | 19904 | 11.0% | 6.1%(+4.90)#6 | 8.3%(+2.70)#4,127 |
| 7. | 19963 | 9.9% | 6.1%(+3.80)#7 | 8.3%(+1.60)#4,943 |
| 8. | 19703 | 9.4% | 6.1%(+3.30)#8 | 8.3%(+1.10)#5,353 |
| 9. | 19936 | 8.6% | 6.1%(+2.50)#9 | 8.3%(+0.300)#6,290 |
| 10. | 19941 | 8.0% | 6.1%(+1.90)#10 | 8.3%(-0.300)#6,999 |
| 11. | 19901 | 7.5% | 6.1%(+1.40)#11 | 8.3%(-0.800)#7,687 |
| 12. | 19953 | 6.8% | 6.1%(+0.700)#12 | 8.3%(-1.50)#8,914 |
| 13. | 19713 | 6.7% | 6.1%(+0.600)#13 | 8.3%(-1.60)#9,020 |
| 14. | 19720 | 6.5% | 6.1%(+0.400)#14 | 8.3%(-1.80)#9,352 |
| 15. | 19973 | 6.5% | 6.1%(+0.400)#15 | 8.3%(-1.80)#9,397 |
| 16. | 19711 | 6.2% | 6.1%(+0.100)#16 | 8.3%(-2.10)#9,971 |
| 17. | 19810 | 6.2% | 6.1%(+0.100)#17 | 8.3%(-2.10)#10,017 |
| 18. | 19804 | 5.4% | 6.1%(-0.700)#18 | 8.3%(-2.90)#11,881 |
| 19. | 19950 | 5.2% | 6.1%(-0.900)#19 | 8.3%(-3.10)#12,427 |
| 20. | 19707 | 5.1% | 6.1%(-1.00)#20 | 8.3%(-3.20)#12,647 |
| 21. | 19977 | 4.3% | 6.1%(-1.80)#21 | 8.3%(-4.00)#14,807 |
| 22. | 19807 | 4.1% | 6.1%(-2.00)#22 | 8.3%(-4.20)#15,483 |
| 23. | 19956 | 4.0% | 6.1%(-2.10)#23 | 8.3%(-4.30)#15,759 |
| 24. | 19975 | 4.0% | 6.1%(-2.10)#24 | 8.3%(-4.30)#15,784 |
| 25. | 19940 | 3.9% | 6.1%(-2.20)#25 | 8.3%(-4.40)#16,128 |
| 26. | 19702 | 3.8% | 6.1%(-2.30)#26 | 8.3%(-4.50)#16,309 |
| 27. | 19952 | 3.8% | 6.1%(-2.30)#27 | 8.3%(-4.50)#16,420 |
| 28. | 19958 | 3.7% | 6.1%(-2.40)#28 | 8.3%(-4.60)#16,671 |
| 29. | 19971 | 3.7% | 6.1%(-2.40)#29 | 8.3%(-4.60)#16,724 |
| 30. | 19701 | 3.6% | 6.1%(-2.50)#30 | 8.3%(-4.70)#16,971 |
| 31. | 19947 | 3.6% | 6.1%(-2.50)#31 | 8.3%(-4.70)#17,045 |
| 32. | 19706 | 3.6% | 6.1%(-2.50)#32 | 8.3%(-4.70)#17,173 |
| 33. | 19934 | 3.5% | 6.1%(-2.60)#33 | 8.3%(-4.80)#17,384 |
| 34. | 19960 | 3.5% | 6.1%(-2.60)#34 | 8.3%(-4.80)#17,434 |
| 35. | 19930 | 3.5% | 6.1%(-2.60)#35 | 8.3%(-4.80)#17,490 |
| 36. | 19809 | 3.4% | 6.1%(-2.70)#36 | 8.3%(-4.90)#17,678 |
| 37. | 19933 | 3.3% | 6.1%(-2.80)#37 | 8.3%(-5.00)#18,067 |
| 38. | 19954 | 3.3% | 6.1%(-2.80)#38 | 8.3%(-5.00)#18,203 |
| 39. | 19808 | 3.1% | 6.1%(-3.00)#39 | 8.3%(-5.20)#18,703 |
| 40. | 19966 | 3.1% | 6.1%(-3.00)#40 | 8.3%(-5.20)#18,719 |
| 41. | 19970 | 3.1% | 6.1%(-3.00)#41 | 8.3%(-5.20)#18,815 |
| 42. | 19945 | 2.7% | 6.1%(-3.40)#42 | 8.3%(-5.60)#20,170 |
| 43. | 19962 | 2.5% | 6.1%(-3.60)#43 | 8.3%(-5.80)#20,793 |
| 44. | 19709 | 2.4% | 6.1%(-3.70)#44 | 8.3%(-5.90)#21,027 |
| 45. | 19803 | 2.4% | 6.1%(-3.70)#45 | 8.3%(-5.90)#21,070 |
| 46. | 19946 | 1.7% | 6.1%(-4.40)#46 | 8.3%(-6.60)#23,537 |
| 47. | 19943 | 1.3% | 6.1%(-4.80)#47 | 8.3%(-7.00)#24,763 |
| 48. | 19734 | 1.2% | 6.1%(-4.90)#48 | 8.3%(-7.10)#25,080 |
| 49. | 19938 | 1.2% | 6.1%(-4.90)#49 | 8.3%(-7.10)#25,095 |
| 50. | 19730 | 0.90% | 6.1%(-5.20)#50 | 8.3%(-7.40)#26,060 |
| 51. | 19967 | 0.80% | 6.1%(-5.30)#51 | 8.3%(-7.50)#26,203 |
| 52. | 19968 | 0.70% | 6.1%(-5.40)#52 | 8.3%(-7.60)#26,359 |
| 53. | 19939 | 0.70% | 6.1%(-5.40)#53 | 8.3%(-7.60)#26,391 |
| 54. | 19944 | 0.70% | 6.1%(-5.40)#54 | 8.3%(-7.60)#26,528 |
| 55. | 19951 | 0.40% | 6.1%(-5.70)#55 | 8.3%(-7.90)#27,068 |
1
Common Questions
What are the Top 10 Zip Codes with the Highest Percentage of Households Without a Vehicle in Delaware?
Top 10 Zip Codes with the Highest Percentage of Households Without a Vehicle in Delaware are:
What zip code has the Highest Percentage of Households Without a Vehicle in Delaware?
19801 has the Highest Percentage of Households Without a Vehicle in Delaware with 29.4%.
What is the Percentage of Households Without a Vehicle in the State of Delaware?
Percentage of Households Without a Vehicle in Delaware is 6.1%.
What is the Percentage of Households Without a Vehicle in the United States?
Percentage of Households Without a Vehicle in the United States is 8.3%.