Zip Codes with the Highest Percentage of Population Employed in Legal Services & Support in Springfield, OR
RELATED REPORTS & OPTIONS
Legal Services & Support
Springfield
Compare Zip Codes
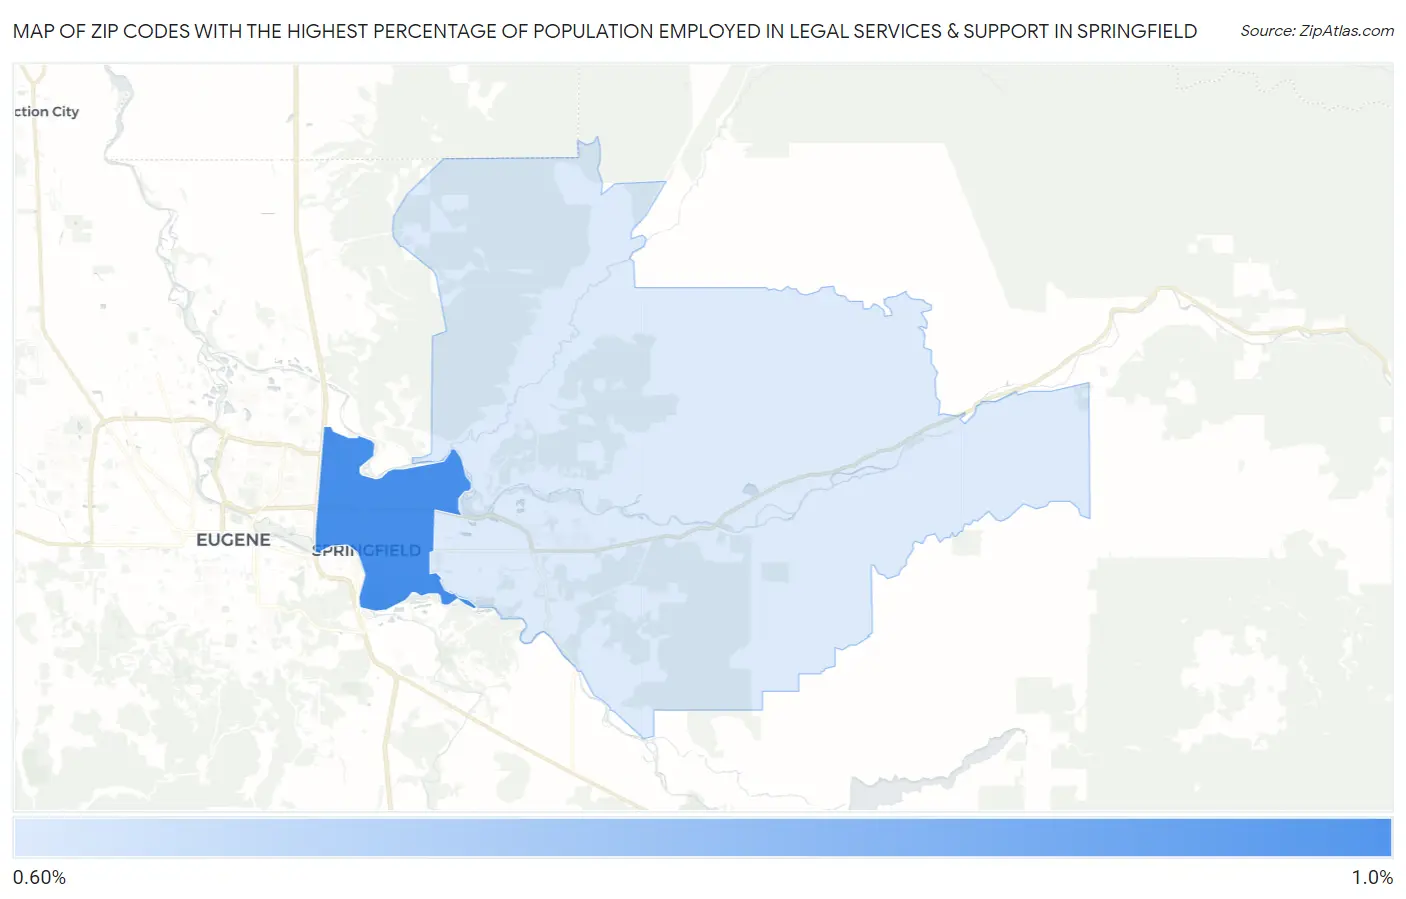
Map of Zip Codes with the Highest Percentage of Population Employed in Legal Services & Support in Springfield
0.65%
0.95%
Zip Codes with the Highest Percentage of Population Employed in Legal Services & Support in Springfield, OR
| Zip Code | % Employed | vs State | vs National | |
| 1. | 97477 | 0.95% | 1.1%(-0.150)#105 | 1.2%(-0.233)#8,208 |
| 2. | 97478 | 0.65% | 1.1%(-0.446)#135 | 1.2%(-0.529)#10,887 |
1
Common Questions
What are the Top Zip Codes with the Highest Percentage of Population Employed in Legal Services & Support in Springfield, OR?
Top Zip Codes with the Highest Percentage of Population Employed in Legal Services & Support in Springfield, OR are:
What zip code has the Highest Percentage of Population Employed in Legal Services & Support in Springfield, OR?
97477 has the Highest Percentage of Population Employed in Legal Services & Support in Springfield, OR with 0.95%.
What is the Percentage of Population Employed in Legal Services & Support in Springfield, OR?
Percentage of Population Employed in Legal Services & Support in Springfield is 0.87%.
What is the Percentage of Population Employed in Legal Services & Support in Oregon?
Percentage of Population Employed in Legal Services & Support in Oregon is 1.1%.
What is the Percentage of Population Employed in Legal Services & Support in the United States?
Percentage of Population Employed in Legal Services & Support in the United States is 1.2%.