Zip Codes with the Highest Percentage of Population Employed in Farming, Fishing & Forestry in Eugene, OR
RELATED REPORTS & OPTIONS
Farming, Fishing & Forestry
Eugene
Compare Zip Codes
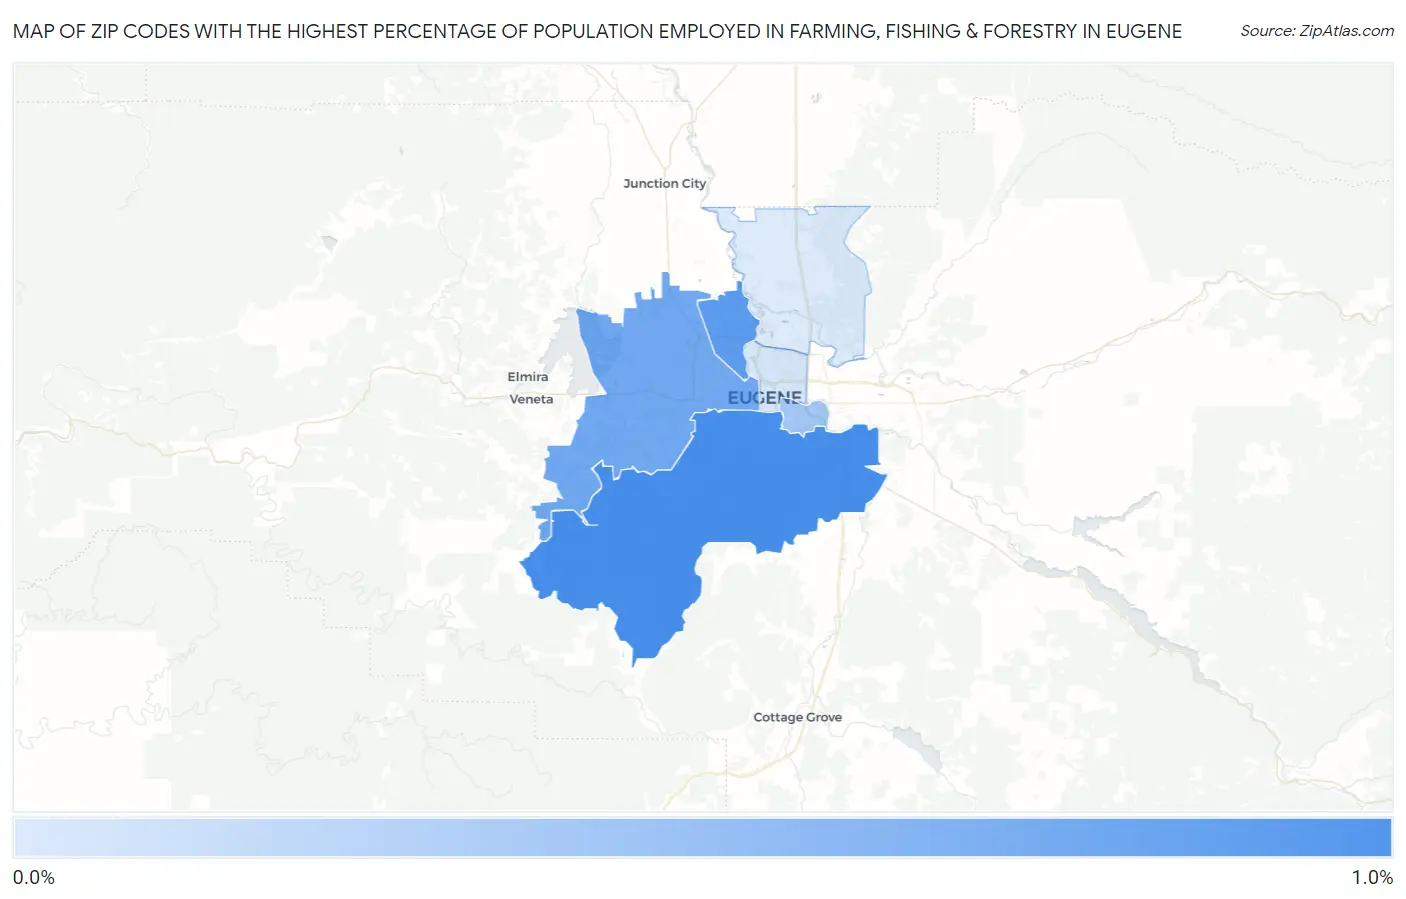
Map of Zip Codes with the Highest Percentage of Population Employed in Farming, Fishing & Forestry in Eugene
0.099%
0.98%
Zip Codes with the Highest Percentage of Population Employed in Farming, Fishing & Forestry in Eugene, OR
| Zip Code | % Employed | vs State | vs National | |
| 1. | 97405 | 0.98% | 1.4%(-0.425)#225 | 0.61%(+0.377)#9,828 |
| 2. | 97404 | 0.87% | 1.4%(-0.533)#231 | 0.61%(+0.269)#10,370 |
| 3. | 97402 | 0.74% | 1.4%(-0.672)#238 | 0.61%(+0.130)#11,159 |
| 4. | 97403 | 0.44% | 1.4%(-0.964)#274 | 0.61%(-0.162)#13,347 |
| 5. | 97401 | 0.15% | 1.4%(-1.26)#310 | 0.61%(-0.459)#16,994 |
| 6. | 97408 | 0.099% | 1.4%(-1.31)#312 | 0.61%(-0.506)#17,776 |
1
Common Questions
What are the Top 5 Zip Codes with the Highest Percentage of Population Employed in Farming, Fishing & Forestry in Eugene, OR?
Top 5 Zip Codes with the Highest Percentage of Population Employed in Farming, Fishing & Forestry in Eugene, OR are:
What zip code has the Highest Percentage of Population Employed in Farming, Fishing & Forestry in Eugene, OR?
97405 has the Highest Percentage of Population Employed in Farming, Fishing & Forestry in Eugene, OR with 0.98%.
What is the Percentage of Population Employed in Farming, Fishing & Forestry in Eugene, OR?
Percentage of Population Employed in Farming, Fishing & Forestry in Eugene is 0.50%.
What is the Percentage of Population Employed in Farming, Fishing & Forestry in Oregon?
Percentage of Population Employed in Farming, Fishing & Forestry in Oregon is 1.4%.
What is the Percentage of Population Employed in Farming, Fishing & Forestry in the United States?
Percentage of Population Employed in Farming, Fishing & Forestry in the United States is 0.61%.