Boise City, OK Map & Demographics
Boise City Map
Boise City Overview
$23,567
PER CAPITA INCOME
$54,718
AVG FAMILY INCOME
$44,583
AVG HOUSEHOLD INCOME
59.3%
WAGE / INCOME GAP [ % ]
40.7¢/ $1
WAGE / INCOME GAP [ $ ]
0.41
INEQUALITY / GINI INDEX
1,140
TOTAL POPULATION
575
MALE POPULATION
565
FEMALE POPULATION
101.77
MALES / 100 FEMALES
98.26
FEMALES / 100 MALES
35.2
MEDIAN AGE
4.4
AVG FAMILY SIZE
3.2
AVG HOUSEHOLD SIZE
554
LABOR FORCE [ PEOPLE ]
68.4%
PERCENT IN LABOR FORCE
Boise City Zip Codes
Boise City Area Codes
Income in Boise City
Income Overview in Boise City
Per Capita Income in Boise City is $23,567, while median incomes of families and households are $54,718 and $44,583 respectively.
| Characteristic | Number | Measure |
| Per Capita Income | 1,140 | $23,567 |
| Median Family Income | 207 | $54,718 |
| Mean Family Income | 207 | $71,886 |
| Median Household Income | 348 | $44,583 |
| Mean Household Income | 348 | $53,972 |
| Income Deficit | 207 | $0 |
| Wage / Income Gap (%) | 1,140 | 59.26% |
| Wage / Income Gap ($) | 1,140 | 40.74¢ per $1 |
| Gini / Inequality Index | 1,140 | 0.41 |
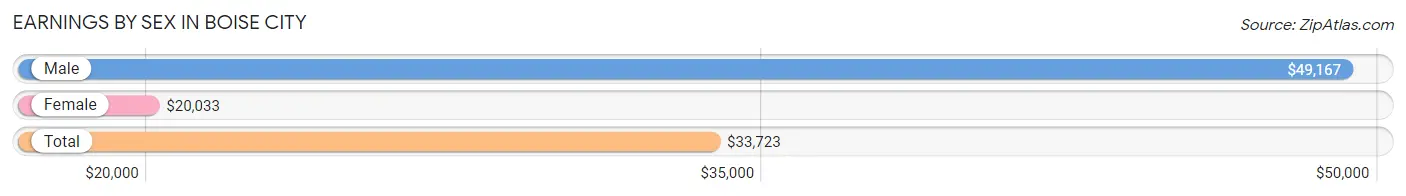
Earnings by Sex in Boise City
Average Earnings in Boise City are $33,723, $49,167 for men and $20,033 for women, a difference of 59.3%.
| Sex | Number | Average Earnings |
| Male | 318 (56.7%) | $49,167 |
| Female | 243 (43.3%) | $20,033 |
| Total | 561 (100.0%) | $33,723 |
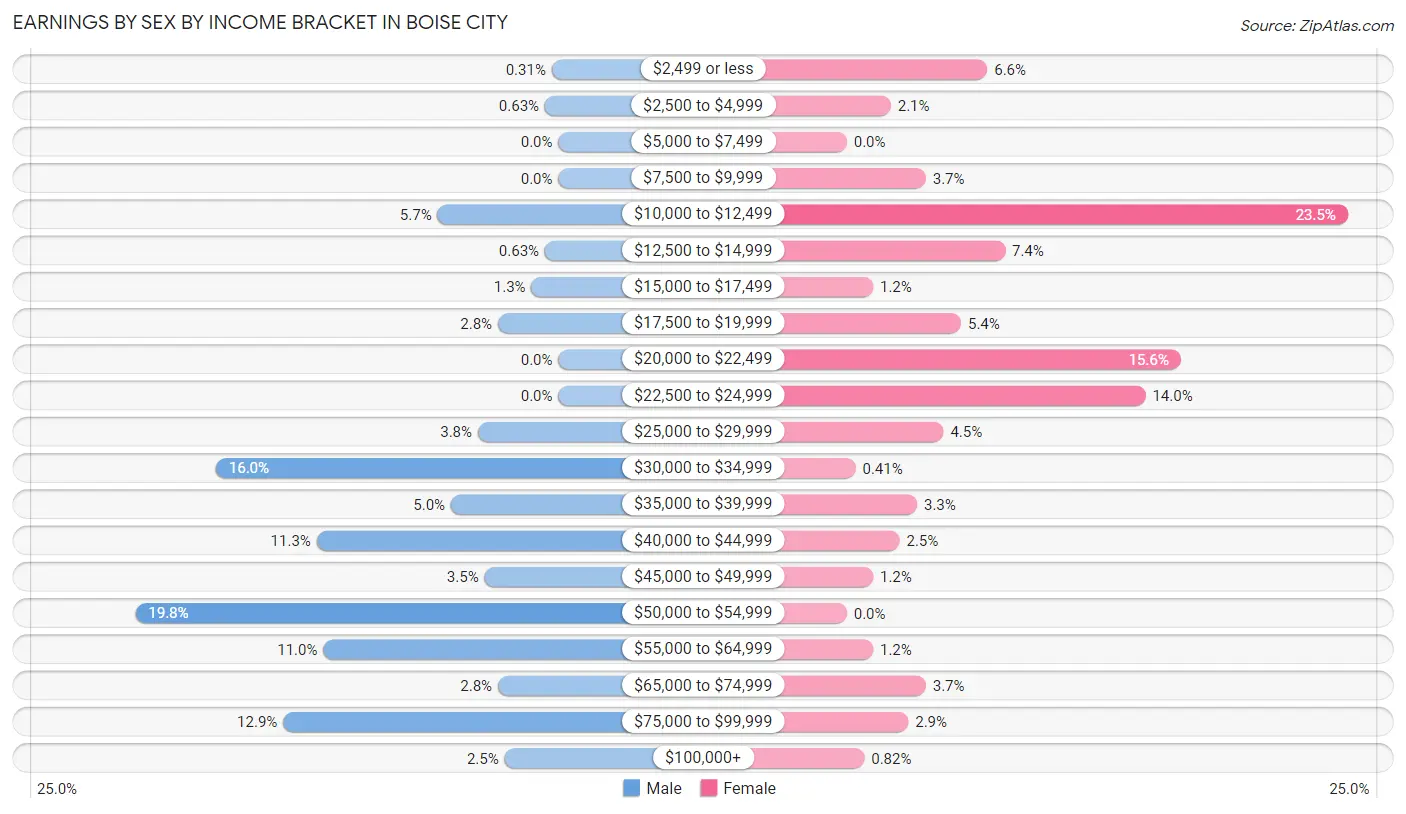
Earnings by Sex by Income Bracket in Boise City
The most common earnings brackets in Boise City are $50,000 to $54,999 for men (63 | 19.8%) and $10,000 to $12,499 for women (57 | 23.5%).
| Income | Male | Female |
| $2,499 or less | 1 (0.3%) | 16 (6.6%) |
| $2,500 to $4,999 | 2 (0.6%) | 5 (2.1%) |
| $5,000 to $7,499 | 0 (0.0%) | 0 (0.0%) |
| $7,500 to $9,999 | 0 (0.0%) | 9 (3.7%) |
| $10,000 to $12,499 | 18 (5.7%) | 57 (23.5%) |
| $12,500 to $14,999 | 2 (0.6%) | 18 (7.4%) |
| $15,000 to $17,499 | 4 (1.3%) | 3 (1.2%) |
| $17,500 to $19,999 | 9 (2.8%) | 13 (5.3%) |
| $20,000 to $22,499 | 0 (0.0%) | 38 (15.6%) |
| $22,500 to $24,999 | 0 (0.0%) | 34 (14.0%) |
| $25,000 to $29,999 | 12 (3.8%) | 11 (4.5%) |
| $30,000 to $34,999 | 51 (16.0%) | 1 (0.4%) |
| $35,000 to $39,999 | 16 (5.0%) | 8 (3.3%) |
| $40,000 to $44,999 | 36 (11.3%) | 6 (2.5%) |
| $45,000 to $49,999 | 11 (3.5%) | 3 (1.2%) |
| $50,000 to $54,999 | 63 (19.8%) | 0 (0.0%) |
| $55,000 to $64,999 | 35 (11.0%) | 3 (1.2%) |
| $65,000 to $74,999 | 9 (2.8%) | 9 (3.7%) |
| $75,000 to $99,999 | 41 (12.9%) | 7 (2.9%) |
| $100,000+ | 8 (2.5%) | 2 (0.8%) |
| Total | 318 (100.0%) | 243 (100.0%) |
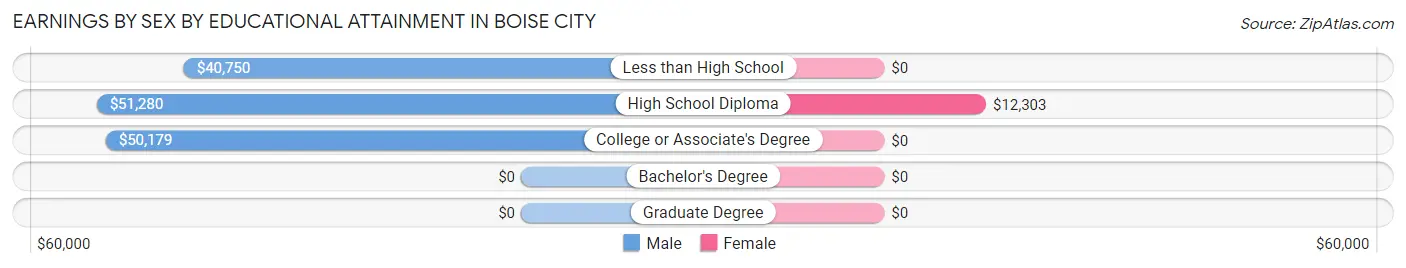
Earnings by Sex by Educational Attainment in Boise City
Average earnings in Boise City are $50,238 for men and $18,846 for women, a difference of 62.5%. Men with an educational attainment of high school diploma enjoy the highest average annual earnings of $51,280, while those with less than high school education earn the least with $40,750. Women with an educational attainment of high school diploma earn the most with the average annual earnings of $12,303, while those with high school diploma education have the smallest earnings of $12,303.
| Educational Attainment | Male Income | Female Income |
| Less than High School | $40,750 | $0 |
| High School Diploma | $51,280 | $12,303 |
| College or Associate's Degree | $50,179 | $0 |
| Bachelor's Degree | - | - |
| Graduate Degree | - | - |
| Total | $50,238 | $18,846 |
Family Income in Boise City
Family Income Brackets in Boise City
According to the Boise City family income data, there are 80 families falling into the $50,000 to $74,999 income range, which is the most common income bracket and makes up 38.7% of all families.
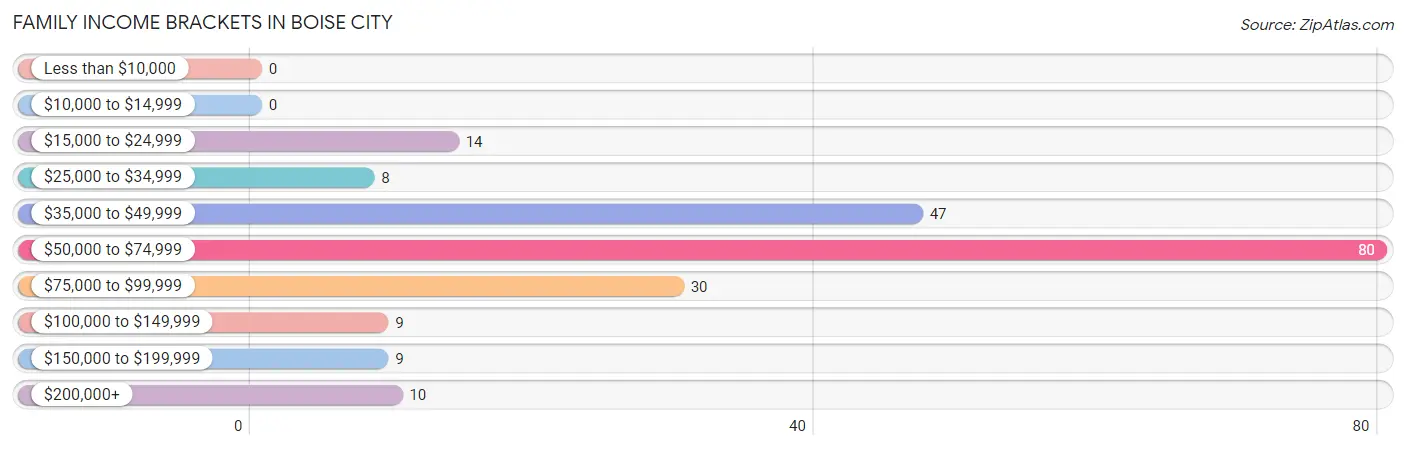
| Income Bracket | # Families | % Families |
| Less than $10,000 | 0 | 0.0% |
| $10,000 to $14,999 | 0 | 0.0% |
| $15,000 to $24,999 | 14 | 6.8% |
| $25,000 to $34,999 | 8 | 3.9% |
| $35,000 to $49,999 | 47 | 22.7% |
| $50,000 to $74,999 | 80 | 38.6% |
| $75,000 to $99,999 | 30 | 14.5% |
| $100,000 to $149,999 | 9 | 4.3% |
| $150,000 to $199,999 | 9 | 4.3% |
| $200,000+ | 10 | 4.8% |
Family Income by Famaliy Size in Boise City
3-person families (21 | 10.1%) account for the highest median family income in Boise City with $56,083 per family, while 2-person families (97 | 46.9%) have the highest median income of $23,438 per family member.
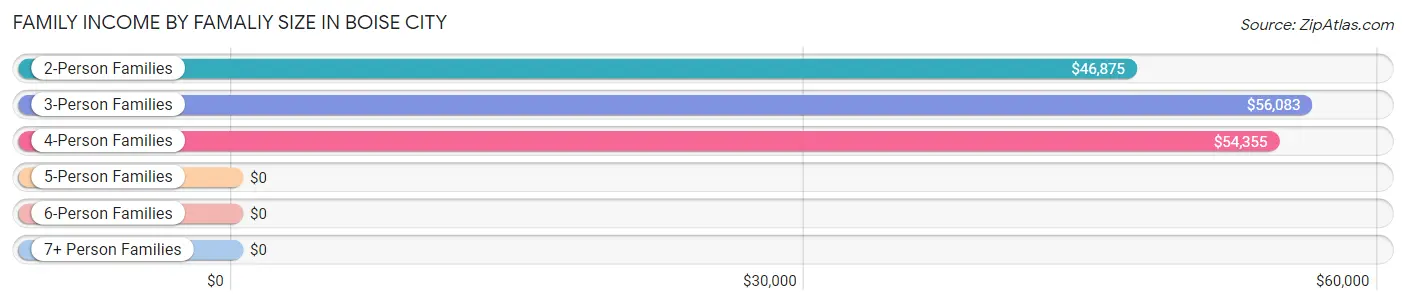
| Income Bracket | # Families | Median Income |
| 2-Person Families | 97 (46.9%) | $46,875 |
| 3-Person Families | 21 (10.1%) | $56,083 |
| 4-Person Families | 60 (29.0%) | $54,355 |
| 5-Person Families | 5 (2.4%) | $0 |
| 6-Person Families | 13 (6.3%) | $0 |
| 7+ Person Families | 11 (5.3%) | $0 |
| Total | 207 (100.0%) | $54,718 |
Family Income by Number of Earners in Boise City
The median family income in Boise City is $54,718, with families comprising 3+ earners (30) having the highest median family income of $86,250, while families with 1 earner (60) have the lowest median family income of $39,722, accounting for 14.5% and 29.0% of families, respectively.
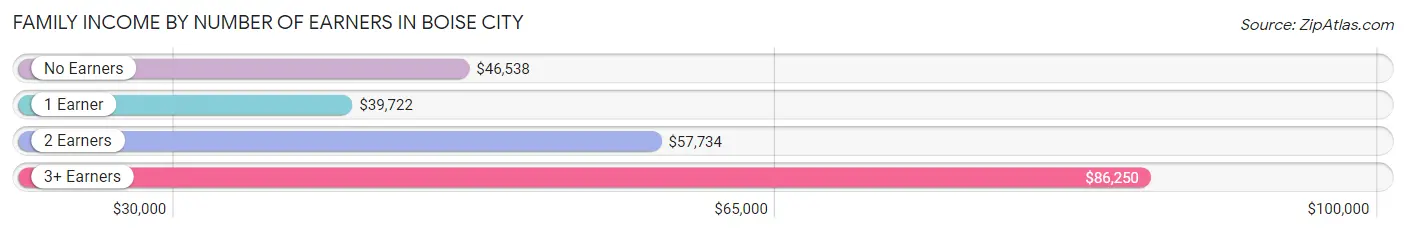
| Number of Earners | # Families | Median Income |
| No Earners | 24 (11.6%) | $46,538 |
| 1 Earner | 60 (29.0%) | $39,722 |
| 2 Earners | 93 (44.9%) | $57,734 |
| 3+ Earners | 30 (14.5%) | $86,250 |
| Total | 207 (100.0%) | $54,718 |
Household Income in Boise City
Household Income Brackets in Boise City
With 97 households falling in the category, the $50,000 to $74,999 income range is the most frequent in Boise City, accounting for 27.9% of all households. In contrast, only 8 households (2.3%) fall into the $100,000 to $149,999 income bracket, making it the least populous group.
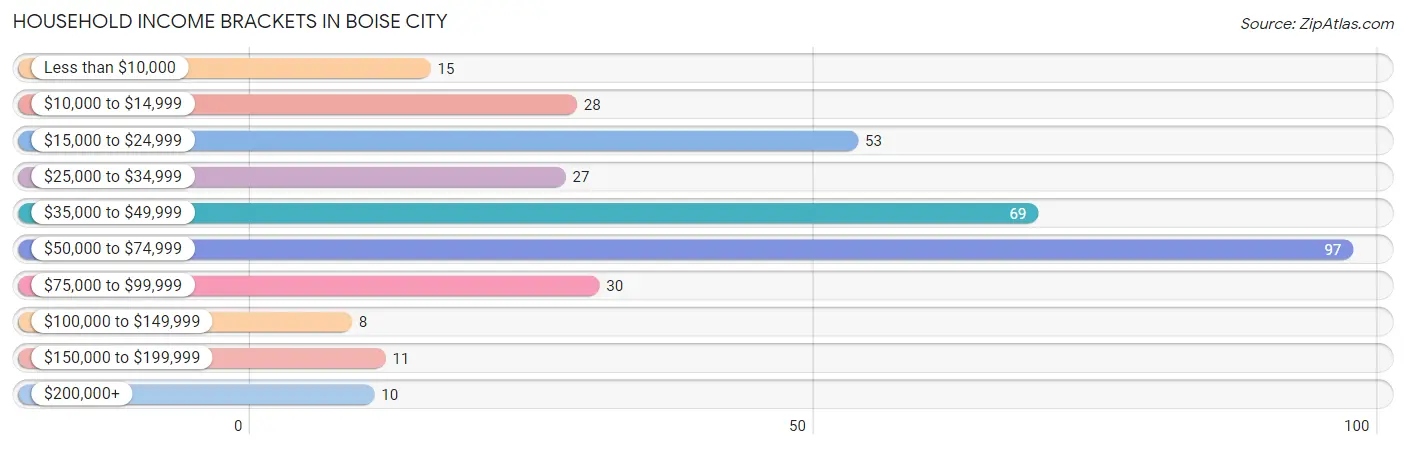
| Income Bracket | # Households | % Households |
| Less than $10,000 | 15 | 4.3% |
| $10,000 to $14,999 | 28 | 8.0% |
| $15,000 to $24,999 | 53 | 15.2% |
| $25,000 to $34,999 | 27 | 7.8% |
| $35,000 to $49,999 | 69 | 19.8% |
| $50,000 to $74,999 | 97 | 27.9% |
| $75,000 to $99,999 | 30 | 8.6% |
| $100,000 to $149,999 | 8 | 2.3% |
| $150,000 to $199,999 | 11 | 3.2% |
| $200,000+ | 10 | 2.9% |
Household Income by Householder Age in Boise City
The median household income in Boise City is $44,583, with the highest median household income of $55,147 found in the 25 to 44 years age bracket for the primary householder. A total of 88 households (25.3%) fall into this category. Meanwhile, the 15 to 24 years age bracket for the primary householder has the lowest median household income of $0, with 7 households (2.0%) in this group.
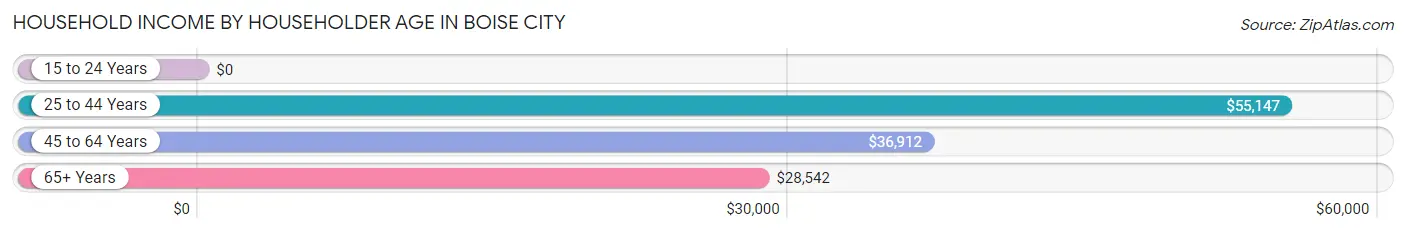
| Income Bracket | # Households | Median Income |
| 15 to 24 Years | 7 (2.0%) | $0 |
| 25 to 44 Years | 88 (25.3%) | $55,147 |
| 45 to 64 Years | 94 (27.0%) | $36,912 |
| 65+ Years | 159 (45.7%) | $28,542 |
| Total | 348 (100.0%) | $44,583 |
Poverty in Boise City
Income Below Poverty by Sex and Age in Boise City
With 9.9% poverty level for males and 16.7% for females among the residents of Boise City, 55 to 64 year old males and 25 to 34 year old females are the most vulnerable to poverty, with 9 males (36.0%) and 23 females (43.4%) in their respective age groups living below the poverty level.
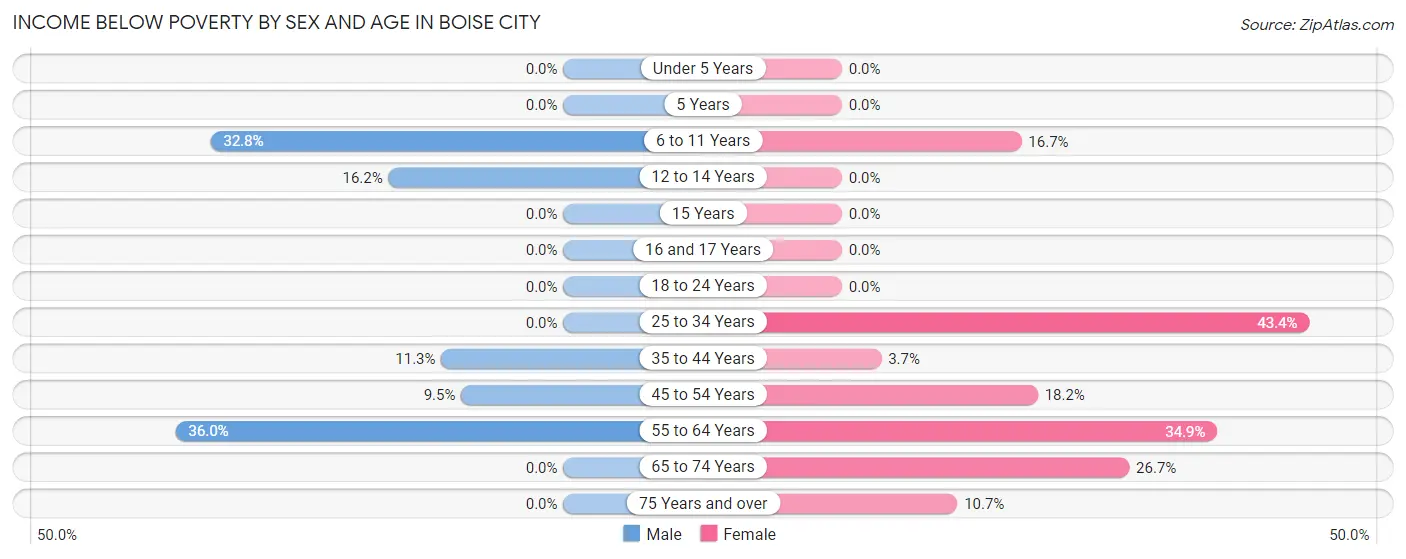
| Age Bracket | Male | Female |
| Under 5 Years | 0 (0.0%) | 0 (0.0%) |
| 5 Years | 0 (0.0%) | 0 (0.0%) |
| 6 to 11 Years | 19 (32.8%) | 13 (16.7%) |
| 12 to 14 Years | 12 (16.2%) | 0 (0.0%) |
| 15 Years | 0 (0.0%) | 0 (0.0%) |
| 16 and 17 Years | 0 (0.0%) | 0 (0.0%) |
| 18 to 24 Years | 0 (0.0%) | 0 (0.0%) |
| 25 to 34 Years | 0 (0.0%) | 23 (43.4%) |
| 35 to 44 Years | 6 (11.3%) | 3 (3.7%) |
| 45 to 54 Years | 9 (9.5%) | 10 (18.2%) |
| 55 to 64 Years | 9 (36.0%) | 23 (34.8%) |
| 65 to 74 Years | 0 (0.0%) | 16 (26.7%) |
| 75 Years and over | 0 (0.0%) | 6 (10.7%) |
| Total | 55 (9.9%) | 94 (16.7%) |
Income Above Poverty by Sex and Age in Boise City
According to the poverty statistics in Boise City, males aged under 5 years and females aged under 5 years are the age groups that are most secure financially, with 100.0% of males and 100.0% of females in these age groups living above the poverty line.
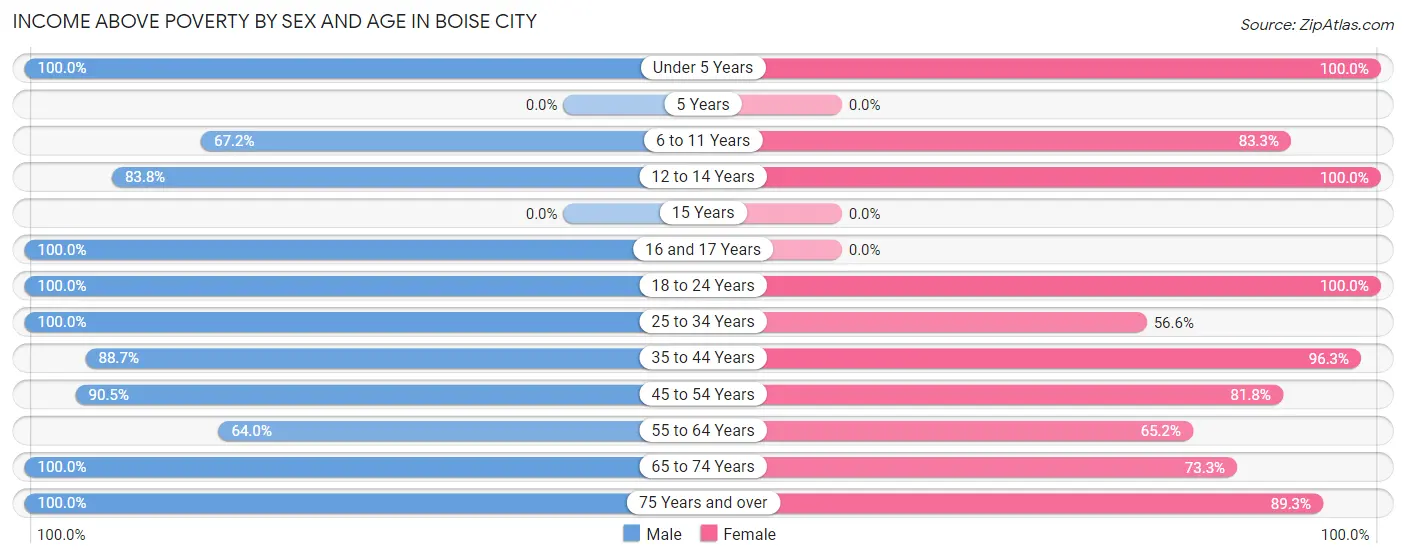
| Age Bracket | Male | Female |
| Under 5 Years | 45 (100.0%) | 60 (100.0%) |
| 5 Years | 0 (0.0%) | 0 (0.0%) |
| 6 to 11 Years | 39 (67.2%) | 65 (83.3%) |
| 12 to 14 Years | 62 (83.8%) | 15 (100.0%) |
| 15 Years | 0 (0.0%) | 0 (0.0%) |
| 16 and 17 Years | 18 (100.0%) | 0 (0.0%) |
| 18 to 24 Years | 46 (100.0%) | 38 (100.0%) |
| 25 to 34 Years | 72 (100.0%) | 30 (56.6%) |
| 35 to 44 Years | 47 (88.7%) | 79 (96.3%) |
| 45 to 54 Years | 86 (90.5%) | 45 (81.8%) |
| 55 to 64 Years | 16 (64.0%) | 43 (65.1%) |
| 65 to 74 Years | 27 (100.0%) | 44 (73.3%) |
| 75 Years and over | 45 (100.0%) | 50 (89.3%) |
| Total | 503 (90.1%) | 469 (83.3%) |
Income Below Poverty Among Married-Couple Families in Boise City
The poverty statistics for married-couple families in Boise City show that 9.4% or 17 of the total 180 families live below the poverty line. Families with 3 or 4 children have the highest poverty rate of 33.3%, comprising of 6 families. On the other hand, families with 1 or 2 children have the lowest poverty rate of 0.0%, which includes 0 families.
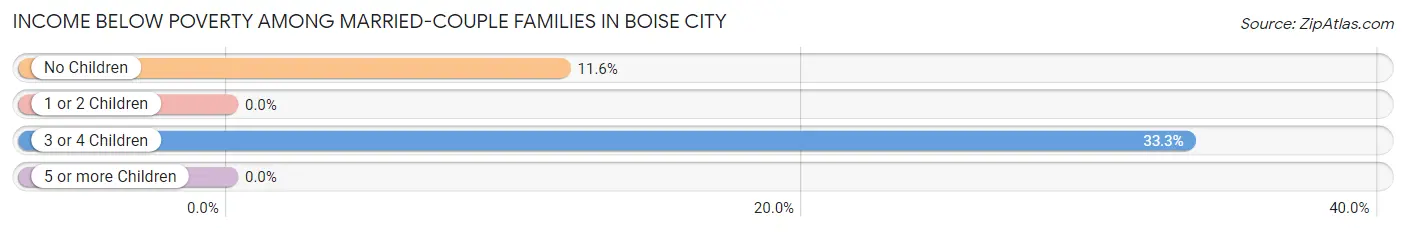
| Children | Above Poverty | Below Poverty |
| No Children | 84 (88.4%) | 11 (11.6%) |
| 1 or 2 Children | 67 (100.0%) | 0 (0.0%) |
| 3 or 4 Children | 12 (66.7%) | 6 (33.3%) |
| 5 or more Children | 0 (0.0%) | 0 (0.0%) |
| Total | 163 (90.6%) | 17 (9.4%) |
Income Below Poverty Among Single-Parent Households in Boise City
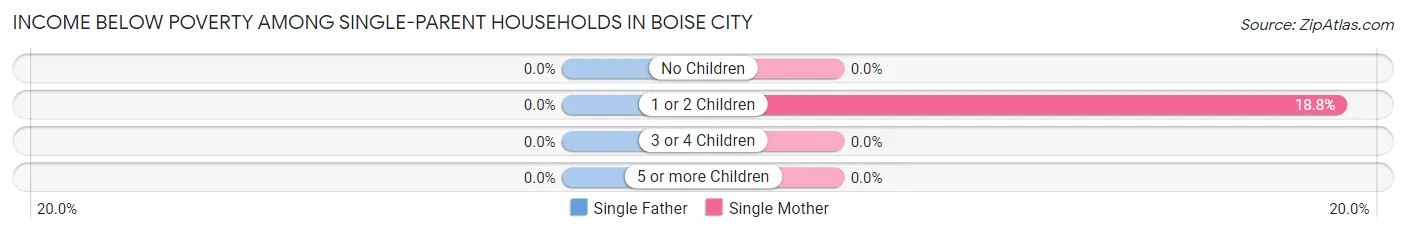
| Children | Single Father | Single Mother |
| No Children | 0 (0.0%) | 0 (0.0%) |
| 1 or 2 Children | 0 (0.0%) | 3 (18.8%) |
| 3 or 4 Children | 0 (0.0%) | 0 (0.0%) |
| 5 or more Children | 0 (0.0%) | 0 (0.0%) |
| Total | 0 (0.0%) | 3 (11.1%) |
Income Below Poverty Among Married-Couple vs Single-Parent Households in Boise City
The poverty data for Boise City shows that 17 of the married-couple family households (9.4%) and 3 of the single-parent households (11.1%) are living below the poverty level. Within the married-couple family households, those with 3 or 4 children have the highest poverty rate, with 6 households (33.3%) falling below the poverty line. Among the single-parent households, those with 1 or 2 children have the highest poverty rate, with 3 household (18.8%) living below poverty.
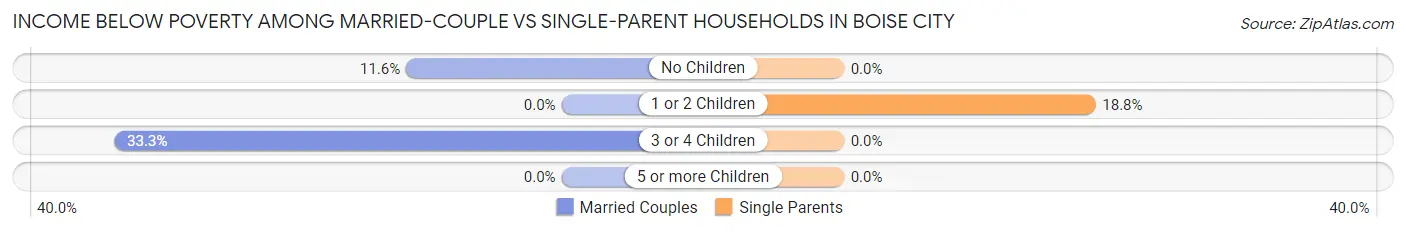
| Children | Married-Couple Families | Single-Parent Households |
| No Children | 11 (11.6%) | 0 (0.0%) |
| 1 or 2 Children | 0 (0.0%) | 3 (18.8%) |
| 3 or 4 Children | 6 (33.3%) | 0 (0.0%) |
| 5 or more Children | 0 (0.0%) | 0 (0.0%) |
| Total | 17 (9.4%) | 3 (11.1%) |
Race in Boise City
The most populous races in Boise City are White / Caucasian (976 | 85.6%), Hispanic or Latino (431 | 37.8%), and Two or more Races (150 | 13.2%).
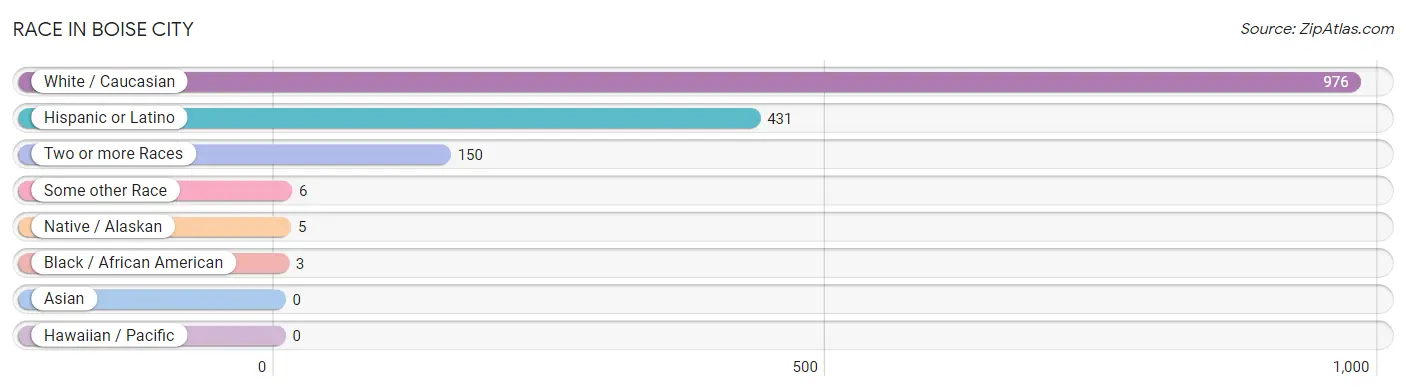
| Race | # Population | % Population |
| Asian | 0 | 0.0% |
| Black / African American | 3 | 0.3% |
| Hawaiian / Pacific | 0 | 0.0% |
| Hispanic or Latino | 431 | 37.8% |
| Native / Alaskan | 5 | 0.4% |
| White / Caucasian | 976 | 85.6% |
| Two or more Races | 150 | 13.2% |
| Some other Race | 6 | 0.5% |
| Total | 1,140 | 100.0% |
Ancestry in Boise City
The most populous ancestries reported in Boise City are Mexican (410 | 36.0%), English (150 | 13.2%), Swedish (111 | 9.7%), German (88 | 7.7%), and Irish (51 | 4.5%), together accounting for 71.1% of all Boise City residents.
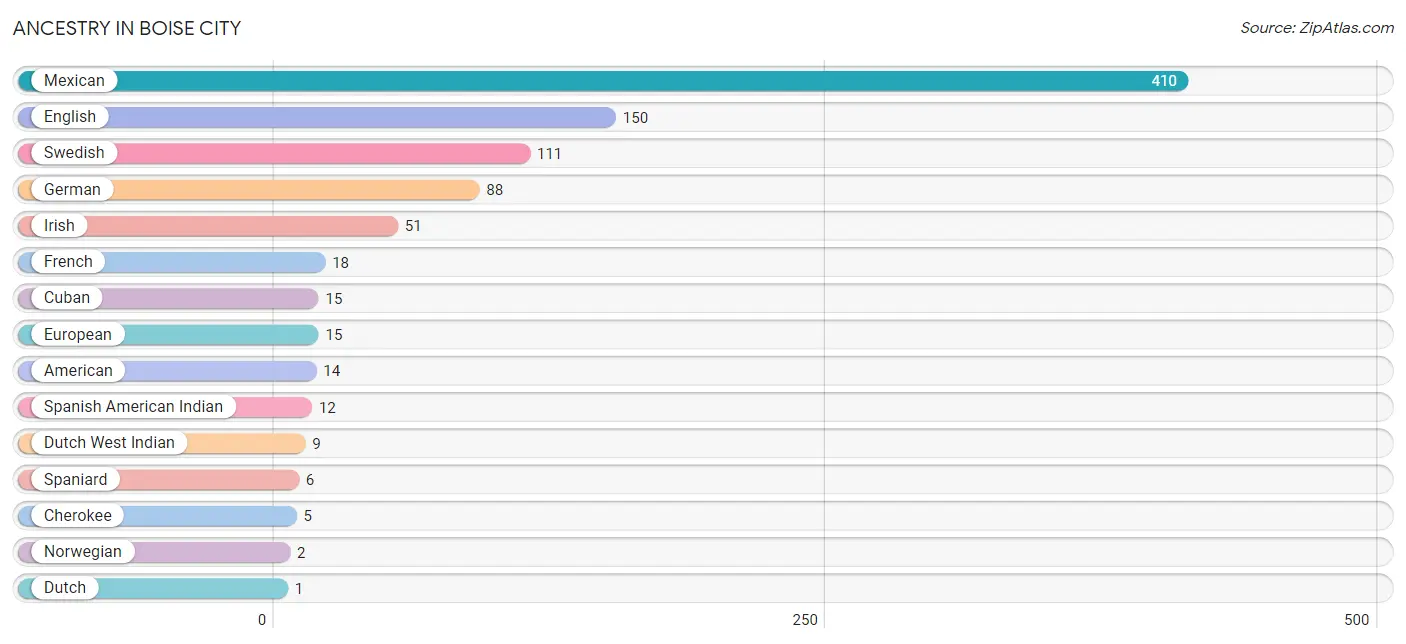
| Ancestry | # Population | % Population |
| American | 14 | 1.2% |
| Cherokee | 5 | 0.4% |
| Cuban | 15 | 1.3% |
| Dutch | 1 | 0.1% |
| Dutch West Indian | 9 | 0.8% |
| English | 150 | 13.2% |
| European | 15 | 1.3% |
| French | 18 | 1.6% |
| German | 88 | 7.7% |
| Irish | 51 | 4.5% |
| Mexican | 410 | 36.0% |
| Norwegian | 2 | 0.2% |
| Spaniard | 6 | 0.5% |
| Spanish American Indian | 12 | 1.1% |
| Swedish | 111 | 9.7% | View All 15 Rows |
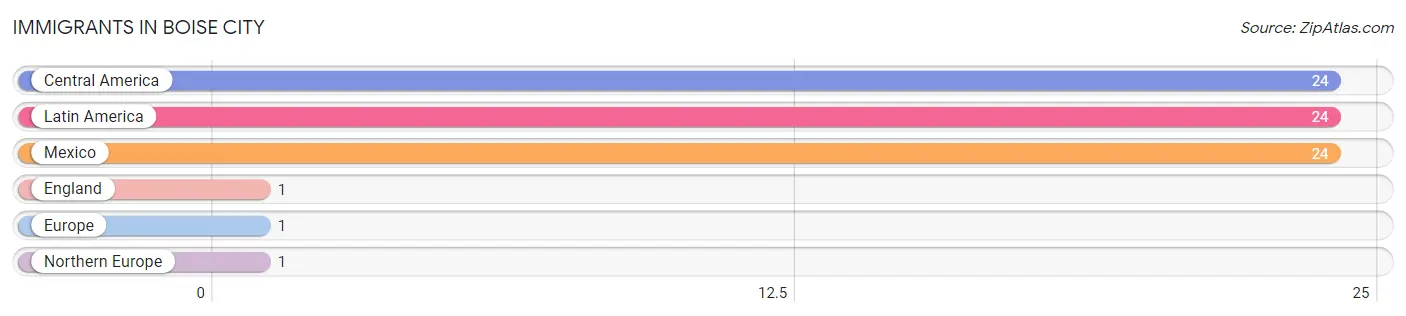
Immigrants in Boise City
The most numerous immigrant groups reported in Boise City came from Central America (24 | 2.1%), Latin America (24 | 2.1%), Mexico (24 | 2.1%), England (1 | 0.1%), and Europe (1 | 0.1%), together accounting for 6.5% of all Boise City residents.
| Immigration Origin | # Population | % Population |
| Central America | 24 | 2.1% |
| England | 1 | 0.1% |
| Europe | 1 | 0.1% |
| Latin America | 24 | 2.1% |
| Mexico | 24 | 2.1% |
| Northern Europe | 1 | 0.1% | View All 6 Rows |
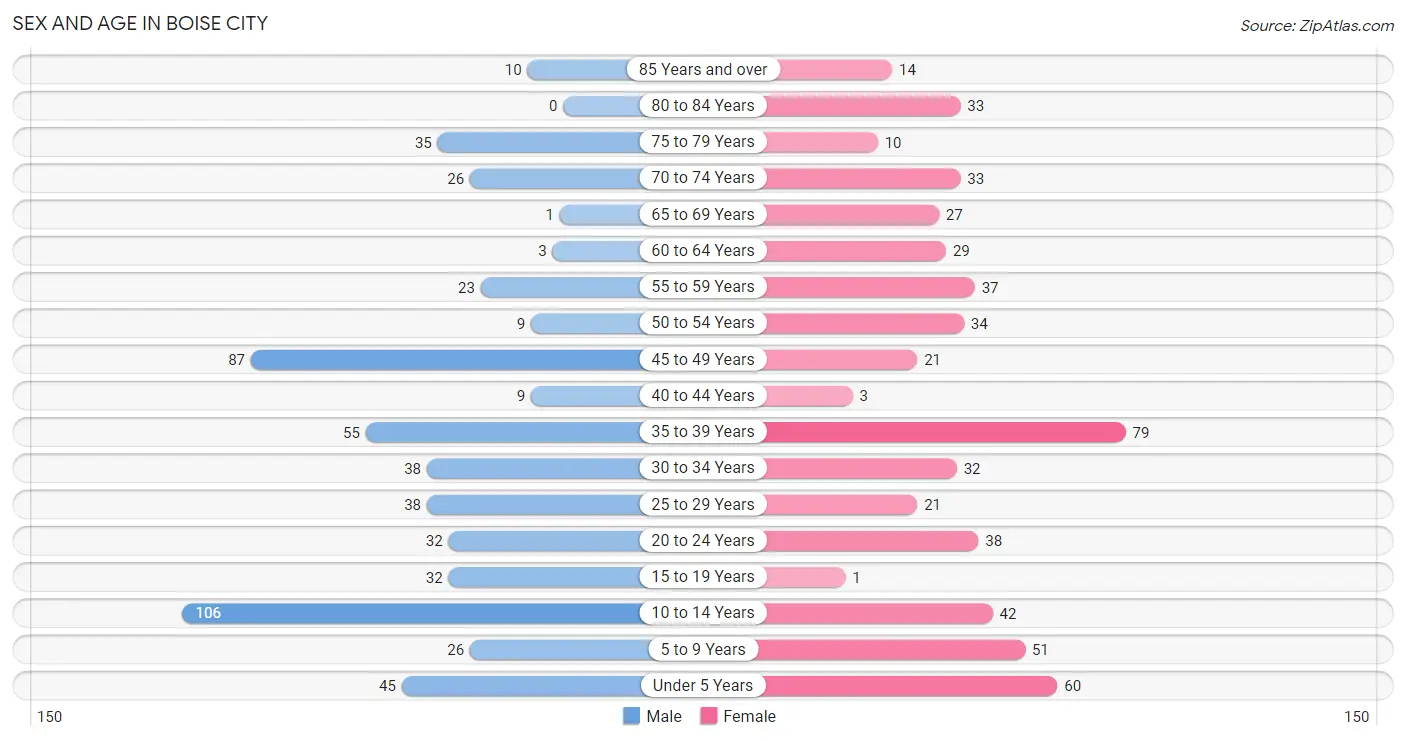
Sex and Age in Boise City
Sex and Age in Boise City
The most populous age groups in Boise City are 10 to 14 Years (106 | 18.4%) for men and 35 to 39 Years (79 | 14.0%) for women.
| Age Bracket | Male | Female |
| Under 5 Years | 45 (7.8%) | 60 (10.6%) |
| 5 to 9 Years | 26 (4.5%) | 51 (9.0%) |
| 10 to 14 Years | 106 (18.4%) | 42 (7.4%) |
| 15 to 19 Years | 32 (5.6%) | 1 (0.2%) |
| 20 to 24 Years | 32 (5.6%) | 38 (6.7%) |
| 25 to 29 Years | 38 (6.6%) | 21 (3.7%) |
| 30 to 34 Years | 38 (6.6%) | 32 (5.7%) |
| 35 to 39 Years | 55 (9.6%) | 79 (14.0%) |
| 40 to 44 Years | 9 (1.6%) | 3 (0.5%) |
| 45 to 49 Years | 87 (15.1%) | 21 (3.7%) |
| 50 to 54 Years | 9 (1.6%) | 34 (6.0%) |
| 55 to 59 Years | 23 (4.0%) | 37 (6.6%) |
| 60 to 64 Years | 3 (0.5%) | 29 (5.1%) |
| 65 to 69 Years | 1 (0.2%) | 27 (4.8%) |
| 70 to 74 Years | 26 (4.5%) | 33 (5.8%) |
| 75 to 79 Years | 35 (6.1%) | 10 (1.8%) |
| 80 to 84 Years | 0 (0.0%) | 33 (5.8%) |
| 85 Years and over | 10 (1.7%) | 14 (2.5%) |
| Total | 575 (100.0%) | 565 (100.0%) |
Families and Households in Boise City
Median Family Size in Boise City
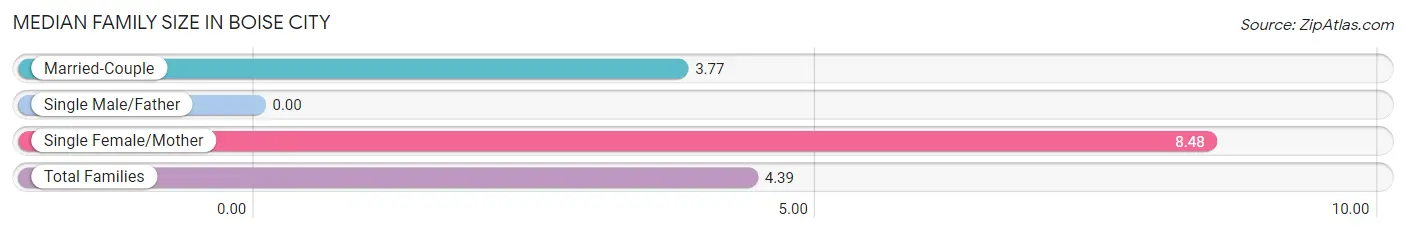
| Family Type | # Families | Family Size |
| Married-Couple | 180 (87.0%) | 3.77 |
| Single Male/Father | 0 (0.0%) | - |
| Single Female/Mother | 27 (13.0%) | 8.48 |
| Total Families | 207 (100.0%) | 4.39 |
Median Household Size in Boise City
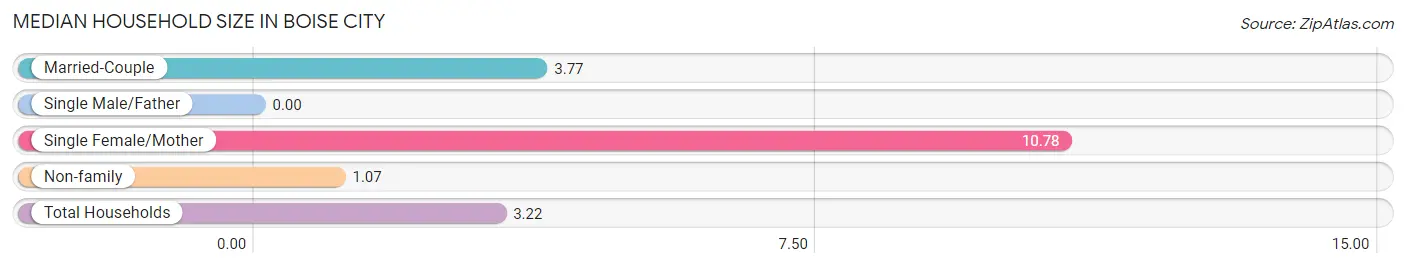
| Household Type | # Households | Household Size |
| Married-Couple | 180 (51.7%) | 3.77 |
| Single Male/Father | 0 (0.0%) | - |
| Single Female/Mother | 27 (7.8%) | 10.78 |
| Non-family | 141 (40.5%) | 1.07 |
| Total Households | 348 (100.0%) | 3.22 |
Household Size by Marriage Status in Boise City
Out of a total of 348 households in Boise City, 207 (59.5%) are family households, while 141 (40.5%) are nonfamily households. The most numerous type of family households are 2-person households, comprising 94, and the most common type of nonfamily households are 1-person households, comprising 132.
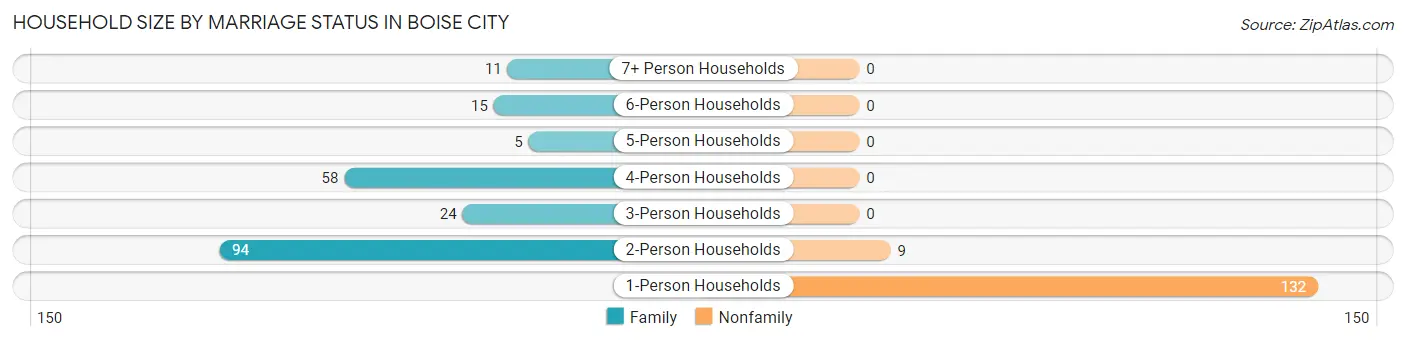
| Household Size | Family Households | Nonfamily Households |
| 1-Person Households | - | 132 (37.9%) |
| 2-Person Households | 94 (27.0%) | 9 (2.6%) |
| 3-Person Households | 24 (6.9%) | 0 (0.0%) |
| 4-Person Households | 58 (16.7%) | 0 (0.0%) |
| 5-Person Households | 5 (1.4%) | 0 (0.0%) |
| 6-Person Households | 15 (4.3%) | 0 (0.0%) |
| 7+ Person Households | 11 (3.2%) | 0 (0.0%) |
| Total | 207 (59.5%) | 141 (40.5%) |
Female Fertility in Boise City
Fertility by Age in Boise City
Average fertility rate in Boise City is 17.0 births per 1,000 women. Women in the age bracket of 20 to 34 years have the highest fertility rate with 44.0 births per 1,000 women. Women in the age bracket of 20 to 34 years acount for 100.0% of all women with births.
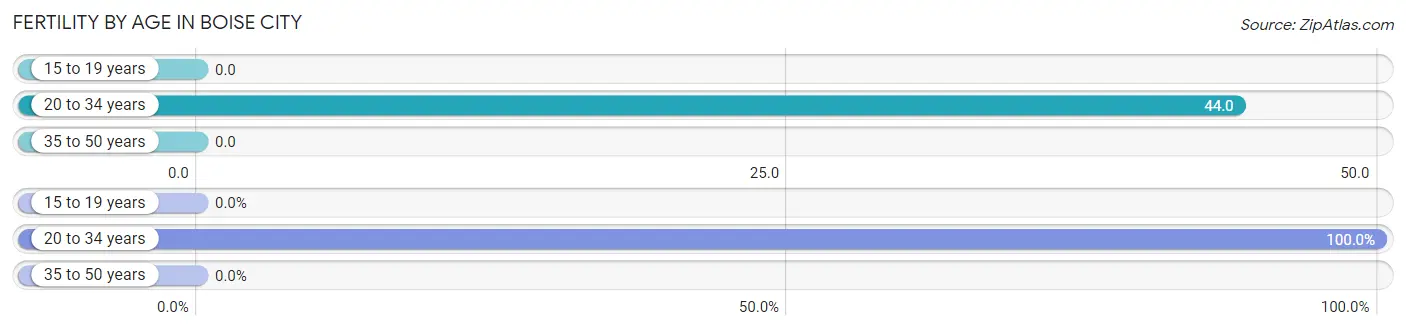
| Age Bracket | Women with Births | Births / 1,000 Women |
| 15 to 19 years | 0 (0.0%) | 0.0 |
| 20 to 34 years | 4 (100.0%) | 44.0 |
| 35 to 50 years | 0 (0.0%) | 0.0 |
| Total | 4 (100.0%) | 17.0 |
Fertility by Age by Marriage Status in Boise City
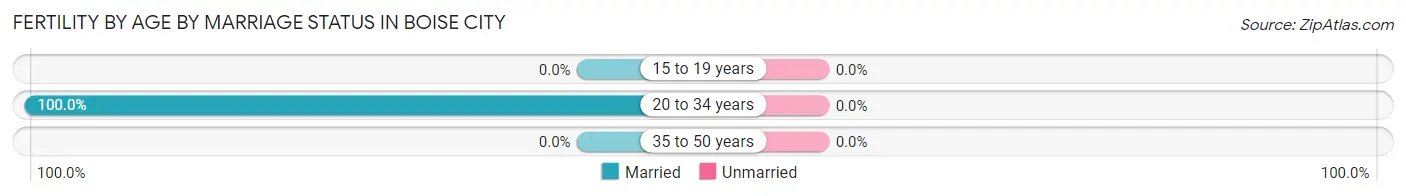
| Age Bracket | Married | Unmarried |
| 15 to 19 years | 0 (0.0%) | 0 (0.0%) |
| 20 to 34 years | 4 (100.0%) | 0 (0.0%) |
| 35 to 50 years | 0 (0.0%) | 0 (0.0%) |
| Total | 4 (100.0%) | 0 (0.0%) |
Fertility by Education in Boise City
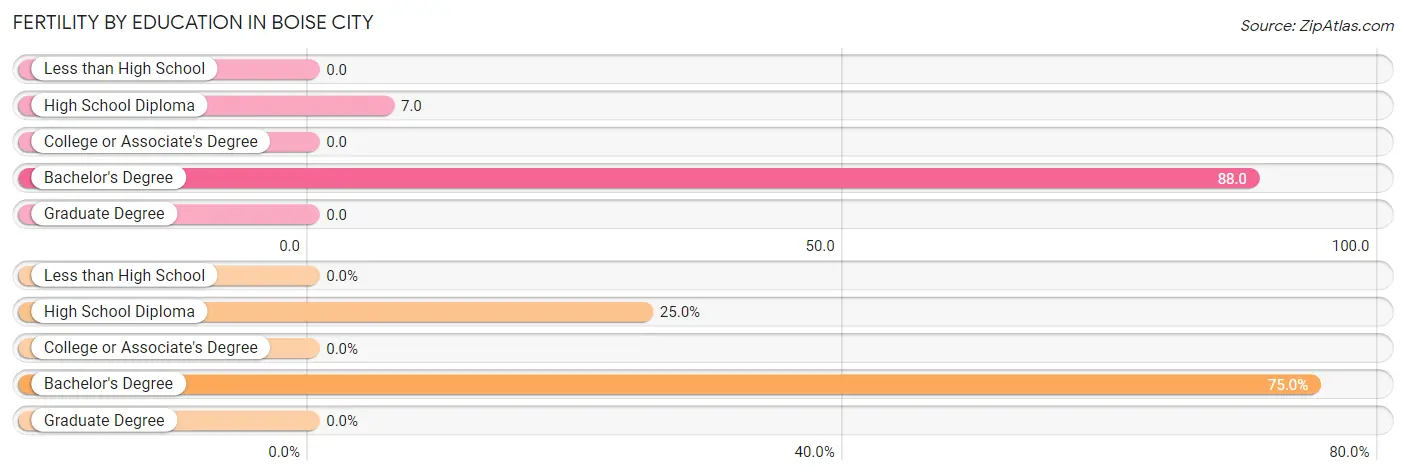
| Educational Attainment | Women with Births | Births / 1,000 Women |
| Less than High School | 0 (0.0%) | 0.0 |
| High School Diploma | 1 (25.0%) | 7.0 |
| College or Associate's Degree | 0 (0.0%) | 0.0 |
| Bachelor's Degree | 3 (75.0%) | 88.0 |
| Graduate Degree | 0 (0.0%) | 0.0 |
| Total | 4 (100.0%) | 17.0 |
Fertility by Education by Marriage Status in Boise City
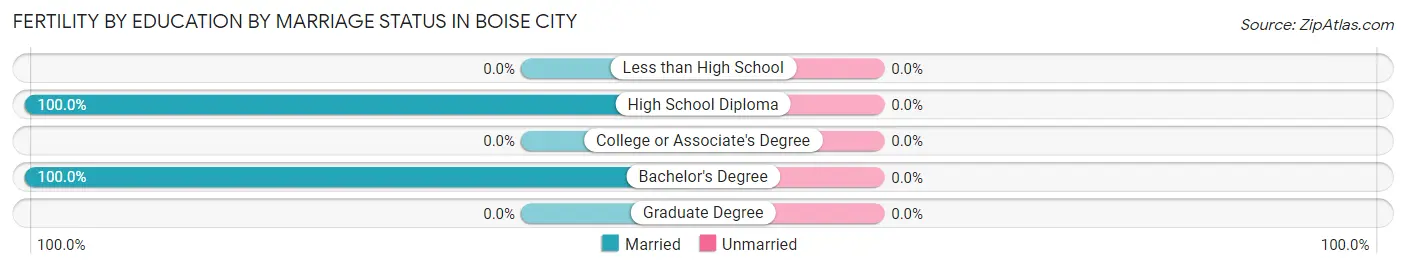
| Educational Attainment | Married | Unmarried |
| Less than High School | 0 (0.0%) | 0 (0.0%) |
| High School Diploma | 1 (100.0%) | 0 (0.0%) |
| College or Associate's Degree | 0 (0.0%) | 0 (0.0%) |
| Bachelor's Degree | 3 (100.0%) | 0 (0.0%) |
| Graduate Degree | 0 (0.0%) | 0 (0.0%) |
| Total | 4 (100.0%) | 0 (0.0%) |
Employment Characteristics in Boise City
Employment by Class of Employer in Boise City
Among the 551 employed individuals in Boise City, private company employees (293 | 53.2%), self-employed (not incorporated) (89 | 16.2%), and local government employees (65 | 11.8%) make up the most common classes of employment.
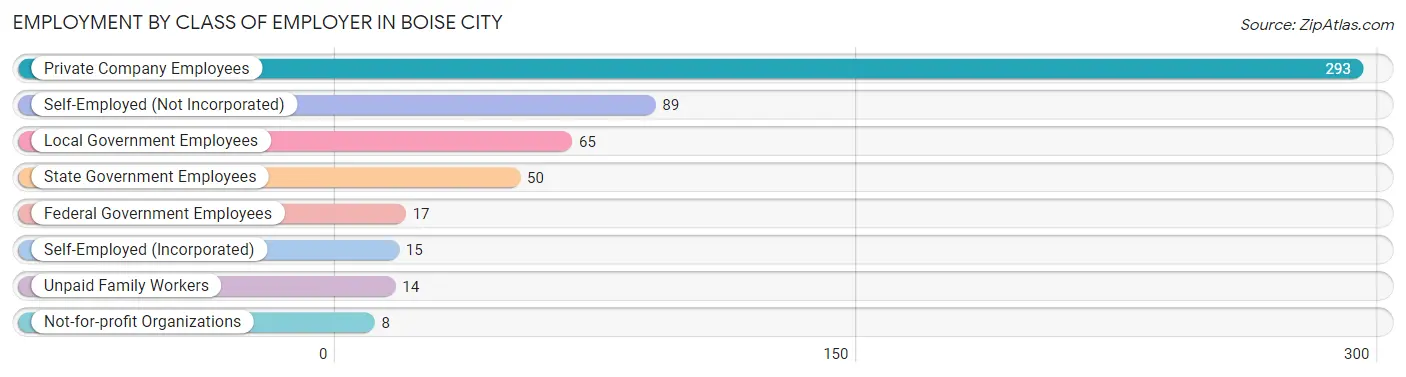
| Employer Class | # Employees | % Employees |
| Private Company Employees | 293 | 53.2% |
| Self-Employed (Incorporated) | 15 | 2.7% |
| Self-Employed (Not Incorporated) | 89 | 16.2% |
| Not-for-profit Organizations | 8 | 1.5% |
| Local Government Employees | 65 | 11.8% |
| State Government Employees | 50 | 9.1% |
| Federal Government Employees | 17 | 3.1% |
| Unpaid Family Workers | 14 | 2.5% |
| Total | 551 | 100.0% |
Employment Status by Age in Boise City
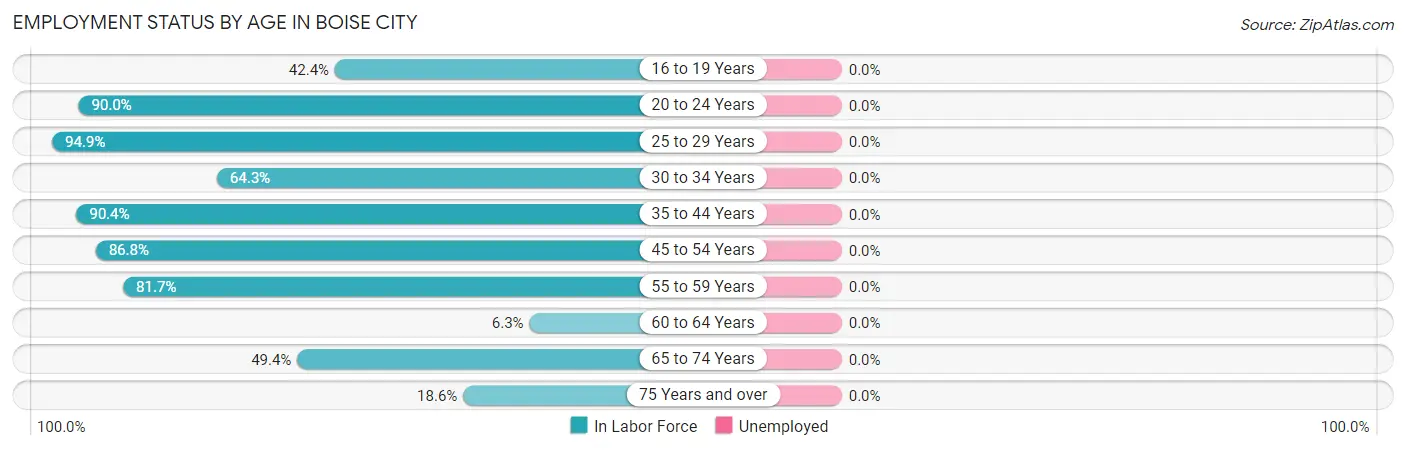
| Age Bracket | In Labor Force | Unemployed |
| 16 to 19 Years | 14 (42.4%) | 0 (0.0%) |
| 20 to 24 Years | 63 (90.0%) | 0 (0.0%) |
| 25 to 29 Years | 56 (94.9%) | 0 (0.0%) |
| 30 to 34 Years | 45 (64.3%) | 0 (0.0%) |
| 35 to 44 Years | 132 (90.4%) | 0 (0.0%) |
| 45 to 54 Years | 131 (86.8%) | 0 (0.0%) |
| 55 to 59 Years | 49 (81.7%) | 0 (0.0%) |
| 60 to 64 Years | 2 (6.3%) | 0 (0.0%) |
| 65 to 74 Years | 43 (49.4%) | 0 (0.0%) |
| 75 Years and over | 19 (18.6%) | 0 (0.0%) |
| Total | 554 (68.4%) | 0 (0.0%) |
Employment Status by Educational Attainment in Boise City
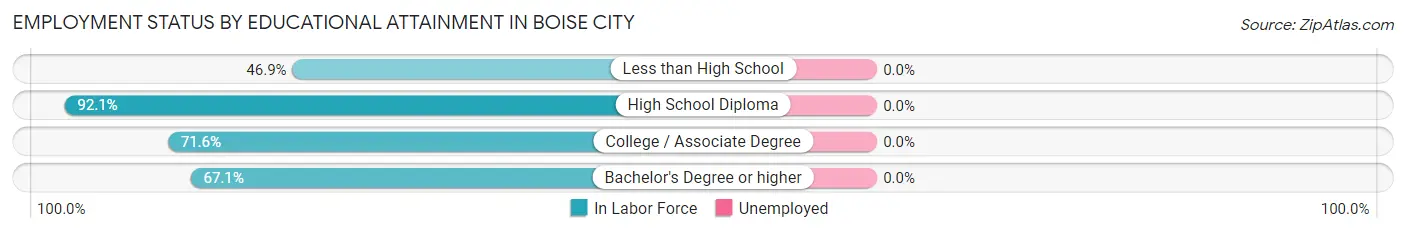
| Educational Attainment | In Labor Force | Unemployed |
| Less than High School | 23 (46.9%) | 0 (0.0%) |
| High School Diploma | 267 (92.1%) | 0 (0.0%) |
| College / Associate Degree | 78 (71.6%) | 0 (0.0%) |
| Bachelor's Degree or higher | 47 (67.1%) | 0 (0.0%) |
| Total | 415 (80.1%) | 0 (0.0%) |
Employment Occupations by Sex in Boise City
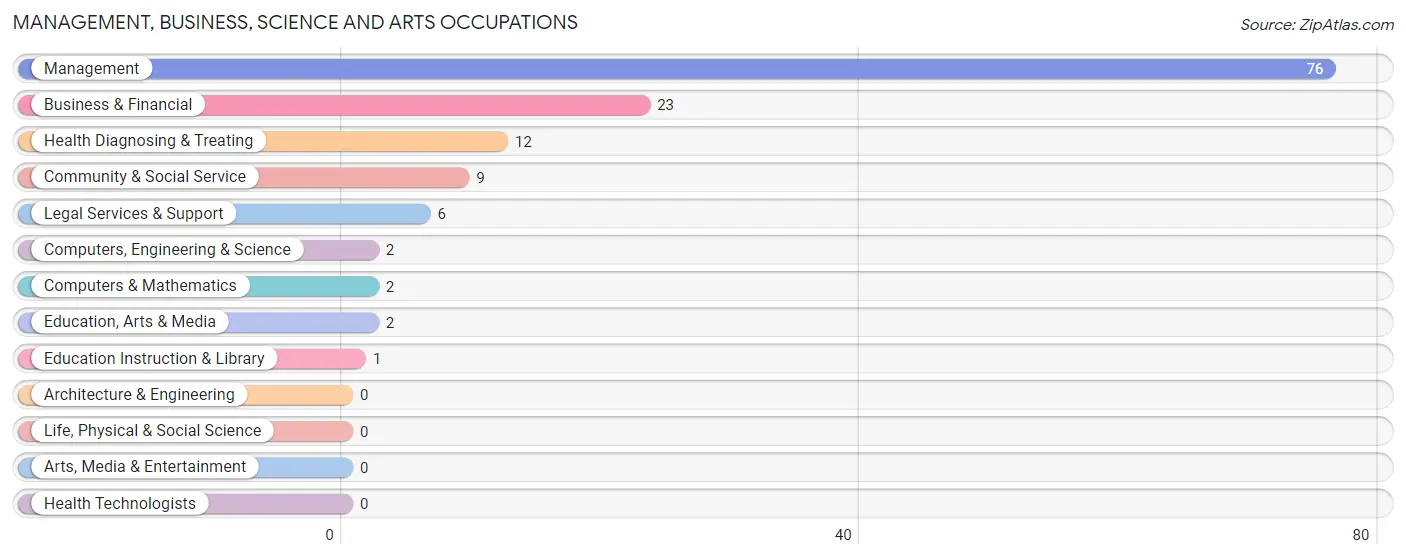
Management, Business, Science and Arts Occupations
The most common Management, Business, Science and Arts occupations in Boise City are Management (76 | 13.7%), Business & Financial (23 | 4.2%), Health Diagnosing & Treating (12 | 2.2%), Community & Social Service (9 | 1.6%), and Legal Services & Support (6 | 1.1%).
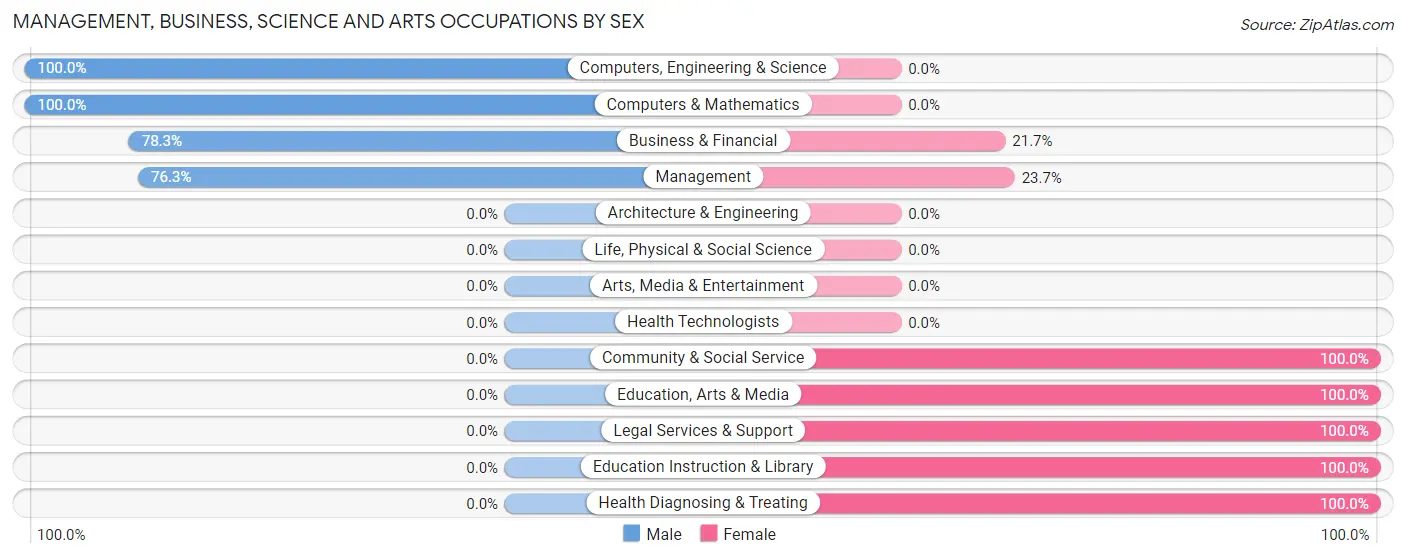
Management, Business, Science and Arts Occupations by Sex
Within the Management, Business, Science and Arts occupations in Boise City, the most male-oriented occupations are Computers, Engineering & Science (100.0%), Computers & Mathematics (100.0%), and Business & Financial (78.3%), while the most female-oriented occupations are Community & Social Service (100.0%), Education, Arts & Media (100.0%), and Legal Services & Support (100.0%).
| Occupation | Male | Female |
| Management | 58 (76.3%) | 18 (23.7%) |
| Business & Financial | 18 (78.3%) | 5 (21.7%) |
| Computers, Engineering & Science | 2 (100.0%) | 0 (0.0%) |
| Computers & Mathematics | 2 (100.0%) | 0 (0.0%) |
| Architecture & Engineering | 0 (0.0%) | 0 (0.0%) |
| Life, Physical & Social Science | 0 (0.0%) | 0 (0.0%) |
| Community & Social Service | 0 (0.0%) | 9 (100.0%) |
| Education, Arts & Media | 0 (0.0%) | 2 (100.0%) |
| Legal Services & Support | 0 (0.0%) | 6 (100.0%) |
| Education Instruction & Library | 0 (0.0%) | 1 (100.0%) |
| Arts, Media & Entertainment | 0 (0.0%) | 0 (0.0%) |
| Health Diagnosing & Treating | 0 (0.0%) | 12 (100.0%) |
| Health Technologists | 0 (0.0%) | 0 (0.0%) |
| Total (Category) | 78 (63.9%) | 44 (36.1%) |
| Total (Overall) | 314 (56.7%) | 240 (43.3%) |
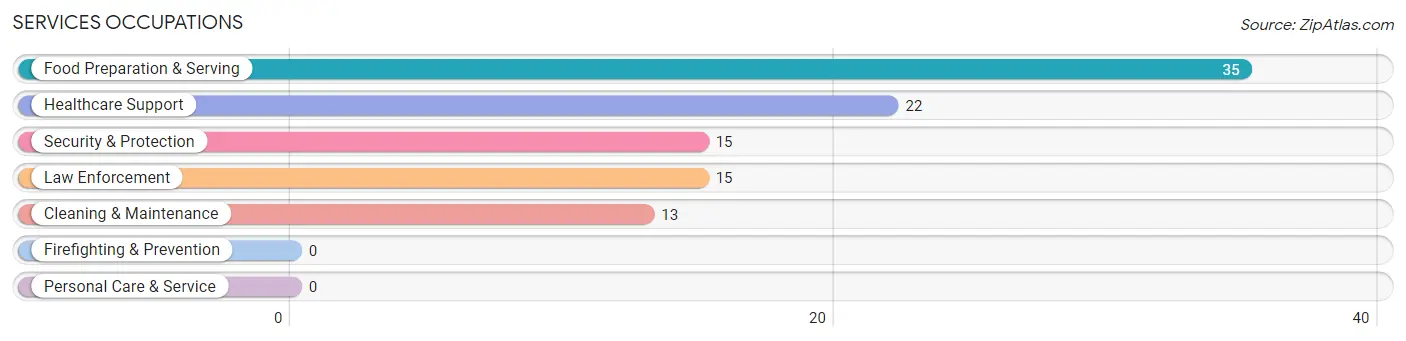
Services Occupations
The most common Services occupations in Boise City are Food Preparation & Serving (35 | 6.3%), Healthcare Support (22 | 4.0%), Security & Protection (15 | 2.7%), Law Enforcement (15 | 2.7%), and Cleaning & Maintenance (13 | 2.4%).
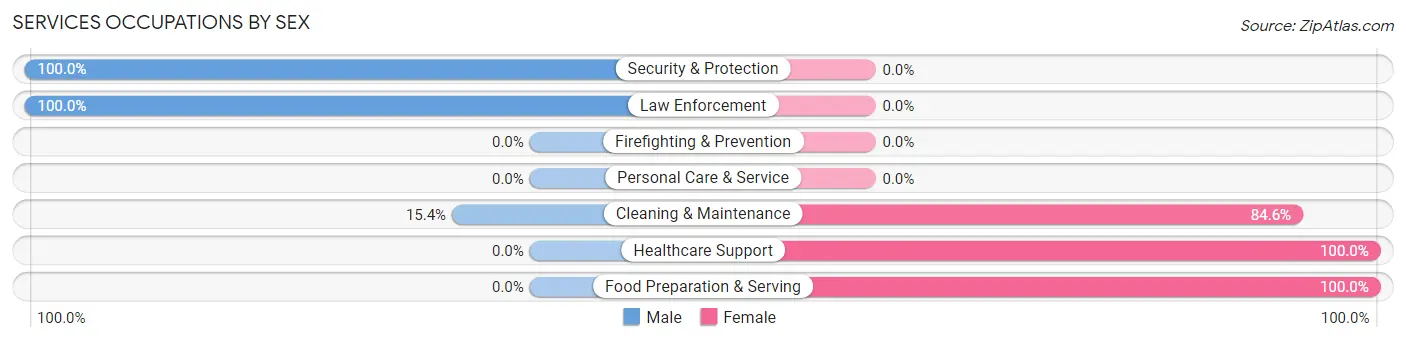
Services Occupations by Sex
Within the Services occupations in Boise City, the most male-oriented occupations are Security & Protection (100.0%), Law Enforcement (100.0%), and Cleaning & Maintenance (15.4%), while the most female-oriented occupations are Healthcare Support (100.0%), Food Preparation & Serving (100.0%), and Cleaning & Maintenance (84.6%).
| Occupation | Male | Female |
| Healthcare Support | 0 (0.0%) | 22 (100.0%) |
| Security & Protection | 15 (100.0%) | 0 (0.0%) |
| Firefighting & Prevention | 0 (0.0%) | 0 (0.0%) |
| Law Enforcement | 15 (100.0%) | 0 (0.0%) |
| Food Preparation & Serving | 0 (0.0%) | 35 (100.0%) |
| Cleaning & Maintenance | 2 (15.4%) | 11 (84.6%) |
| Personal Care & Service | 0 (0.0%) | 0 (0.0%) |
| Total (Category) | 17 (20.0%) | 68 (80.0%) |
| Total (Overall) | 314 (56.7%) | 240 (43.3%) |
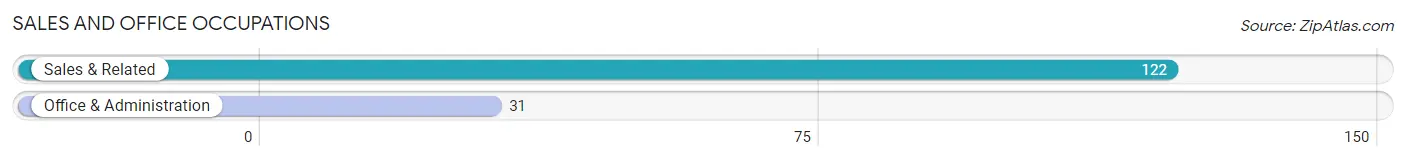
Sales and Office Occupations
The most common Sales and Office occupations in Boise City are Sales & Related (122 | 22.0%), and Office & Administration (31 | 5.6%).
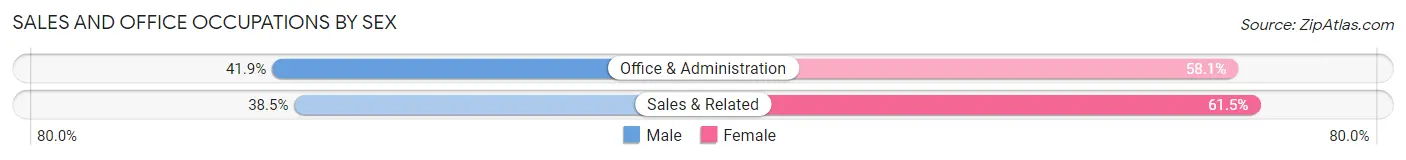
Sales and Office Occupations by Sex
| Occupation | Male | Female |
| Sales & Related | 47 (38.5%) | 75 (61.5%) |
| Office & Administration | 13 (41.9%) | 18 (58.1%) |
| Total (Category) | 60 (39.2%) | 93 (60.8%) |
| Total (Overall) | 314 (56.7%) | 240 (43.3%) |
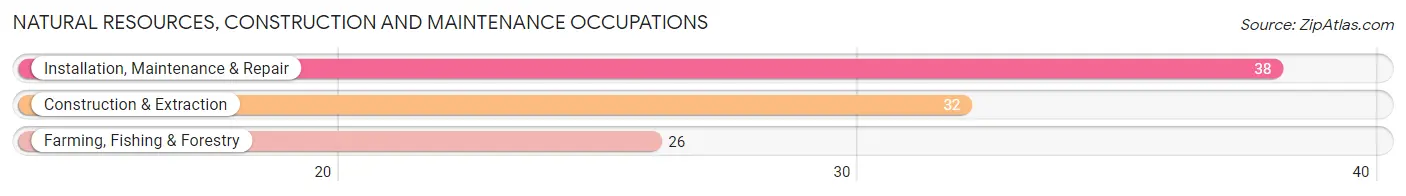
Natural Resources, Construction and Maintenance Occupations
The most common Natural Resources, Construction and Maintenance occupations in Boise City are Installation, Maintenance & Repair (38 | 6.9%), Construction & Extraction (32 | 5.8%), and Farming, Fishing & Forestry (26 | 4.7%).
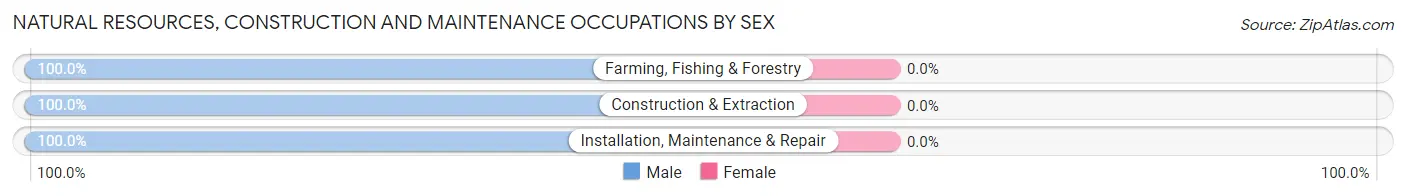
Natural Resources, Construction and Maintenance Occupations by Sex
| Occupation | Male | Female |
| Farming, Fishing & Forestry | 26 (100.0%) | 0 (0.0%) |
| Construction & Extraction | 32 (100.0%) | 0 (0.0%) |
| Installation, Maintenance & Repair | 38 (100.0%) | 0 (0.0%) |
| Total (Category) | 96 (100.0%) | 0 (0.0%) |
| Total (Overall) | 314 (56.7%) | 240 (43.3%) |
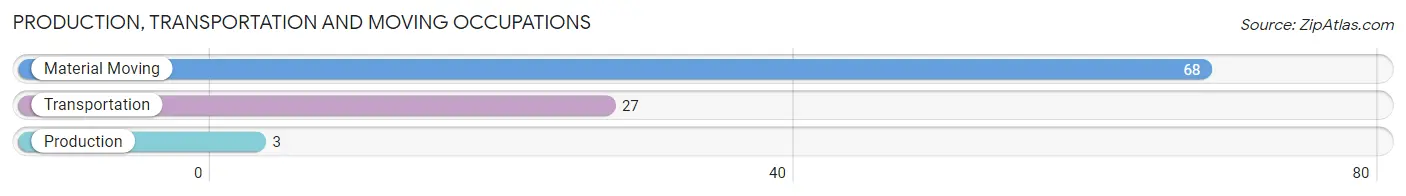
Production, Transportation and Moving Occupations
The most common Production, Transportation and Moving occupations in Boise City are Material Moving (68 | 12.3%), Transportation (27 | 4.9%), and Production (3 | 0.5%).
Production, Transportation and Moving Occupations by Sex
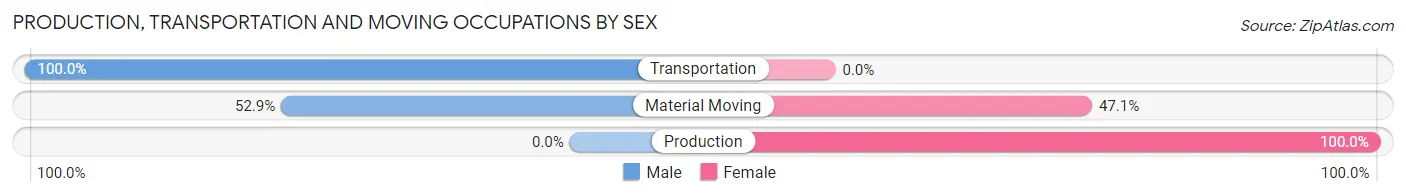
| Occupation | Male | Female |
| Production | 0 (0.0%) | 3 (100.0%) |
| Transportation | 27 (100.0%) | 0 (0.0%) |
| Material Moving | 36 (52.9%) | 32 (47.1%) |
| Total (Category) | 63 (64.3%) | 35 (35.7%) |
| Total (Overall) | 314 (56.7%) | 240 (43.3%) |
Employment Industries by Sex in Boise City
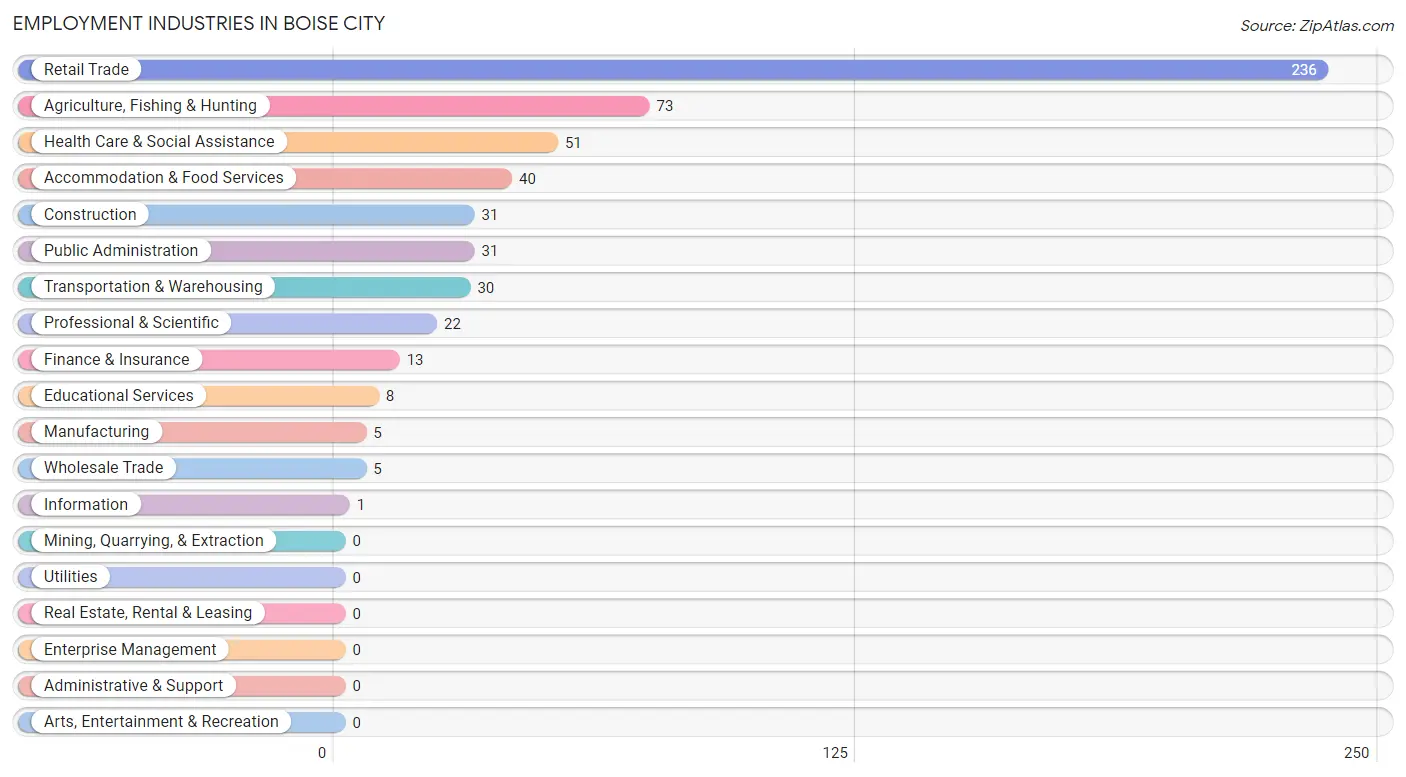
Employment Industries in Boise City
The major employment industries in Boise City include Retail Trade (236 | 42.6%), Agriculture, Fishing & Hunting (73 | 13.2%), Health Care & Social Assistance (51 | 9.2%), Accommodation & Food Services (40 | 7.2%), and Construction (31 | 5.6%).
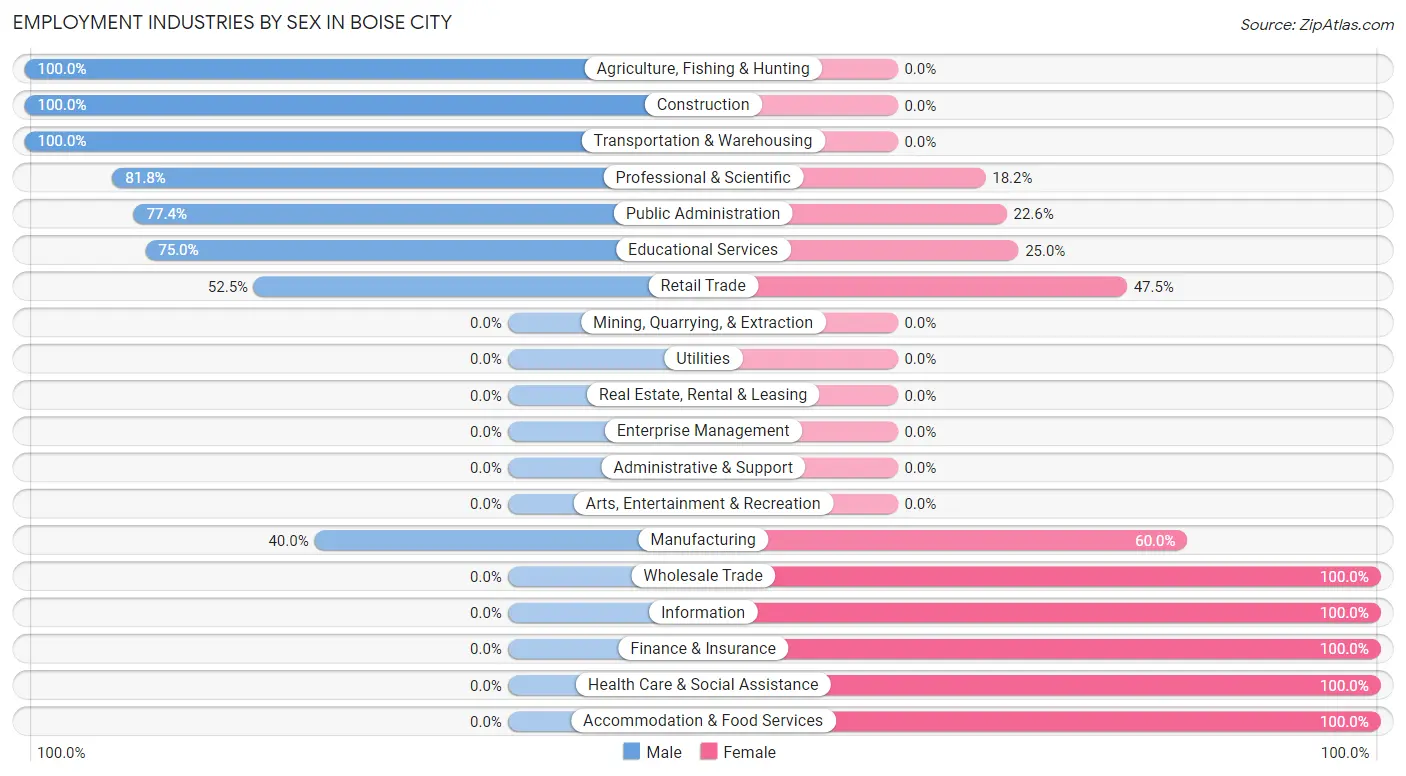
Employment Industries by Sex in Boise City
The Boise City industries that see more men than women are Agriculture, Fishing & Hunting (100.0%), Construction (100.0%), and Transportation & Warehousing (100.0%), whereas the industries that tend to have a higher number of women are Wholesale Trade (100.0%), Information (100.0%), and Finance & Insurance (100.0%).
| Industry | Male | Female |
| Agriculture, Fishing & Hunting | 73 (100.0%) | 0 (0.0%) |
| Mining, Quarrying, & Extraction | 0 (0.0%) | 0 (0.0%) |
| Construction | 31 (100.0%) | 0 (0.0%) |
| Manufacturing | 2 (40.0%) | 3 (60.0%) |
| Wholesale Trade | 0 (0.0%) | 5 (100.0%) |
| Retail Trade | 124 (52.5%) | 112 (47.5%) |
| Transportation & Warehousing | 30 (100.0%) | 0 (0.0%) |
| Utilities | 0 (0.0%) | 0 (0.0%) |
| Information | 0 (0.0%) | 1 (100.0%) |
| Finance & Insurance | 0 (0.0%) | 13 (100.0%) |
| Real Estate, Rental & Leasing | 0 (0.0%) | 0 (0.0%) |
| Professional & Scientific | 18 (81.8%) | 4 (18.2%) |
| Enterprise Management | 0 (0.0%) | 0 (0.0%) |
| Administrative & Support | 0 (0.0%) | 0 (0.0%) |
| Educational Services | 6 (75.0%) | 2 (25.0%) |
| Health Care & Social Assistance | 0 (0.0%) | 51 (100.0%) |
| Arts, Entertainment & Recreation | 0 (0.0%) | 0 (0.0%) |
| Accommodation & Food Services | 0 (0.0%) | 40 (100.0%) |
| Public Administration | 24 (77.4%) | 7 (22.6%) |
| Total | 314 (56.7%) | 240 (43.3%) |
Education in Boise City
School Enrollment in Boise City
The most common levels of schooling among the 350 students in Boise City are middle school (117 | 33.4%), elementary school (89 | 25.4%), and high school (77 | 22.0%).
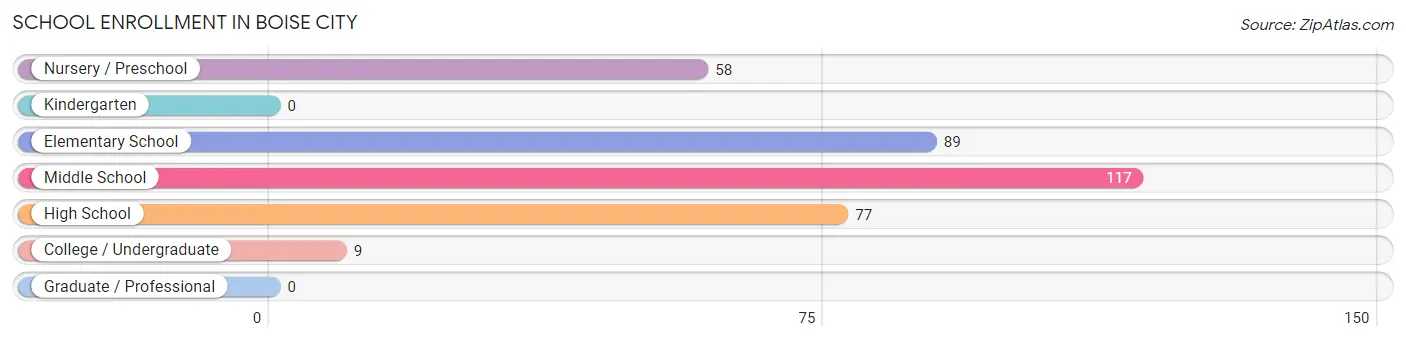
| School Level | # Students | % Students |
| Nursery / Preschool | 58 | 16.6% |
| Kindergarten | 0 | 0.0% |
| Elementary School | 89 | 25.4% |
| Middle School | 117 | 33.4% |
| High School | 77 | 22.0% |
| College / Undergraduate | 9 | 2.6% |
| Graduate / Professional | 0 | 0.0% |
| Total | 350 | 100.0% |
School Enrollment by Age by Funding Source in Boise City
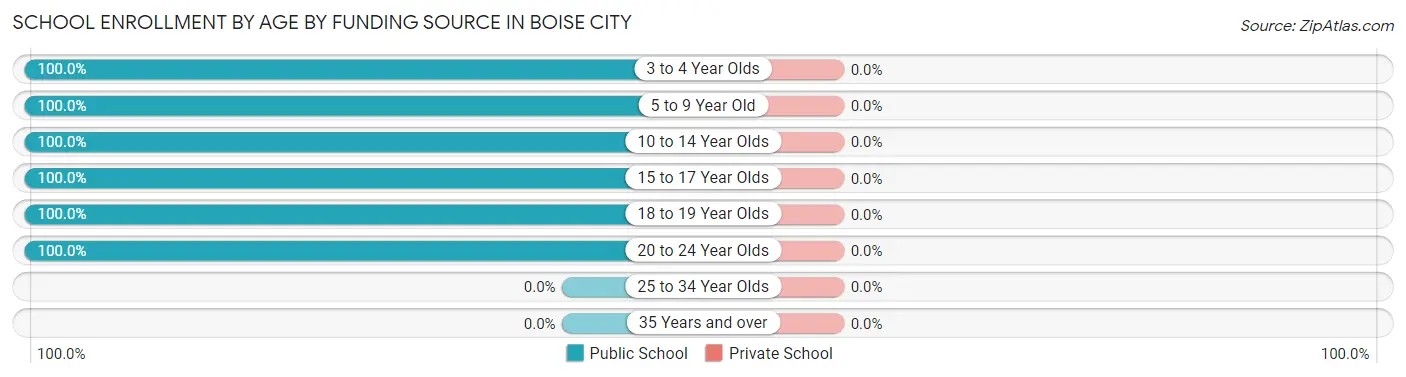
| Age Bracket | Public School | Private School |
| 3 to 4 Year Olds | 58 (100.0%) | 0 (0.0%) |
| 5 to 9 Year Old | 77 (100.0%) | 0 (0.0%) |
| 10 to 14 Year Olds | 142 (100.0%) | 0 (0.0%) |
| 15 to 17 Year Olds | 18 (100.0%) | 0 (0.0%) |
| 18 to 19 Year Olds | 14 (100.0%) | 0 (0.0%) |
| 20 to 24 Year Olds | 41 (100.0%) | 0 (0.0%) |
| 25 to 34 Year Olds | 0 (0.0%) | 0 (0.0%) |
| 35 Years and over | 0 (0.0%) | 0 (0.0%) |
| Total | 350 (100.0%) | 0 (0.0%) |
Educational Attainment by Field of Study in Boise City
Business (48 | 42.5%), arts & humanities (23 | 20.3%), computers & mathematics (15 | 13.3%), science & technology (9 | 8.0%), and education (7 | 6.2%) are the most common fields of study among 113 individuals in Boise City who have obtained a bachelor's degree or higher.
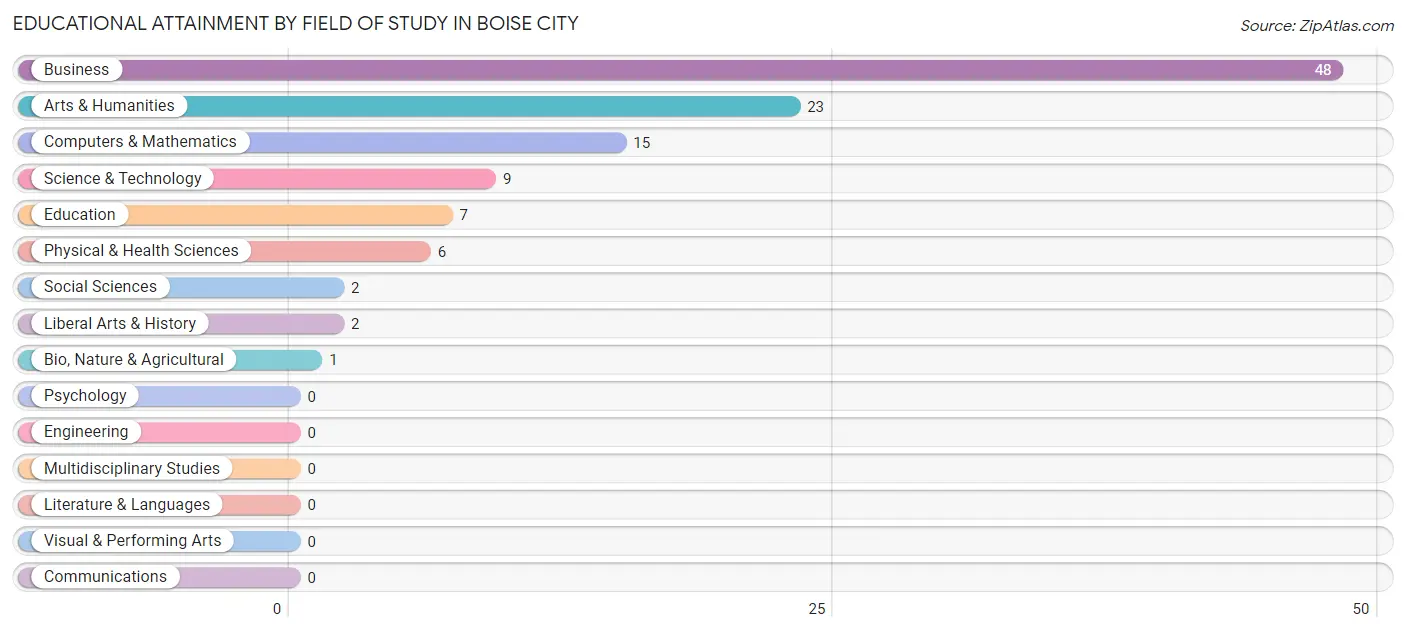
| Field of Study | # Graduates | % Graduates |
| Computers & Mathematics | 15 | 13.3% |
| Bio, Nature & Agricultural | 1 | 0.9% |
| Physical & Health Sciences | 6 | 5.3% |
| Psychology | 0 | 0.0% |
| Social Sciences | 2 | 1.8% |
| Engineering | 0 | 0.0% |
| Multidisciplinary Studies | 0 | 0.0% |
| Science & Technology | 9 | 8.0% |
| Business | 48 | 42.5% |
| Education | 7 | 6.2% |
| Literature & Languages | 0 | 0.0% |
| Liberal Arts & History | 2 | 1.8% |
| Visual & Performing Arts | 0 | 0.0% |
| Communications | 0 | 0.0% |
| Arts & Humanities | 23 | 20.3% |
| Total | 113 | 100.0% |
Transportation & Commute in Boise City
Vehicle Availability by Sex in Boise City
The most prevalent vehicle ownership categories in Boise City are males with 3 vehicles (142, accounting for 45.2%) and females with 3 vehicles (95, making up 59.9%).
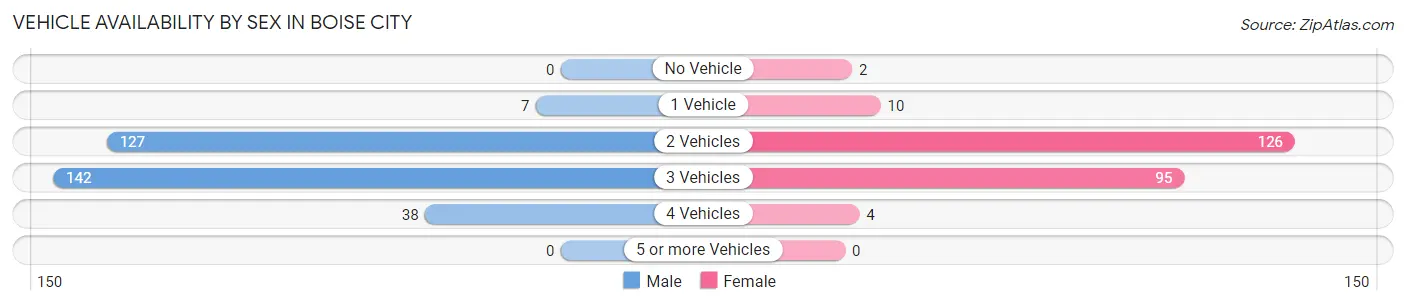
| Vehicles Available | Male | Female |
| No Vehicle | 0 (0.0%) | 2 (0.8%) |
| 1 Vehicle | 7 (2.2%) | 10 (4.2%) |
| 2 Vehicles | 127 (40.5%) | 126 (53.2%) |
| 3 Vehicles | 142 (45.2%) | 95 (40.1%) |
| 4 Vehicles | 38 (12.1%) | 4 (1.7%) |
| 5 or more Vehicles | 0 (0.0%) | 0 (0.0%) |
| Total | 314 (100.0%) | 237 (100.0%) |
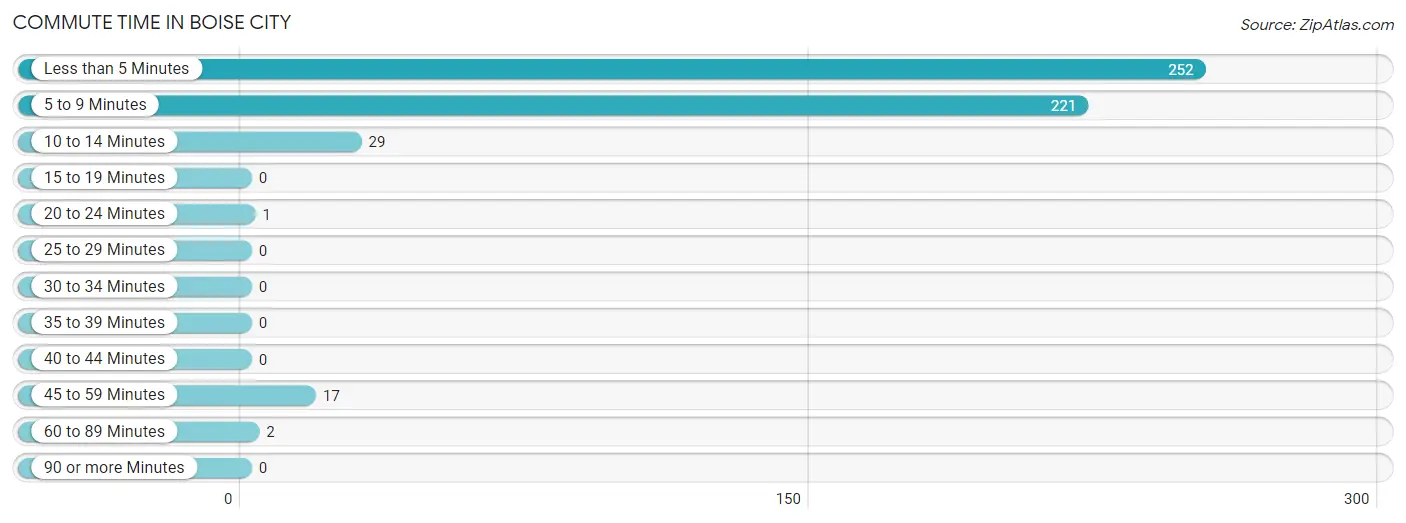
Commute Time in Boise City
The most frequently occuring commute durations in Boise City are less than 5 minutes (252 commuters, 48.3%), 5 to 9 minutes (221 commuters, 42.3%), and 10 to 14 minutes (29 commuters, 5.6%).
| Commute Time | # Commuters | % Commuters |
| Less than 5 Minutes | 252 | 48.3% |
| 5 to 9 Minutes | 221 | 42.3% |
| 10 to 14 Minutes | 29 | 5.6% |
| 15 to 19 Minutes | 0 | 0.0% |
| 20 to 24 Minutes | 1 | 0.2% |
| 25 to 29 Minutes | 0 | 0.0% |
| 30 to 34 Minutes | 0 | 0.0% |
| 35 to 39 Minutes | 0 | 0.0% |
| 40 to 44 Minutes | 0 | 0.0% |
| 45 to 59 Minutes | 17 | 3.3% |
| 60 to 89 Minutes | 2 | 0.4% |
| 90 or more Minutes | 0 | 0.0% |
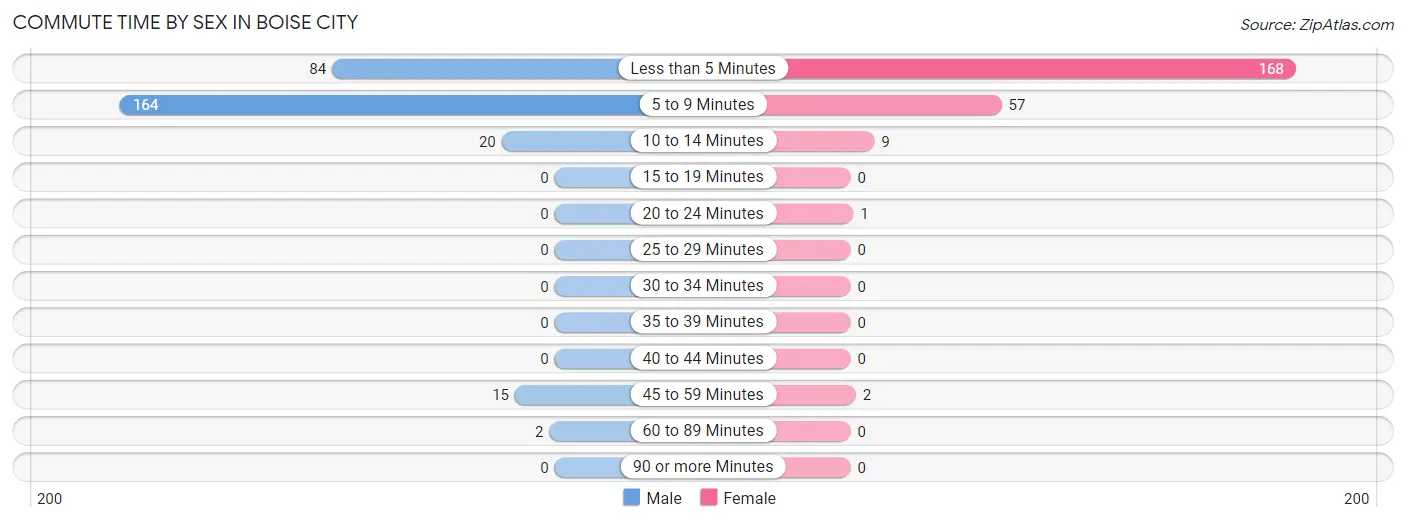
Commute Time by Sex in Boise City
The most common commute times in Boise City are 5 to 9 minutes (164 commuters, 57.5%) for males and less than 5 minutes (168 commuters, 70.9%) for females.
| Commute Time | Male | Female |
| Less than 5 Minutes | 84 (29.5%) | 168 (70.9%) |
| 5 to 9 Minutes | 164 (57.5%) | 57 (24.0%) |
| 10 to 14 Minutes | 20 (7.0%) | 9 (3.8%) |
| 15 to 19 Minutes | 0 (0.0%) | 0 (0.0%) |
| 20 to 24 Minutes | 0 (0.0%) | 1 (0.4%) |
| 25 to 29 Minutes | 0 (0.0%) | 0 (0.0%) |
| 30 to 34 Minutes | 0 (0.0%) | 0 (0.0%) |
| 35 to 39 Minutes | 0 (0.0%) | 0 (0.0%) |
| 40 to 44 Minutes | 0 (0.0%) | 0 (0.0%) |
| 45 to 59 Minutes | 15 (5.3%) | 2 (0.8%) |
| 60 to 89 Minutes | 2 (0.7%) | 0 (0.0%) |
| 90 or more Minutes | 0 (0.0%) | 0 (0.0%) |
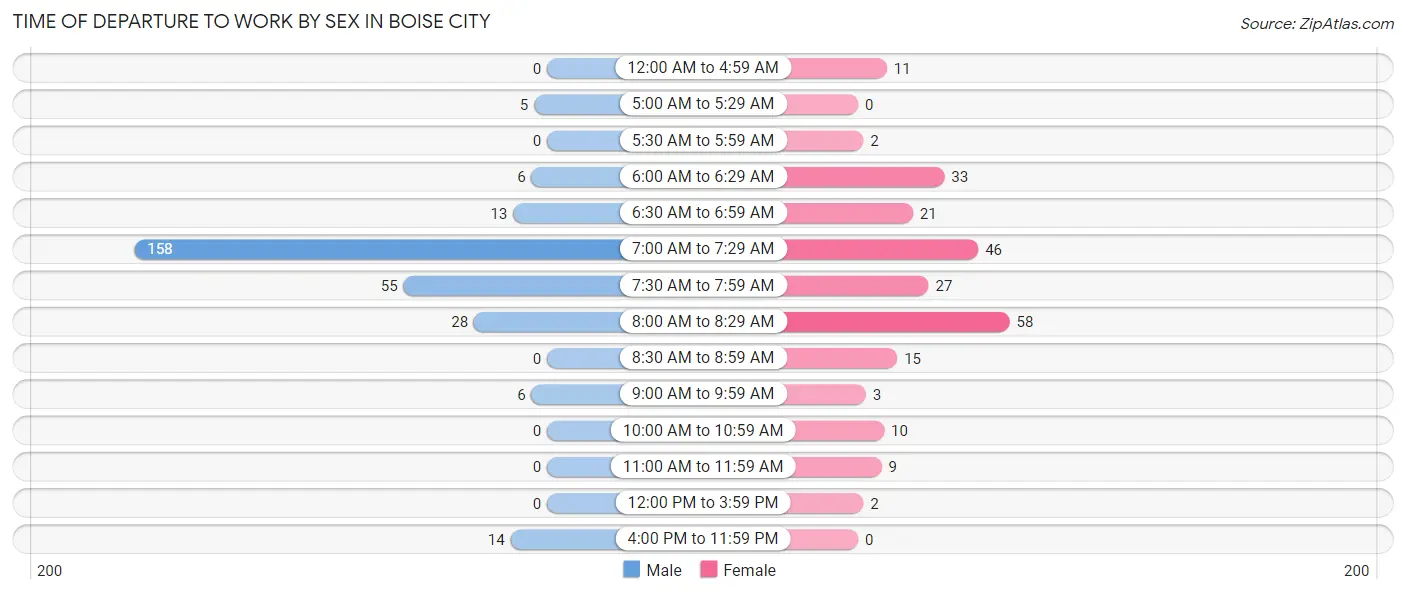
Time of Departure to Work by Sex in Boise City
The most frequent times of departure to work in Boise City are 7:00 AM to 7:29 AM (158, 55.4%) for males and 8:00 AM to 8:29 AM (58, 24.5%) for females.
| Time of Departure | Male | Female |
| 12:00 AM to 4:59 AM | 0 (0.0%) | 11 (4.6%) |
| 5:00 AM to 5:29 AM | 5 (1.8%) | 0 (0.0%) |
| 5:30 AM to 5:59 AM | 0 (0.0%) | 2 (0.8%) |
| 6:00 AM to 6:29 AM | 6 (2.1%) | 33 (13.9%) |
| 6:30 AM to 6:59 AM | 13 (4.6%) | 21 (8.9%) |
| 7:00 AM to 7:29 AM | 158 (55.4%) | 46 (19.4%) |
| 7:30 AM to 7:59 AM | 55 (19.3%) | 27 (11.4%) |
| 8:00 AM to 8:29 AM | 28 (9.8%) | 58 (24.5%) |
| 8:30 AM to 8:59 AM | 0 (0.0%) | 15 (6.3%) |
| 9:00 AM to 9:59 AM | 6 (2.1%) | 3 (1.3%) |
| 10:00 AM to 10:59 AM | 0 (0.0%) | 10 (4.2%) |
| 11:00 AM to 11:59 AM | 0 (0.0%) | 9 (3.8%) |
| 12:00 PM to 3:59 PM | 0 (0.0%) | 2 (0.8%) |
| 4:00 PM to 11:59 PM | 14 (4.9%) | 0 (0.0%) |
| Total | 285 (100.0%) | 237 (100.0%) |
Housing Occupancy in Boise City
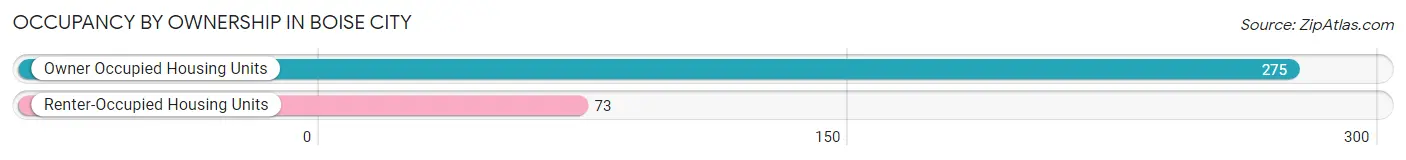
Occupancy by Ownership in Boise City
Of the total 348 dwellings in Boise City, owner-occupied units account for 275 (79.0%), while renter-occupied units make up 73 (21.0%).
| Occupancy | # Housing Units | % Housing Units |
| Owner Occupied Housing Units | 275 | 79.0% |
| Renter-Occupied Housing Units | 73 | 21.0% |
| Total Occupied Housing Units | 348 | 100.0% |
Occupancy by Household Size in Boise City
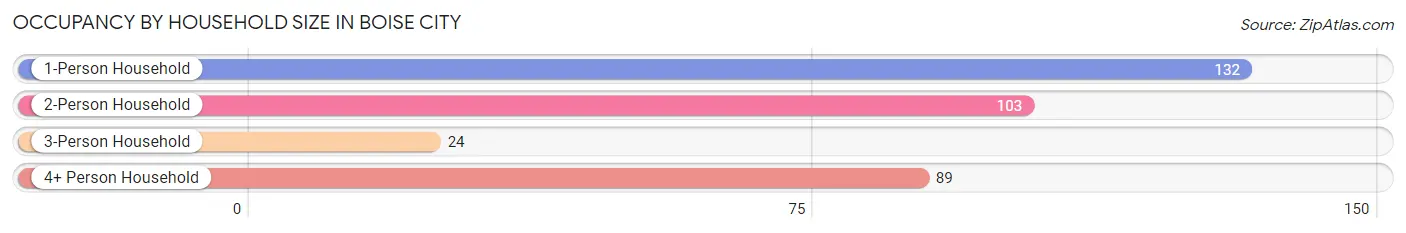
| Household Size | # Housing Units | % Housing Units |
| 1-Person Household | 132 | 37.9% |
| 2-Person Household | 103 | 29.6% |
| 3-Person Household | 24 | 6.9% |
| 4+ Person Household | 89 | 25.6% |
| Total Housing Units | 348 | 100.0% |
Occupancy by Ownership by Household Size in Boise City
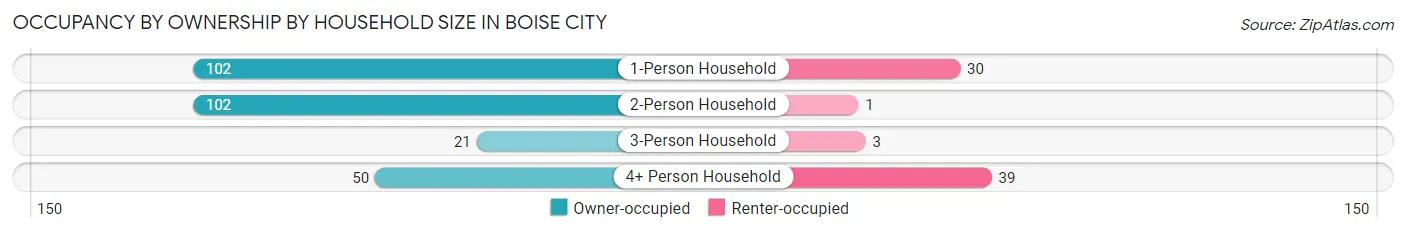
| Household Size | Owner-occupied | Renter-occupied |
| 1-Person Household | 102 (77.3%) | 30 (22.7%) |
| 2-Person Household | 102 (99.0%) | 1 (1.0%) |
| 3-Person Household | 21 (87.5%) | 3 (12.5%) |
| 4+ Person Household | 50 (56.2%) | 39 (43.8%) |
| Total Housing Units | 275 (79.0%) | 73 (21.0%) |
Occupancy by Educational Attainment in Boise City
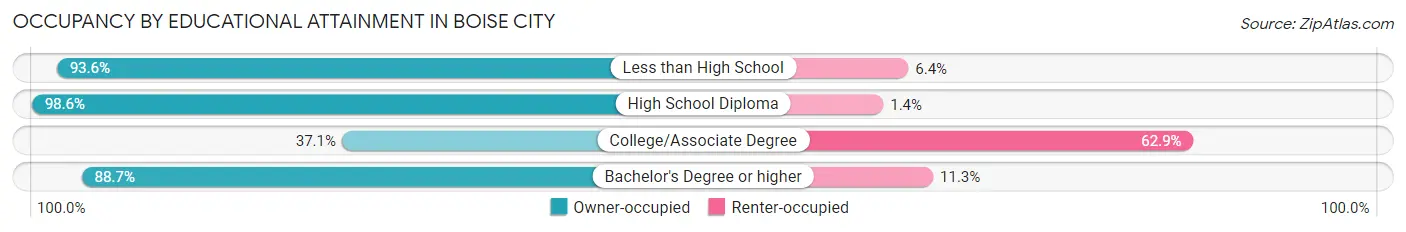
| Household Size | Owner-occupied | Renter-occupied |
| Less than High School | 44 (93.6%) | 3 (6.4%) |
| High School Diploma | 140 (98.6%) | 2 (1.4%) |
| College/Associate Degree | 36 (37.1%) | 61 (62.9%) |
| Bachelor's Degree or higher | 55 (88.7%) | 7 (11.3%) |
Occupancy by Age of Householder in Boise City
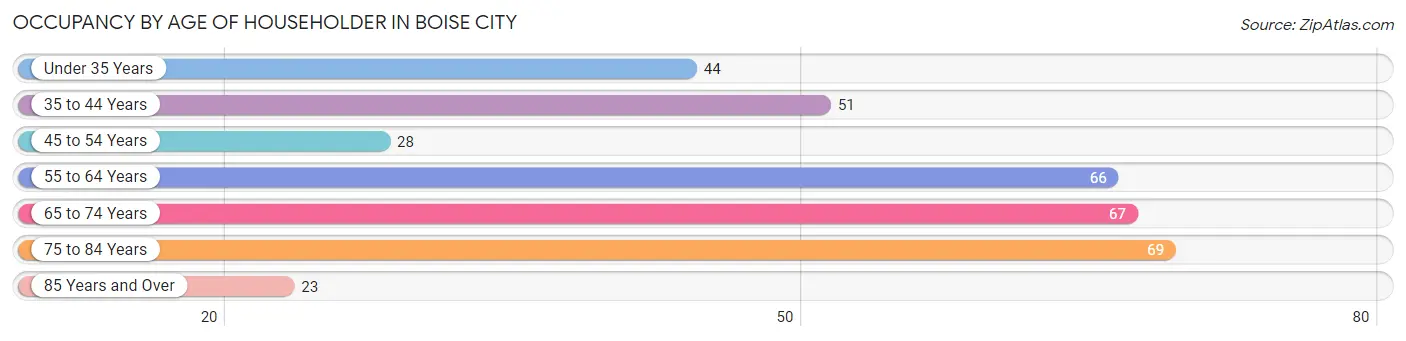
| Age Bracket | # Households | % Households |
| Under 35 Years | 44 | 12.6% |
| 35 to 44 Years | 51 | 14.7% |
| 45 to 54 Years | 28 | 8.1% |
| 55 to 64 Years | 66 | 19.0% |
| 65 to 74 Years | 67 | 19.3% |
| 75 to 84 Years | 69 | 19.8% |
| 85 Years and Over | 23 | 6.6% |
| Total | 348 | 100.0% |
Housing Finances in Boise City
Median Income by Occupancy in Boise City
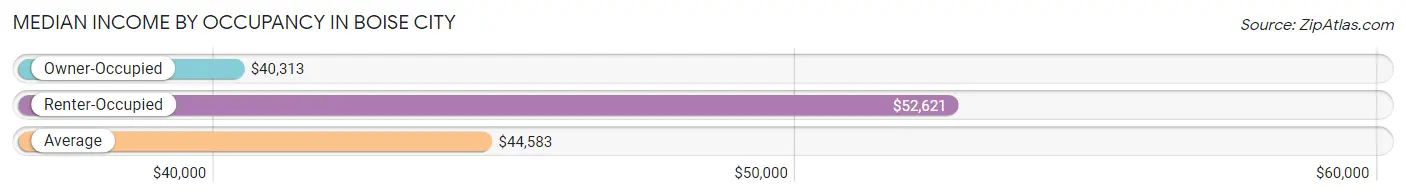
| Occupancy Type | # Households | Median Income |
| Owner-Occupied | 275 (79.0%) | $40,313 |
| Renter-Occupied | 73 (21.0%) | $52,621 |
| Average | 348 (100.0%) | $44,583 |
Occupancy by Householder Income Bracket in Boise City
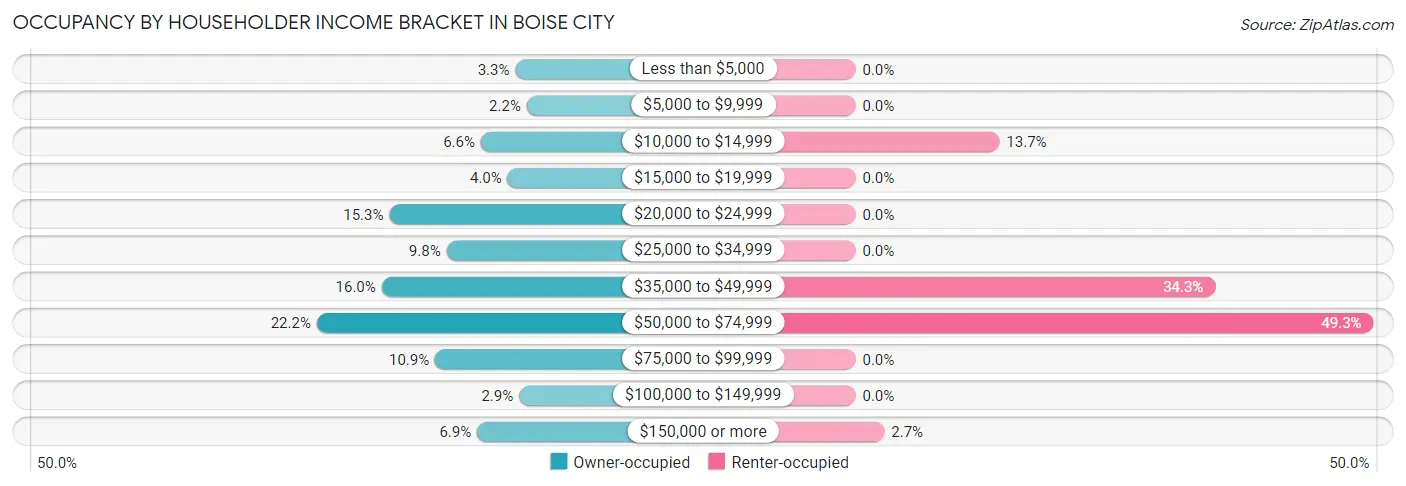
| Income Bracket | Owner-occupied | Renter-occupied |
| Less than $5,000 | 9 (3.3%) | 0 (0.0%) |
| $5,000 to $9,999 | 6 (2.2%) | 0 (0.0%) |
| $10,000 to $14,999 | 18 (6.6%) | 10 (13.7%) |
| $15,000 to $19,999 | 11 (4.0%) | 0 (0.0%) |
| $20,000 to $24,999 | 42 (15.3%) | 0 (0.0%) |
| $25,000 to $34,999 | 27 (9.8%) | 0 (0.0%) |
| $35,000 to $49,999 | 44 (16.0%) | 25 (34.3%) |
| $50,000 to $74,999 | 61 (22.2%) | 36 (49.3%) |
| $75,000 to $99,999 | 30 (10.9%) | 0 (0.0%) |
| $100,000 to $149,999 | 8 (2.9%) | 0 (0.0%) |
| $150,000 or more | 19 (6.9%) | 2 (2.7%) |
| Total | 275 (100.0%) | 73 (100.0%) |
Monthly Housing Cost Tiers in Boise City
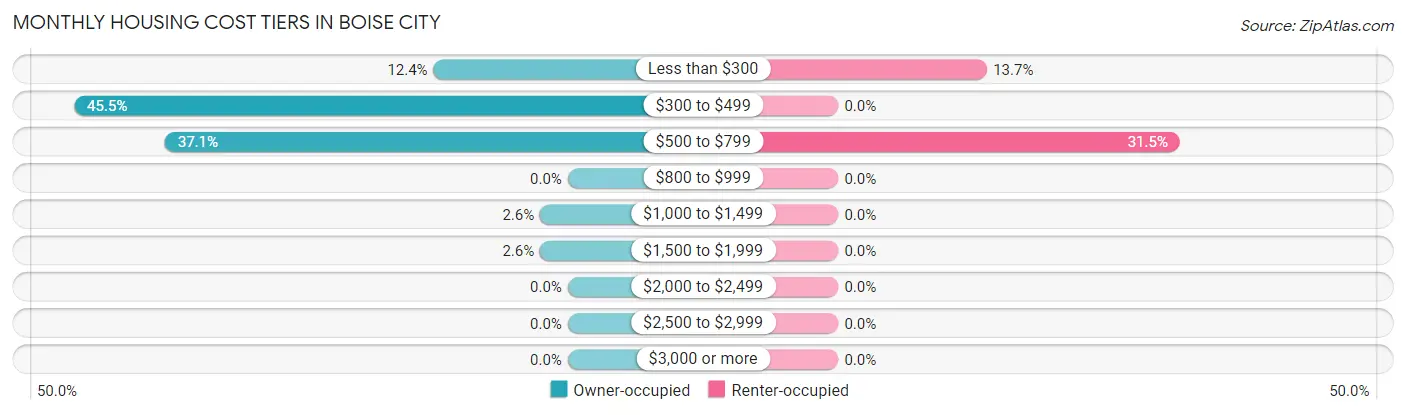
| Monthly Cost | Owner-occupied | Renter-occupied |
| Less than $300 | 34 (12.4%) | 10 (13.7%) |
| $300 to $499 | 125 (45.5%) | 0 (0.0%) |
| $500 to $799 | 102 (37.1%) | 23 (31.5%) |
| $800 to $999 | 0 (0.0%) | 0 (0.0%) |
| $1,000 to $1,499 | 7 (2.5%) | 0 (0.0%) |
| $1,500 to $1,999 | 7 (2.5%) | 0 (0.0%) |
| $2,000 to $2,499 | 0 (0.0%) | 0 (0.0%) |
| $2,500 to $2,999 | 0 (0.0%) | 0 (0.0%) |
| $3,000 or more | 0 (0.0%) | 0 (0.0%) |
| Total | 275 (100.0%) | 73 (100.0%) |
Physical Housing Characteristics in Boise City
Housing Structures in Boise City
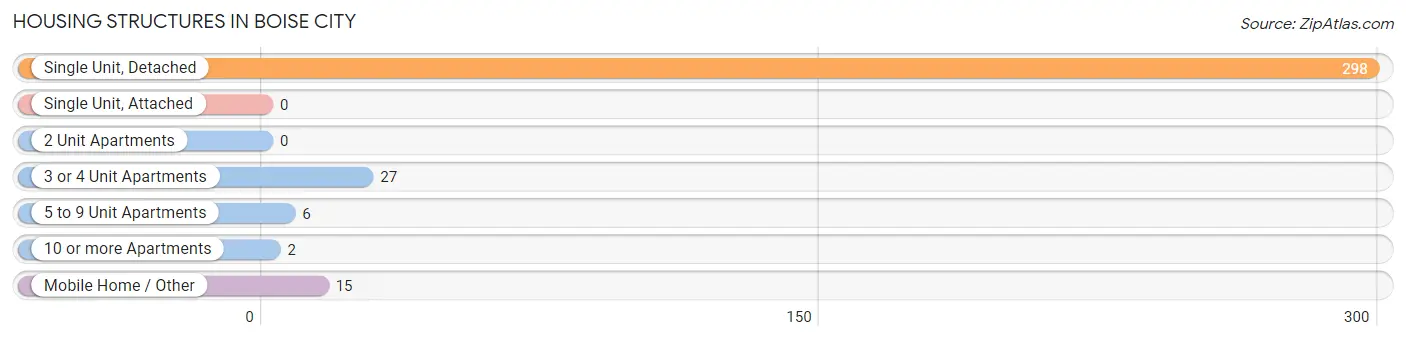
| Structure Type | # Housing Units | % Housing Units |
| Single Unit, Detached | 298 | 85.6% |
| Single Unit, Attached | 0 | 0.0% |
| 2 Unit Apartments | 0 | 0.0% |
| 3 or 4 Unit Apartments | 27 | 7.8% |
| 5 to 9 Unit Apartments | 6 | 1.7% |
| 10 or more Apartments | 2 | 0.6% |
| Mobile Home / Other | 15 | 4.3% |
| Total | 348 | 100.0% |
Housing Structures by Occupancy in Boise City
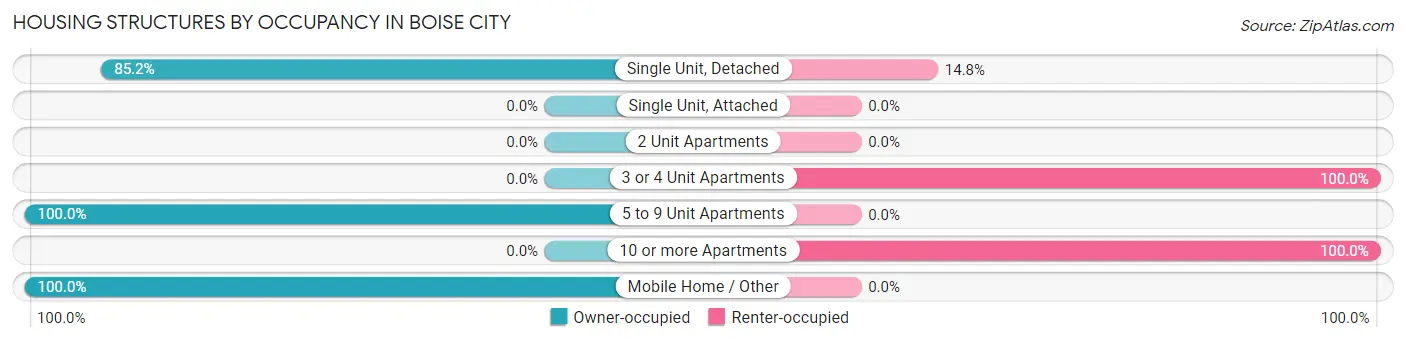
| Structure Type | Owner-occupied | Renter-occupied |
| Single Unit, Detached | 254 (85.2%) | 44 (14.8%) |
| Single Unit, Attached | 0 (0.0%) | 0 (0.0%) |
| 2 Unit Apartments | 0 (0.0%) | 0 (0.0%) |
| 3 or 4 Unit Apartments | 0 (0.0%) | 27 (100.0%) |
| 5 to 9 Unit Apartments | 6 (100.0%) | 0 (0.0%) |
| 10 or more Apartments | 0 (0.0%) | 2 (100.0%) |
| Mobile Home / Other | 15 (100.0%) | 0 (0.0%) |
| Total | 275 (79.0%) | 73 (21.0%) |
Housing Structures by Number of Rooms in Boise City
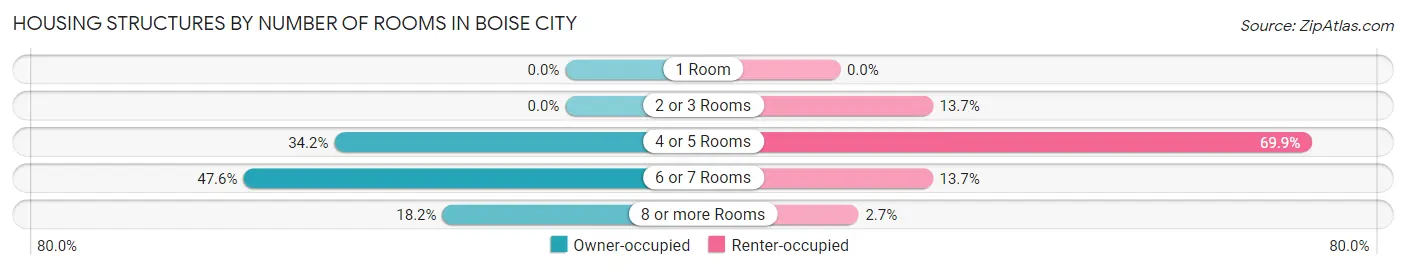
| Number of Rooms | Owner-occupied | Renter-occupied |
| 1 Room | 0 (0.0%) | 0 (0.0%) |
| 2 or 3 Rooms | 0 (0.0%) | 10 (13.7%) |
| 4 or 5 Rooms | 94 (34.2%) | 51 (69.9%) |
| 6 or 7 Rooms | 131 (47.6%) | 10 (13.7%) |
| 8 or more Rooms | 50 (18.2%) | 2 (2.7%) |
| Total | 275 (100.0%) | 73 (100.0%) |
Housing Structure by Heating Type in Boise City
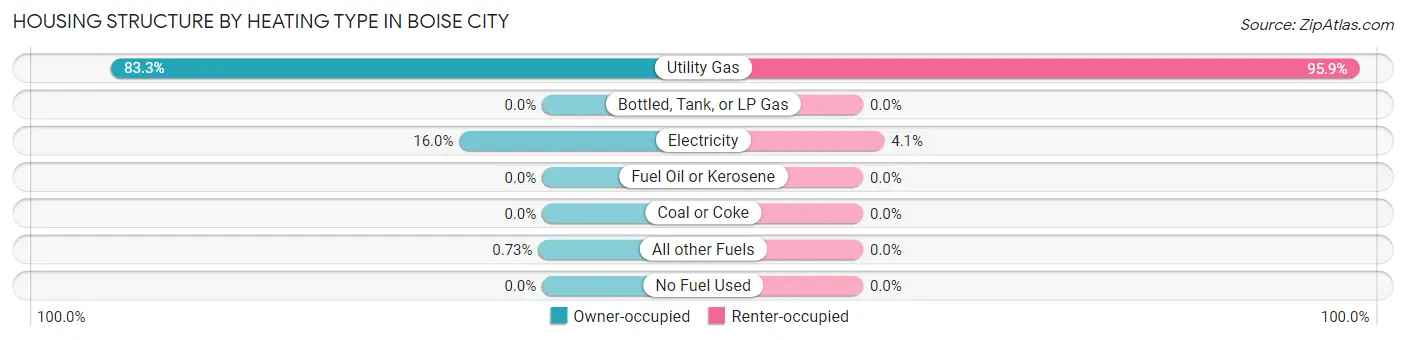
| Heating Type | Owner-occupied | Renter-occupied |
| Utility Gas | 229 (83.3%) | 70 (95.9%) |
| Bottled, Tank, or LP Gas | 0 (0.0%) | 0 (0.0%) |
| Electricity | 44 (16.0%) | 3 (4.1%) |
| Fuel Oil or Kerosene | 0 (0.0%) | 0 (0.0%) |
| Coal or Coke | 0 (0.0%) | 0 (0.0%) |
| All other Fuels | 2 (0.7%) | 0 (0.0%) |
| No Fuel Used | 0 (0.0%) | 0 (0.0%) |
| Total | 275 (100.0%) | 73 (100.0%) |
Household Vehicle Usage in Boise City
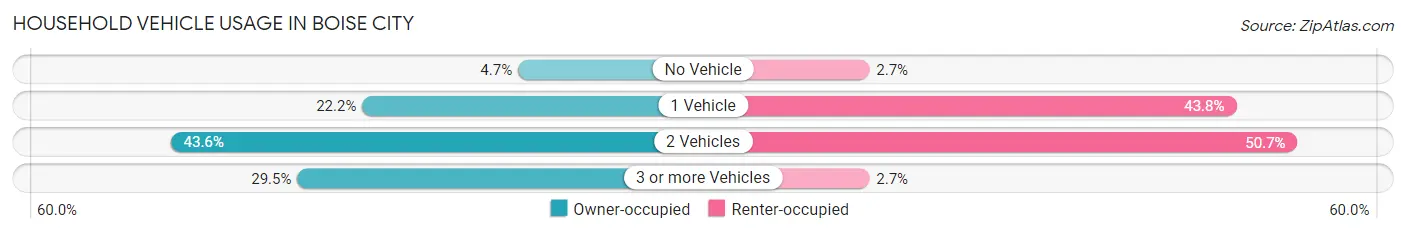
| Vehicles per Household | Owner-occupied | Renter-occupied |
| No Vehicle | 13 (4.7%) | 2 (2.7%) |
| 1 Vehicle | 61 (22.2%) | 32 (43.8%) |
| 2 Vehicles | 120 (43.6%) | 37 (50.7%) |
| 3 or more Vehicles | 81 (29.4%) | 2 (2.7%) |
| Total | 275 (100.0%) | 73 (100.0%) |
Real Estate & Mortgages in Boise City
Real Estate and Mortgage Overview in Boise City
| Characteristic | Without Mortgage | With Mortgage |
| Housing Units | 217 | 58 |
| Median Property Value | $61,900 | $50,800 |
| Median Household Income | $38,750 | $2 |
| Monthly Housing Costs | $425 | $0 |
| Real Estate Taxes | $245 | $0 |
Property Value by Mortgage Status in Boise City
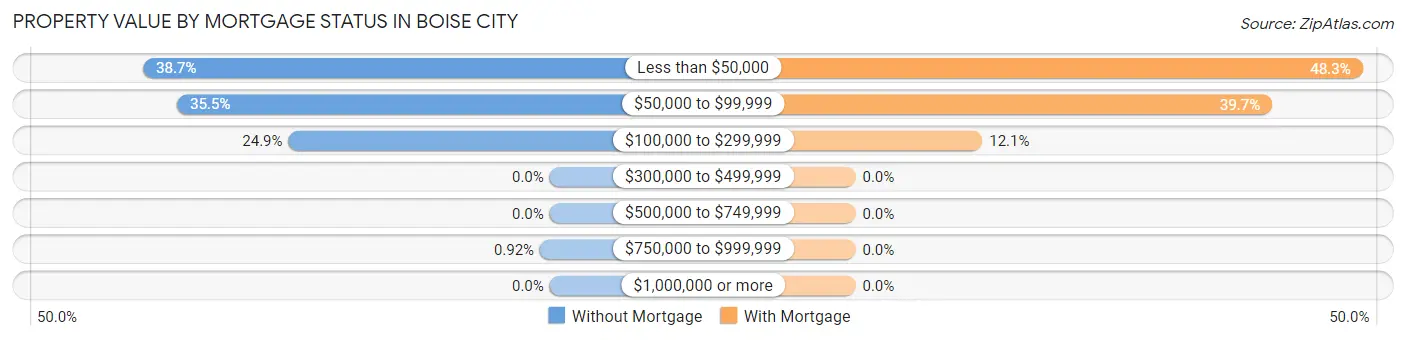
| Property Value | Without Mortgage | With Mortgage |
| Less than $50,000 | 84 (38.7%) | 28 (48.3%) |
| $50,000 to $99,999 | 77 (35.5%) | 23 (39.7%) |
| $100,000 to $299,999 | 54 (24.9%) | 7 (12.1%) |
| $300,000 to $499,999 | 0 (0.0%) | 0 (0.0%) |
| $500,000 to $749,999 | 0 (0.0%) | 0 (0.0%) |
| $750,000 to $999,999 | 2 (0.9%) | 0 (0.0%) |
| $1,000,000 or more | 0 (0.0%) | 0 (0.0%) |
| Total | 217 (100.0%) | 58 (100.0%) |
Household Income by Mortgage Status in Boise City
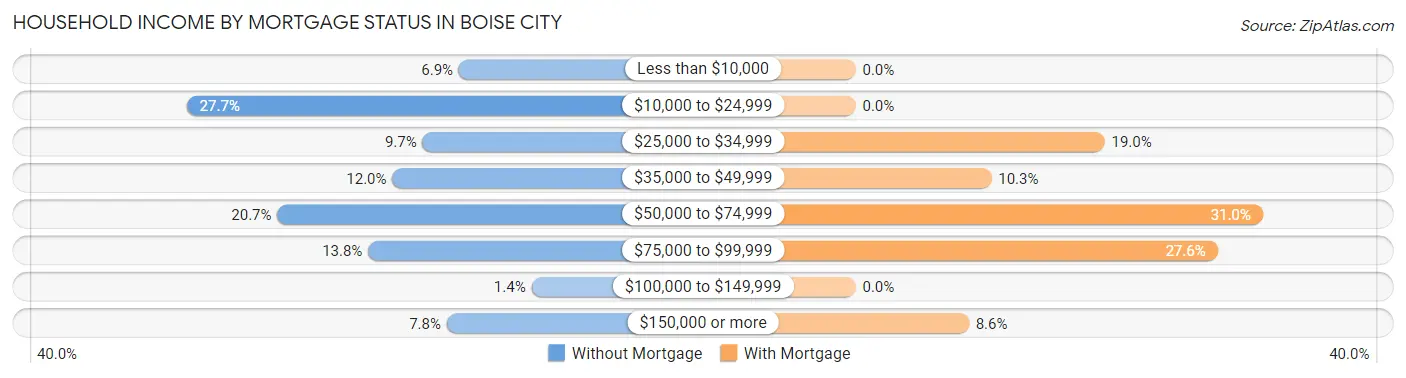
| Household Income | Without Mortgage | With Mortgage |
| Less than $10,000 | 15 (6.9%) | 0 (0.0%) |
| $10,000 to $24,999 | 60 (27.7%) | 0 (0.0%) |
| $25,000 to $34,999 | 21 (9.7%) | 11 (19.0%) |
| $35,000 to $49,999 | 26 (12.0%) | 6 (10.3%) |
| $50,000 to $74,999 | 45 (20.7%) | 18 (31.0%) |
| $75,000 to $99,999 | 30 (13.8%) | 16 (27.6%) |
| $100,000 to $149,999 | 3 (1.4%) | 0 (0.0%) |
| $150,000 or more | 17 (7.8%) | 5 (8.6%) |
| Total | 217 (100.0%) | 58 (100.0%) |
Property Value to Household Income Ratio in Boise City
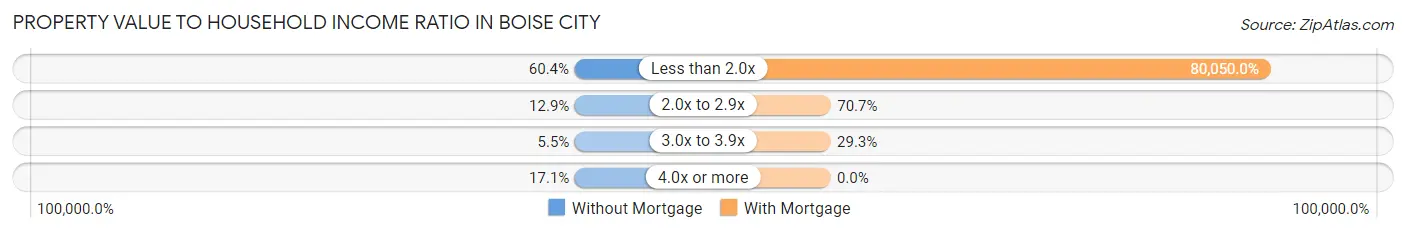
| Value-to-Income Ratio | Without Mortgage | With Mortgage |
| Less than 2.0x | 131 (60.4%) | 46,429 (80,050.0%) |
| 2.0x to 2.9x | 28 (12.9%) | 41 (70.7%) |
| 3.0x to 3.9x | 12 (5.5%) | 17 (29.3%) |
| 4.0x or more | 37 (17.1%) | 0 (0.0%) |
| Total | 217 (100.0%) | 58 (100.0%) |
Real Estate Taxes by Mortgage Status in Boise City
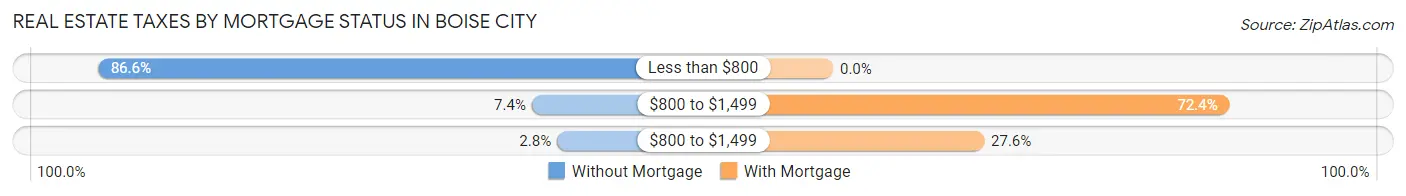
| Property Taxes | Without Mortgage | With Mortgage |
| Less than $800 | 188 (86.6%) | 0 (0.0%) |
| $800 to $1,499 | 16 (7.4%) | 42 (72.4%) |
| $800 to $1,499 | 6 (2.8%) | 16 (27.6%) |
| Total | 217 (100.0%) | 58 (100.0%) |
Health & Disability in Boise City
Health Insurance Coverage by Age in Boise City
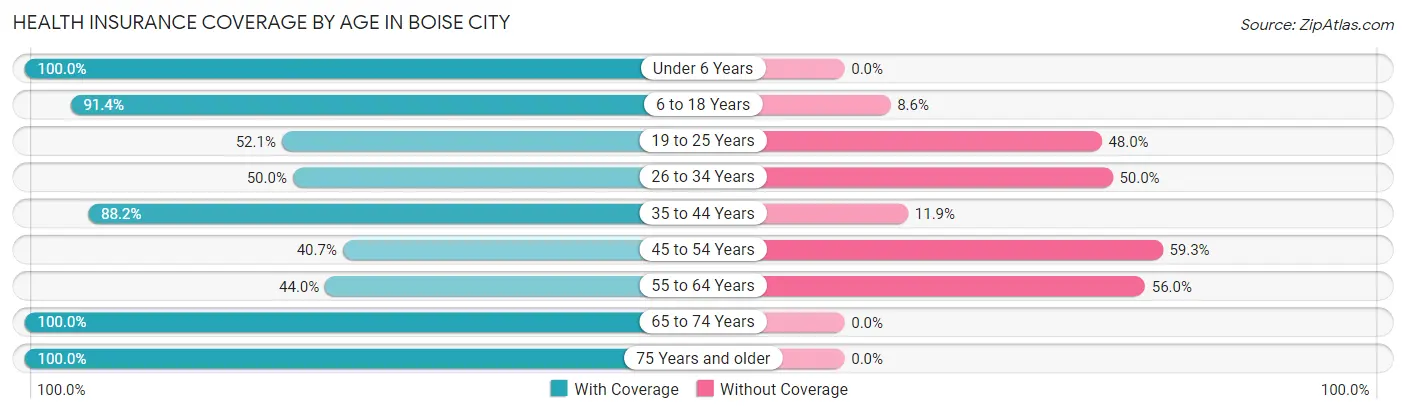
| Age Bracket | With Coverage | Without Coverage |
| Under 6 Years | 105 (100.0%) | 0 (0.0%) |
| 6 to 18 Years | 235 (91.4%) | 22 (8.6%) |
| 19 to 25 Years | 38 (52.0%) | 35 (47.9%) |
| 26 to 34 Years | 61 (50.0%) | 61 (50.0%) |
| 35 to 44 Years | 119 (88.1%) | 16 (11.8%) |
| 45 to 54 Years | 61 (40.7%) | 89 (59.3%) |
| 55 to 64 Years | 40 (44.0%) | 51 (56.0%) |
| 65 to 74 Years | 87 (100.0%) | 0 (0.0%) |
| 75 Years and older | 101 (100.0%) | 0 (0.0%) |
| Total | 847 (75.6%) | 274 (24.4%) |
Health Insurance Coverage by Citizenship Status in Boise City
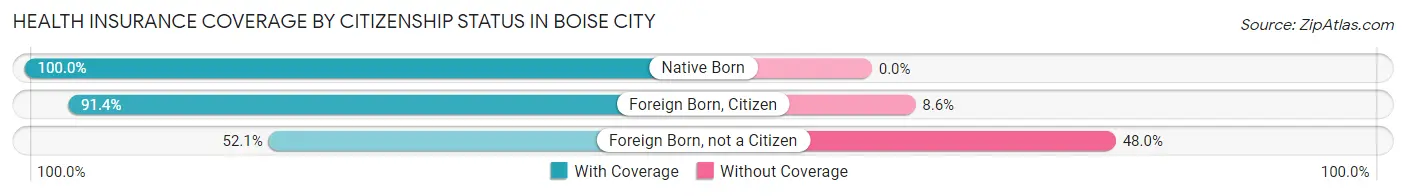
| Citizenship Status | With Coverage | Without Coverage |
| Native Born | 105 (100.0%) | 0 (0.0%) |
| Foreign Born, Citizen | 235 (91.4%) | 22 (8.6%) |
| Foreign Born, not a Citizen | 38 (52.0%) | 35 (47.9%) |
Health Insurance Coverage by Household Income in Boise City
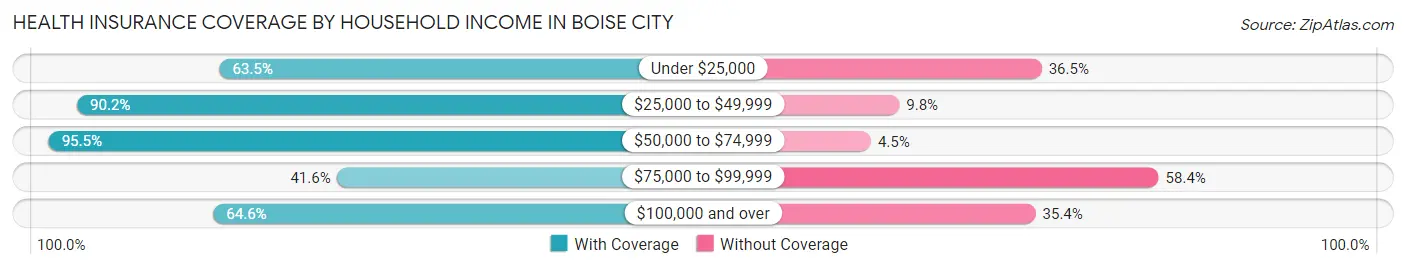
| Household Income | With Coverage | Without Coverage |
| Under $25,000 | 73 (63.5%) | 42 (36.5%) |
| $25,000 to $49,999 | 174 (90.2%) | 19 (9.8%) |
| $50,000 to $74,999 | 358 (95.5%) | 17 (4.5%) |
| $75,000 to $99,999 | 74 (41.6%) | 104 (58.4%) |
| $100,000 and over | 168 (64.6%) | 92 (35.4%) |
Public vs Private Health Insurance Coverage by Age in Boise City
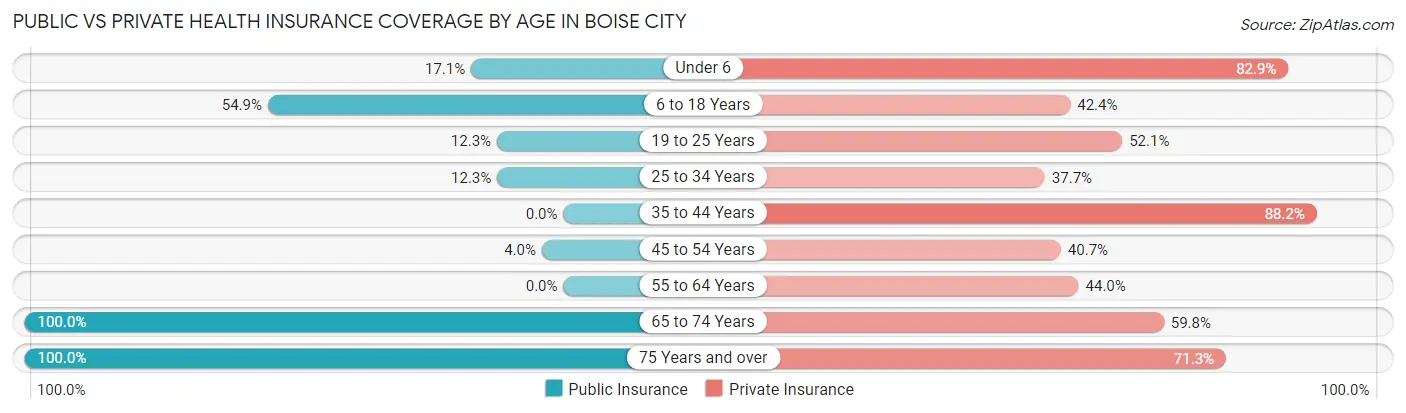
| Age Bracket | Public Insurance | Private Insurance |
| Under 6 | 18 (17.1%) | 87 (82.9%) |
| 6 to 18 Years | 141 (54.9%) | 109 (42.4%) |
| 19 to 25 Years | 9 (12.3%) | 38 (52.0%) |
| 25 to 34 Years | 15 (12.3%) | 46 (37.7%) |
| 35 to 44 Years | 0 (0.0%) | 119 (88.1%) |
| 45 to 54 Years | 6 (4.0%) | 61 (40.7%) |
| 55 to 64 Years | 0 (0.0%) | 40 (44.0%) |
| 65 to 74 Years | 87 (100.0%) | 52 (59.8%) |
| 75 Years and over | 101 (100.0%) | 72 (71.3%) |
| Total | 377 (33.6%) | 624 (55.7%) |
Disability Status by Sex by Age in Boise City
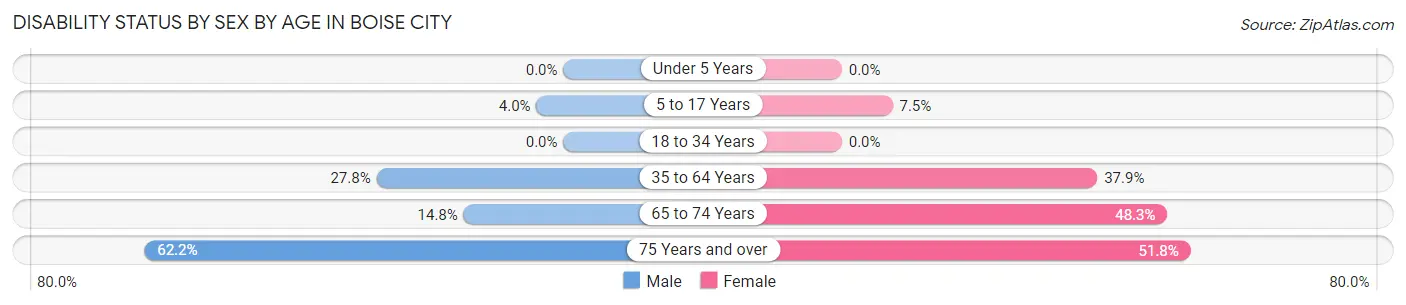
| Age Bracket | Male | Female |
| Under 5 Years | 0 (0.0%) | 0 (0.0%) |
| 5 to 17 Years | 6 (4.0%) | 7 (7.5%) |
| 18 to 34 Years | 0 (0.0%) | 0 (0.0%) |
| 35 to 64 Years | 48 (27.8%) | 77 (37.9%) |
| 65 to 74 Years | 4 (14.8%) | 29 (48.3%) |
| 75 Years and over | 28 (62.2%) | 29 (51.8%) |
Disability Class by Sex by Age in Boise City
Disability Class: Hearing Difficulty
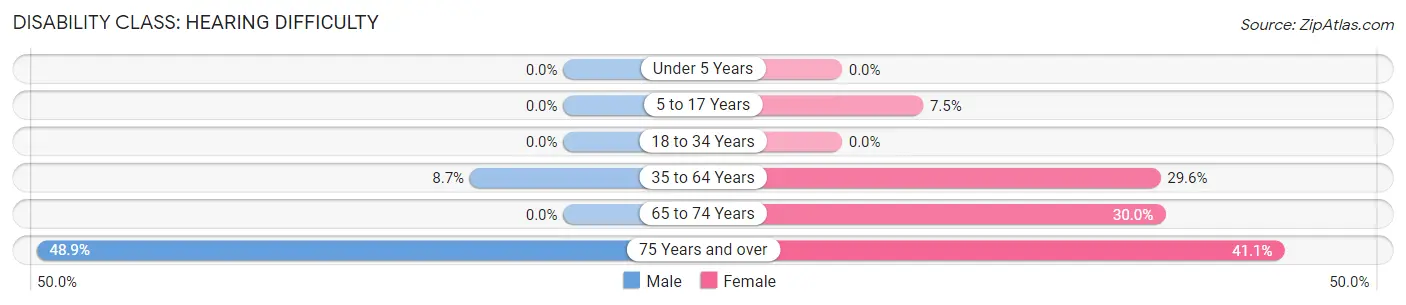
| Age Bracket | Male | Female |
| Under 5 Years | 0 (0.0%) | 0 (0.0%) |
| 5 to 17 Years | 0 (0.0%) | 7 (7.5%) |
| 18 to 34 Years | 0 (0.0%) | 0 (0.0%) |
| 35 to 64 Years | 15 (8.7%) | 60 (29.6%) |
| 65 to 74 Years | 0 (0.0%) | 18 (30.0%) |
| 75 Years and over | 22 (48.9%) | 23 (41.1%) |
Disability Class: Vision Difficulty
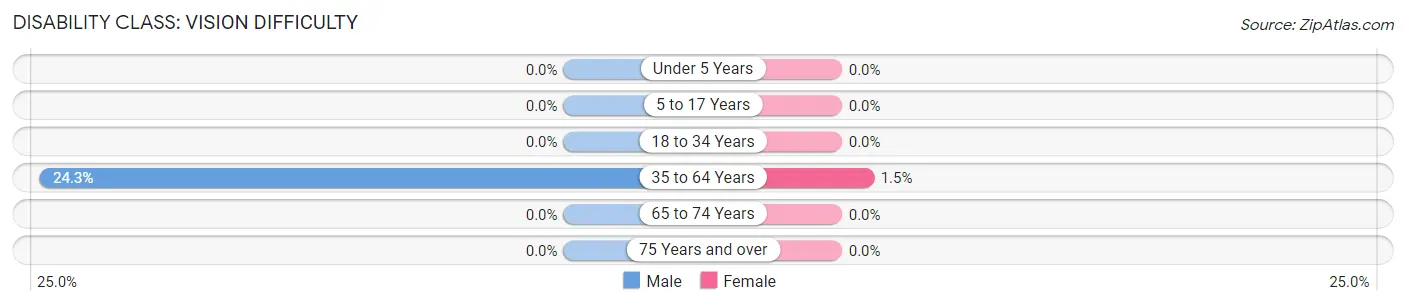
| Age Bracket | Male | Female |
| Under 5 Years | 0 (0.0%) | 0 (0.0%) |
| 5 to 17 Years | 0 (0.0%) | 0 (0.0%) |
| 18 to 34 Years | 0 (0.0%) | 0 (0.0%) |
| 35 to 64 Years | 42 (24.3%) | 3 (1.5%) |
| 65 to 74 Years | 0 (0.0%) | 0 (0.0%) |
| 75 Years and over | 0 (0.0%) | 0 (0.0%) |
Disability Class: Cognitive Difficulty
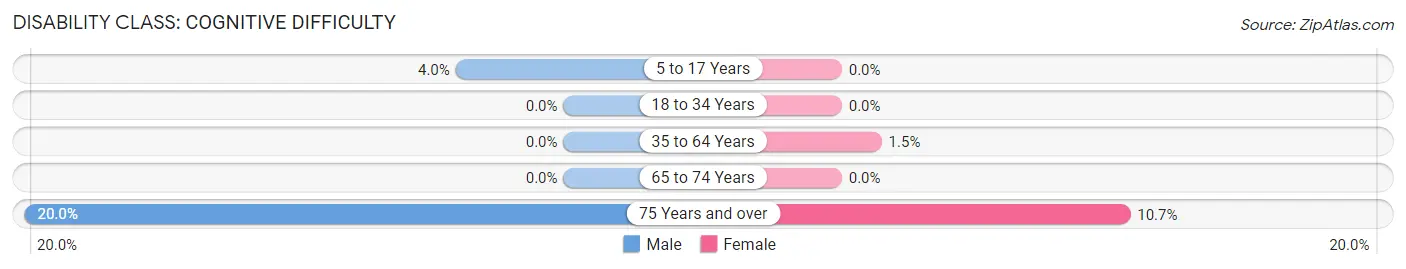
| Age Bracket | Male | Female |
| 5 to 17 Years | 6 (4.0%) | 0 (0.0%) |
| 18 to 34 Years | 0 (0.0%) | 0 (0.0%) |
| 35 to 64 Years | 0 (0.0%) | 3 (1.5%) |
| 65 to 74 Years | 0 (0.0%) | 0 (0.0%) |
| 75 Years and over | 9 (20.0%) | 6 (10.7%) |
Disability Class: Ambulatory Difficulty
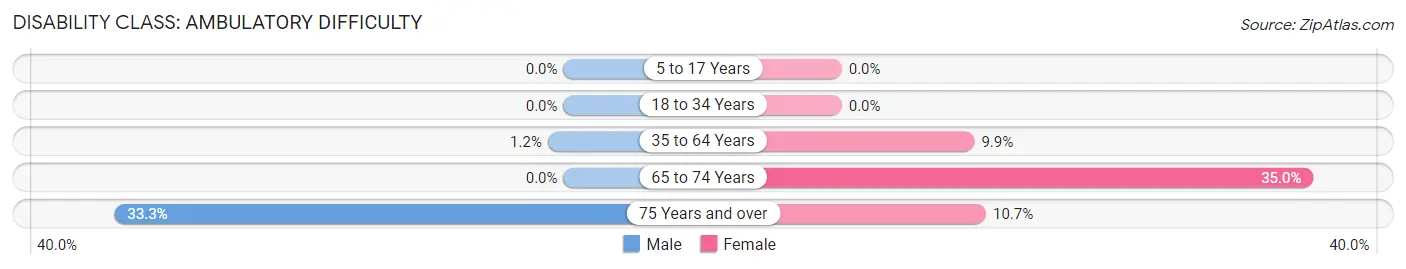
| Age Bracket | Male | Female |
| 5 to 17 Years | 0 (0.0%) | 0 (0.0%) |
| 18 to 34 Years | 0 (0.0%) | 0 (0.0%) |
| 35 to 64 Years | 2 (1.2%) | 20 (9.9%) |
| 65 to 74 Years | 0 (0.0%) | 21 (35.0%) |
| 75 Years and over | 15 (33.3%) | 6 (10.7%) |
Disability Class: Self-Care Difficulty
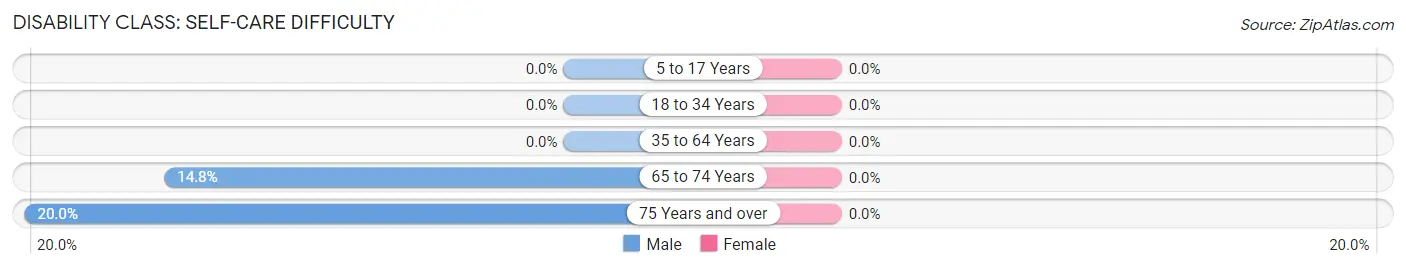
| Age Bracket | Male | Female |
| 5 to 17 Years | 0 (0.0%) | 0 (0.0%) |
| 18 to 34 Years | 0 (0.0%) | 0 (0.0%) |
| 35 to 64 Years | 0 (0.0%) | 0 (0.0%) |
| 65 to 74 Years | 4 (14.8%) | 0 (0.0%) |
| 75 Years and over | 9 (20.0%) | 0 (0.0%) |
Technology Access in Boise City
Computing Device Access in Boise City
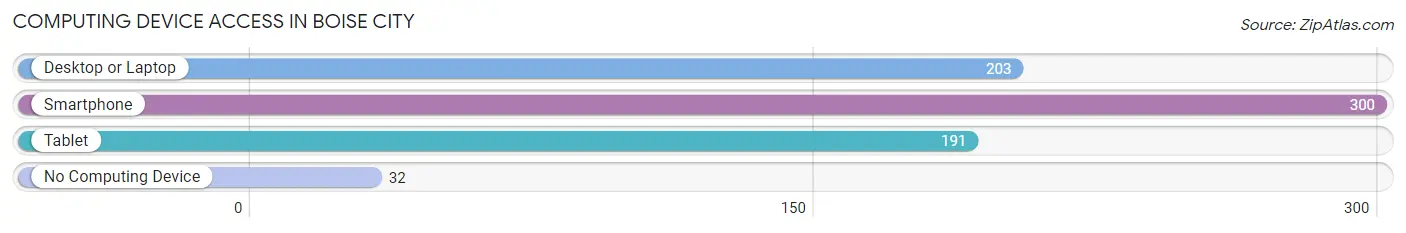
| Device Type | # Households | % Households |
| Desktop or Laptop | 203 | 58.3% |
| Smartphone | 300 | 86.2% |
| Tablet | 191 | 54.9% |
| No Computing Device | 32 | 9.2% |
| Total | 348 | 100.0% |
Internet Access in Boise City
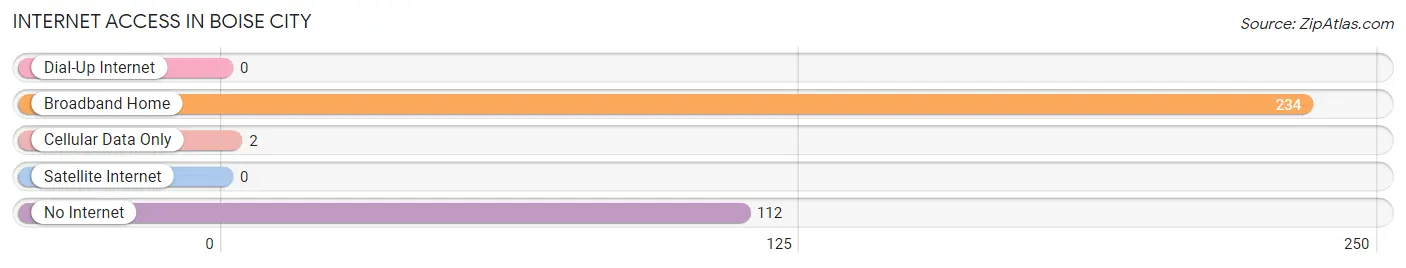
| Internet Type | # Households | % Households |
| Dial-Up Internet | 0 | 0.0% |
| Broadband Home | 234 | 67.2% |
| Cellular Data Only | 2 | 0.6% |
| Satellite Internet | 0 | 0.0% |
| No Internet | 112 | 32.2% |
| Total | 348 | 100.0% |
Boise City Summary
Boise City is a small town located in the Oklahoma Panhandle, in the northwest corner of the state. It is the county seat of Cimarron County and the only incorporated municipality in the county. The town was founded in 1908 and has a population of 1,266 as of the 2010 census.
Geography
Boise City is located in the Oklahoma Panhandle, in the northwest corner of the state. It is situated at the intersection of U.S. Route 56 and State Highway 3, approximately 20 miles east of the Texas border. The town is located in a flat, semi-arid region of the Great Plains, with an elevation of 3,092 feet. The area is characterized by rolling hills, grasslands, and sparse vegetation.
Climate
Boise City has a semi-arid climate, with hot summers and cold winters. The average annual temperature is 54°F, with an average high of 79°F in July and an average low of 28°F in January. The average annual precipitation is 19.5 inches, with most of the precipitation occurring in the spring and summer months.
Demographics
As of the 2010 census, Boise City had a population of 1,266. The racial makeup of the town was 94.2% White, 0.2% African American, 0.9% Native American, 0.2% Asian, 0.1% Pacific Islander, 2.7% from other races, and 1.7% from two or more races. Hispanic or Latino of any race were 5.2% of the population.
Economy
The economy of Boise City is largely based on agriculture and ranching. The town is home to several large farms and ranches, as well as several small businesses. The town is also home to a number of government agencies, including the Cimarron County Courthouse, the Cimarron County Sheriff's Office, and the Cimarron County Health Department.
History
Boise City was founded in 1908 by a group of settlers from Kansas. The town was named after Boise, Idaho, which was the hometown of one of the settlers. The town was incorporated in 1909 and quickly grew to become the largest town in the Oklahoma Panhandle.
In the early 20th century, Boise City was a major stop on the Santa Fe Trail, and the town was a popular destination for travelers. The town was also a major center for the cattle industry, and the town was home to several large ranches.
In the 1930s, the town was hit hard by the Dust Bowl, and many of the town's residents were forced to leave. The town's population declined sharply, and the town was nearly abandoned by the 1940s.
In the 1950s, the town began to recover, and the population slowly began to increase. The town was revitalized in the 1970s, when the town was designated as the county seat of Cimarron County. The town has since become a popular tourist destination, and the population has continued to grow.
Common Questions
What is Per Capita Income in Boise City?
Per Capita income in Boise City is $23,567.
What is the Median Family Income in Boise City?
Median Family Income in Boise City is $54,718.
What is the Median Household income in Boise City?
Median Household Income in Boise City is $44,583.
What is Income or Wage Gap in Boise City?
Income or Wage Gap in Boise City is 59.3%.
Women in Boise City earn 40.7 cents for every dollar earned by a man.
What is Inequality or Gini Index in Boise City?
Inequality or Gini Index in Boise City is 0.41.
What is the Total Population of Boise City?
Total Population of Boise City is 1,140.
What is the Total Male Population of Boise City?
Total Male Population of Boise City is 575.
What is the Total Female Population of Boise City?
Total Female Population of Boise City is 565.
What is the Ratio of Males per 100 Females in Boise City?
There are 101.77 Males per 100 Females in Boise City.
What is the Ratio of Females per 100 Males in Boise City?
There are 98.26 Females per 100 Males in Boise City.
What is the Median Population Age in Boise City?
Median Population Age in Boise City is 35.2 Years.
What is the Average Family Size in Boise City
Average Family Size in Boise City is 4.4 People.
What is the Average Household Size in Boise City
Average Household Size in Boise City is 3.2 People.
How Large is the Labor Force in Boise City?
There are 554 People in the Labor Forcein in Boise City.
What is the Percentage of People in the Labor Force in Boise City?
68.4% of People are in the Labor Force in Boise City.