Woodward, OK Map & Demographics
Woodward Map
Woodward Overview
$32,191
PER CAPITA INCOME
$59,850
AVG FAMILY INCOME
$54,864
AVG HOUSEHOLD INCOME
35.7%
WAGE / INCOME GAP [ % ]
64.3¢/ $1
WAGE / INCOME GAP [ $ ]
0.45
INEQUALITY / GINI INDEX
12,067
TOTAL POPULATION
6,085
MALE POPULATION
5,982
FEMALE POPULATION
101.72
MALES / 100 FEMALES
98.31
FEMALES / 100 MALES
35.1
MEDIAN AGE
2.9
AVG FAMILY SIZE
2.2
AVG HOUSEHOLD SIZE
6,178
LABOR FORCE [ PEOPLE ]
65.1%
PERCENT IN LABOR FORCE
6.3%
UNEMPLOYMENT RATE
Woodward Zip Codes
Woodward Area Codes
Income in Woodward
Income Overview in Woodward
Per Capita Income in Woodward is $32,191, while median incomes of families and households are $59,850 and $54,864 respectively.
| Characteristic | Number | Measure |
| Per Capita Income | 12,067 | $32,191 |
| Median Family Income | 3,056 | $59,850 |
| Mean Family Income | 3,056 | $83,814 |
| Median Household Income | 5,218 | $54,864 |
| Mean Household Income | 5,218 | $75,968 |
| Income Deficit | 3,056 | $0 |
| Wage / Income Gap (%) | 12,067 | 35.69% |
| Wage / Income Gap ($) | 12,067 | 64.31¢ per $1 |
| Gini / Inequality Index | 12,067 | 0.45 |
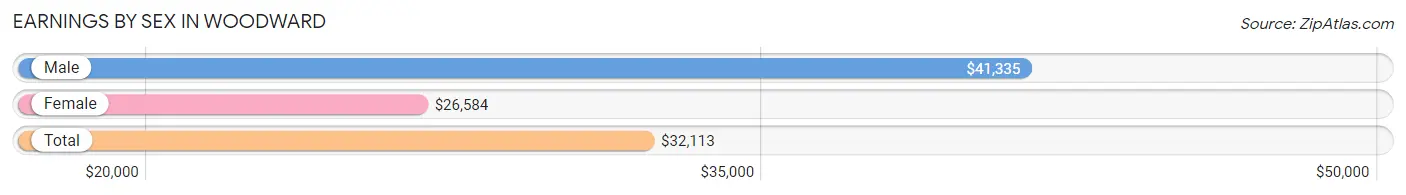
Earnings by Sex in Woodward
Average Earnings in Woodward are $32,113, $41,335 for men and $26,584 for women, a difference of 35.7%.
| Sex | Number | Average Earnings |
| Male | 3,468 (54.1%) | $41,335 |
| Female | 2,937 (45.9%) | $26,584 |
| Total | 6,405 (100.0%) | $32,113 |
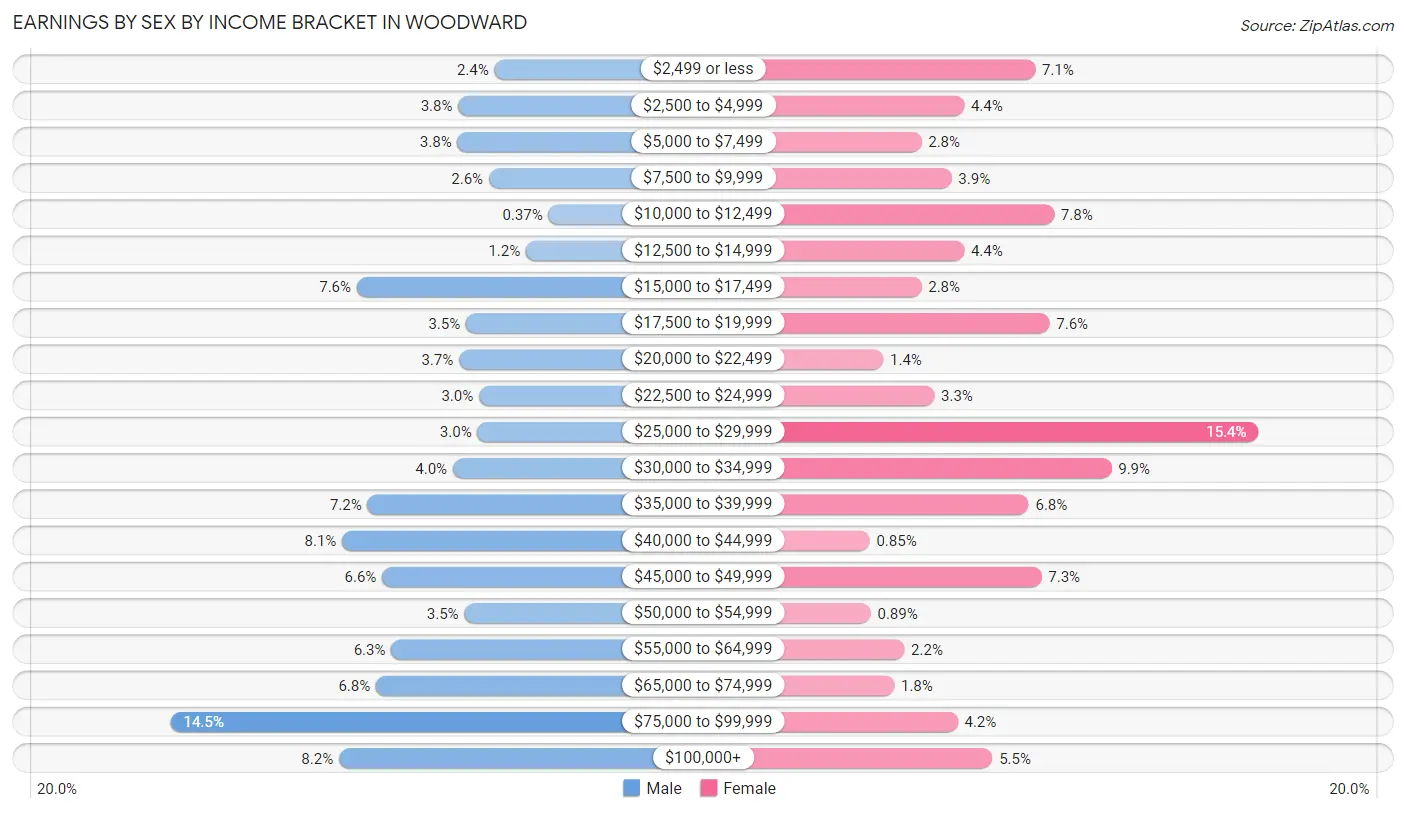
Earnings by Sex by Income Bracket in Woodward
The most common earnings brackets in Woodward are $75,000 to $99,999 for men (504 | 14.5%) and $25,000 to $29,999 for women (453 | 15.4%).
| Income | Male | Female |
| $2,499 or less | 83 (2.4%) | 207 (7.0%) |
| $2,500 to $4,999 | 130 (3.7%) | 129 (4.4%) |
| $5,000 to $7,499 | 131 (3.8%) | 82 (2.8%) |
| $7,500 to $9,999 | 90 (2.6%) | 115 (3.9%) |
| $10,000 to $12,499 | 13 (0.4%) | 228 (7.8%) |
| $12,500 to $14,999 | 42 (1.2%) | 129 (4.4%) |
| $15,000 to $17,499 | 262 (7.5%) | 82 (2.8%) |
| $17,500 to $19,999 | 120 (3.5%) | 223 (7.6%) |
| $20,000 to $22,499 | 129 (3.7%) | 40 (1.4%) |
| $22,500 to $24,999 | 103 (3.0%) | 96 (3.3%) |
| $25,000 to $29,999 | 105 (3.0%) | 453 (15.4%) |
| $30,000 to $34,999 | 137 (4.0%) | 291 (9.9%) |
| $35,000 to $39,999 | 248 (7.1%) | 200 (6.8%) |
| $40,000 to $44,999 | 281 (8.1%) | 25 (0.9%) |
| $45,000 to $49,999 | 229 (6.6%) | 214 (7.3%) |
| $50,000 to $54,999 | 122 (3.5%) | 26 (0.9%) |
| $55,000 to $64,999 | 217 (6.3%) | 63 (2.1%) |
| $65,000 to $74,999 | 237 (6.8%) | 52 (1.8%) |
| $75,000 to $99,999 | 504 (14.5%) | 122 (4.2%) |
| $100,000+ | 285 (8.2%) | 160 (5.4%) |
| Total | 3,468 (100.0%) | 2,937 (100.0%) |
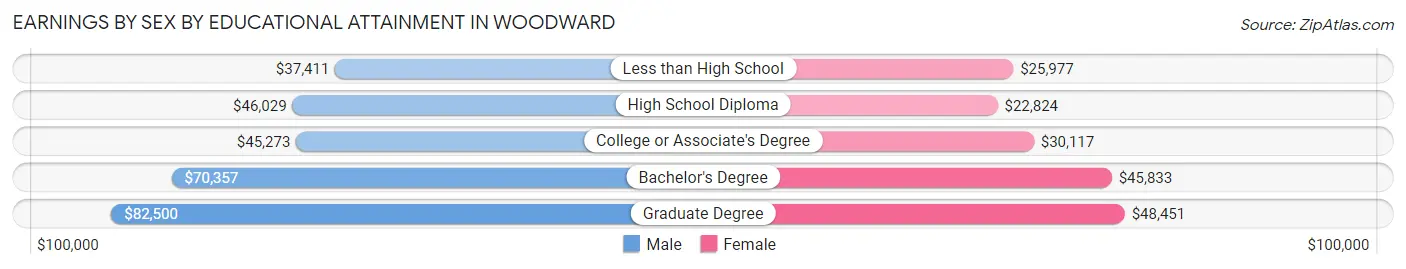
Earnings by Sex by Educational Attainment in Woodward
Average earnings in Woodward are $47,022 for men and $28,776 for women, a difference of 38.8%. Men with an educational attainment of graduate degree enjoy the highest average annual earnings of $82,500, while those with less than high school education earn the least with $37,411. Women with an educational attainment of graduate degree earn the most with the average annual earnings of $48,451, while those with high school diploma education have the smallest earnings of $22,824.
| Educational Attainment | Male Income | Female Income |
| Less than High School | $37,411 | $25,977 |
| High School Diploma | $46,029 | $22,824 |
| College or Associate's Degree | $45,273 | $30,117 |
| Bachelor's Degree | $70,357 | $45,833 |
| Graduate Degree | $82,500 | $48,451 |
| Total | $47,022 | $28,776 |
Family Income in Woodward
Family Income Brackets in Woodward
According to the Woodward family income data, there are 645 families falling into the $50,000 to $74,999 income range, which is the most common income bracket and makes up 21.1% of all families. Conversely, the $10,000 to $14,999 income bracket is the least frequent group with only 40 families (1.3%) belonging to this category.
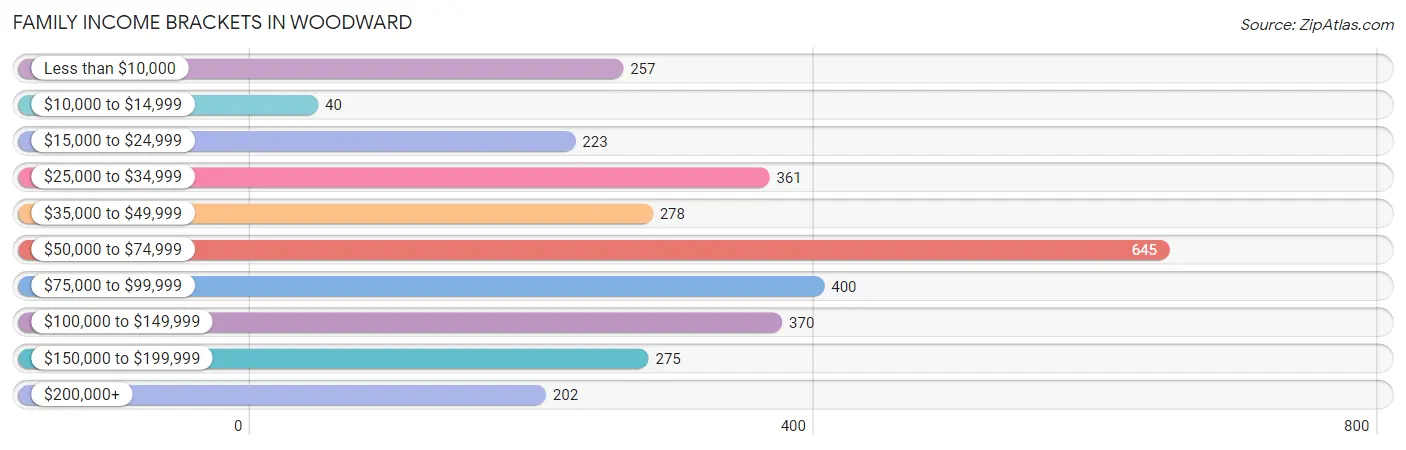
| Income Bracket | # Families | % Families |
| Less than $10,000 | 257 | 8.4% |
| $10,000 to $14,999 | 40 | 1.3% |
| $15,000 to $24,999 | 223 | 7.3% |
| $25,000 to $34,999 | 361 | 11.8% |
| $35,000 to $49,999 | 278 | 9.1% |
| $50,000 to $74,999 | 645 | 21.1% |
| $75,000 to $99,999 | 400 | 13.1% |
| $100,000 to $149,999 | 370 | 12.1% |
| $150,000 to $199,999 | 275 | 9.0% |
| $200,000+ | 202 | 6.6% |
Family Income by Famaliy Size in Woodward
4-person families (485 | 15.9%) account for the highest median family income in Woodward with $110,980 per family, while 3-person families (577 | 18.9%) have the highest median income of $28,348 per family member.
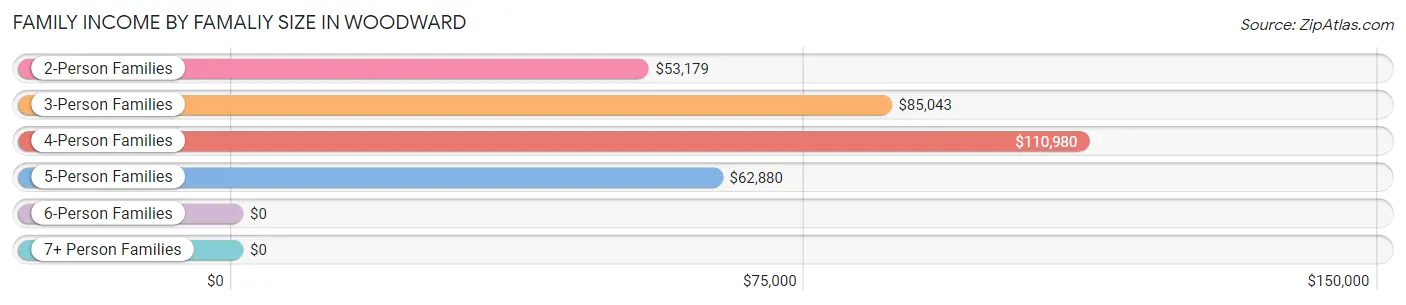
| Income Bracket | # Families | Median Income |
| 2-Person Families | 1,761 (57.6%) | $53,179 |
| 3-Person Families | 577 (18.9%) | $85,043 |
| 4-Person Families | 485 (15.9%) | $110,980 |
| 5-Person Families | 94 (3.1%) | $62,880 |
| 6-Person Families | 44 (1.4%) | $0 |
| 7+ Person Families | 95 (3.1%) | $0 |
| Total | 3,056 (100.0%) | $59,850 |
Family Income by Number of Earners in Woodward
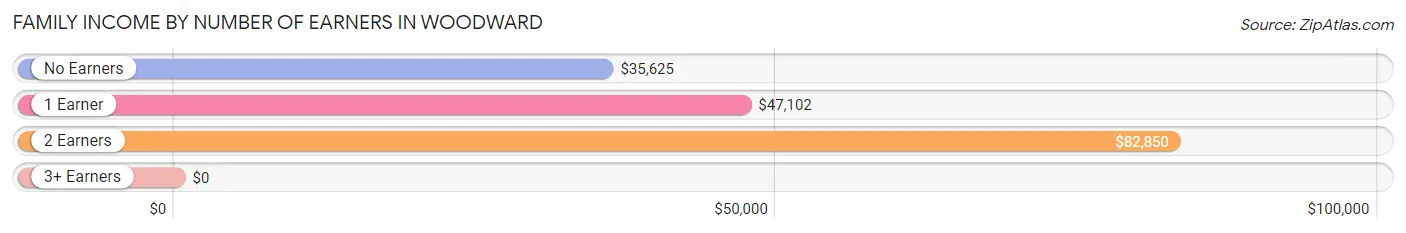
| Number of Earners | # Families | Median Income |
| No Earners | 421 (13.8%) | $35,625 |
| 1 Earner | 1,419 (46.4%) | $47,102 |
| 2 Earners | 923 (30.2%) | $82,850 |
| 3+ Earners | 293 (9.6%) | $0 |
| Total | 3,056 (100.0%) | $59,850 |
Household Income in Woodward
Household Income Brackets in Woodward
With 1,237 households falling in the category, the $50,000 to $74,999 income range is the most frequent in Woodward, accounting for 23.7% of all households. In contrast, only 120 households (2.3%) fall into the $10,000 to $14,999 income bracket, making it the least populous group.
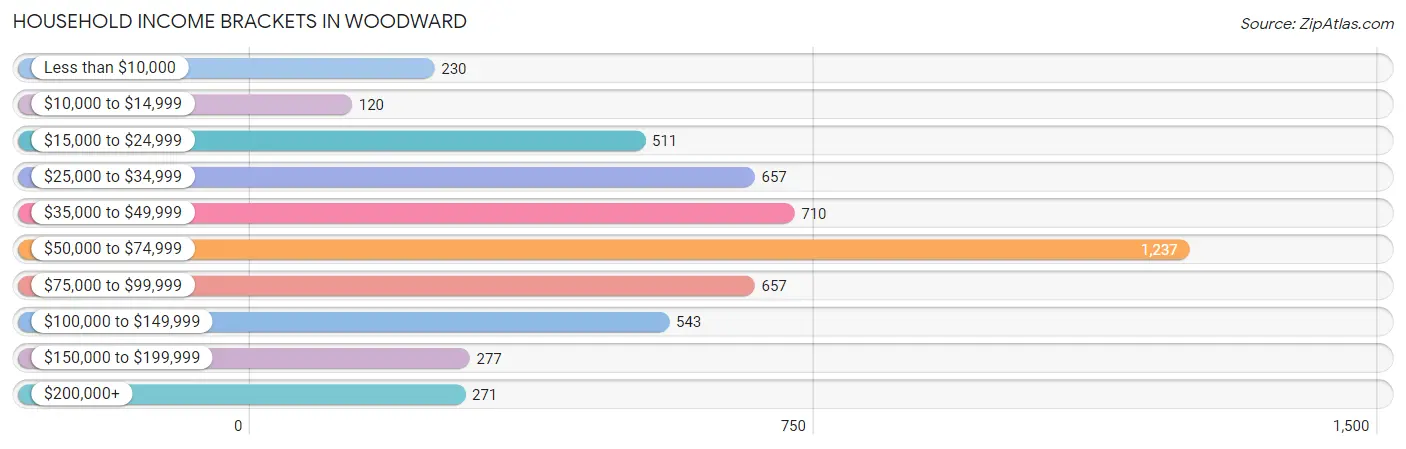
| Income Bracket | # Households | % Households |
| Less than $10,000 | 230 | 4.4% |
| $10,000 to $14,999 | 120 | 2.3% |
| $15,000 to $24,999 | 511 | 9.8% |
| $25,000 to $34,999 | 657 | 12.6% |
| $35,000 to $49,999 | 710 | 13.6% |
| $50,000 to $74,999 | 1,237 | 23.7% |
| $75,000 to $99,999 | 657 | 12.6% |
| $100,000 to $149,999 | 543 | 10.4% |
| $150,000 to $199,999 | 277 | 5.3% |
| $200,000+ | 271 | 5.2% |
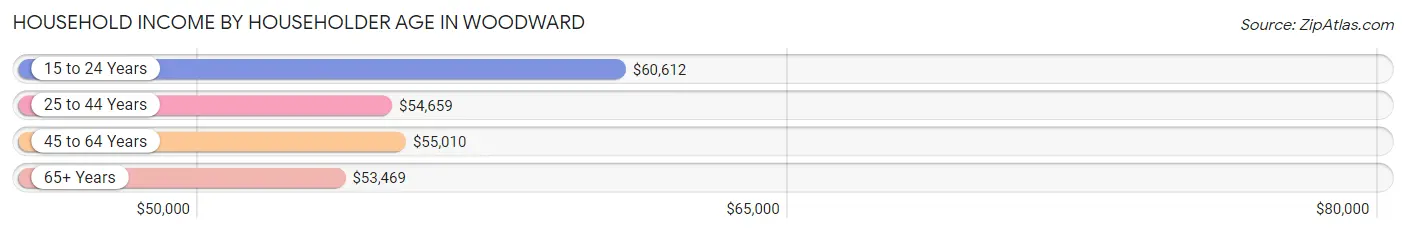
Household Income by Householder Age in Woodward
The median household income in Woodward is $54,864, with the highest median household income of $60,612 found in the 15 to 24 years age bracket for the primary householder. A total of 297 households (5.7%) fall into this category. Meanwhile, the 65+ years age bracket for the primary householder has the lowest median household income of $53,469, with 1,509 households (28.9%) in this group.
| Income Bracket | # Households | Median Income |
| 15 to 24 Years | 297 (5.7%) | $60,612 |
| 25 to 44 Years | 1,903 (36.5%) | $54,659 |
| 45 to 64 Years | 1,509 (28.9%) | $55,010 |
| 65+ Years | 1,509 (28.9%) | $53,469 |
| Total | 5,218 (100.0%) | $54,864 |
Poverty in Woodward
Income Below Poverty by Sex and Age in Woodward
With 10.9% poverty level for males and 24.6% for females among the residents of Woodward, under 5 year old males and 12 to 14 year old females are the most vulnerable to poverty, with 219 males (45.2%) and 126 females (55.5%) in their respective age groups living below the poverty level.
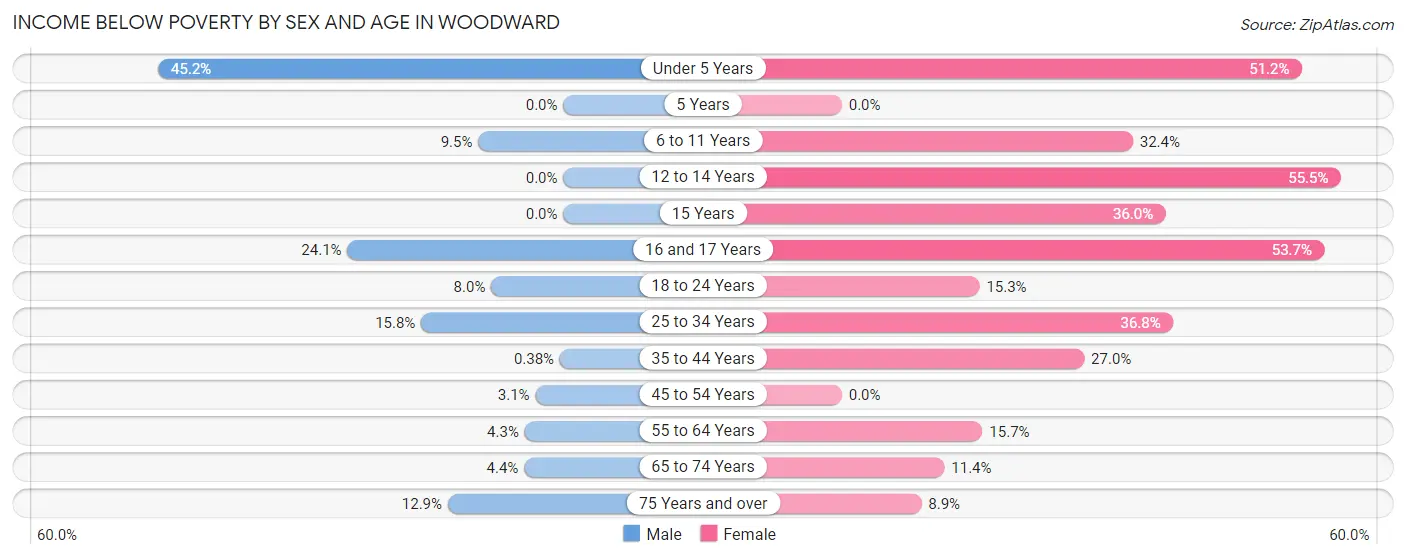
| Age Bracket | Male | Female |
| Under 5 Years | 219 (45.2%) | 197 (51.2%) |
| 5 Years | 0 (0.0%) | 0 (0.0%) |
| 6 to 11 Years | 46 (9.5%) | 141 (32.4%) |
| 12 to 14 Years | 0 (0.0%) | 126 (55.5%) |
| 15 Years | 0 (0.0%) | 27 (36.0%) |
| 16 and 17 Years | 70 (24.0%) | 73 (53.7%) |
| 18 to 24 Years | 38 (8.0%) | 86 (15.3%) |
| 25 to 34 Years | 158 (15.8%) | 333 (36.8%) |
| 35 to 44 Years | 3 (0.4%) | 207 (27.0%) |
| 45 to 54 Years | 17 (3.1%) | 0 (0.0%) |
| 55 to 64 Years | 29 (4.3%) | 117 (15.7%) |
| 65 to 74 Years | 22 (4.4%) | 54 (11.4%) |
| 75 Years and over | 49 (12.9%) | 57 (8.9%) |
| Total | 651 (10.9%) | 1,418 (24.6%) |
Income Above Poverty by Sex and Age in Woodward
According to the poverty statistics in Woodward, males aged 5 years and females aged 45 to 54 years are the age groups that are most secure financially, with 100.0% of males and 100.0% of females in these age groups living above the poverty line.
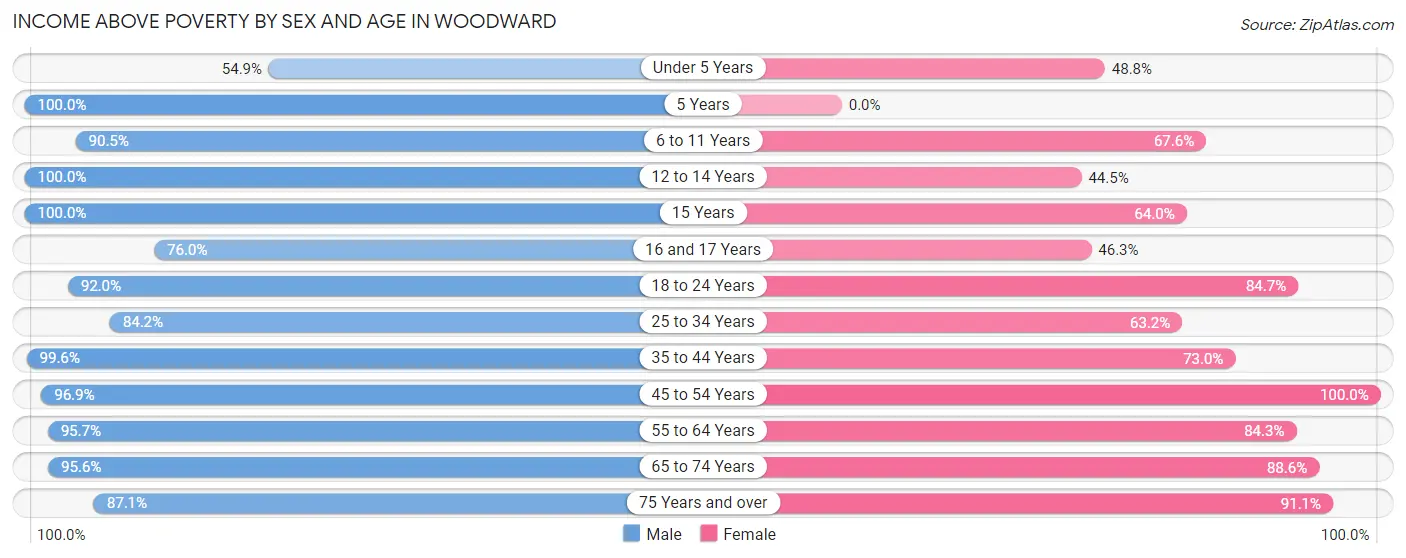
| Age Bracket | Male | Female |
| Under 5 Years | 266 (54.8%) | 188 (48.8%) |
| 5 Years | 113 (100.0%) | 0 (0.0%) |
| 6 to 11 Years | 440 (90.5%) | 294 (67.6%) |
| 12 to 14 Years | 161 (100.0%) | 101 (44.5%) |
| 15 Years | 73 (100.0%) | 48 (64.0%) |
| 16 and 17 Years | 221 (75.9%) | 63 (46.3%) |
| 18 to 24 Years | 435 (92.0%) | 475 (84.7%) |
| 25 to 34 Years | 840 (84.2%) | 571 (63.2%) |
| 35 to 44 Years | 785 (99.6%) | 560 (73.0%) |
| 45 to 54 Years | 530 (96.9%) | 409 (100.0%) |
| 55 to 64 Years | 646 (95.7%) | 630 (84.3%) |
| 65 to 74 Years | 483 (95.6%) | 419 (88.6%) |
| 75 Years and over | 332 (87.1%) | 586 (91.1%) |
| Total | 5,325 (89.1%) | 4,344 (75.4%) |
Income Below Poverty Among Married-Couple Families in Woodward
The poverty statistics for married-couple families in Woodward show that 5.1% or 102 of the total 2,004 families live below the poverty line. Families with 3 or 4 children have the highest poverty rate of 17.8%, comprising of 27 families. On the other hand, families with no children have the lowest poverty rate of 3.9%, which includes 46 families.
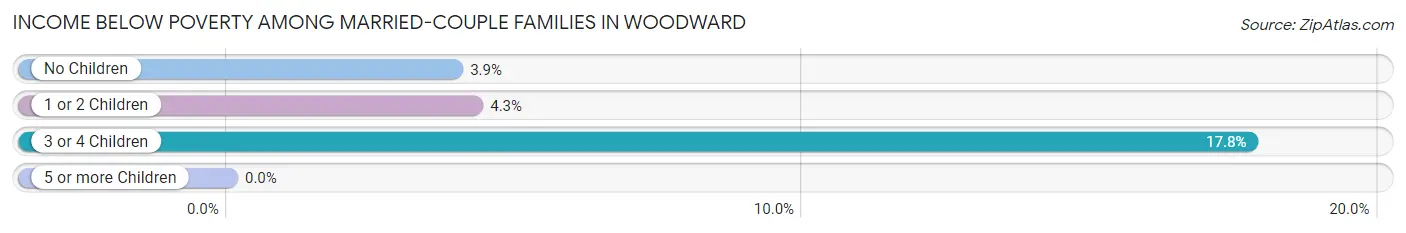
| Children | Above Poverty | Below Poverty |
| No Children | 1,127 (96.1%) | 46 (3.9%) |
| 1 or 2 Children | 650 (95.7%) | 29 (4.3%) |
| 3 or 4 Children | 125 (82.2%) | 27 (17.8%) |
| 5 or more Children | 0 (0.0%) | 0 (0.0%) |
| Total | 1,902 (94.9%) | 102 (5.1%) |
Income Below Poverty Among Single-Parent Households in Woodward
According to the poverty data in Woodward, 16.3% or 26 single-father households and 50.8% or 453 single-mother households are living below the poverty line. Among single-father households, those with no children have the highest poverty rate, with 26 households (44.1%) experiencing poverty. Likewise, among single-mother households, those with 3 or 4 children have the highest poverty rate, with 10 households (100.0%) falling below the poverty line.
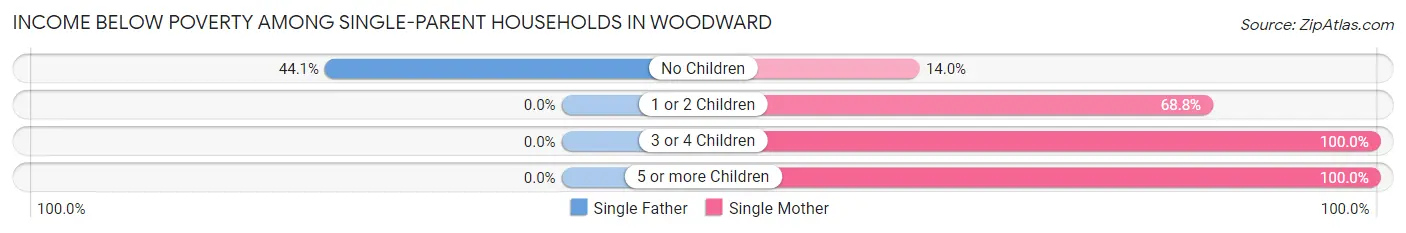
| Children | Single Father | Single Mother |
| No Children | 26 (44.1%) | 45 (14.0%) |
| 1 or 2 Children | 0 (0.0%) | 359 (68.8%) |
| 3 or 4 Children | 0 (0.0%) | 10 (100.0%) |
| 5 or more Children | 0 (0.0%) | 39 (100.0%) |
| Total | 26 (16.3%) | 453 (50.8%) |
Income Below Poverty Among Married-Couple vs Single-Parent Households in Woodward
The poverty data for Woodward shows that 102 of the married-couple family households (5.1%) and 479 of the single-parent households (45.5%) are living below the poverty level. Within the married-couple family households, those with 3 or 4 children have the highest poverty rate, with 27 households (17.8%) falling below the poverty line. Among the single-parent households, those with 3 or 4 children have the highest poverty rate, with 10 household (100.0%) living below poverty.
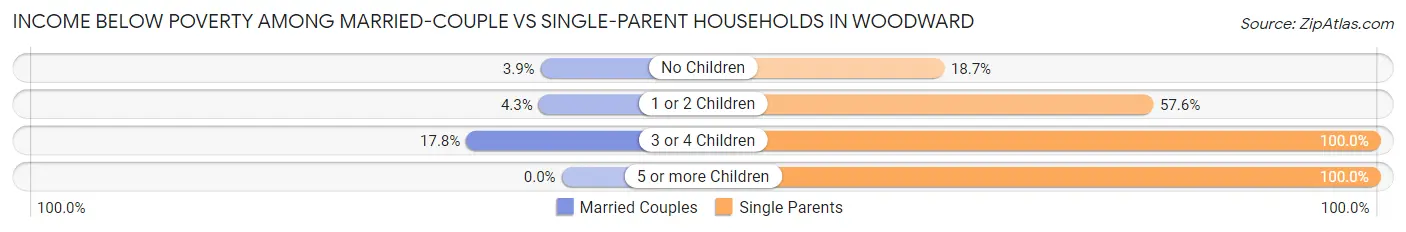
| Children | Married-Couple Families | Single-Parent Households |
| No Children | 46 (3.9%) | 71 (18.7%) |
| 1 or 2 Children | 29 (4.3%) | 359 (57.6%) |
| 3 or 4 Children | 27 (17.8%) | 10 (100.0%) |
| 5 or more Children | 0 (0.0%) | 39 (100.0%) |
| Total | 102 (5.1%) | 479 (45.5%) |
Race in Woodward
The most populous races in Woodward are White / Caucasian (10,437 | 86.5%), Hispanic or Latino (1,625 | 13.5%), and Two or more Races (823 | 6.8%).
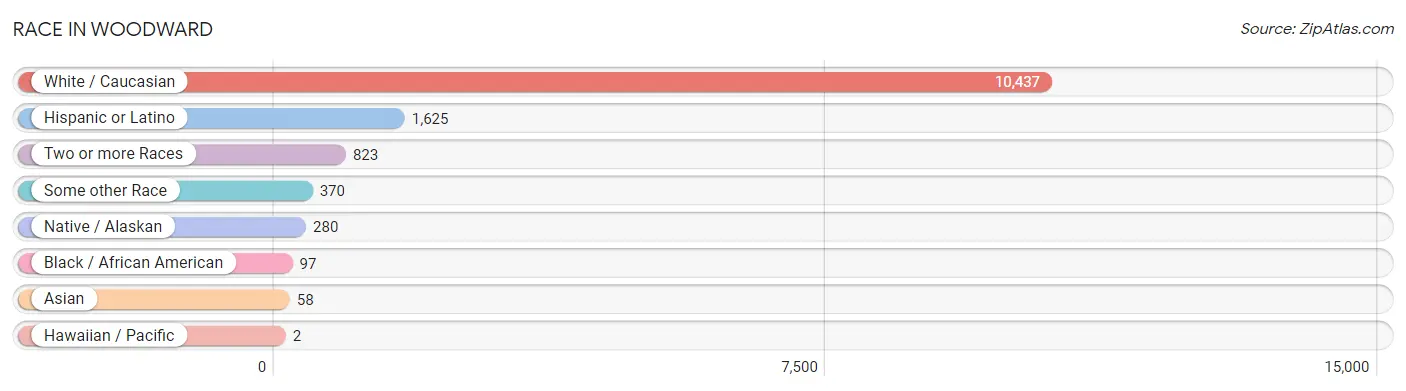
| Race | # Population | % Population |
| Asian | 58 | 0.5% |
| Black / African American | 97 | 0.8% |
| Hawaiian / Pacific | 2 | 0.0% |
| Hispanic or Latino | 1,625 | 13.5% |
| Native / Alaskan | 280 | 2.3% |
| White / Caucasian | 10,437 | 86.5% |
| Two or more Races | 823 | 6.8% |
| Some other Race | 370 | 3.1% |
| Total | 12,067 | 100.0% |
Ancestry in Woodward
The most populous ancestries reported in Woodward are German (1,505 | 12.5%), American (1,263 | 10.5%), English (1,191 | 9.9%), Mexican (1,190 | 9.9%), and Irish (701 | 5.8%), together accounting for 48.5% of all Woodward residents.
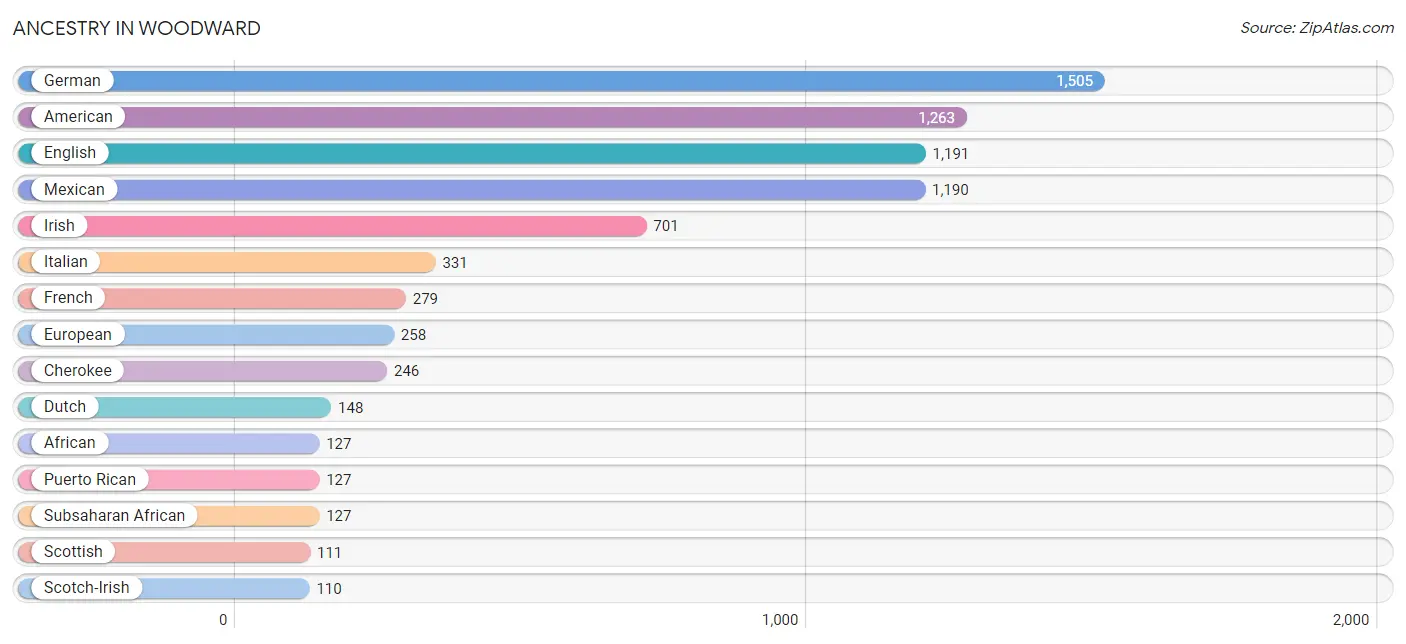
| Ancestry | # Population | % Population |
| African | 127 | 1.1% |
| American | 1,263 | 10.5% |
| Apache | 53 | 0.4% |
| Arapaho | 9 | 0.1% |
| Bhutanese | 76 | 0.6% |
| Burmese | 3 | 0.0% |
| Cherokee | 246 | 2.0% |
| Cheyenne | 14 | 0.1% |
| Chickasaw | 29 | 0.2% |
| Choctaw | 24 | 0.2% |
| Creek | 10 | 0.1% |
| Czech | 53 | 0.4% |
| Czechoslovakian | 37 | 0.3% |
| Dutch | 148 | 1.2% |
| Dutch West Indian | 49 | 0.4% |
| English | 1,191 | 9.9% |
| European | 258 | 2.1% |
| Filipino | 9 | 0.1% |
| Finnish | 10 | 0.1% |
| French | 279 | 2.3% |
| French American Indian | 2 | 0.0% |
| German | 1,505 | 12.5% |
| Indian (Asian) | 46 | 0.4% |
| Irish | 701 | 5.8% |
| Italian | 331 | 2.7% |
| Kiowa | 10 | 0.1% |
| Korean | 25 | 0.2% |
| Mexican | 1,190 | 9.9% |
| Native Hawaiian | 65 | 0.5% |
| Navajo | 27 | 0.2% |
| Norwegian | 5 | 0.0% |
| Polish | 75 | 0.6% |
| Puerto Rican | 127 | 1.1% |
| Russian | 29 | 0.2% |
| Scandinavian | 39 | 0.3% |
| Scotch-Irish | 110 | 0.9% |
| Scottish | 111 | 0.9% |
| Spaniard | 73 | 0.6% |
| Subsaharan African | 127 | 1.1% |
| Swedish | 51 | 0.4% |
| Welsh | 70 | 0.6% | View All 41 Rows |
Immigrants in Woodward
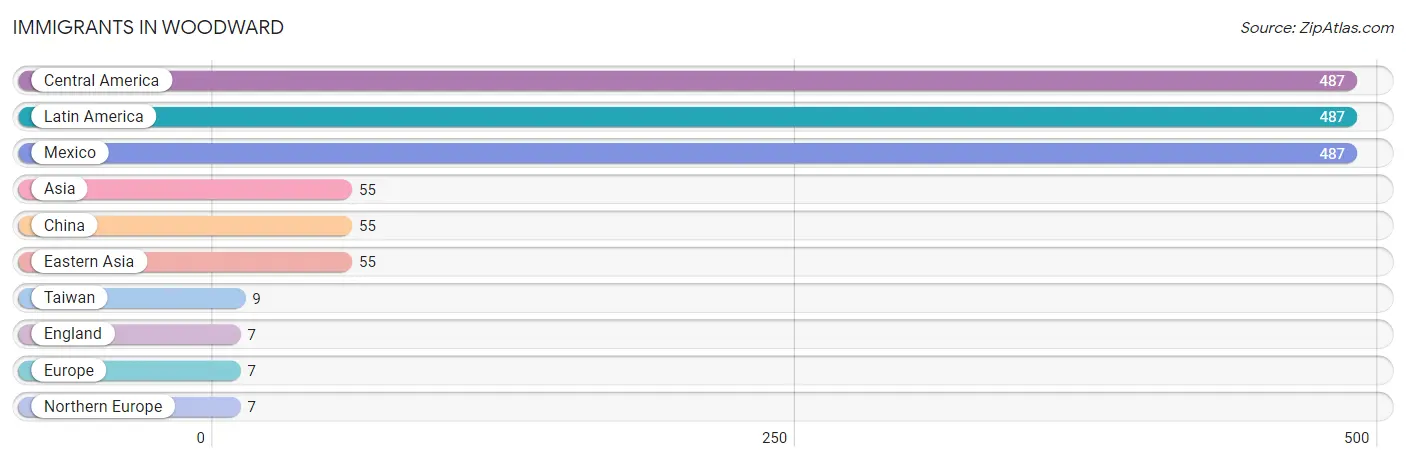
The most numerous immigrant groups reported in Woodward came from Central America (487 | 4.0%), Latin America (487 | 4.0%), Mexico (487 | 4.0%), Asia (55 | 0.5%), and China (55 | 0.5%), together accounting for 13.0% of all Woodward residents.
| Immigration Origin | # Population | % Population |
| Asia | 55 | 0.5% |
| Central America | 487 | 4.0% |
| China | 55 | 0.5% |
| Eastern Asia | 55 | 0.5% |
| England | 7 | 0.1% |
| Europe | 7 | 0.1% |
| Latin America | 487 | 4.0% |
| Mexico | 487 | 4.0% |
| Northern Europe | 7 | 0.1% |
| Taiwan | 9 | 0.1% | View All 10 Rows |
Sex and Age in Woodward
Sex and Age in Woodward
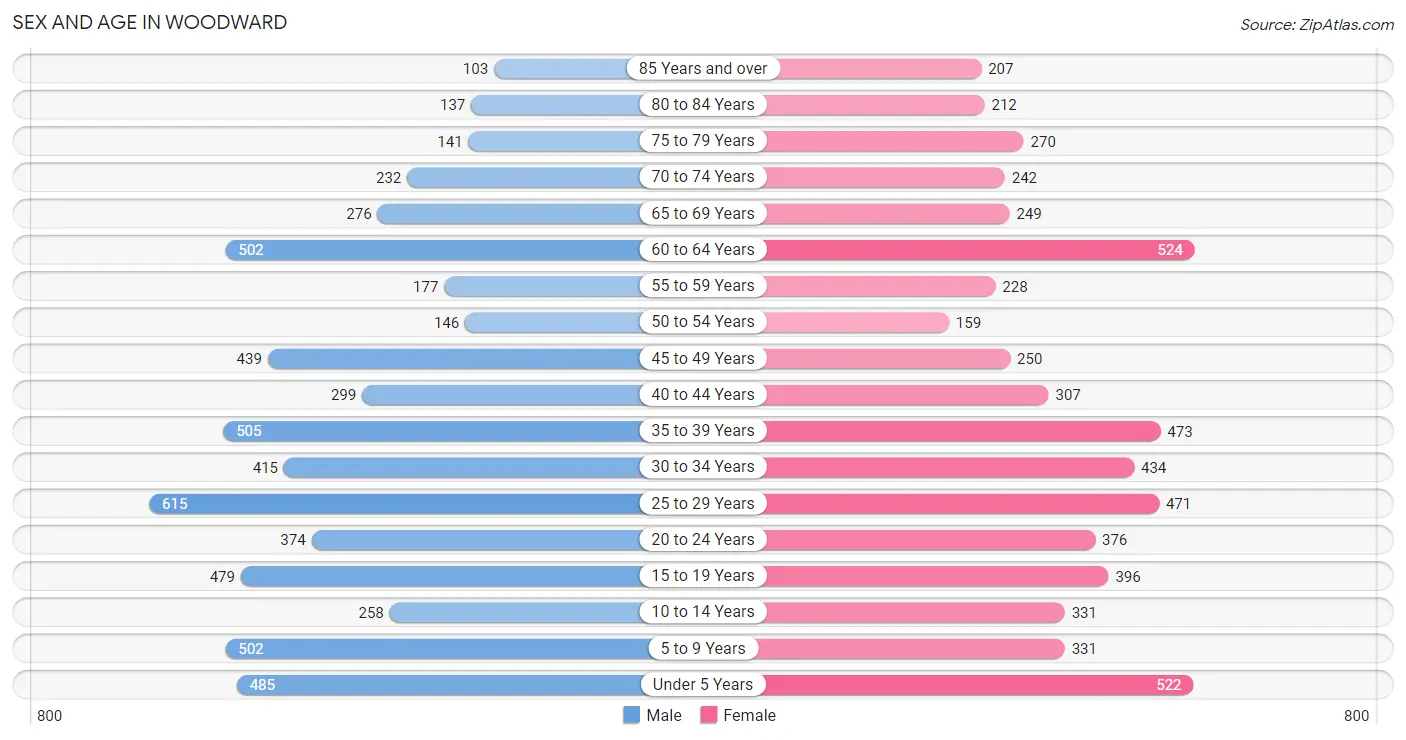
The most populous age groups in Woodward are 25 to 29 Years (615 | 10.1%) for men and 60 to 64 Years (524 | 8.8%) for women.
| Age Bracket | Male | Female |
| Under 5 Years | 485 (8.0%) | 522 (8.7%) |
| 5 to 9 Years | 502 (8.3%) | 331 (5.5%) |
| 10 to 14 Years | 258 (4.2%) | 331 (5.5%) |
| 15 to 19 Years | 479 (7.9%) | 396 (6.6%) |
| 20 to 24 Years | 374 (6.1%) | 376 (6.3%) |
| 25 to 29 Years | 615 (10.1%) | 471 (7.9%) |
| 30 to 34 Years | 415 (6.8%) | 434 (7.3%) |
| 35 to 39 Years | 505 (8.3%) | 473 (7.9%) |
| 40 to 44 Years | 299 (4.9%) | 307 (5.1%) |
| 45 to 49 Years | 439 (7.2%) | 250 (4.2%) |
| 50 to 54 Years | 146 (2.4%) | 159 (2.7%) |
| 55 to 59 Years | 177 (2.9%) | 228 (3.8%) |
| 60 to 64 Years | 502 (8.3%) | 524 (8.8%) |
| 65 to 69 Years | 276 (4.5%) | 249 (4.2%) |
| 70 to 74 Years | 232 (3.8%) | 242 (4.1%) |
| 75 to 79 Years | 141 (2.3%) | 270 (4.5%) |
| 80 to 84 Years | 137 (2.2%) | 212 (3.5%) |
| 85 Years and over | 103 (1.7%) | 207 (3.5%) |
| Total | 6,085 (100.0%) | 5,982 (100.0%) |
Families and Households in Woodward
Median Family Size in Woodward
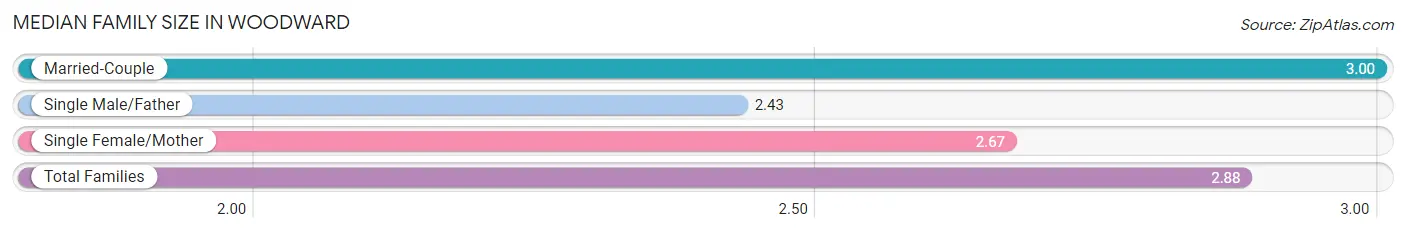
The median family size in Woodward is 2.88 persons per family, with married-couple families (2,004 | 65.6%) accounting for the largest median family size of 3 persons per family. On the other hand, single male/father families (160 | 5.2%) represent the smallest median family size with 2.43 persons per family.
| Family Type | # Families | Family Size |
| Married-Couple | 2,004 (65.6%) | 3.00 |
| Single Male/Father | 160 (5.2%) | 2.43 |
| Single Female/Mother | 892 (29.2%) | 2.67 |
| Total Families | 3,056 (100.0%) | 2.88 |
Median Household Size in Woodward
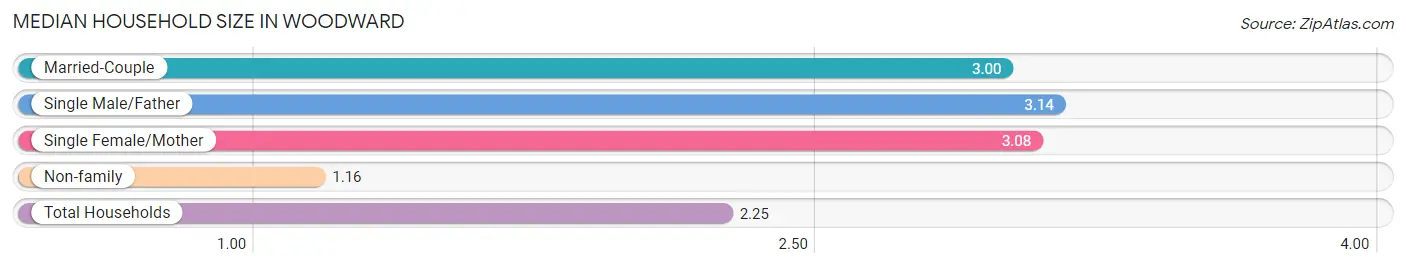
The median household size in Woodward is 2.25 persons per household, with single male/father households (160 | 3.1%) accounting for the largest median household size of 3.14 persons per household. non-family households (2,162 | 41.4%) represent the smallest median household size with 1.16 persons per household.
| Household Type | # Households | Household Size |
| Married-Couple | 2,004 (38.4%) | 3.00 |
| Single Male/Father | 160 (3.1%) | 3.14 |
| Single Female/Mother | 892 (17.1%) | 3.08 |
| Non-family | 2,162 (41.4%) | 1.16 |
| Total Households | 5,218 (100.0%) | 2.25 |
Household Size by Marriage Status in Woodward
Out of a total of 5,218 households in Woodward, 3,056 (58.6%) are family households, while 2,162 (41.4%) are nonfamily households. The most numerous type of family households are 2-person households, comprising 1,539, and the most common type of nonfamily households are 1-person households, comprising 1,919.
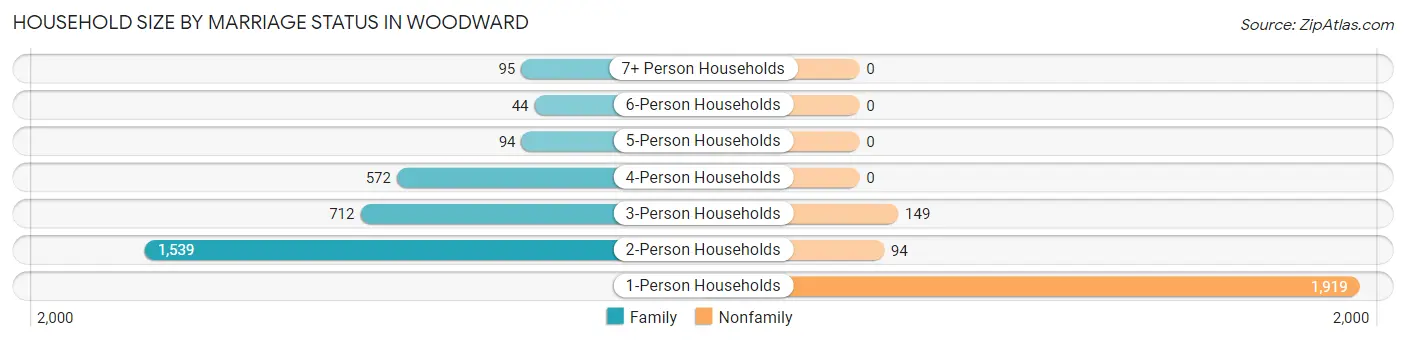
| Household Size | Family Households | Nonfamily Households |
| 1-Person Households | - | 1,919 (36.8%) |
| 2-Person Households | 1,539 (29.5%) | 94 (1.8%) |
| 3-Person Households | 712 (13.7%) | 149 (2.9%) |
| 4-Person Households | 572 (11.0%) | 0 (0.0%) |
| 5-Person Households | 94 (1.8%) | 0 (0.0%) |
| 6-Person Households | 44 (0.8%) | 0 (0.0%) |
| 7+ Person Households | 95 (1.8%) | 0 (0.0%) |
| Total | 3,056 (58.6%) | 2,162 (41.4%) |
Female Fertility in Woodward
Fertility by Age in Woodward
Average fertility rate in Woodward is 112.0 births per 1,000 women. Women in the age bracket of 20 to 34 years have the highest fertility rate with 188.0 births per 1,000 women. Women in the age bracket of 20 to 34 years acount for 77.2% of all women with births.
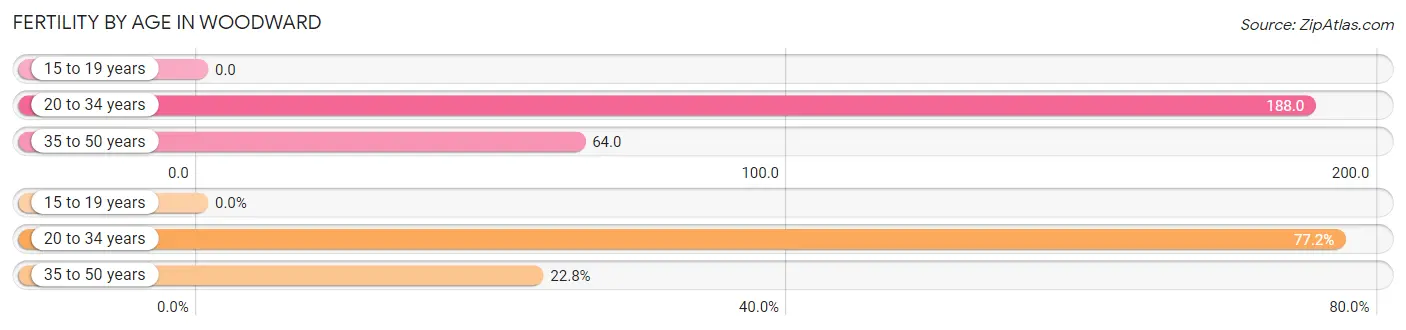
| Age Bracket | Women with Births | Births / 1,000 Women |
| 15 to 19 years | 0 (0.0%) | 0.0 |
| 20 to 34 years | 241 (77.2%) | 188.0 |
| 35 to 50 years | 71 (22.8%) | 64.0 |
| Total | 312 (100.0%) | 112.0 |
Fertility by Age by Marriage Status in Woodward
73.4% of women with births (312) in Woodward are married. The highest percentage of unmarried women with births falls into 20 to 34 years age bracket with 34.4% of them unmarried at the time of birth, while the lowest percentage of unmarried women with births belong to 35 to 50 years age bracket with 0.0% of them unmarried.
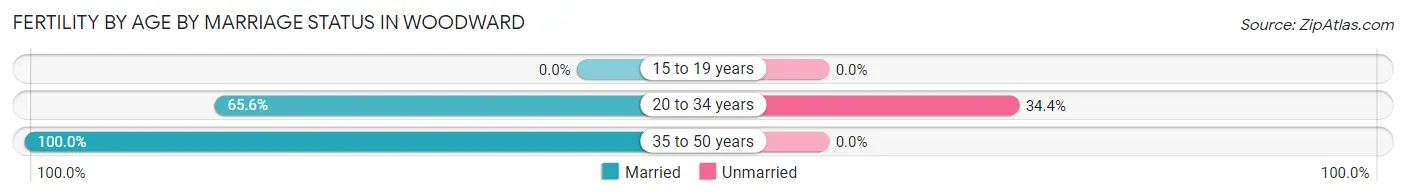
| Age Bracket | Married | Unmarried |
| 15 to 19 years | 0 (0.0%) | 0 (0.0%) |
| 20 to 34 years | 158 (65.6%) | 83 (34.4%) |
| 35 to 50 years | 71 (100.0%) | 0 (0.0%) |
| Total | 229 (73.4%) | 83 (26.6%) |
Fertility by Education in Woodward
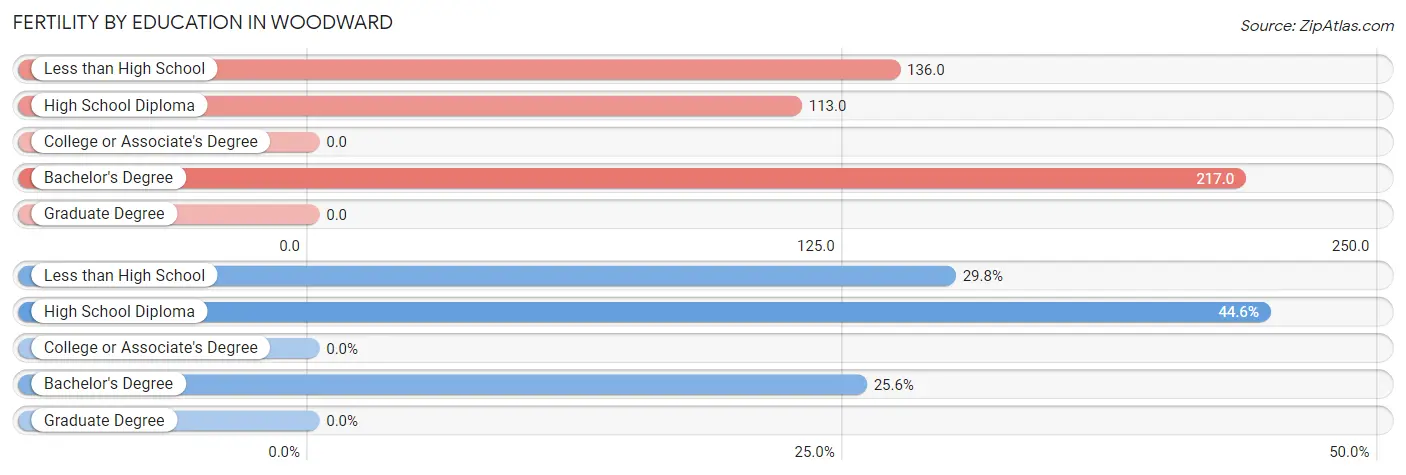
| Educational Attainment | Women with Births | Births / 1,000 Women |
| Less than High School | 93 (29.8%) | 136.0 |
| High School Diploma | 139 (44.6%) | 113.0 |
| College or Associate's Degree | 0 (0.0%) | 0.0 |
| Bachelor's Degree | 80 (25.6%) | 217.0 |
| Graduate Degree | 0 (0.0%) | 0.0 |
| Total | 312 (100.0%) | 112.0 |
Fertility by Education by Marriage Status in Woodward
26.6% of women with births in Woodward are unmarried. Women with the educational attainment of less than high school are most likely to be married with 100.0% of them married at childbirth, while women with the educational attainment of high school diploma are least likely to be married with 59.7% of them unmarried at childbirth.
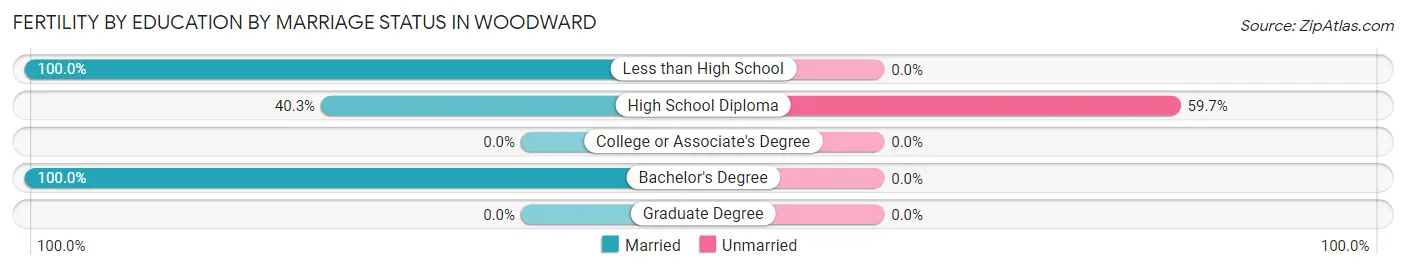
| Educational Attainment | Married | Unmarried |
| Less than High School | 93 (100.0%) | 0 (0.0%) |
| High School Diploma | 56 (40.3%) | 83 (59.7%) |
| College or Associate's Degree | 0 (0.0%) | 0 (0.0%) |
| Bachelor's Degree | 80 (100.0%) | 0 (0.0%) |
| Graduate Degree | 0 (0.0%) | 0 (0.0%) |
| Total | 229 (73.4%) | 83 (26.6%) |
Employment Characteristics in Woodward
Employment by Class of Employer in Woodward
Among the 5,636 employed individuals in Woodward, private company employees (3,363 | 59.7%), local government employees (615 | 10.9%), and state government employees (522 | 9.3%) make up the most common classes of employment.
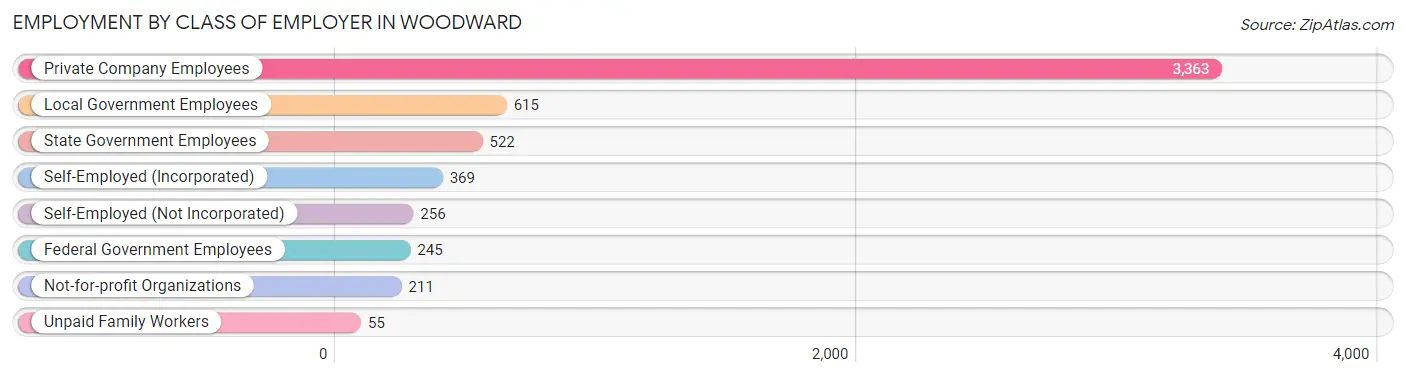
| Employer Class | # Employees | % Employees |
| Private Company Employees | 3,363 | 59.7% |
| Self-Employed (Incorporated) | 369 | 6.6% |
| Self-Employed (Not Incorporated) | 256 | 4.5% |
| Not-for-profit Organizations | 211 | 3.7% |
| Local Government Employees | 615 | 10.9% |
| State Government Employees | 522 | 9.3% |
| Federal Government Employees | 245 | 4.3% |
| Unpaid Family Workers | 55 | 1.0% |
| Total | 5,636 | 100.0% |
Employment Status by Age in Woodward
According to the labor force statistics for Woodward, out of the total population over 16 years of age (9,490), 65.1% or 6,178 individuals are in the labor force, with 6.3% or 389 of them unemployed. The age group with the highest labor force participation rate is 25 to 29 years, with 91.7% or 996 individuals in the labor force. Within the labor force, the 25 to 29 years age range has the highest percentage of unemployed individuals, with 18.1% or 180 of them being unemployed.
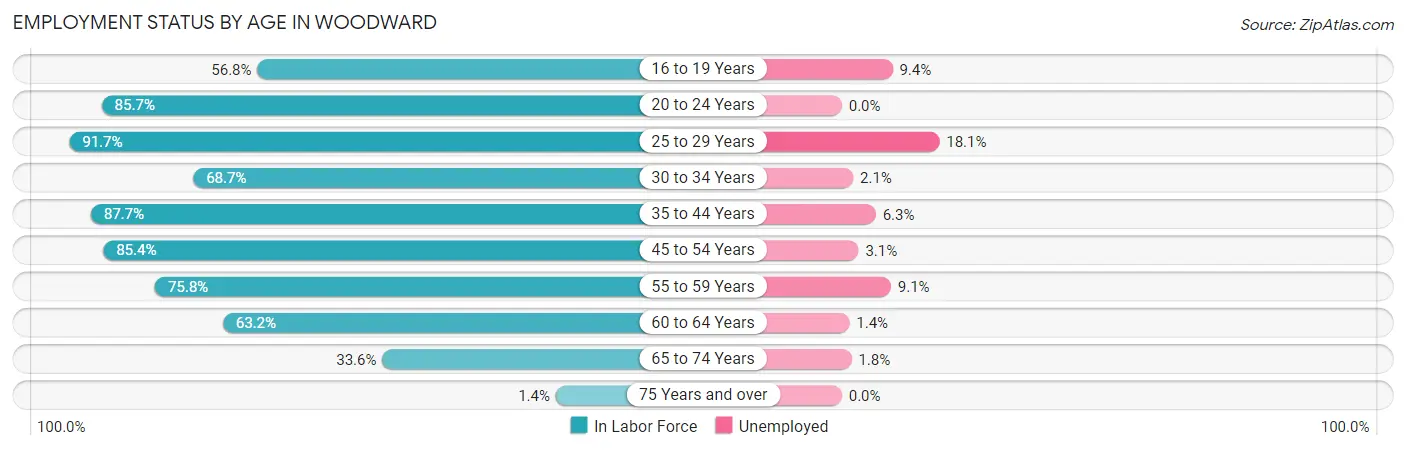
| Age Bracket | In Labor Force | Unemployed |
| 16 to 19 Years | 413 (56.8%) | 39 (9.4%) |
| 20 to 24 Years | 643 (85.7%) | 0 (0.0%) |
| 25 to 29 Years | 996 (91.7%) | 180 (18.1%) |
| 30 to 34 Years | 583 (68.7%) | 12 (2.1%) |
| 35 to 44 Years | 1,389 (87.7%) | 88 (6.3%) |
| 45 to 54 Years | 849 (85.4%) | 26 (3.1%) |
| 55 to 59 Years | 307 (75.8%) | 28 (9.1%) |
| 60 to 64 Years | 648 (63.2%) | 9 (1.4%) |
| 65 to 74 Years | 336 (33.6%) | 6 (1.8%) |
| 75 Years and over | 15 (1.4%) | 0 (0.0%) |
| Total | 6,178 (65.1%) | 389 (6.3%) |
Employment Status by Educational Attainment in Woodward
According to labor force statistics for Woodward, 80.3% of individuals (4,773) out of the total population between 25 and 64 years of age (5,944) are in the labor force, with 7.2% or 344 of them being unemployed. The group with the highest labor force participation rate are those with the educational attainment of college / associate degree, with 87.9% or 1,257 individuals in the labor force. Within the labor force, individuals with college / associate degree education have the highest percentage of unemployment, with 12.6% or 158 of them being unemployed.
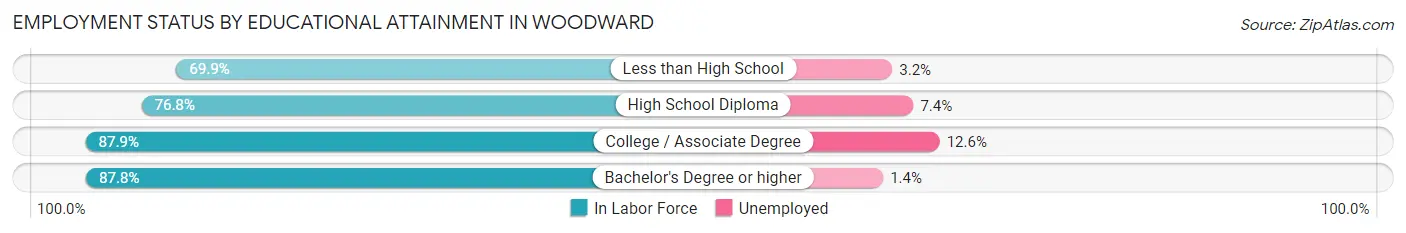
| Educational Attainment | In Labor Force | Unemployed |
| Less than High School | 595 (69.9%) | 27 (3.2%) |
| High School Diploma | 2,061 (76.8%) | 199 (7.4%) |
| College / Associate Degree | 1,257 (87.9%) | 180 (12.6%) |
| Bachelor's Degree or higher | 860 (87.8%) | 14 (1.4%) |
| Total | 4,773 (80.3%) | 428 (7.2%) |
Employment Occupations by Sex in Woodward
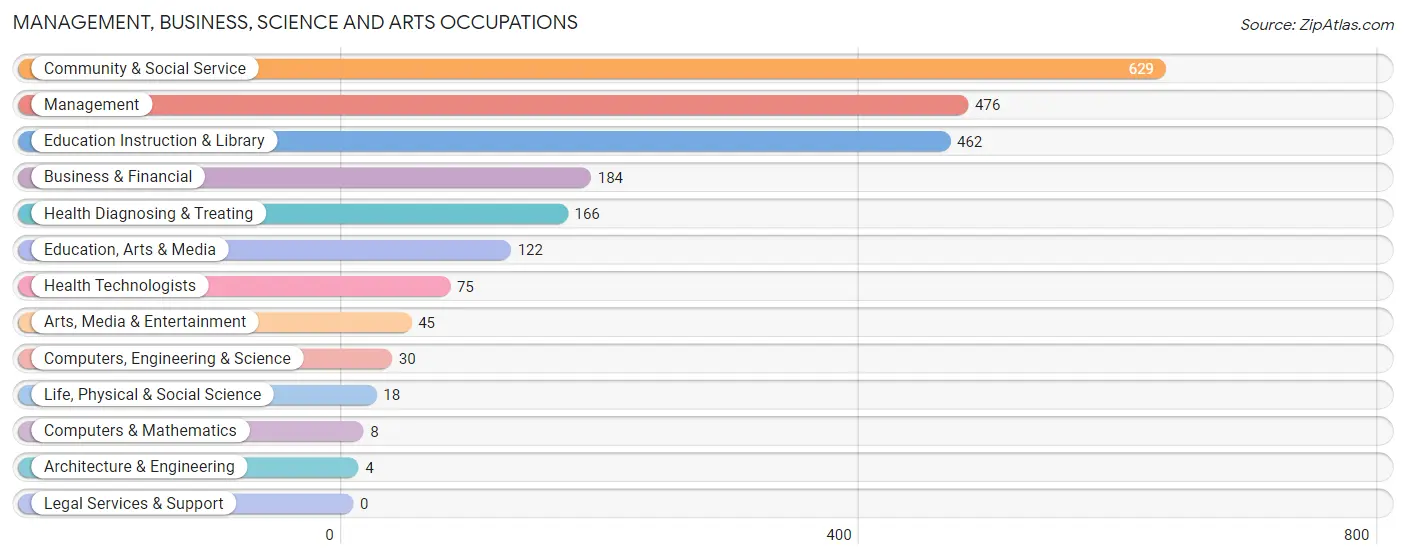
Management, Business, Science and Arts Occupations
The most common Management, Business, Science and Arts occupations in Woodward are Community & Social Service (629 | 10.9%), Management (476 | 8.2%), Education Instruction & Library (462 | 8.0%), Business & Financial (184 | 3.2%), and Health Diagnosing & Treating (166 | 2.9%).
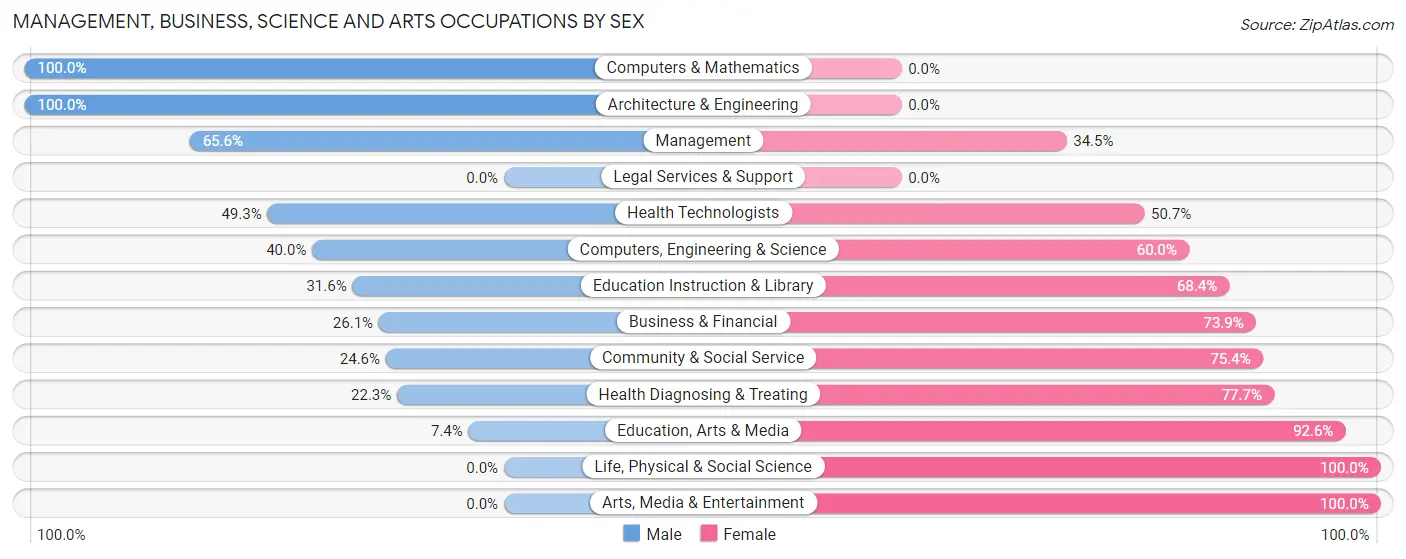
Management, Business, Science and Arts Occupations by Sex
Within the Management, Business, Science and Arts occupations in Woodward, the most male-oriented occupations are Computers & Mathematics (100.0%), Architecture & Engineering (100.0%), and Management (65.5%), while the most female-oriented occupations are Life, Physical & Social Science (100.0%), Arts, Media & Entertainment (100.0%), and Education, Arts & Media (92.6%).
| Occupation | Male | Female |
| Management | 312 (65.5%) | 164 (34.4%) |
| Business & Financial | 48 (26.1%) | 136 (73.9%) |
| Computers, Engineering & Science | 12 (40.0%) | 18 (60.0%) |
| Computers & Mathematics | 8 (100.0%) | 0 (0.0%) |
| Architecture & Engineering | 4 (100.0%) | 0 (0.0%) |
| Life, Physical & Social Science | 0 (0.0%) | 18 (100.0%) |
| Community & Social Service | 155 (24.6%) | 474 (75.4%) |
| Education, Arts & Media | 9 (7.4%) | 113 (92.6%) |
| Legal Services & Support | 0 (0.0%) | 0 (0.0%) |
| Education Instruction & Library | 146 (31.6%) | 316 (68.4%) |
| Arts, Media & Entertainment | 0 (0.0%) | 45 (100.0%) |
| Health Diagnosing & Treating | 37 (22.3%) | 129 (77.7%) |
| Health Technologists | 37 (49.3%) | 38 (50.7%) |
| Total (Category) | 564 (38.0%) | 921 (62.0%) |
| Total (Overall) | 3,252 (56.3%) | 2,526 (43.7%) |
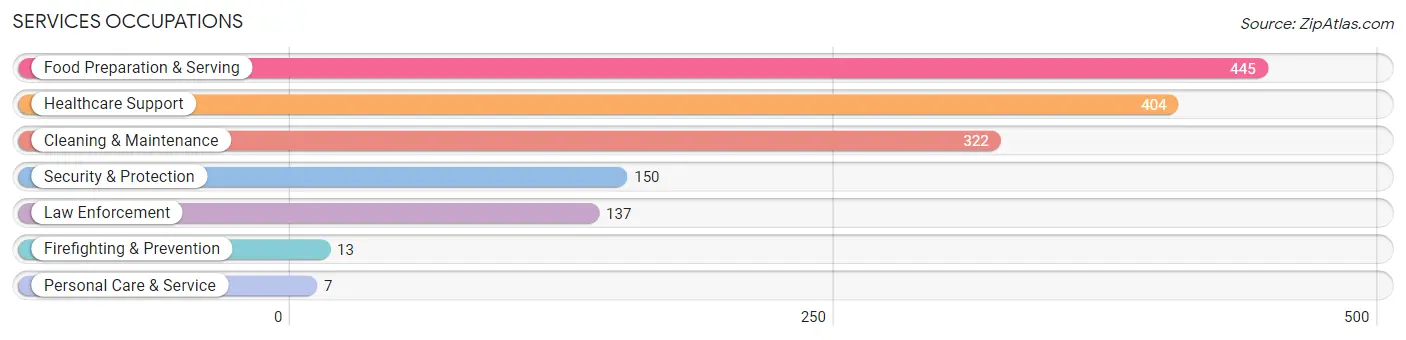
Services Occupations
The most common Services occupations in Woodward are Food Preparation & Serving (445 | 7.7%), Healthcare Support (404 | 7.0%), Cleaning & Maintenance (322 | 5.6%), Security & Protection (150 | 2.6%), and Law Enforcement (137 | 2.4%).
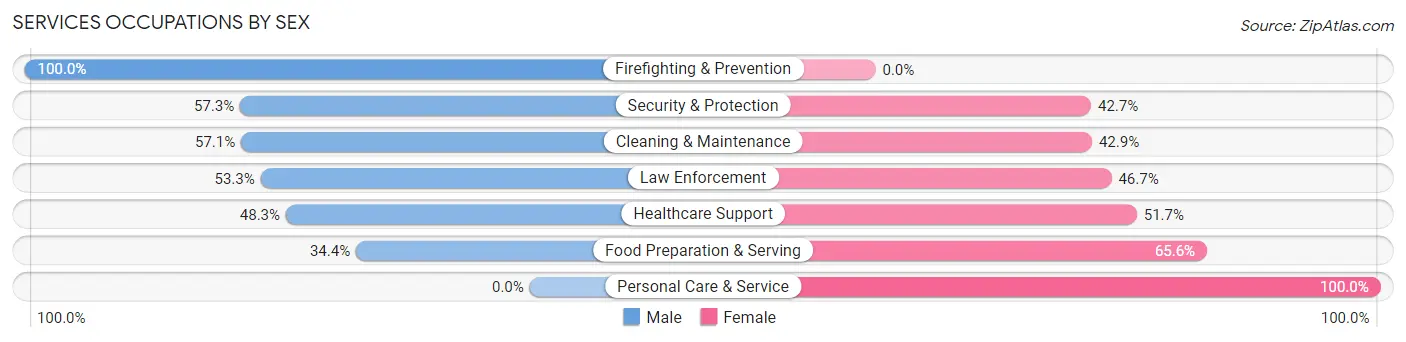
Services Occupations by Sex
Within the Services occupations in Woodward, the most male-oriented occupations are Firefighting & Prevention (100.0%), Security & Protection (57.3%), and Cleaning & Maintenance (57.1%), while the most female-oriented occupations are Personal Care & Service (100.0%), Food Preparation & Serving (65.6%), and Healthcare Support (51.7%).
| Occupation | Male | Female |
| Healthcare Support | 195 (48.3%) | 209 (51.7%) |
| Security & Protection | 86 (57.3%) | 64 (42.7%) |
| Firefighting & Prevention | 13 (100.0%) | 0 (0.0%) |
| Law Enforcement | 73 (53.3%) | 64 (46.7%) |
| Food Preparation & Serving | 153 (34.4%) | 292 (65.6%) |
| Cleaning & Maintenance | 184 (57.1%) | 138 (42.9%) |
| Personal Care & Service | 0 (0.0%) | 7 (100.0%) |
| Total (Category) | 618 (46.5%) | 710 (53.5%) |
| Total (Overall) | 3,252 (56.3%) | 2,526 (43.7%) |
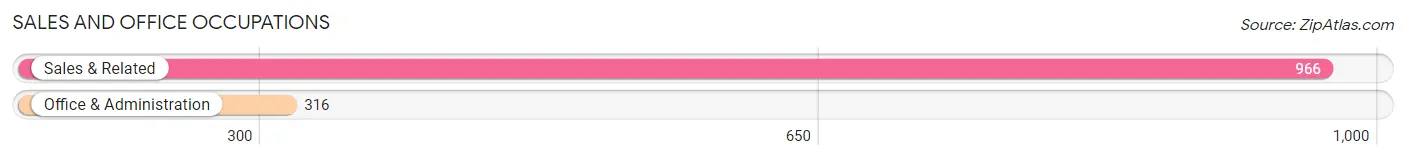
Sales and Office Occupations
The most common Sales and Office occupations in Woodward are Sales & Related (966 | 16.7%), and Office & Administration (316 | 5.5%).
Sales and Office Occupations by Sex
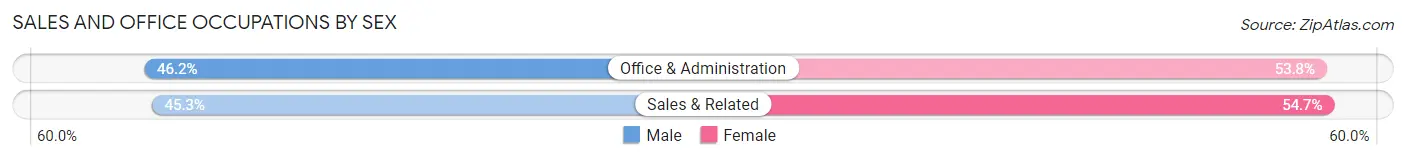
| Occupation | Male | Female |
| Sales & Related | 438 (45.3%) | 528 (54.7%) |
| Office & Administration | 146 (46.2%) | 170 (53.8%) |
| Total (Category) | 584 (45.6%) | 698 (54.4%) |
| Total (Overall) | 3,252 (56.3%) | 2,526 (43.7%) |
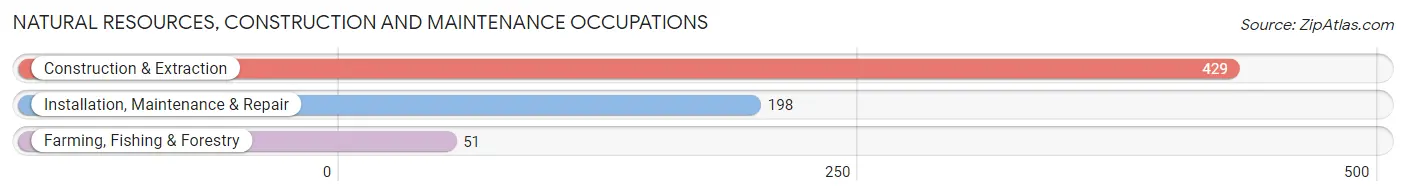
Natural Resources, Construction and Maintenance Occupations
The most common Natural Resources, Construction and Maintenance occupations in Woodward are Construction & Extraction (429 | 7.4%), Installation, Maintenance & Repair (198 | 3.4%), and Farming, Fishing & Forestry (51 | 0.9%).
Natural Resources, Construction and Maintenance Occupations by Sex
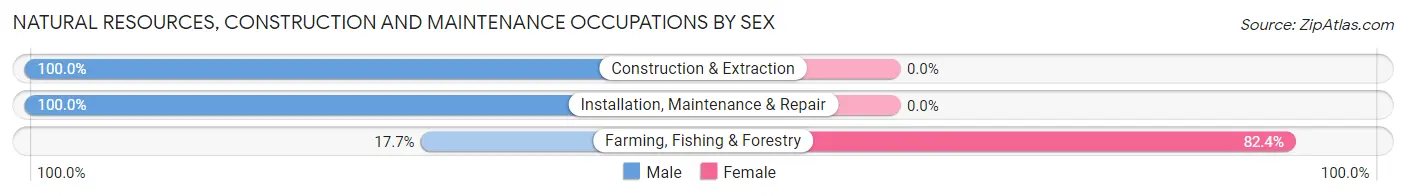
| Occupation | Male | Female |
| Farming, Fishing & Forestry | 9 (17.6%) | 42 (82.4%) |
| Construction & Extraction | 429 (100.0%) | 0 (0.0%) |
| Installation, Maintenance & Repair | 198 (100.0%) | 0 (0.0%) |
| Total (Category) | 636 (93.8%) | 42 (6.2%) |
| Total (Overall) | 3,252 (56.3%) | 2,526 (43.7%) |
Production, Transportation and Moving Occupations
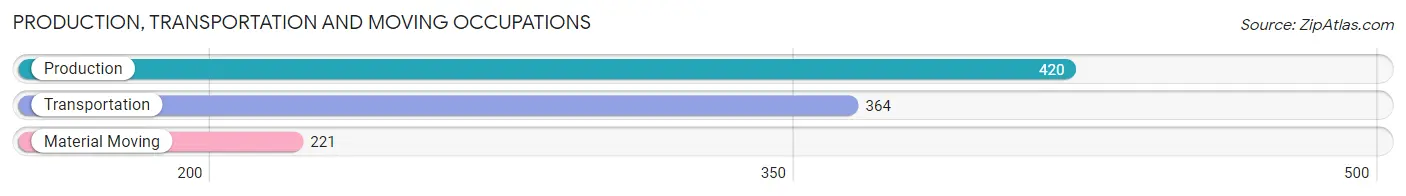
The most common Production, Transportation and Moving occupations in Woodward are Production (420 | 7.3%), Transportation (364 | 6.3%), and Material Moving (221 | 3.8%).
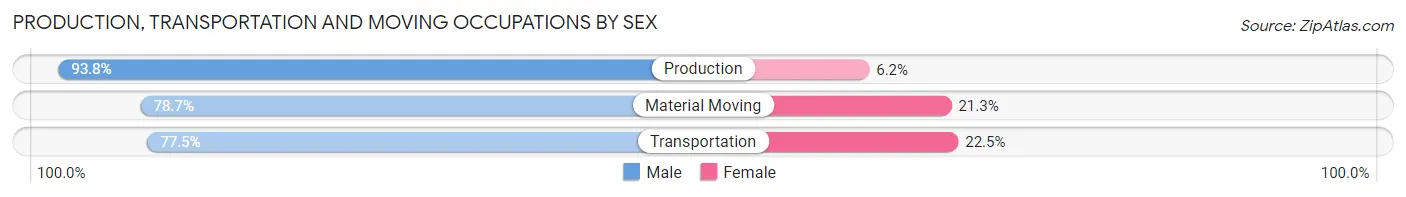
Production, Transportation and Moving Occupations by Sex
| Occupation | Male | Female |
| Production | 394 (93.8%) | 26 (6.2%) |
| Transportation | 282 (77.5%) | 82 (22.5%) |
| Material Moving | 174 (78.7%) | 47 (21.3%) |
| Total (Category) | 850 (84.6%) | 155 (15.4%) |
| Total (Overall) | 3,252 (56.3%) | 2,526 (43.7%) |
Employment Industries by Sex in Woodward
Employment Industries in Woodward
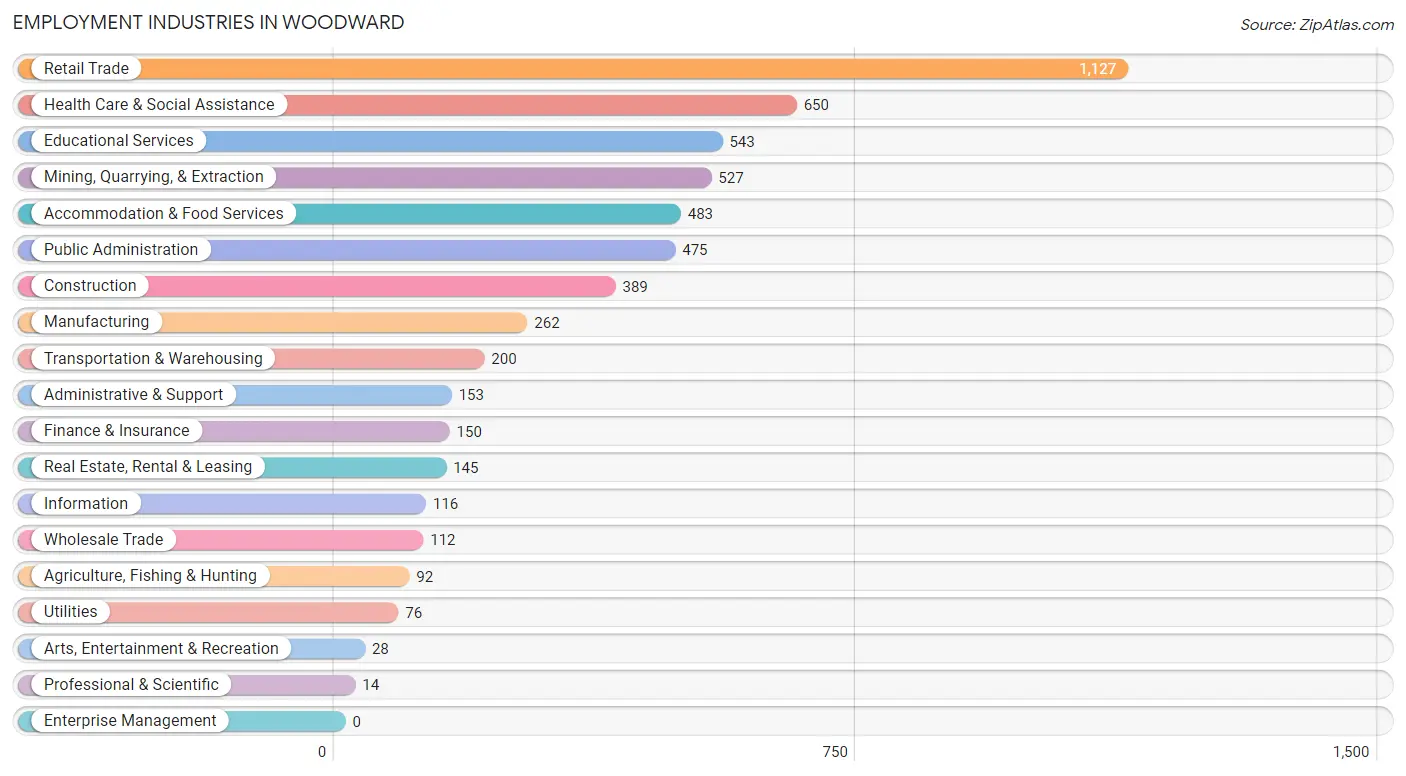
The major employment industries in Woodward include Retail Trade (1,127 | 19.5%), Health Care & Social Assistance (650 | 11.3%), Educational Services (543 | 9.4%), Mining, Quarrying, & Extraction (527 | 9.1%), and Accommodation & Food Services (483 | 8.4%).
Employment Industries by Sex in Woodward
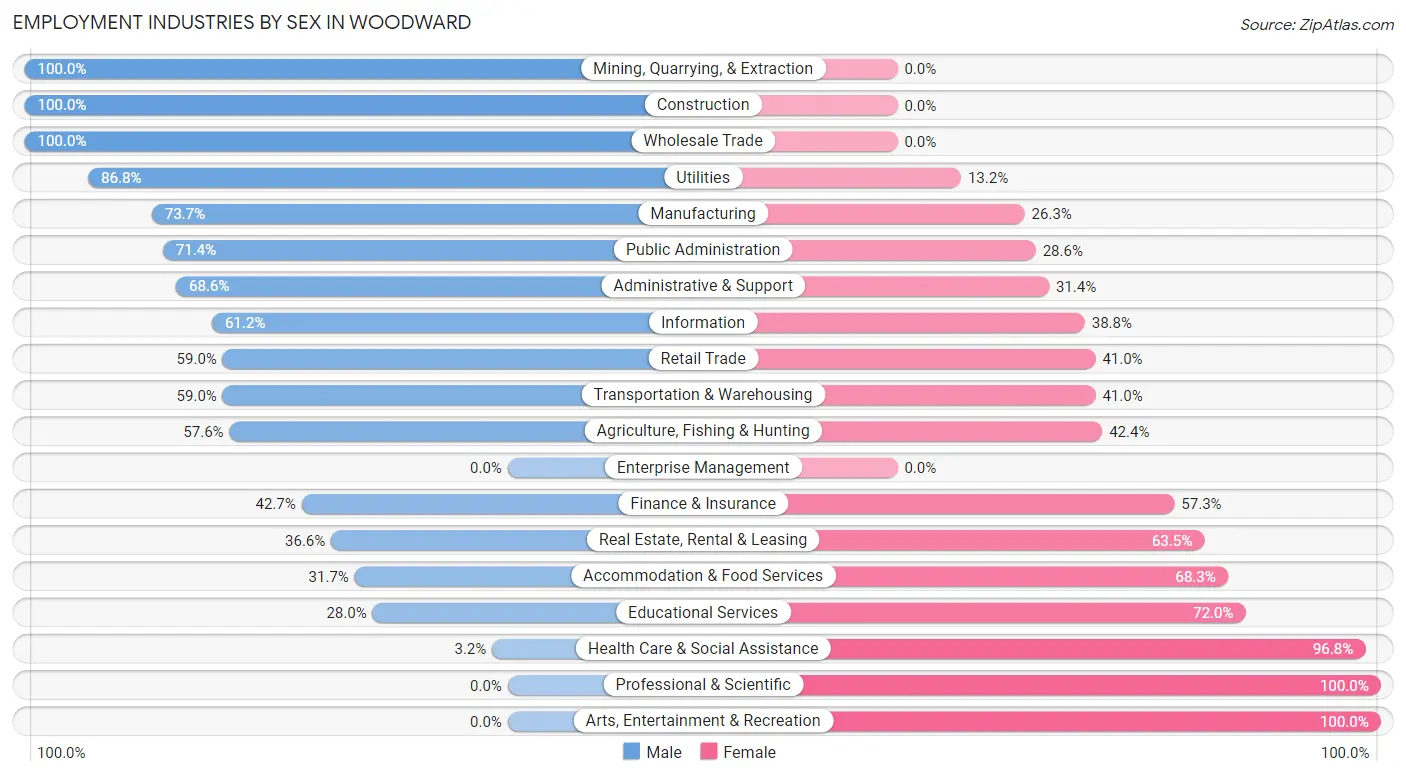
The Woodward industries that see more men than women are Mining, Quarrying, & Extraction (100.0%), Construction (100.0%), and Wholesale Trade (100.0%), whereas the industries that tend to have a higher number of women are Professional & Scientific (100.0%), Arts, Entertainment & Recreation (100.0%), and Health Care & Social Assistance (96.8%).
| Industry | Male | Female |
| Agriculture, Fishing & Hunting | 53 (57.6%) | 39 (42.4%) |
| Mining, Quarrying, & Extraction | 527 (100.0%) | 0 (0.0%) |
| Construction | 389 (100.0%) | 0 (0.0%) |
| Manufacturing | 193 (73.7%) | 69 (26.3%) |
| Wholesale Trade | 112 (100.0%) | 0 (0.0%) |
| Retail Trade | 665 (59.0%) | 462 (41.0%) |
| Transportation & Warehousing | 118 (59.0%) | 82 (41.0%) |
| Utilities | 66 (86.8%) | 10 (13.2%) |
| Information | 71 (61.2%) | 45 (38.8%) |
| Finance & Insurance | 64 (42.7%) | 86 (57.3%) |
| Real Estate, Rental & Leasing | 53 (36.5%) | 92 (63.4%) |
| Professional & Scientific | 0 (0.0%) | 14 (100.0%) |
| Enterprise Management | 0 (0.0%) | 0 (0.0%) |
| Administrative & Support | 105 (68.6%) | 48 (31.4%) |
| Educational Services | 152 (28.0%) | 391 (72.0%) |
| Health Care & Social Assistance | 21 (3.2%) | 629 (96.8%) |
| Arts, Entertainment & Recreation | 0 (0.0%) | 28 (100.0%) |
| Accommodation & Food Services | 153 (31.7%) | 330 (68.3%) |
| Public Administration | 339 (71.4%) | 136 (28.6%) |
| Total | 3,252 (56.3%) | 2,526 (43.7%) |
Education in Woodward
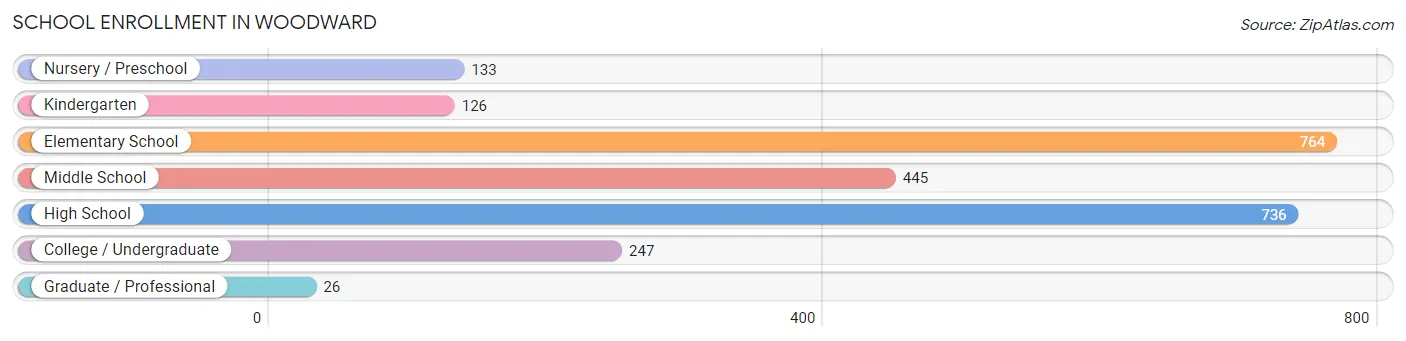
School Enrollment in Woodward
The most common levels of schooling among the 2,477 students in Woodward are elementary school (764 | 30.8%), high school (736 | 29.7%), and middle school (445 | 18.0%).
| School Level | # Students | % Students |
| Nursery / Preschool | 133 | 5.4% |
| Kindergarten | 126 | 5.1% |
| Elementary School | 764 | 30.8% |
| Middle School | 445 | 18.0% |
| High School | 736 | 29.7% |
| College / Undergraduate | 247 | 10.0% |
| Graduate / Professional | 26 | 1.1% |
| Total | 2,477 | 100.0% |
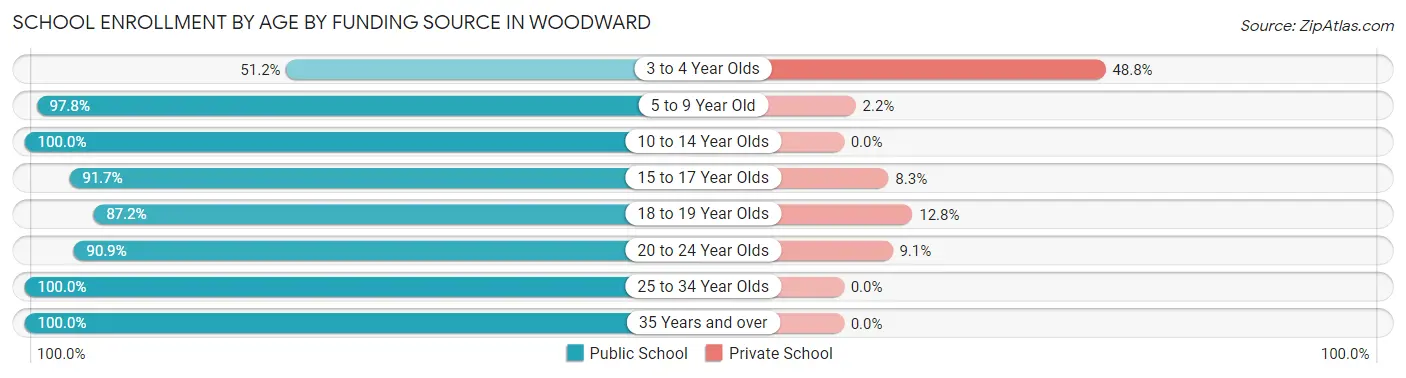
School Enrollment by Age by Funding Source in Woodward
Out of a total of 2,477 students who are enrolled in schools in Woodward, 154 (6.2%) attend a private institution, while the remaining 2,323 (93.8%) are enrolled in public schools. The age group of 3 to 4 year olds has the highest likelihood of being enrolled in private schools, with 59 (48.8% in the age bracket) enrolled. Conversely, the age group of 10 to 14 year olds has the lowest likelihood of being enrolled in a private school, with 589 (100.0% in the age bracket) attending a public institution.
| Age Bracket | Public School | Private School |
| 3 to 4 Year Olds | 62 (51.2%) | 59 (48.8%) |
| 5 to 9 Year Old | 744 (97.8%) | 17 (2.2%) |
| 10 to 14 Year Olds | 589 (100.0%) | 0 (0.0%) |
| 15 to 17 Year Olds | 528 (91.7%) | 48 (8.3%) |
| 18 to 19 Year Olds | 191 (87.2%) | 28 (12.8%) |
| 20 to 24 Year Olds | 10 (90.9%) | 1 (9.1%) |
| 25 to 34 Year Olds | 93 (100.0%) | 0 (0.0%) |
| 35 Years and over | 107 (100.0%) | 0 (0.0%) |
| Total | 2,323 (93.8%) | 154 (6.2%) |
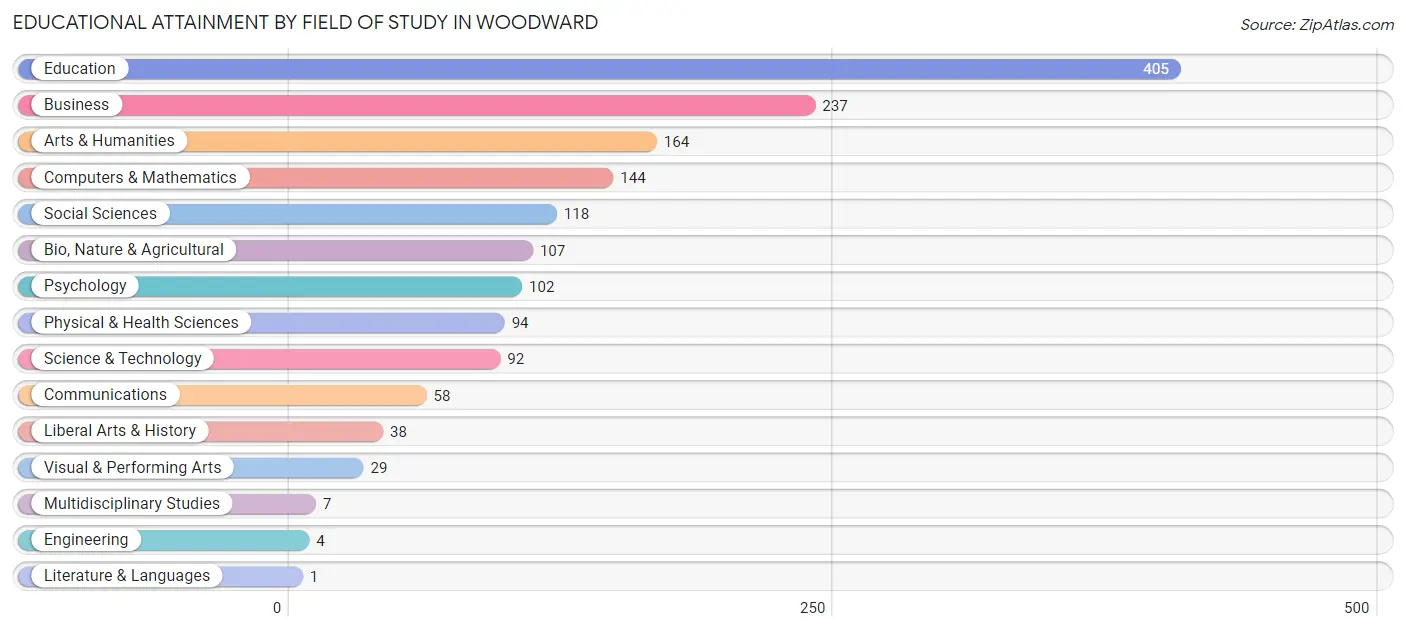
Educational Attainment by Field of Study in Woodward
Education (405 | 25.3%), business (237 | 14.8%), arts & humanities (164 | 10.2%), computers & mathematics (144 | 9.0%), and social sciences (118 | 7.4%) are the most common fields of study among 1,600 individuals in Woodward who have obtained a bachelor's degree or higher.
| Field of Study | # Graduates | % Graduates |
| Computers & Mathematics | 144 | 9.0% |
| Bio, Nature & Agricultural | 107 | 6.7% |
| Physical & Health Sciences | 94 | 5.9% |
| Psychology | 102 | 6.4% |
| Social Sciences | 118 | 7.4% |
| Engineering | 4 | 0.3% |
| Multidisciplinary Studies | 7 | 0.4% |
| Science & Technology | 92 | 5.8% |
| Business | 237 | 14.8% |
| Education | 405 | 25.3% |
| Literature & Languages | 1 | 0.1% |
| Liberal Arts & History | 38 | 2.4% |
| Visual & Performing Arts | 29 | 1.8% |
| Communications | 58 | 3.6% |
| Arts & Humanities | 164 | 10.2% |
| Total | 1,600 | 100.0% |
Transportation & Commute in Woodward
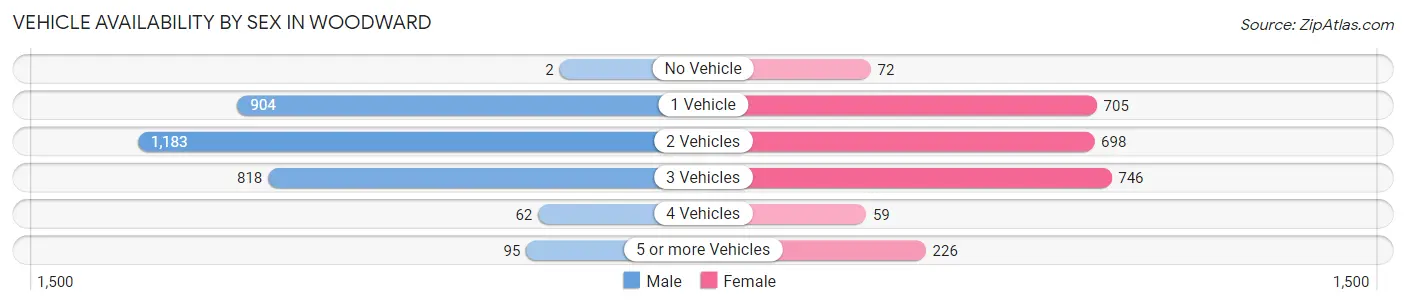
Vehicle Availability by Sex in Woodward
The most prevalent vehicle ownership categories in Woodward are males with 2 vehicles (1,183, accounting for 38.6%) and females with 2 vehicles (698, making up 47.2%).
| Vehicles Available | Male | Female |
| No Vehicle | 2 (0.1%) | 72 (2.9%) |
| 1 Vehicle | 904 (29.5%) | 705 (28.1%) |
| 2 Vehicles | 1,183 (38.6%) | 698 (27.9%) |
| 3 Vehicles | 818 (26.7%) | 746 (29.8%) |
| 4 Vehicles | 62 (2.0%) | 59 (2.4%) |
| 5 or more Vehicles | 95 (3.1%) | 226 (9.0%) |
| Total | 3,064 (100.0%) | 2,506 (100.0%) |
Commute Time in Woodward
The most frequently occuring commute durations in Woodward are 5 to 9 minutes (1,998 commuters, 36.0%), 10 to 14 minutes (1,400 commuters, 25.2%), and 15 to 19 minutes (739 commuters, 13.3%).
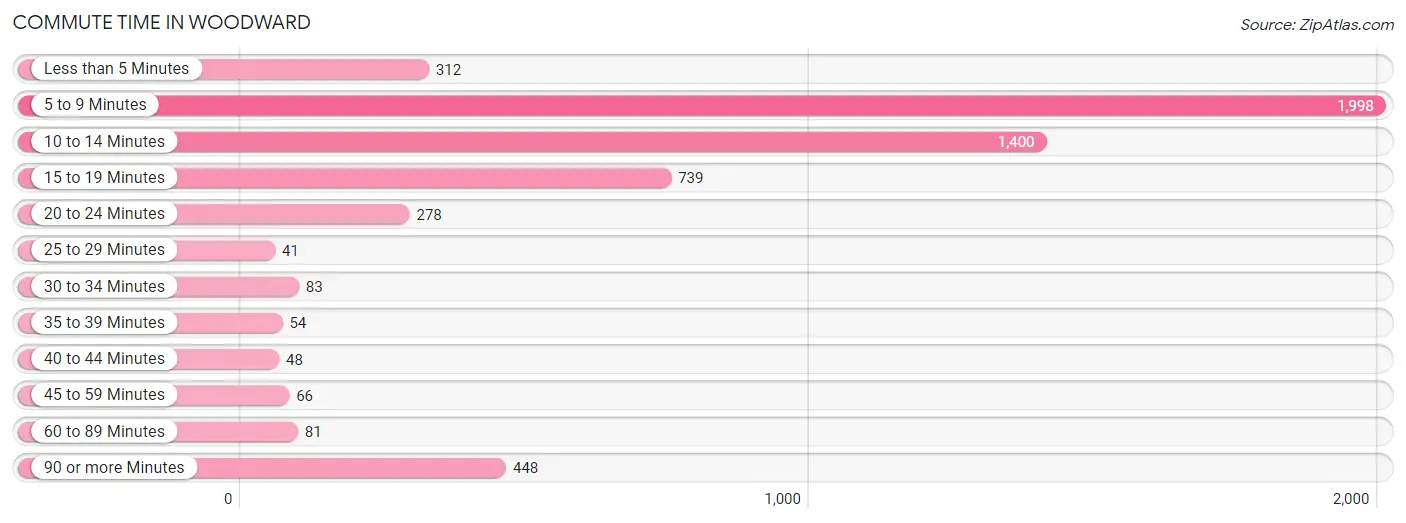
| Commute Time | # Commuters | % Commuters |
| Less than 5 Minutes | 312 | 5.6% |
| 5 to 9 Minutes | 1,998 | 36.0% |
| 10 to 14 Minutes | 1,400 | 25.2% |
| 15 to 19 Minutes | 739 | 13.3% |
| 20 to 24 Minutes | 278 | 5.0% |
| 25 to 29 Minutes | 41 | 0.7% |
| 30 to 34 Minutes | 83 | 1.5% |
| 35 to 39 Minutes | 54 | 1.0% |
| 40 to 44 Minutes | 48 | 0.9% |
| 45 to 59 Minutes | 66 | 1.2% |
| 60 to 89 Minutes | 81 | 1.5% |
| 90 or more Minutes | 448 | 8.1% |
Commute Time by Sex in Woodward
The most common commute times in Woodward are 5 to 9 minutes (1,045 commuters, 33.5%) for males and 5 to 9 minutes (953 commuters, 39.2%) for females.
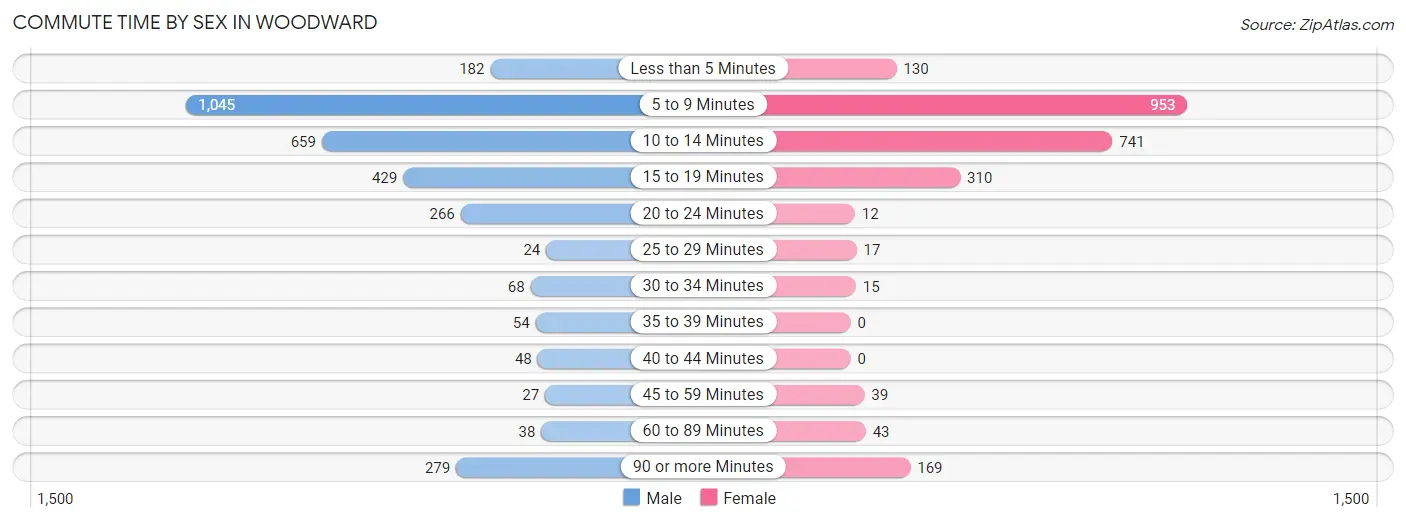
| Commute Time | Male | Female |
| Less than 5 Minutes | 182 (5.8%) | 130 (5.3%) |
| 5 to 9 Minutes | 1,045 (33.5%) | 953 (39.2%) |
| 10 to 14 Minutes | 659 (21.1%) | 741 (30.5%) |
| 15 to 19 Minutes | 429 (13.8%) | 310 (12.8%) |
| 20 to 24 Minutes | 266 (8.5%) | 12 (0.5%) |
| 25 to 29 Minutes | 24 (0.8%) | 17 (0.7%) |
| 30 to 34 Minutes | 68 (2.2%) | 15 (0.6%) |
| 35 to 39 Minutes | 54 (1.7%) | 0 (0.0%) |
| 40 to 44 Minutes | 48 (1.5%) | 0 (0.0%) |
| 45 to 59 Minutes | 27 (0.9%) | 39 (1.6%) |
| 60 to 89 Minutes | 38 (1.2%) | 43 (1.8%) |
| 90 or more Minutes | 279 (8.9%) | 169 (7.0%) |
Time of Departure to Work by Sex in Woodward
The most frequent times of departure to work in Woodward are 7:00 AM to 7:29 AM (569, 18.2%) for males and 7:30 AM to 7:59 AM (370, 15.2%) for females.
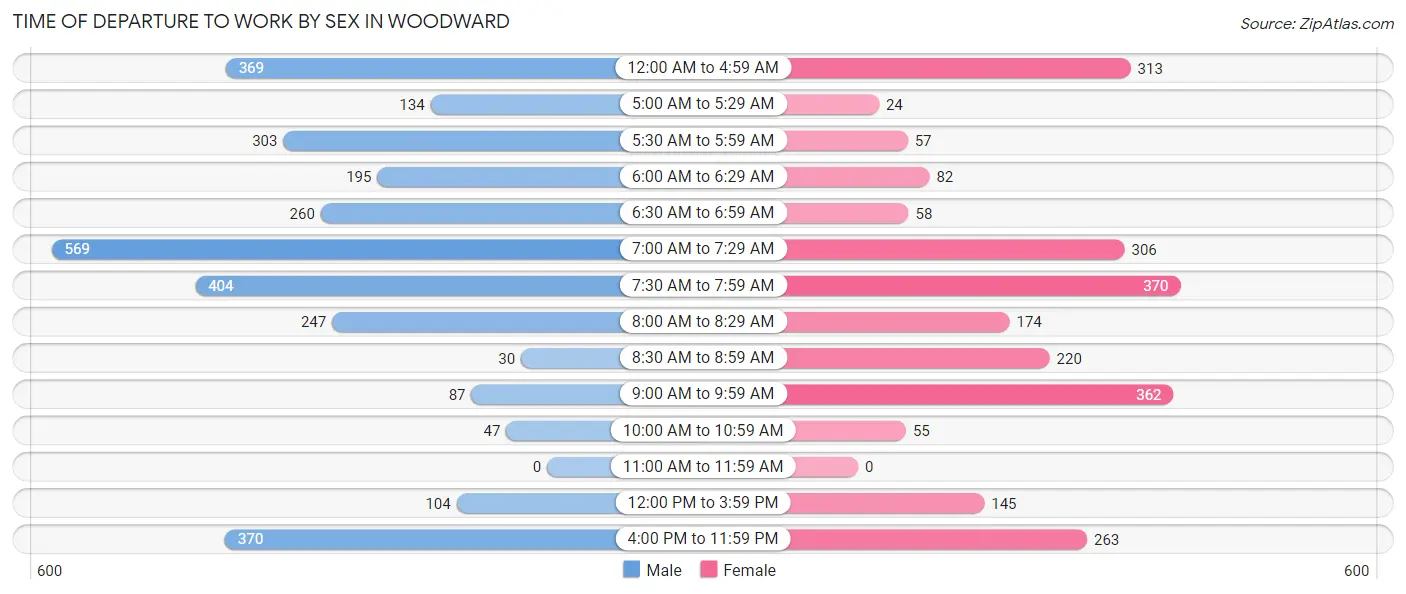
| Time of Departure | Male | Female |
| 12:00 AM to 4:59 AM | 369 (11.8%) | 313 (12.9%) |
| 5:00 AM to 5:29 AM | 134 (4.3%) | 24 (1.0%) |
| 5:30 AM to 5:59 AM | 303 (9.7%) | 57 (2.4%) |
| 6:00 AM to 6:29 AM | 195 (6.2%) | 82 (3.4%) |
| 6:30 AM to 6:59 AM | 260 (8.3%) | 58 (2.4%) |
| 7:00 AM to 7:29 AM | 569 (18.2%) | 306 (12.6%) |
| 7:30 AM to 7:59 AM | 404 (13.0%) | 370 (15.2%) |
| 8:00 AM to 8:29 AM | 247 (7.9%) | 174 (7.2%) |
| 8:30 AM to 8:59 AM | 30 (1.0%) | 220 (9.1%) |
| 9:00 AM to 9:59 AM | 87 (2.8%) | 362 (14.9%) |
| 10:00 AM to 10:59 AM | 47 (1.5%) | 55 (2.3%) |
| 11:00 AM to 11:59 AM | 0 (0.0%) | 0 (0.0%) |
| 12:00 PM to 3:59 PM | 104 (3.3%) | 145 (6.0%) |
| 4:00 PM to 11:59 PM | 370 (11.9%) | 263 (10.8%) |
| Total | 3,119 (100.0%) | 2,429 (100.0%) |
Housing Occupancy in Woodward
Occupancy by Ownership in Woodward
Of the total 5,218 dwellings in Woodward, owner-occupied units account for 3,283 (62.9%), while renter-occupied units make up 1,935 (37.1%).
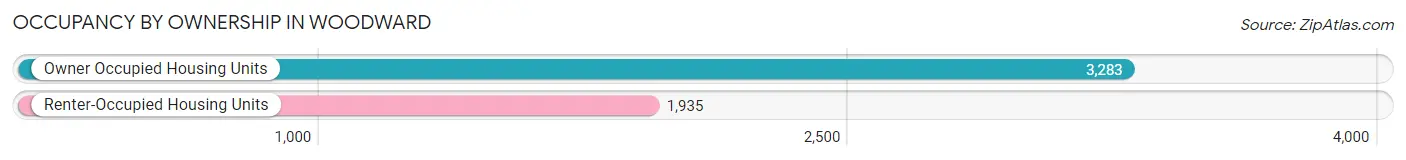
| Occupancy | # Housing Units | % Housing Units |
| Owner Occupied Housing Units | 3,283 | 62.9% |
| Renter-Occupied Housing Units | 1,935 | 37.1% |
| Total Occupied Housing Units | 5,218 | 100.0% |
Occupancy by Household Size in Woodward
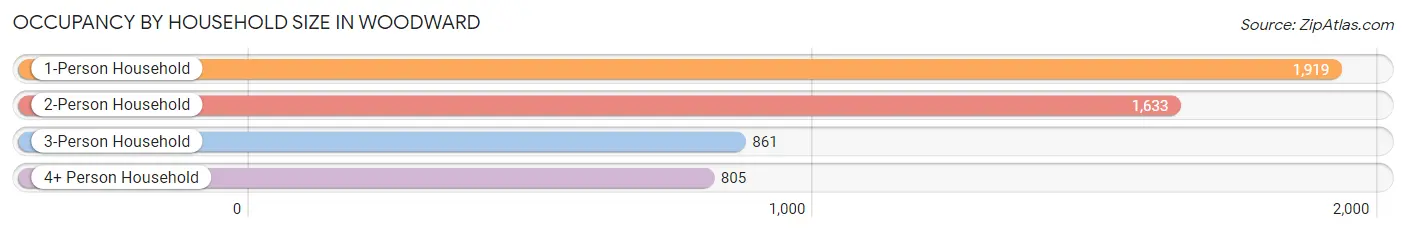
| Household Size | # Housing Units | % Housing Units |
| 1-Person Household | 1,919 | 36.8% |
| 2-Person Household | 1,633 | 31.3% |
| 3-Person Household | 861 | 16.5% |
| 4+ Person Household | 805 | 15.4% |
| Total Housing Units | 5,218 | 100.0% |
Occupancy by Ownership by Household Size in Woodward
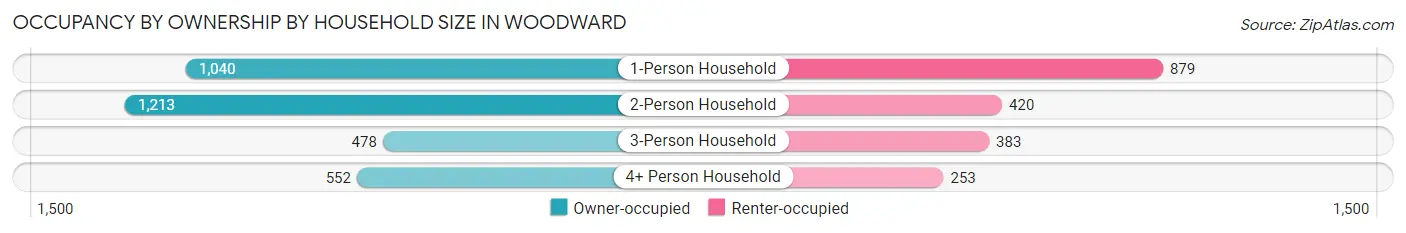
| Household Size | Owner-occupied | Renter-occupied |
| 1-Person Household | 1,040 (54.2%) | 879 (45.8%) |
| 2-Person Household | 1,213 (74.3%) | 420 (25.7%) |
| 3-Person Household | 478 (55.5%) | 383 (44.5%) |
| 4+ Person Household | 552 (68.6%) | 253 (31.4%) |
| Total Housing Units | 3,283 (62.9%) | 1,935 (37.1%) |
Occupancy by Educational Attainment in Woodward
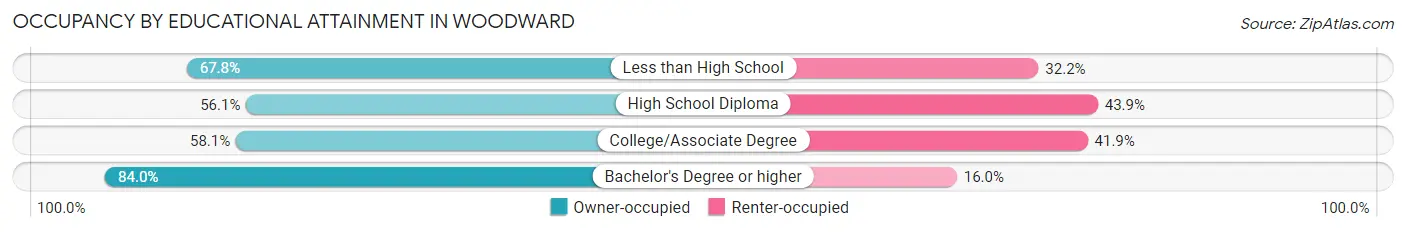
| Household Size | Owner-occupied | Renter-occupied |
| Less than High School | 291 (67.8%) | 138 (32.2%) |
| High School Diploma | 1,364 (56.1%) | 1,069 (43.9%) |
| College/Associate Degree | 787 (58.1%) | 568 (41.9%) |
| Bachelor's Degree or higher | 841 (84.0%) | 160 (16.0%) |
Occupancy by Age of Householder in Woodward
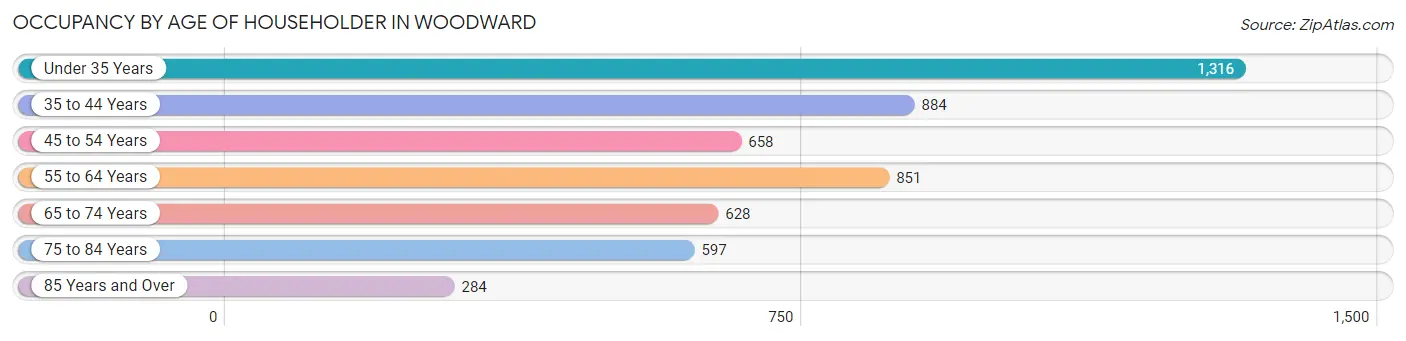
| Age Bracket | # Households | % Households |
| Under 35 Years | 1,316 | 25.2% |
| 35 to 44 Years | 884 | 16.9% |
| 45 to 54 Years | 658 | 12.6% |
| 55 to 64 Years | 851 | 16.3% |
| 65 to 74 Years | 628 | 12.0% |
| 75 to 84 Years | 597 | 11.4% |
| 85 Years and Over | 284 | 5.4% |
| Total | 5,218 | 100.0% |
Housing Finances in Woodward
Median Income by Occupancy in Woodward
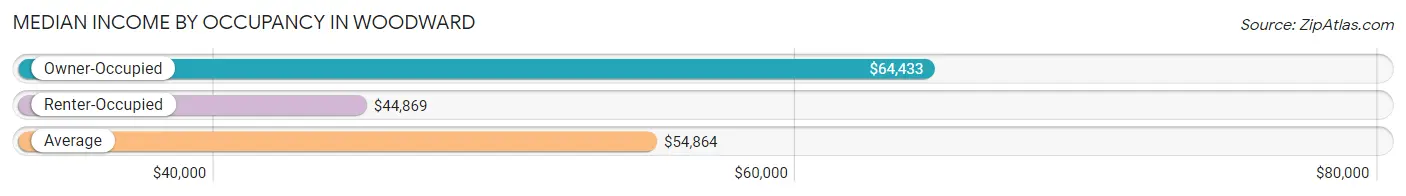
| Occupancy Type | # Households | Median Income |
| Owner-Occupied | 3,283 (62.9%) | $64,433 |
| Renter-Occupied | 1,935 (37.1%) | $44,869 |
| Average | 5,218 (100.0%) | $54,864 |
Occupancy by Householder Income Bracket in Woodward
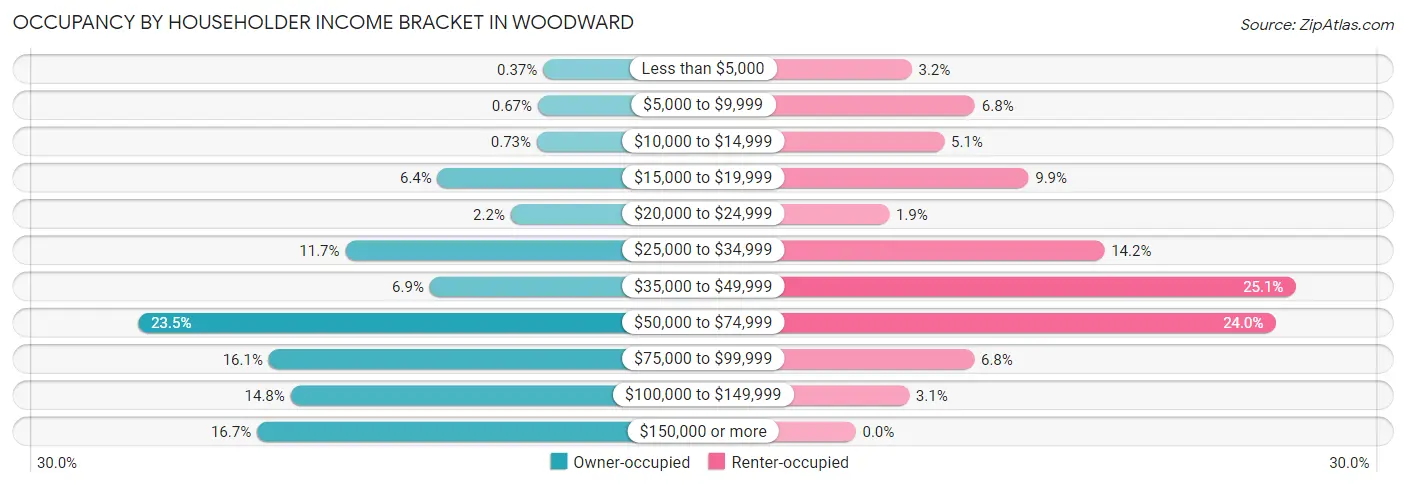
| Income Bracket | Owner-occupied | Renter-occupied |
| Less than $5,000 | 12 (0.4%) | 62 (3.2%) |
| $5,000 to $9,999 | 22 (0.7%) | 132 (6.8%) |
| $10,000 to $14,999 | 24 (0.7%) | 98 (5.1%) |
| $15,000 to $19,999 | 210 (6.4%) | 191 (9.9%) |
| $20,000 to $24,999 | 73 (2.2%) | 37 (1.9%) |
| $25,000 to $34,999 | 383 (11.7%) | 275 (14.2%) |
| $35,000 to $49,999 | 225 (6.9%) | 486 (25.1%) |
| $50,000 to $74,999 | 772 (23.5%) | 464 (24.0%) |
| $75,000 to $99,999 | 527 (16.1%) | 131 (6.8%) |
| $100,000 to $149,999 | 486 (14.8%) | 59 (3.0%) |
| $150,000 or more | 549 (16.7%) | 0 (0.0%) |
| Total | 3,283 (100.0%) | 1,935 (100.0%) |
Monthly Housing Cost Tiers in Woodward
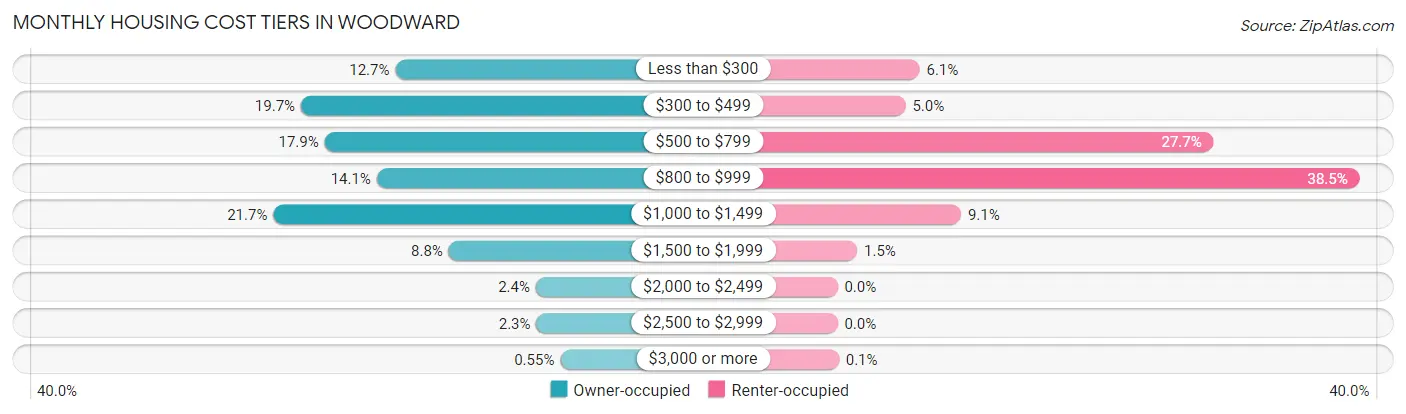
| Monthly Cost | Owner-occupied | Renter-occupied |
| Less than $300 | 417 (12.7%) | 117 (6.0%) |
| $300 to $499 | 645 (19.7%) | 97 (5.0%) |
| $500 to $799 | 588 (17.9%) | 536 (27.7%) |
| $800 to $999 | 462 (14.1%) | 744 (38.5%) |
| $1,000 to $1,499 | 712 (21.7%) | 176 (9.1%) |
| $1,500 to $1,999 | 288 (8.8%) | 28 (1.5%) |
| $2,000 to $2,499 | 77 (2.4%) | 0 (0.0%) |
| $2,500 to $2,999 | 76 (2.3%) | 0 (0.0%) |
| $3,000 or more | 18 (0.5%) | 2 (0.1%) |
| Total | 3,283 (100.0%) | 1,935 (100.0%) |
Physical Housing Characteristics in Woodward
Housing Structures in Woodward
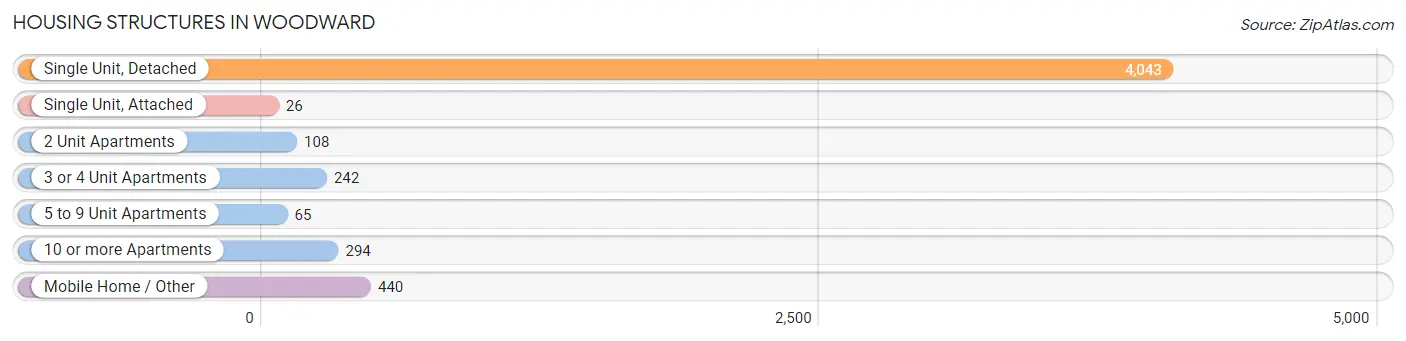
| Structure Type | # Housing Units | % Housing Units |
| Single Unit, Detached | 4,043 | 77.5% |
| Single Unit, Attached | 26 | 0.5% |
| 2 Unit Apartments | 108 | 2.1% |
| 3 or 4 Unit Apartments | 242 | 4.6% |
| 5 to 9 Unit Apartments | 65 | 1.3% |
| 10 or more Apartments | 294 | 5.6% |
| Mobile Home / Other | 440 | 8.4% |
| Total | 5,218 | 100.0% |
Housing Structures by Occupancy in Woodward
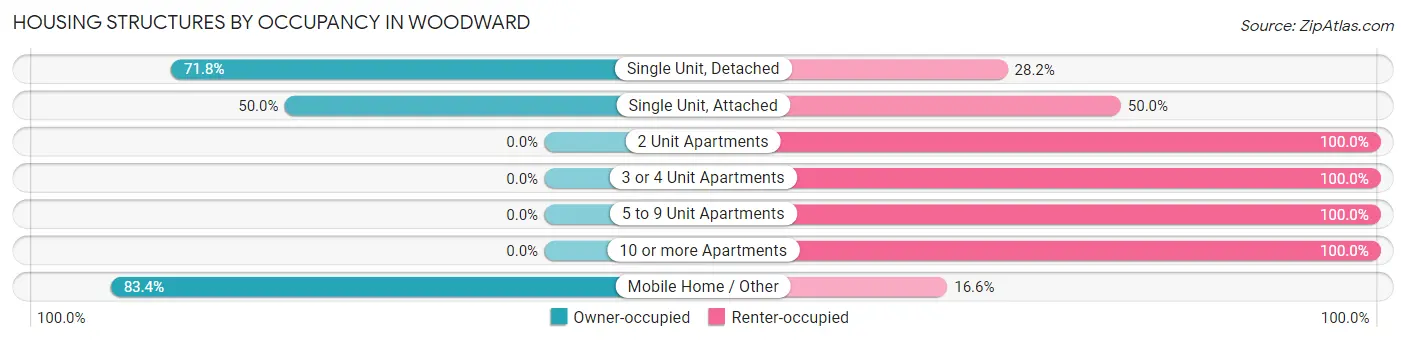
| Structure Type | Owner-occupied | Renter-occupied |
| Single Unit, Detached | 2,903 (71.8%) | 1,140 (28.2%) |
| Single Unit, Attached | 13 (50.0%) | 13 (50.0%) |
| 2 Unit Apartments | 0 (0.0%) | 108 (100.0%) |
| 3 or 4 Unit Apartments | 0 (0.0%) | 242 (100.0%) |
| 5 to 9 Unit Apartments | 0 (0.0%) | 65 (100.0%) |
| 10 or more Apartments | 0 (0.0%) | 294 (100.0%) |
| Mobile Home / Other | 367 (83.4%) | 73 (16.6%) |
| Total | 3,283 (62.9%) | 1,935 (37.1%) |
Housing Structures by Number of Rooms in Woodward
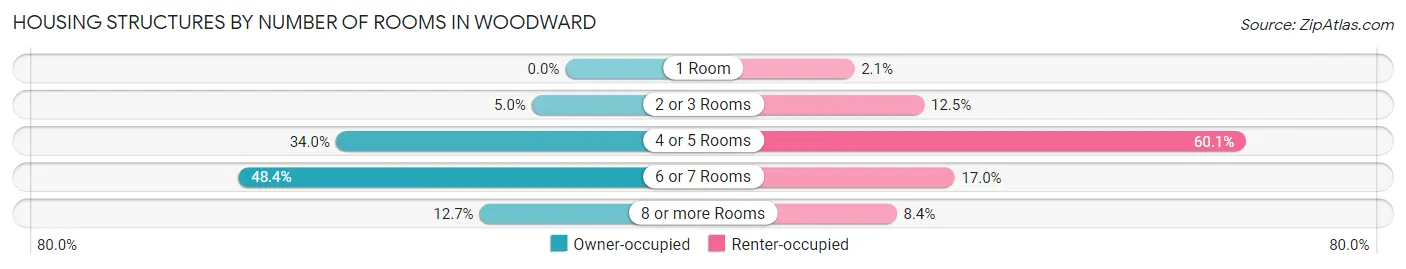
| Number of Rooms | Owner-occupied | Renter-occupied |
| 1 Room | 0 (0.0%) | 41 (2.1%) |
| 2 or 3 Rooms | 163 (5.0%) | 241 (12.4%) |
| 4 or 5 Rooms | 1,115 (34.0%) | 1,163 (60.1%) |
| 6 or 7 Rooms | 1,588 (48.4%) | 328 (17.0%) |
| 8 or more Rooms | 417 (12.7%) | 162 (8.4%) |
| Total | 3,283 (100.0%) | 1,935 (100.0%) |
Housing Structure by Heating Type in Woodward
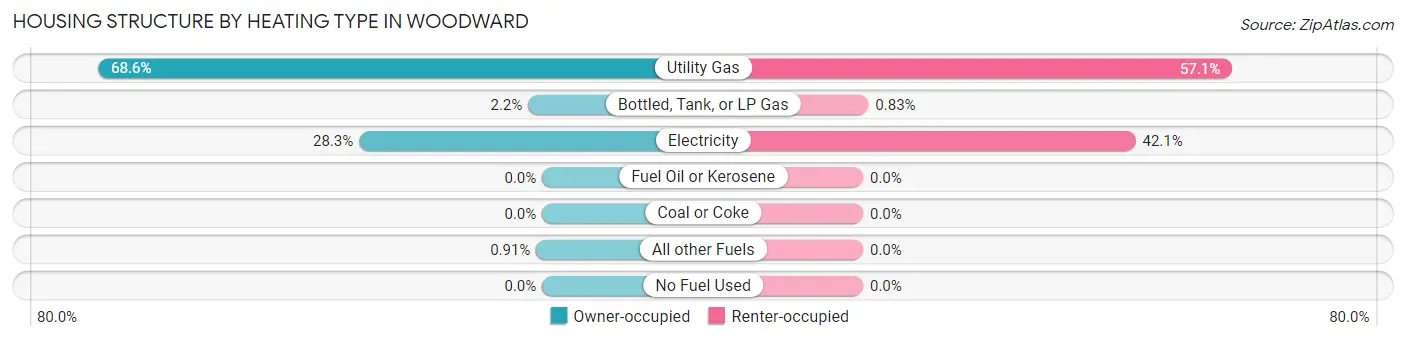
| Heating Type | Owner-occupied | Renter-occupied |
| Utility Gas | 2,253 (68.6%) | 1,104 (57.1%) |
| Bottled, Tank, or LP Gas | 71 (2.2%) | 16 (0.8%) |
| Electricity | 929 (28.3%) | 815 (42.1%) |
| Fuel Oil or Kerosene | 0 (0.0%) | 0 (0.0%) |
| Coal or Coke | 0 (0.0%) | 0 (0.0%) |
| All other Fuels | 30 (0.9%) | 0 (0.0%) |
| No Fuel Used | 0 (0.0%) | 0 (0.0%) |
| Total | 3,283 (100.0%) | 1,935 (100.0%) |
Household Vehicle Usage in Woodward
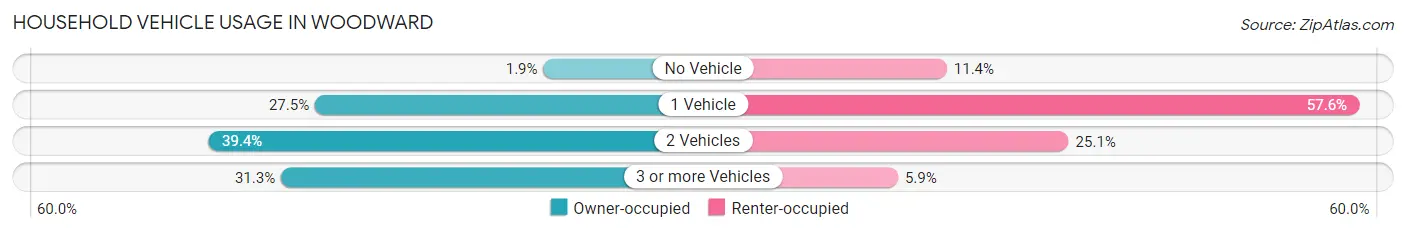
| Vehicles per Household | Owner-occupied | Renter-occupied |
| No Vehicle | 62 (1.9%) | 221 (11.4%) |
| 1 Vehicle | 902 (27.5%) | 1,114 (57.6%) |
| 2 Vehicles | 1,292 (39.4%) | 485 (25.1%) |
| 3 or more Vehicles | 1,027 (31.3%) | 115 (5.9%) |
| Total | 3,283 (100.0%) | 1,935 (100.0%) |
Real Estate & Mortgages in Woodward
Real Estate and Mortgage Overview in Woodward
| Characteristic | Without Mortgage | With Mortgage |
| Housing Units | 1,673 | 1,610 |
| Median Property Value | $145,600 | $146,200 |
| Median Household Income | $56,662 | $244 |
| Monthly Housing Costs | $432 | $18 |
| Real Estate Taxes | $590 | $34 |
Property Value by Mortgage Status in Woodward
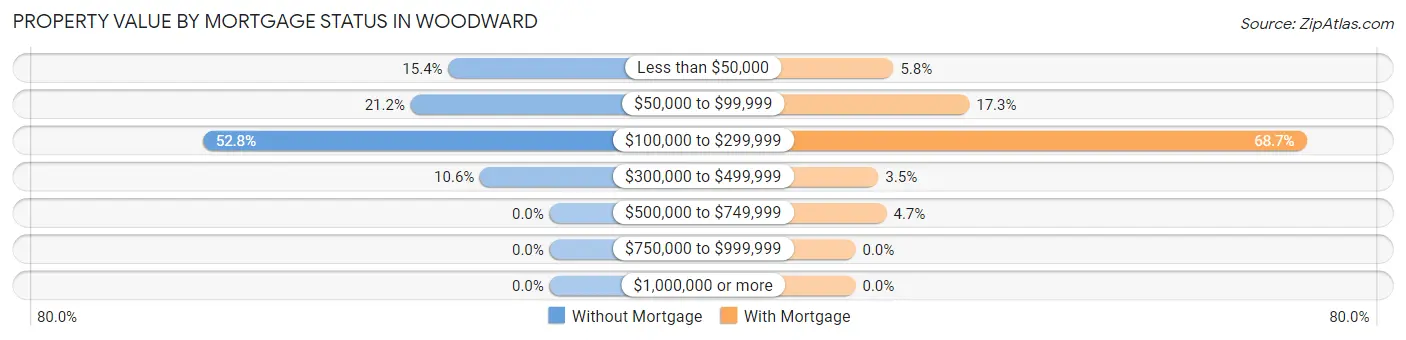
| Property Value | Without Mortgage | With Mortgage |
| Less than $50,000 | 258 (15.4%) | 93 (5.8%) |
| $50,000 to $99,999 | 354 (21.2%) | 279 (17.3%) |
| $100,000 to $299,999 | 884 (52.8%) | 1,106 (68.7%) |
| $300,000 to $499,999 | 177 (10.6%) | 56 (3.5%) |
| $500,000 to $749,999 | 0 (0.0%) | 76 (4.7%) |
| $750,000 to $999,999 | 0 (0.0%) | 0 (0.0%) |
| $1,000,000 or more | 0 (0.0%) | 0 (0.0%) |
| Total | 1,673 (100.0%) | 1,610 (100.0%) |
Household Income by Mortgage Status in Woodward
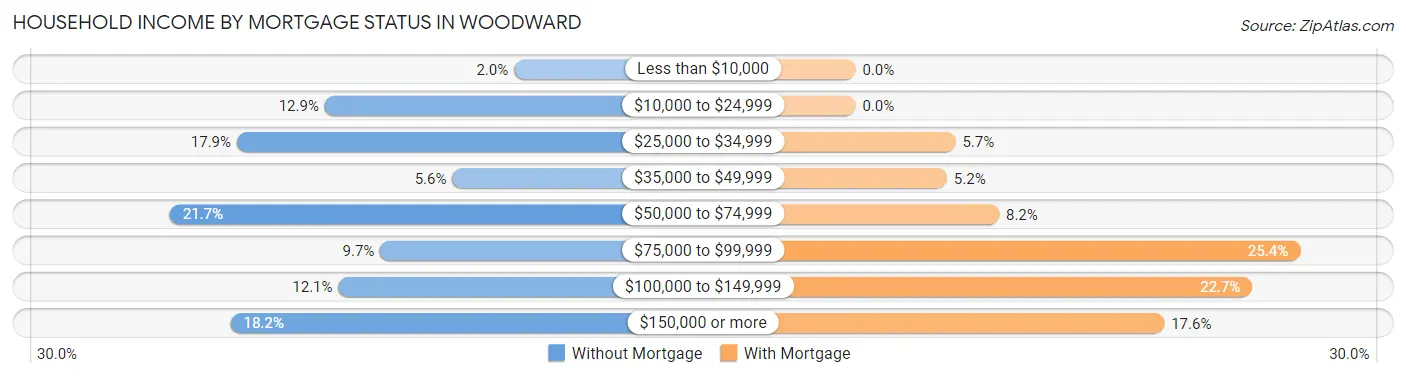
| Household Income | Without Mortgage | With Mortgage |
| Less than $10,000 | 34 (2.0%) | 0 (0.0%) |
| $10,000 to $24,999 | 215 (12.9%) | 0 (0.0%) |
| $25,000 to $34,999 | 299 (17.9%) | 92 (5.7%) |
| $35,000 to $49,999 | 93 (5.6%) | 84 (5.2%) |
| $50,000 to $74,999 | 363 (21.7%) | 132 (8.2%) |
| $75,000 to $99,999 | 162 (9.7%) | 409 (25.4%) |
| $100,000 to $149,999 | 202 (12.1%) | 365 (22.7%) |
| $150,000 or more | 305 (18.2%) | 284 (17.6%) |
| Total | 1,673 (100.0%) | 1,610 (100.0%) |
Property Value to Household Income Ratio in Woodward
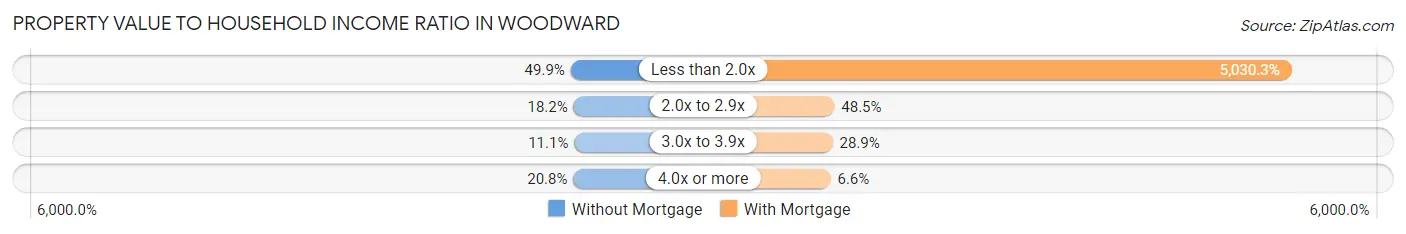
| Value-to-Income Ratio | Without Mortgage | With Mortgage |
| Less than 2.0x | 835 (49.9%) | 80,987 (5,030.3%) |
| 2.0x to 2.9x | 305 (18.2%) | 781 (48.5%) |
| 3.0x to 3.9x | 185 (11.1%) | 466 (28.9%) |
| 4.0x or more | 348 (20.8%) | 106 (6.6%) |
| Total | 1,673 (100.0%) | 1,610 (100.0%) |
Real Estate Taxes by Mortgage Status in Woodward
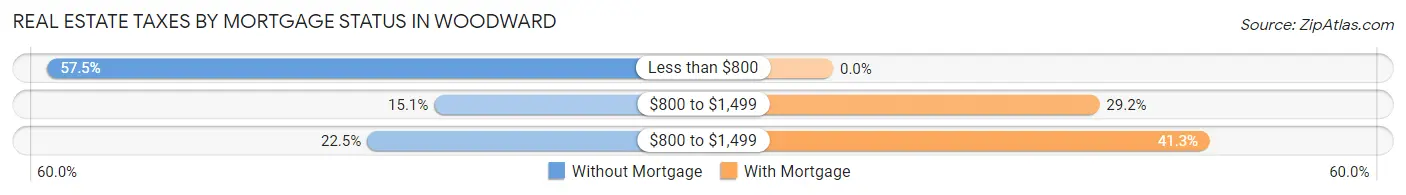
| Property Taxes | Without Mortgage | With Mortgage |
| Less than $800 | 962 (57.5%) | 0 (0.0%) |
| $800 to $1,499 | 253 (15.1%) | 470 (29.2%) |
| $800 to $1,499 | 376 (22.5%) | 665 (41.3%) |
| Total | 1,673 (100.0%) | 1,610 (100.0%) |
Health & Disability in Woodward
Health Insurance Coverage by Age in Woodward
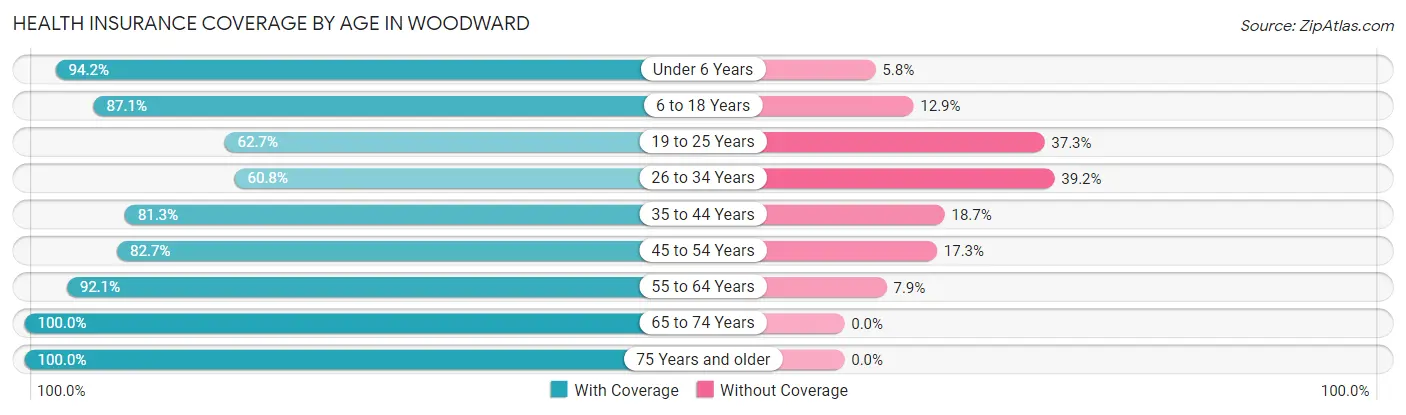
| Age Bracket | With Coverage | Without Coverage |
| Under 6 Years | 1,055 (94.2%) | 65 (5.8%) |
| 6 to 18 Years | 1,786 (87.1%) | 264 (12.9%) |
| 19 to 25 Years | 741 (62.7%) | 441 (37.3%) |
| 26 to 34 Years | 966 (60.8%) | 622 (39.2%) |
| 35 to 44 Years | 1,252 (81.3%) | 288 (18.7%) |
| 45 to 54 Years | 791 (82.7%) | 165 (17.3%) |
| 55 to 64 Years | 1,310 (92.1%) | 112 (7.9%) |
| 65 to 74 Years | 978 (100.0%) | 0 (0.0%) |
| 75 Years and older | 1,024 (100.0%) | 0 (0.0%) |
| Total | 9,903 (83.5%) | 1,957 (16.5%) |
Health Insurance Coverage by Citizenship Status in Woodward
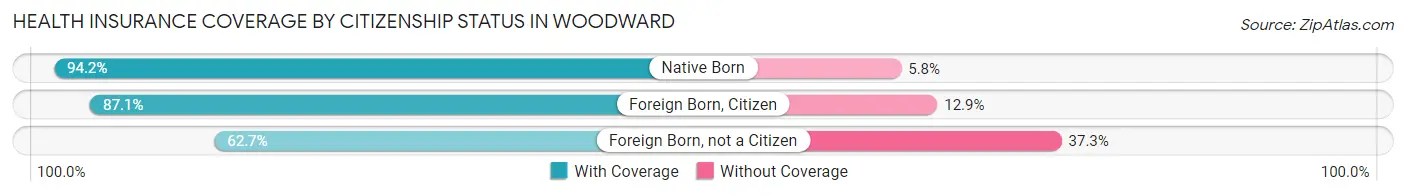
| Citizenship Status | With Coverage | Without Coverage |
| Native Born | 1,055 (94.2%) | 65 (5.8%) |
| Foreign Born, Citizen | 1,786 (87.1%) | 264 (12.9%) |
| Foreign Born, not a Citizen | 741 (62.7%) | 441 (37.3%) |
Health Insurance Coverage by Household Income in Woodward
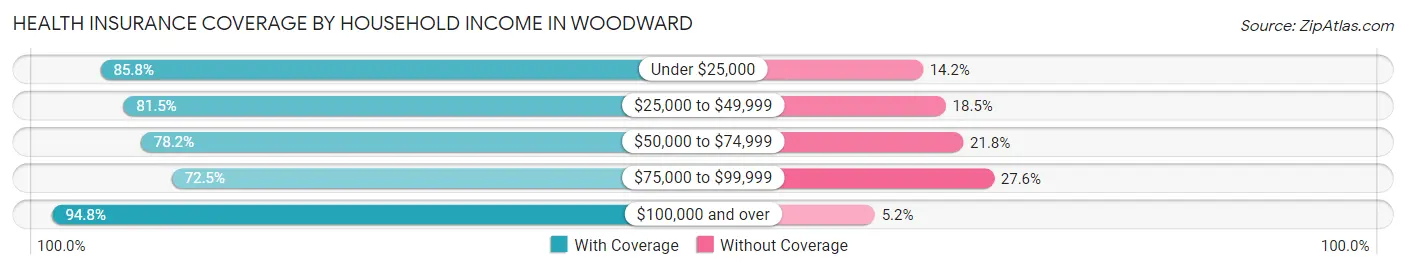
| Household Income | With Coverage | Without Coverage |
| Under $25,000 | 1,418 (85.8%) | 235 (14.2%) |
| $25,000 to $49,999 | 2,230 (81.5%) | 507 (18.5%) |
| $50,000 to $74,999 | 2,287 (78.2%) | 637 (21.8%) |
| $75,000 to $99,999 | 1,123 (72.5%) | 427 (27.6%) |
| $100,000 and over | 2,736 (94.8%) | 151 (5.2%) |
Public vs Private Health Insurance Coverage by Age in Woodward
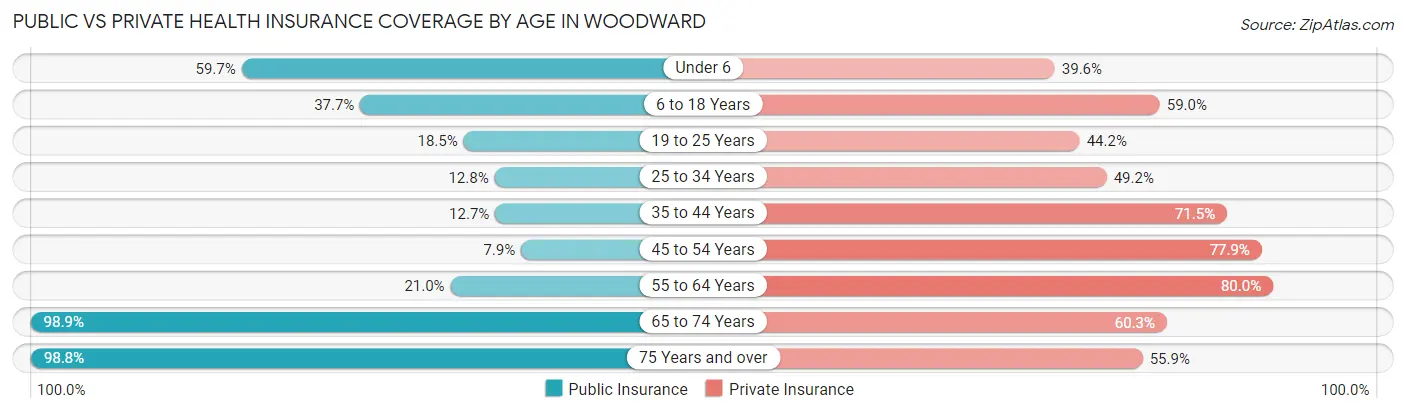
| Age Bracket | Public Insurance | Private Insurance |
| Under 6 | 669 (59.7%) | 443 (39.6%) |
| 6 to 18 Years | 773 (37.7%) | 1,210 (59.0%) |
| 19 to 25 Years | 219 (18.5%) | 522 (44.2%) |
| 25 to 34 Years | 203 (12.8%) | 781 (49.2%) |
| 35 to 44 Years | 195 (12.7%) | 1,101 (71.5%) |
| 45 to 54 Years | 75 (7.9%) | 745 (77.9%) |
| 55 to 64 Years | 298 (21.0%) | 1,138 (80.0%) |
| 65 to 74 Years | 967 (98.9%) | 590 (60.3%) |
| 75 Years and over | 1,012 (98.8%) | 572 (55.9%) |
| Total | 4,411 (37.2%) | 7,102 (59.9%) |
Disability Status by Sex by Age in Woodward
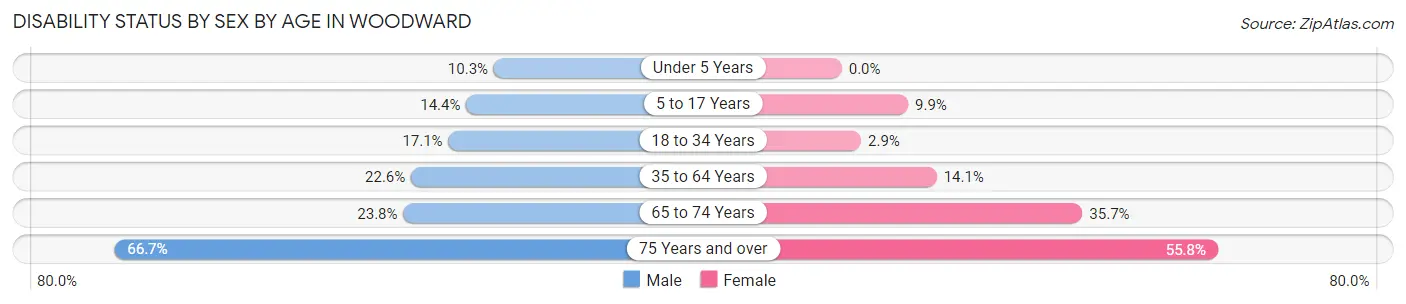
| Age Bracket | Male | Female |
| Under 5 Years | 50 (10.3%) | 0 (0.0%) |
| 5 to 17 Years | 162 (14.4%) | 86 (9.9%) |
| 18 to 34 Years | 251 (17.1%) | 42 (2.9%) |
| 35 to 64 Years | 451 (22.6%) | 271 (14.1%) |
| 65 to 74 Years | 120 (23.8%) | 169 (35.7%) |
| 75 Years and over | 254 (66.7%) | 359 (55.8%) |
Disability Class by Sex by Age in Woodward
Disability Class: Hearing Difficulty
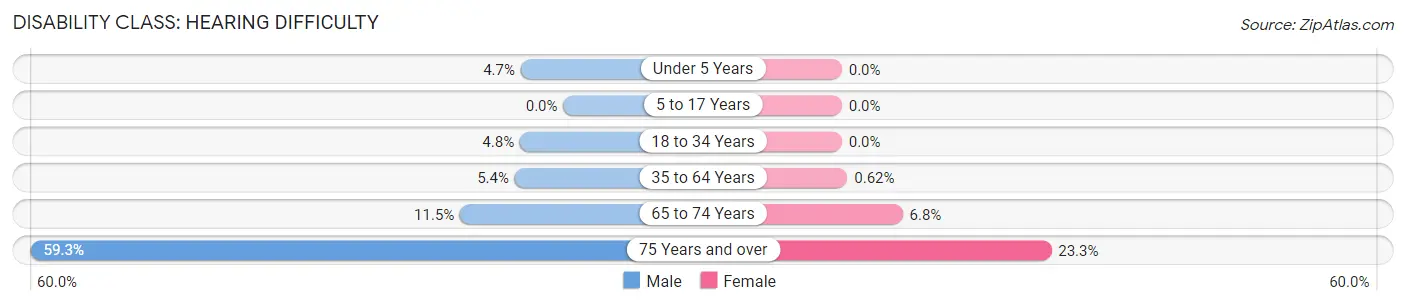
| Age Bracket | Male | Female |
| Under 5 Years | 23 (4.7%) | 0 (0.0%) |
| 5 to 17 Years | 0 (0.0%) | 0 (0.0%) |
| 18 to 34 Years | 71 (4.8%) | 0 (0.0%) |
| 35 to 64 Years | 108 (5.4%) | 12 (0.6%) |
| 65 to 74 Years | 58 (11.5%) | 32 (6.8%) |
| 75 Years and over | 226 (59.3%) | 150 (23.3%) |
Disability Class: Vision Difficulty
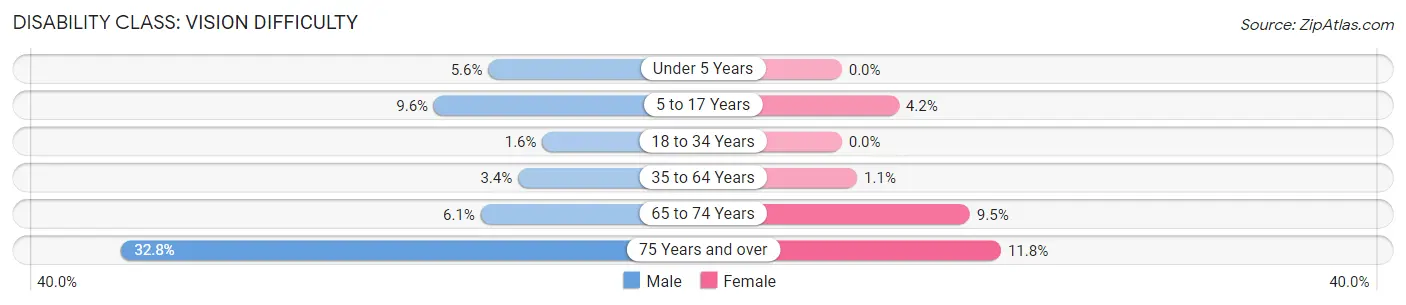
| Age Bracket | Male | Female |
| Under 5 Years | 27 (5.6%) | 0 (0.0%) |
| 5 to 17 Years | 108 (9.6%) | 37 (4.2%) |
| 18 to 34 Years | 23 (1.6%) | 0 (0.0%) |
| 35 to 64 Years | 67 (3.4%) | 22 (1.1%) |
| 65 to 74 Years | 31 (6.1%) | 45 (9.5%) |
| 75 Years and over | 125 (32.8%) | 76 (11.8%) |
Disability Class: Cognitive Difficulty
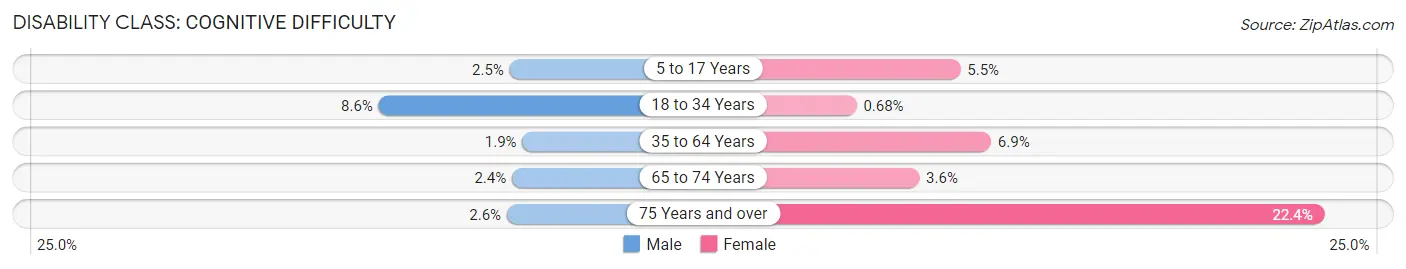
| Age Bracket | Male | Female |
| 5 to 17 Years | 28 (2.5%) | 48 (5.5%) |
| 18 to 34 Years | 126 (8.6%) | 10 (0.7%) |
| 35 to 64 Years | 38 (1.9%) | 133 (6.9%) |
| 65 to 74 Years | 12 (2.4%) | 17 (3.6%) |
| 75 Years and over | 10 (2.6%) | 144 (22.4%) |
Disability Class: Ambulatory Difficulty
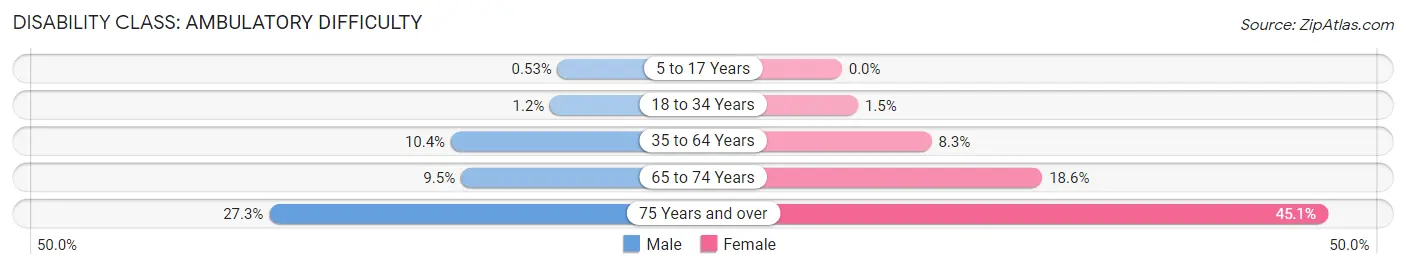
| Age Bracket | Male | Female |
| 5 to 17 Years | 6 (0.5%) | 0 (0.0%) |
| 18 to 34 Years | 18 (1.2%) | 22 (1.5%) |
| 35 to 64 Years | 208 (10.4%) | 160 (8.3%) |
| 65 to 74 Years | 48 (9.5%) | 88 (18.6%) |
| 75 Years and over | 104 (27.3%) | 290 (45.1%) |
Disability Class: Self-Care Difficulty
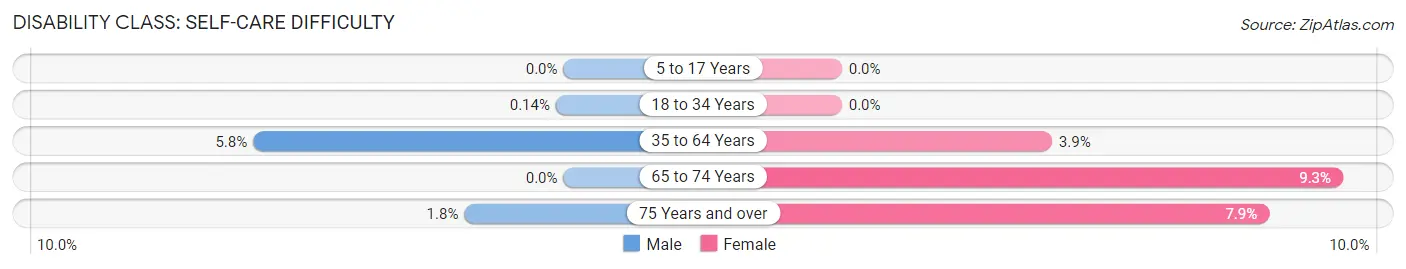
| Age Bracket | Male | Female |
| 5 to 17 Years | 0 (0.0%) | 0 (0.0%) |
| 18 to 34 Years | 2 (0.1%) | 0 (0.0%) |
| 35 to 64 Years | 115 (5.8%) | 75 (3.9%) |
| 65 to 74 Years | 0 (0.0%) | 44 (9.3%) |
| 75 Years and over | 7 (1.8%) | 51 (7.9%) |
Technology Access in Woodward
Computing Device Access in Woodward
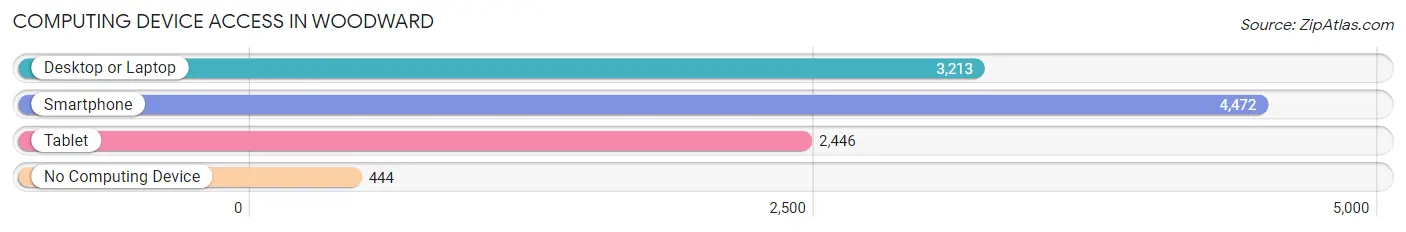
| Device Type | # Households | % Households |
| Desktop or Laptop | 3,213 | 61.6% |
| Smartphone | 4,472 | 85.7% |
| Tablet | 2,446 | 46.9% |
| No Computing Device | 444 | 8.5% |
| Total | 5,218 | 100.0% |
Internet Access in Woodward
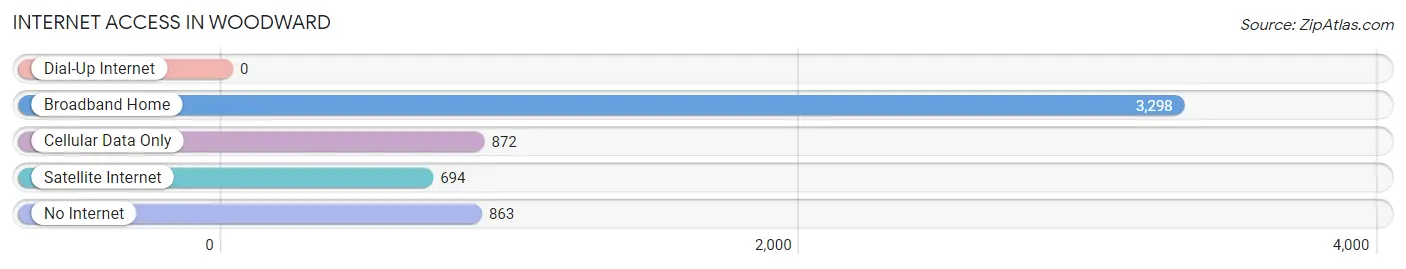
| Internet Type | # Households | % Households |
| Dial-Up Internet | 0 | 0.0% |
| Broadband Home | 3,298 | 63.2% |
| Cellular Data Only | 872 | 16.7% |
| Satellite Internet | 694 | 13.3% |
| No Internet | 863 | 16.5% |
| Total | 5,218 | 100.0% |
Woodward Summary
Woodward, Oklahoma is a city located in the northwestern part of the state, in Woodward County. It is the county seat and the largest city in the county. The city is situated along the banks of the North Canadian River, and is located at the intersection of U.S. Highways 270 and 412. The city is approximately 130 miles northwest of Oklahoma City and is part of the Oklahoma Panhandle region.
History
Woodward was founded in 1887, when the Santa Fe Railroad was extended to the area. The city was named after the railroad's president, Benjamin Woodward. The city was incorporated in 1893, and by 1900, the population had grown to 1,845.
In the early 1900s, Woodward was a major cattle shipping center, and the city was home to several large stockyards. The city also had a large number of saloons and gambling halls, which attracted cowboys and other travelers.
In the 1920s, the city experienced a period of growth and prosperity. The city was home to several large businesses, including a flour mill, a cotton gin, a brick plant, and a lumber mill. The city also had a number of banks, hotels, and other businesses.
In the 1930s, the Great Depression hit Woodward hard. Many businesses closed, and the population declined. The city was able to recover in the 1940s, when the oil industry began to boom in the area. The city was home to several oil companies, and the population began to grow again.
Geography
Woodward is located in the northwestern part of Oklahoma, in Woodward County. The city is situated along the banks of the North Canadian River, and is located at the intersection of U.S. Highways 270 and 412. The city is approximately 130 miles northwest of Oklahoma City and is part of the Oklahoma Panhandle region.
The city has a total area of 8.3 square miles, of which 8.2 square miles is land and 0.1 square miles is water. The city is located in a semi-arid climate, with hot summers and cold winters.
Economy
Woodward is the economic center of Woodward County. The city is home to several large businesses, including a flour mill, a cotton gin, a brick plant, and a lumber mill. The city also has a number of banks, hotels, and other businesses.
The city is also home to several oil companies, and the oil industry is a major part of the local economy. The city is also home to several manufacturing companies, including a furniture factory, a plastics factory, and a metal fabrication plant.
The city is also home to several retail stores, including a Walmart Supercenter, a Lowe's Home Improvement store, and a number of other stores. The city also has a number of restaurants, bars, and other entertainment venues.
Demographics
As of the 2010 census, the population of Woodward was 12,051. The racial makeup of the city was 87.3% White, 0.7% African American, 0.9% Native American, 0.4% Asian, 0.1% Pacific Islander, 8.2% from other races, and 2.4% from two or more races. Hispanic or Latino of any race were 15.2% of the population.
The median income for a household in the city was $37,945, and the median income for a family was $45,945. The per capita income for the city was $19,945. About 14.3% of families and 17.7% of the population were below the poverty line, including 25.3% of those under age 18 and 11.2% of those age 65 or over.
Common Questions
What is Per Capita Income in Woodward?
Per Capita income in Woodward is $32,191.
What is the Median Family Income in Woodward?
Median Family Income in Woodward is $59,850.
What is the Median Household income in Woodward?
Median Household Income in Woodward is $54,864.
What is Income or Wage Gap in Woodward?
Income or Wage Gap in Woodward is 35.7%.
Women in Woodward earn 64.3 cents for every dollar earned by a man.
What is Inequality or Gini Index in Woodward?
Inequality or Gini Index in Woodward is 0.45.
What is the Total Population of Woodward?
Total Population of Woodward is 12,067.
What is the Total Male Population of Woodward?
Total Male Population of Woodward is 6,085.
What is the Total Female Population of Woodward?
Total Female Population of Woodward is 5,982.
What is the Ratio of Males per 100 Females in Woodward?
There are 101.72 Males per 100 Females in Woodward.
What is the Ratio of Females per 100 Males in Woodward?
There are 98.31 Females per 100 Males in Woodward.
What is the Median Population Age in Woodward?
Median Population Age in Woodward is 35.1 Years.
What is the Average Family Size in Woodward
Average Family Size in Woodward is 2.9 People.
What is the Average Household Size in Woodward
Average Household Size in Woodward is 2.2 People.
How Large is the Labor Force in Woodward?
There are 6,178 People in the Labor Forcein in Woodward.
What is the Percentage of People in the Labor Force in Woodward?
65.1% of People are in the Labor Force in Woodward.
What is the Unemployment Rate in Woodward?
Unemployment Rate in Woodward is 6.3%.