Pawhuska, OK Map & Demographics
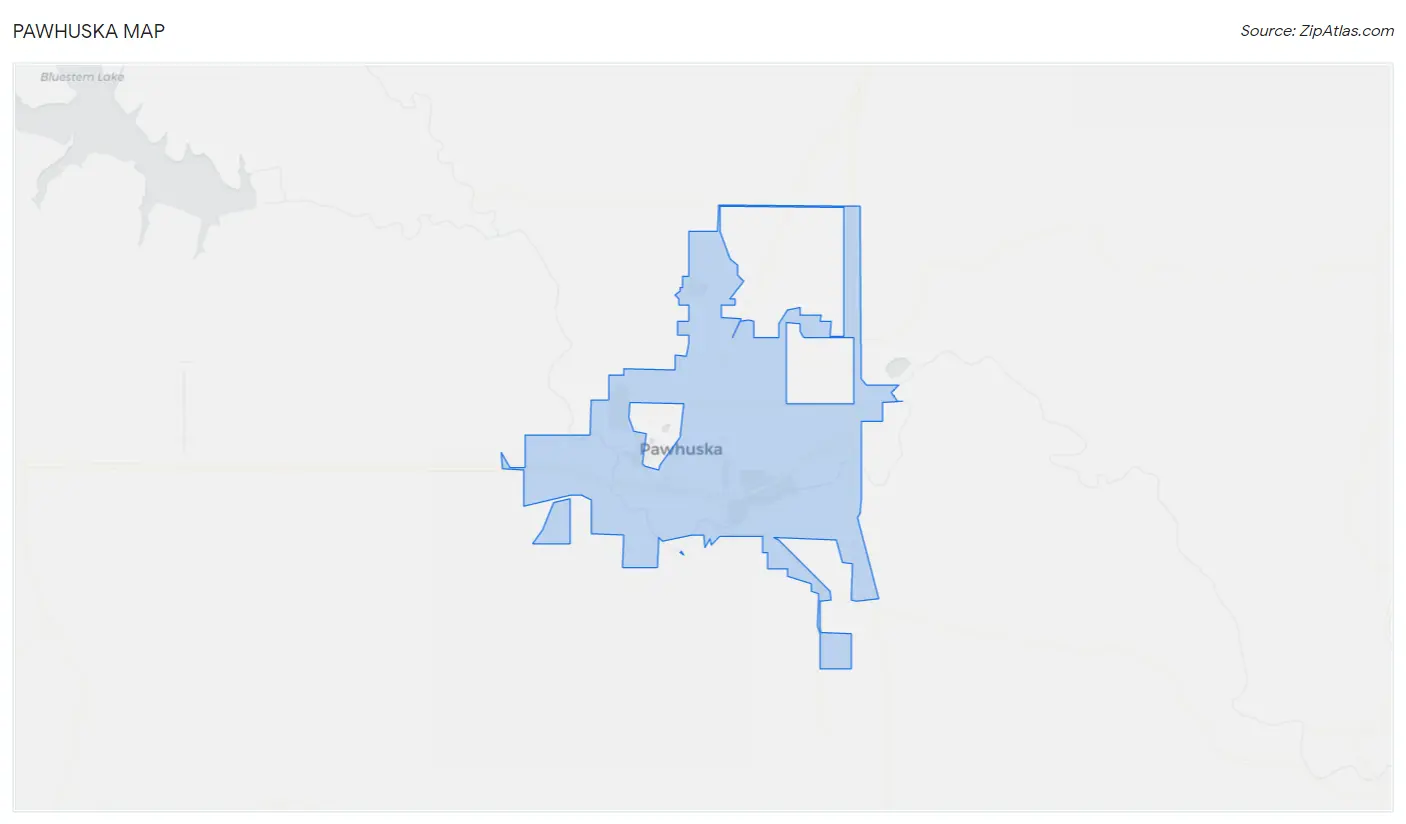
Pawhuska Map
Pawhuska Overview
$24,792
PER CAPITA INCOME
$61,350
AVG FAMILY INCOME
$45,833
AVG HOUSEHOLD INCOME
15.7%
WAGE / INCOME GAP [ % ]
84.3¢/ $1
WAGE / INCOME GAP [ $ ]
0.41
INEQUALITY / GINI INDEX
3,009
TOTAL POPULATION
1,484
MALE POPULATION
1,525
FEMALE POPULATION
97.31
MALES / 100 FEMALES
102.76
FEMALES / 100 MALES
43.9
MEDIAN AGE
3.2
AVG FAMILY SIZE
2.3
AVG HOUSEHOLD SIZE
1,420
LABOR FORCE [ PEOPLE ]
55.5%
PERCENT IN LABOR FORCE
2.7%
UNEMPLOYMENT RATE
Pawhuska Zip Codes
Pawhuska Area Codes
Income in Pawhuska
Income Overview in Pawhuska
Per Capita Income in Pawhuska is $24,792, while median incomes of families and households are $61,350 and $45,833 respectively.
| Characteristic | Number | Measure |
| Per Capita Income | 3,009 | $24,792 |
| Median Family Income | 692 | $61,350 |
| Mean Family Income | 692 | $72,530 |
| Median Household Income | 1,234 | $45,833 |
| Mean Household Income | 1,234 | $58,142 |
| Income Deficit | 692 | $0 |
| Wage / Income Gap (%) | 3,009 | 15.65% |
| Wage / Income Gap ($) | 3,009 | 84.35¢ per $1 |
| Gini / Inequality Index | 3,009 | 0.41 |
Earnings by Sex in Pawhuska
Average Earnings in Pawhuska are $32,051, $33,975 for men and $28,657 for women, a difference of 15.7%.
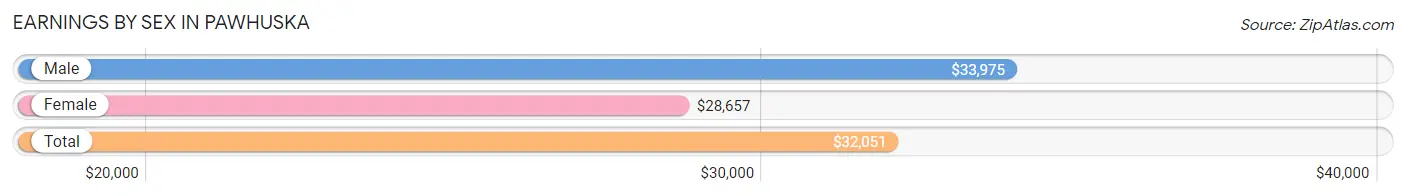
| Sex | Number | Average Earnings |
| Male | 751 (51.1%) | $33,975 |
| Female | 719 (48.9%) | $28,657 |
| Total | 1,470 (100.0%) | $32,051 |
Earnings by Sex by Income Bracket in Pawhuska
The most common earnings brackets in Pawhuska are $35,000 to $39,999 for men (98 | 13.1%) and $12,500 to $14,999 for women (73 | 10.2%).
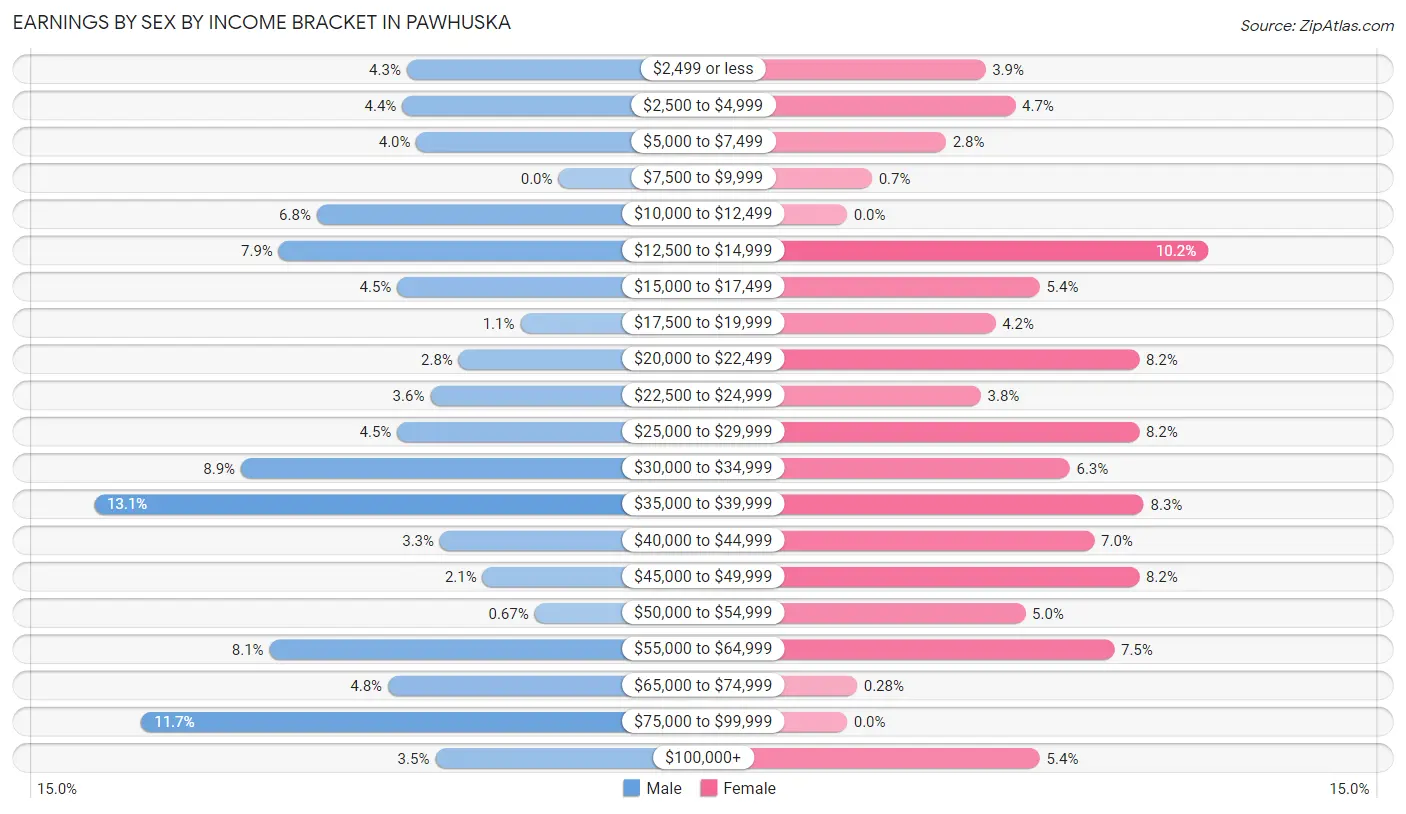
| Income | Male | Female |
| $2,499 or less | 32 (4.3%) | 28 (3.9%) |
| $2,500 to $4,999 | 33 (4.4%) | 34 (4.7%) |
| $5,000 to $7,499 | 30 (4.0%) | 20 (2.8%) |
| $7,500 to $9,999 | 0 (0.0%) | 5 (0.7%) |
| $10,000 to $12,499 | 51 (6.8%) | 0 (0.0%) |
| $12,500 to $14,999 | 59 (7.9%) | 73 (10.2%) |
| $15,000 to $17,499 | 34 (4.5%) | 39 (5.4%) |
| $17,500 to $19,999 | 8 (1.1%) | 30 (4.2%) |
| $20,000 to $22,499 | 21 (2.8%) | 59 (8.2%) |
| $22,500 to $24,999 | 27 (3.6%) | 27 (3.8%) |
| $25,000 to $29,999 | 34 (4.5%) | 59 (8.2%) |
| $30,000 to $34,999 | 67 (8.9%) | 45 (6.3%) |
| $35,000 to $39,999 | 98 (13.1%) | 60 (8.3%) |
| $40,000 to $44,999 | 25 (3.3%) | 50 (7.0%) |
| $45,000 to $49,999 | 16 (2.1%) | 59 (8.2%) |
| $50,000 to $54,999 | 5 (0.7%) | 36 (5.0%) |
| $55,000 to $64,999 | 61 (8.1%) | 54 (7.5%) |
| $65,000 to $74,999 | 36 (4.8%) | 2 (0.3%) |
| $75,000 to $99,999 | 88 (11.7%) | 0 (0.0%) |
| $100,000+ | 26 (3.5%) | 39 (5.4%) |
| Total | 751 (100.0%) | 719 (100.0%) |
Earnings by Sex by Educational Attainment in Pawhuska
Average earnings in Pawhuska are $35,972 for men and $34,348 for women, a difference of 4.5%. Men with an educational attainment of bachelor's degree enjoy the highest average annual earnings of $80,450, while those with high school diploma education earn the least with $28,063. Women with an educational attainment of graduate degree earn the most with the average annual earnings of $51,771, while those with high school diploma education have the smallest earnings of $26,500.
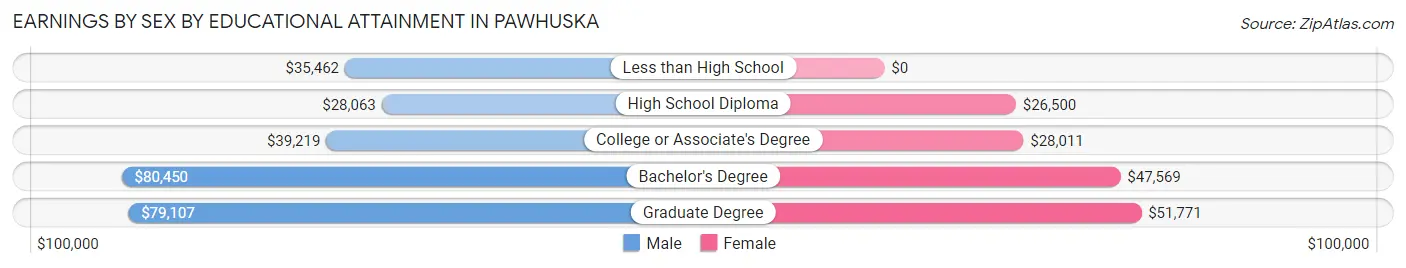
| Educational Attainment | Male Income | Female Income |
| Less than High School | $35,462 | $0 |
| High School Diploma | $28,063 | $26,500 |
| College or Associate's Degree | $39,219 | $28,011 |
| Bachelor's Degree | $80,450 | $47,569 |
| Graduate Degree | $79,107 | $51,771 |
| Total | $35,972 | $34,348 |
Family Income in Pawhuska
Family Income Brackets in Pawhuska
According to the Pawhuska family income data, there are 182 families falling into the $50,000 to $74,999 income range, which is the most common income bracket and makes up 26.3% of all families. Conversely, the $10,000 to $14,999 income bracket is the least frequent group with only 6 families (0.9%) belonging to this category.
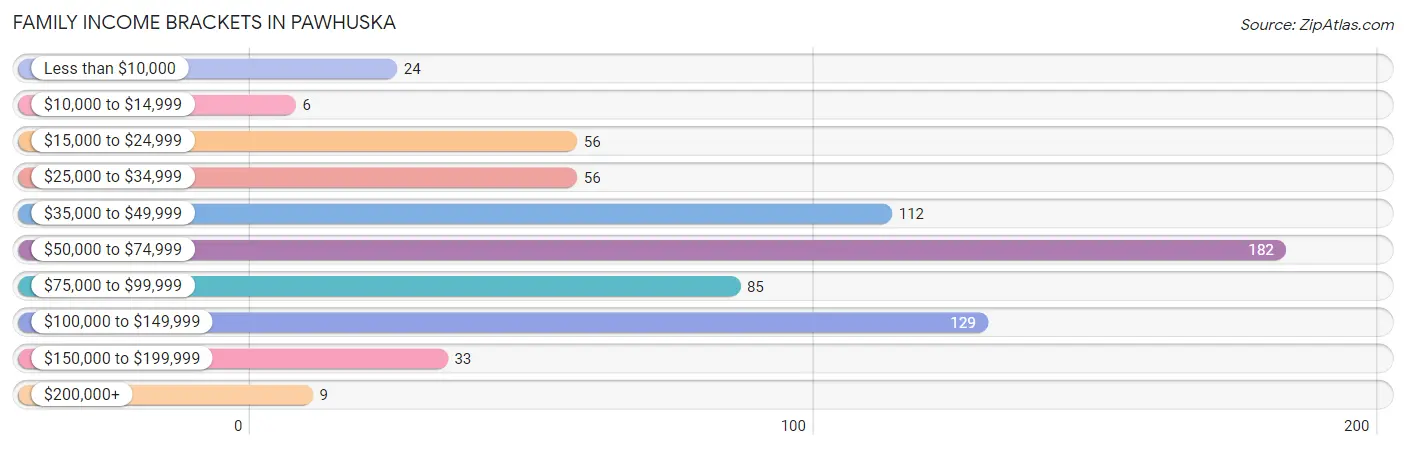
| Income Bracket | # Families | % Families |
| Less than $10,000 | 24 | 3.5% |
| $10,000 to $14,999 | 6 | 0.9% |
| $15,000 to $24,999 | 56 | 8.1% |
| $25,000 to $34,999 | 56 | 8.1% |
| $35,000 to $49,999 | 112 | 16.2% |
| $50,000 to $74,999 | 182 | 26.3% |
| $75,000 to $99,999 | 85 | 12.3% |
| $100,000 to $149,999 | 129 | 18.6% |
| $150,000 to $199,999 | 33 | 4.8% |
| $200,000+ | 9 | 1.3% |
Family Income by Famaliy Size in Pawhuska
3-person families (157 | 22.7%) account for the highest median family income in Pawhuska with $75,096 per family, while 2-person families (340 | 49.1%) have the highest median income of $27,361 per family member.
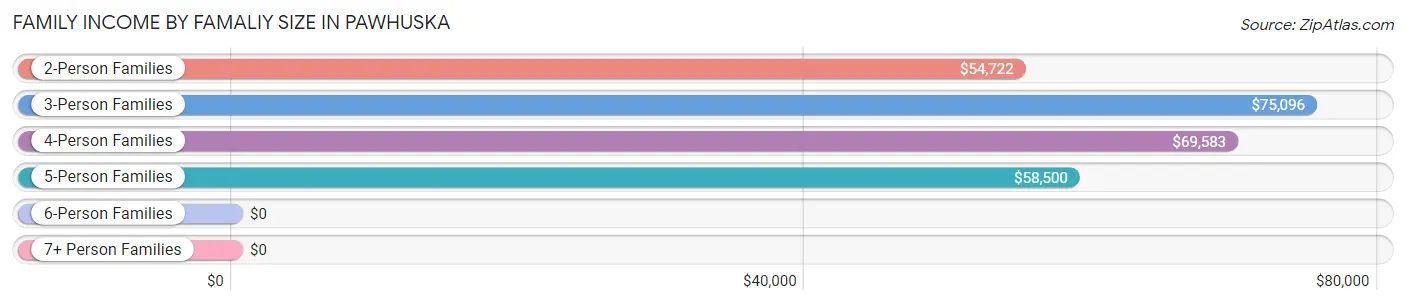
| Income Bracket | # Families | Median Income |
| 2-Person Families | 340 (49.1%) | $54,722 |
| 3-Person Families | 157 (22.7%) | $75,096 |
| 4-Person Families | 136 (19.7%) | $69,583 |
| 5-Person Families | 34 (4.9%) | $58,500 |
| 6-Person Families | 0 (0.0%) | $0 |
| 7+ Person Families | 25 (3.6%) | $0 |
| Total | 692 (100.0%) | $61,350 |
Family Income by Number of Earners in Pawhuska
The median family income in Pawhuska is $61,350, with families comprising 2 earners (301) having the highest median family income of $77,019, while families with no earners (101) have the lowest median family income of $20,885, accounting for 43.5% and 14.6% of families, respectively.
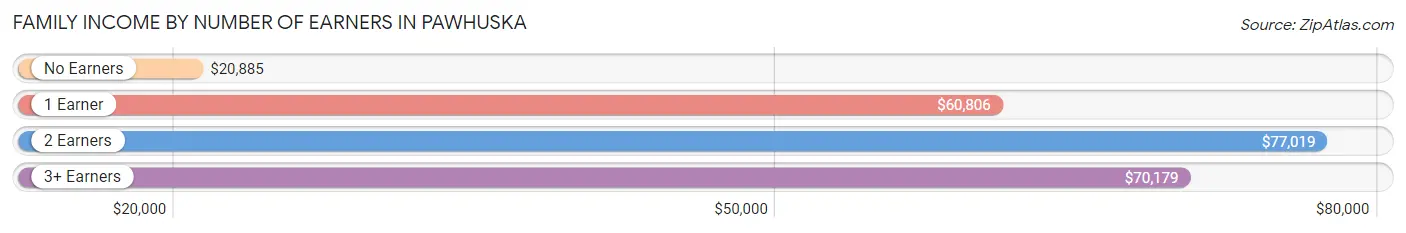
| Number of Earners | # Families | Median Income |
| No Earners | 101 (14.6%) | $20,885 |
| 1 Earner | 227 (32.8%) | $60,806 |
| 2 Earners | 301 (43.5%) | $77,019 |
| 3+ Earners | 63 (9.1%) | $70,179 |
| Total | 692 (100.0%) | $61,350 |
Household Income in Pawhuska
Household Income Brackets in Pawhuska
With 258 households falling in the category, the $50,000 to $74,999 income range is the most frequent in Pawhuska, accounting for 20.9% of all households. In contrast, only 9 households (0.7%) fall into the $200,000+ income bracket, making it the least populous group.
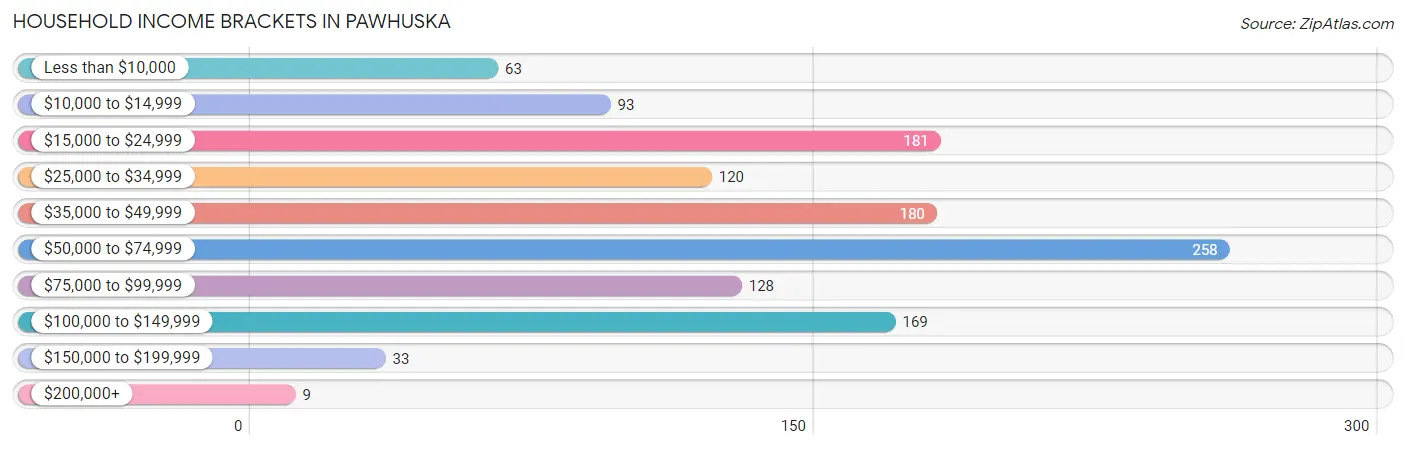
| Income Bracket | # Households | % Households |
| Less than $10,000 | 63 | 5.1% |
| $10,000 to $14,999 | 93 | 7.5% |
| $15,000 to $24,999 | 181 | 14.7% |
| $25,000 to $34,999 | 120 | 9.7% |
| $35,000 to $49,999 | 180 | 14.6% |
| $50,000 to $74,999 | 258 | 20.9% |
| $75,000 to $99,999 | 128 | 10.4% |
| $100,000 to $149,999 | 169 | 13.7% |
| $150,000 to $199,999 | 33 | 2.7% |
| $200,000+ | 9 | 0.7% |
Household Income by Householder Age in Pawhuska
The median household income in Pawhuska is $45,833, with the highest median household income of $58,628 found in the 45 to 64 years age bracket for the primary householder. A total of 425 households (34.4%) fall into this category. Meanwhile, the 15 to 24 years age bracket for the primary householder has the lowest median household income of $0, with 50 households (4.1%) in this group.
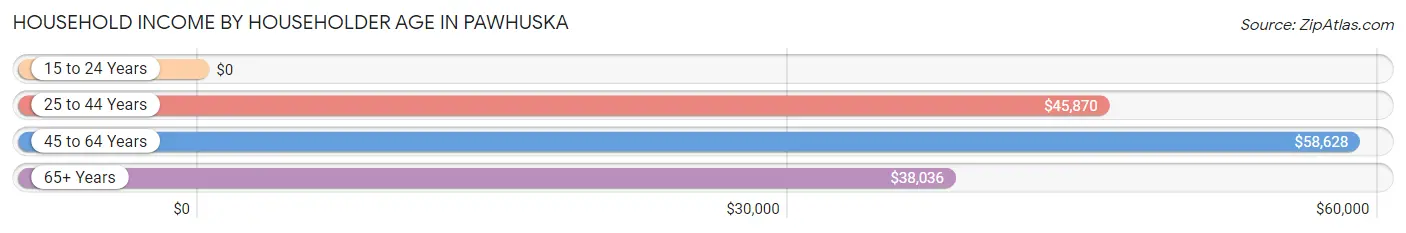
| Income Bracket | # Households | Median Income |
| 15 to 24 Years | 50 (4.1%) | $0 |
| 25 to 44 Years | 362 (29.3%) | $45,870 |
| 45 to 64 Years | 425 (34.4%) | $58,628 |
| 65+ Years | 397 (32.2%) | $38,036 |
| Total | 1,234 (100.0%) | $45,833 |
Poverty in Pawhuska
Income Below Poverty by Sex and Age in Pawhuska
With 11.6% poverty level for males and 17.4% for females among the residents of Pawhuska, 5 year old males and 15 year old females are the most vulnerable to poverty, with 33 males (100.0%) and 8 females (47.1%) in their respective age groups living below the poverty level.
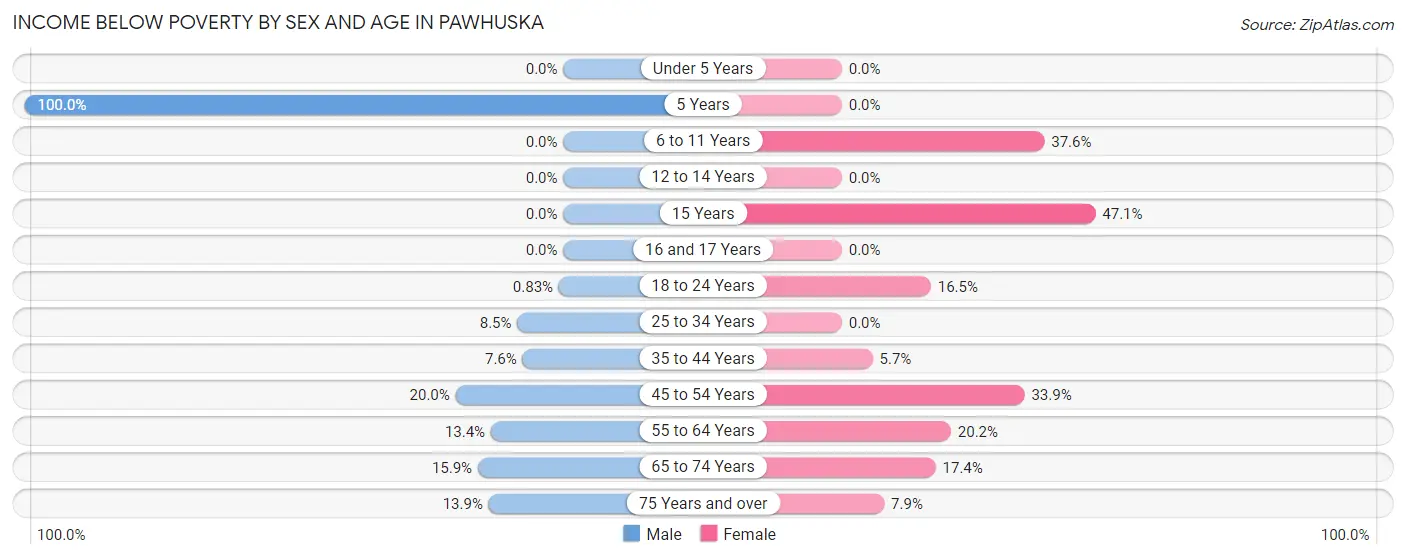
| Age Bracket | Male | Female |
| Under 5 Years | 0 (0.0%) | 0 (0.0%) |
| 5 Years | 33 (100.0%) | 0 (0.0%) |
| 6 to 11 Years | 0 (0.0%) | 50 (37.6%) |
| 12 to 14 Years | 0 (0.0%) | 0 (0.0%) |
| 15 Years | 0 (0.0%) | 8 (47.1%) |
| 16 and 17 Years | 0 (0.0%) | 0 (0.0%) |
| 18 to 24 Years | 1 (0.8%) | 19 (16.5%) |
| 25 to 34 Years | 21 (8.5%) | 0 (0.0%) |
| 35 to 44 Years | 13 (7.6%) | 8 (5.7%) |
| 45 to 54 Years | 39 (20.0%) | 79 (33.9%) |
| 55 to 64 Years | 25 (13.4%) | 50 (20.2%) |
| 65 to 74 Years | 13 (15.9%) | 39 (17.4%) |
| 75 Years and over | 9 (13.9%) | 11 (7.9%) |
| Total | 154 (11.6%) | 264 (17.4%) |
Income Above Poverty by Sex and Age in Pawhuska
According to the poverty statistics in Pawhuska, males aged under 5 years and females aged under 5 years are the age groups that are most secure financially, with 100.0% of males and 100.0% of females in these age groups living above the poverty line.
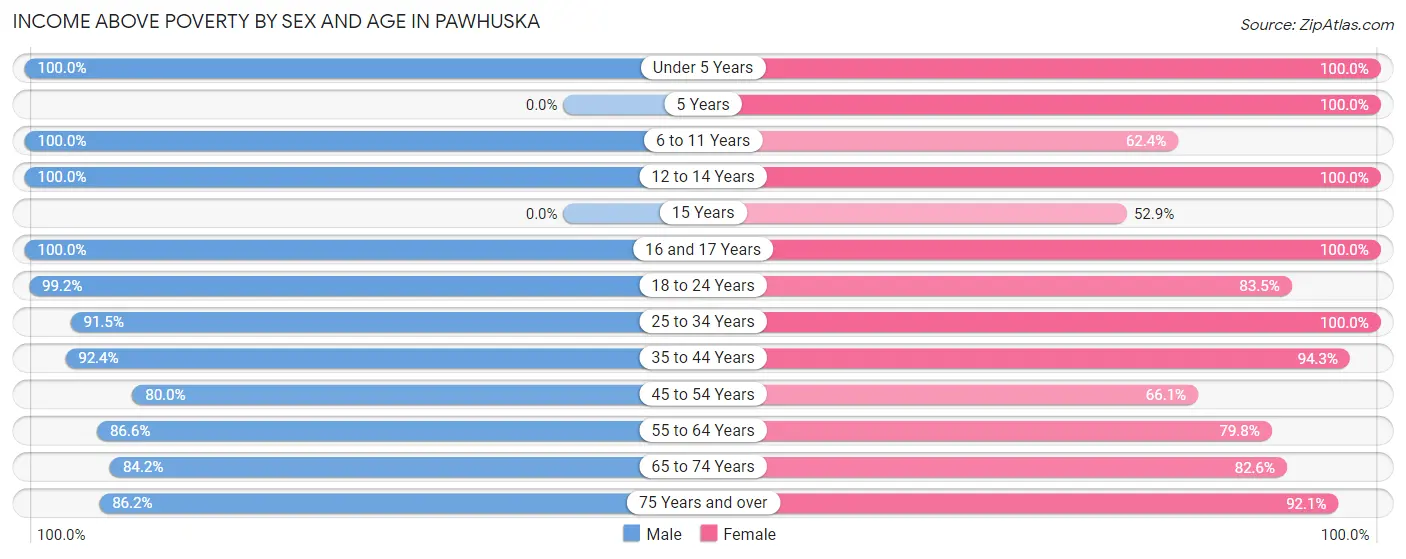
| Age Bracket | Male | Female |
| Under 5 Years | 30 (100.0%) | 39 (100.0%) |
| 5 Years | 0 (0.0%) | 10 (100.0%) |
| 6 to 11 Years | 74 (100.0%) | 83 (62.4%) |
| 12 to 14 Years | 92 (100.0%) | 14 (100.0%) |
| 15 Years | 0 (0.0%) | 9 (52.9%) |
| 16 and 17 Years | 35 (100.0%) | 27 (100.0%) |
| 18 to 24 Years | 120 (99.2%) | 96 (83.5%) |
| 25 to 34 Years | 225 (91.5%) | 177 (100.0%) |
| 35 to 44 Years | 159 (92.4%) | 132 (94.3%) |
| 45 to 54 Years | 156 (80.0%) | 154 (66.1%) |
| 55 to 64 Years | 161 (86.6%) | 197 (79.8%) |
| 65 to 74 Years | 69 (84.2%) | 185 (82.6%) |
| 75 Years and over | 56 (86.2%) | 129 (92.1%) |
| Total | 1,177 (88.4%) | 1,252 (82.6%) |
Income Below Poverty Among Married-Couple Families in Pawhuska
The poverty statistics for married-couple families in Pawhuska show that 5.0% or 28 of the total 558 families live below the poverty line. Families with no children have the highest poverty rate of 7.4%, comprising of 28 families. On the other hand, families with 1 or 2 children have the lowest poverty rate of 0.0%, which includes 0 families.
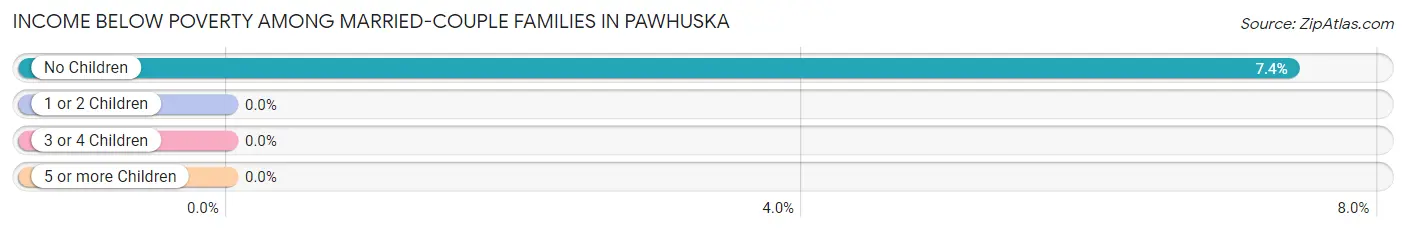
| Children | Above Poverty | Below Poverty |
| No Children | 351 (92.6%) | 28 (7.4%) |
| 1 or 2 Children | 154 (100.0%) | 0 (0.0%) |
| 3 or 4 Children | 0 (0.0%) | 0 (0.0%) |
| 5 or more Children | 25 (100.0%) | 0 (0.0%) |
| Total | 530 (95.0%) | 28 (5.0%) |
Income Below Poverty Among Single-Parent Households in Pawhuska
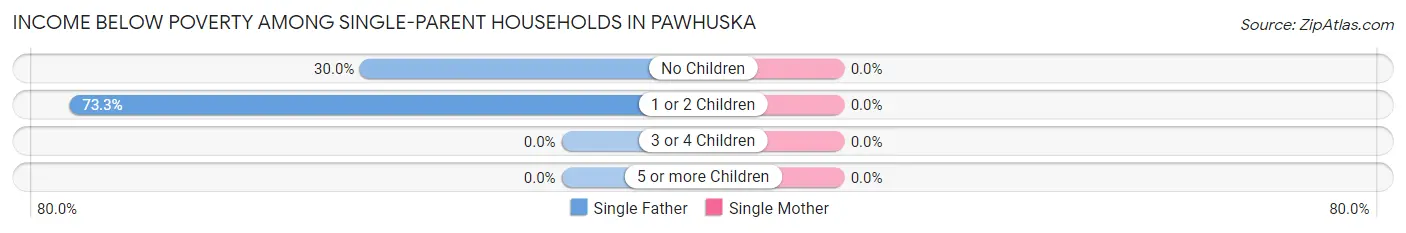
| Children | Single Father | Single Mother |
| No Children | 3 (30.0%) | 0 (0.0%) |
| 1 or 2 Children | 22 (73.3%) | 0 (0.0%) |
| 3 or 4 Children | 0 (0.0%) | 0 (0.0%) |
| 5 or more Children | 0 (0.0%) | 0 (0.0%) |
| Total | 25 (62.5%) | 0 (0.0%) |
Income Below Poverty Among Married-Couple vs Single-Parent Households in Pawhuska
The poverty data for Pawhuska shows that 28 of the married-couple family households (5.0%) and 25 of the single-parent households (18.7%) are living below the poverty level. Within the married-couple family households, those with no children have the highest poverty rate, with 28 households (7.4%) falling below the poverty line. Among the single-parent households, those with 1 or 2 children have the highest poverty rate, with 22 household (41.5%) living below poverty.
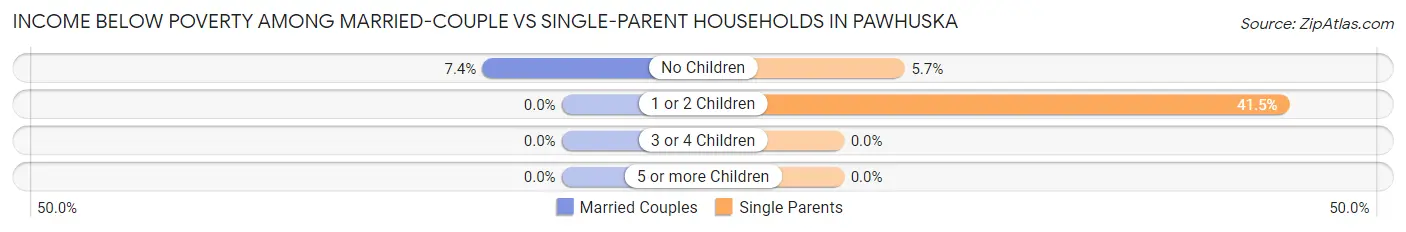
| Children | Married-Couple Families | Single-Parent Households |
| No Children | 28 (7.4%) | 3 (5.7%) |
| 1 or 2 Children | 0 (0.0%) | 22 (41.5%) |
| 3 or 4 Children | 0 (0.0%) | 0 (0.0%) |
| 5 or more Children | 0 (0.0%) | 0 (0.0%) |
| Total | 28 (5.0%) | 25 (18.7%) |
Race in Pawhuska
The most populous races in Pawhuska are White / Caucasian (1,684 | 56.0%), Native / Alaskan (1,004 | 33.4%), and Two or more Races (178 | 5.9%).
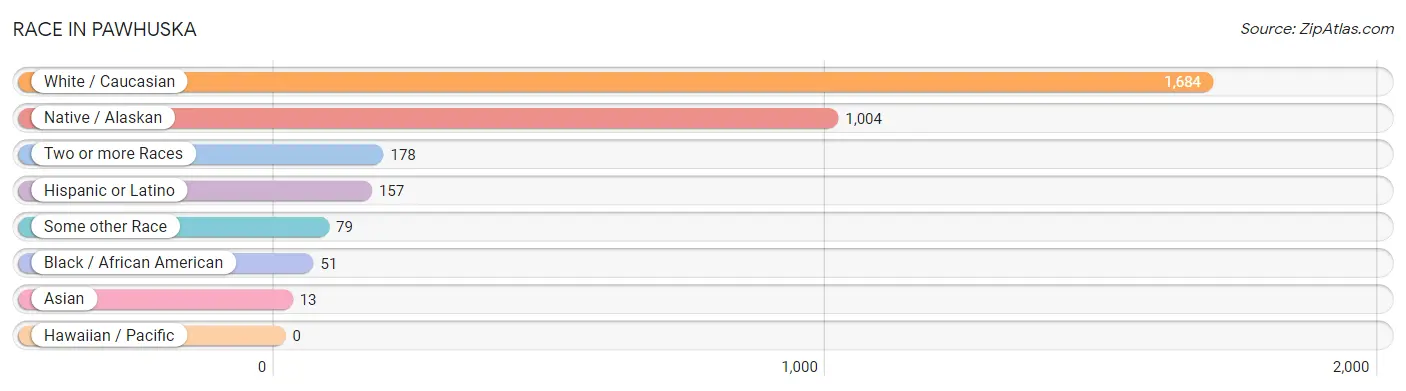
| Race | # Population | % Population |
| Asian | 13 | 0.4% |
| Black / African American | 51 | 1.7% |
| Hawaiian / Pacific | 0 | 0.0% |
| Hispanic or Latino | 157 | 5.2% |
| Native / Alaskan | 1,004 | 33.4% |
| White / Caucasian | 1,684 | 56.0% |
| Two or more Races | 178 | 5.9% |
| Some other Race | 79 | 2.6% |
| Total | 3,009 | 100.0% |
Ancestry in Pawhuska
The most populous ancestries reported in Pawhuska are Irish (491 | 16.3%), Cherokee (358 | 11.9%), German (357 | 11.9%), Osage (339 | 11.3%), and English (203 | 6.8%), together accounting for 58.1% of all Pawhuska residents.
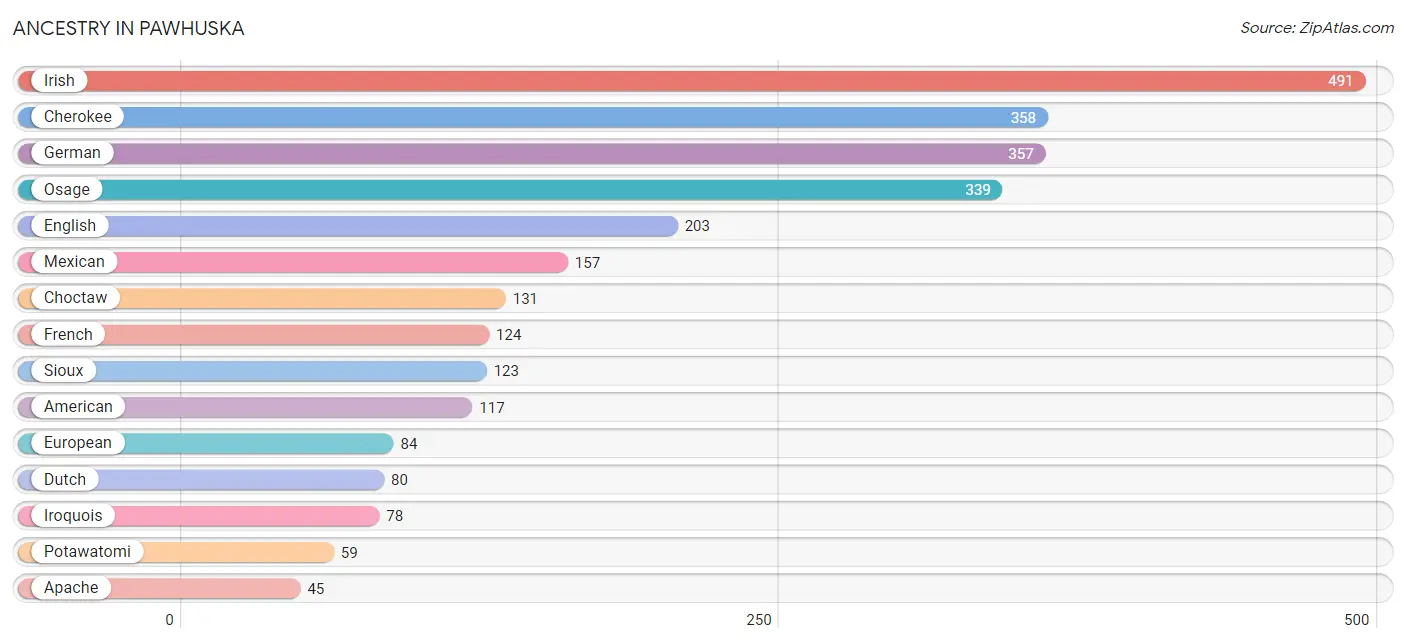
| Ancestry | # Population | % Population |
| American | 117 | 3.9% |
| Apache | 45 | 1.5% |
| Austrian | 20 | 0.7% |
| British | 27 | 0.9% |
| Cherokee | 358 | 11.9% |
| Chippewa | 5 | 0.2% |
| Choctaw | 131 | 4.3% |
| Creek | 41 | 1.4% |
| Dutch | 80 | 2.7% |
| English | 203 | 6.8% |
| European | 84 | 2.8% |
| French | 124 | 4.1% |
| French Canadian | 8 | 0.3% |
| German | 357 | 11.9% |
| Irish | 491 | 16.3% |
| Iroquois | 78 | 2.6% |
| Italian | 8 | 0.3% |
| Mexican | 157 | 5.2% |
| Norwegian | 1 | 0.0% |
| Osage | 339 | 11.3% |
| Ottawa | 18 | 0.6% |
| Pima | 15 | 0.5% |
| Polish | 32 | 1.1% |
| Potawatomi | 59 | 2.0% |
| Russian | 6 | 0.2% |
| Scotch-Irish | 39 | 1.3% |
| Scottish | 29 | 1.0% |
| Sioux | 123 | 4.1% |
| Sri Lankan | 13 | 0.4% |
| Welsh | 34 | 1.1% | View All 30 Rows |
Immigrants in Pawhuska
The most numerous immigrant groups reported in Pawhuska came from Central America (30 | 1.0%), Latin America (30 | 1.0%), Mexico (30 | 1.0%), Asia (13 | 0.4%), and South Eastern Asia (13 | 0.4%), together accounting for 3.9% of all Pawhuska residents.
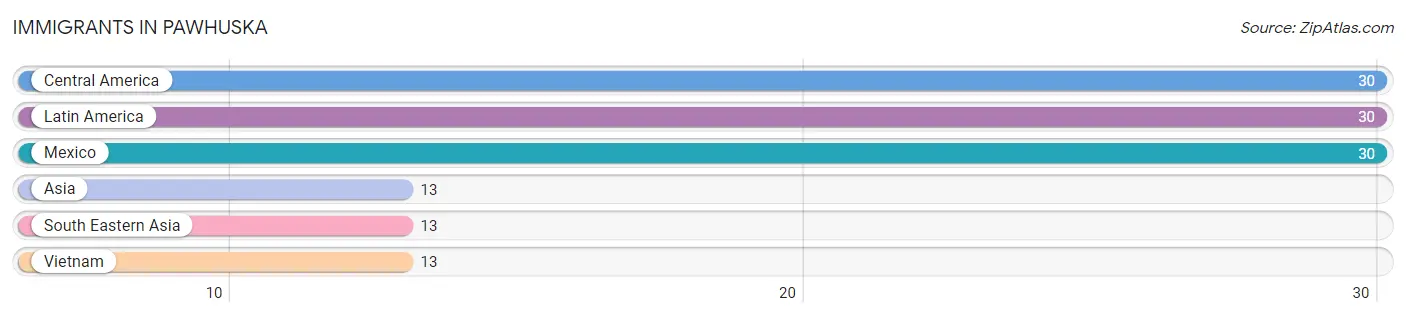
| Immigration Origin | # Population | % Population |
| Asia | 13 | 0.4% |
| Central America | 30 | 1.0% |
| Latin America | 30 | 1.0% |
| Mexico | 30 | 1.0% |
| South Eastern Asia | 13 | 0.4% |
| Vietnam | 13 | 0.4% | View All 6 Rows |
Sex and Age in Pawhuska
Sex and Age in Pawhuska
The most populous age groups in Pawhuska are 30 to 34 Years (219 | 14.8%) for men and 60 to 64 Years (171 | 11.2%) for women.
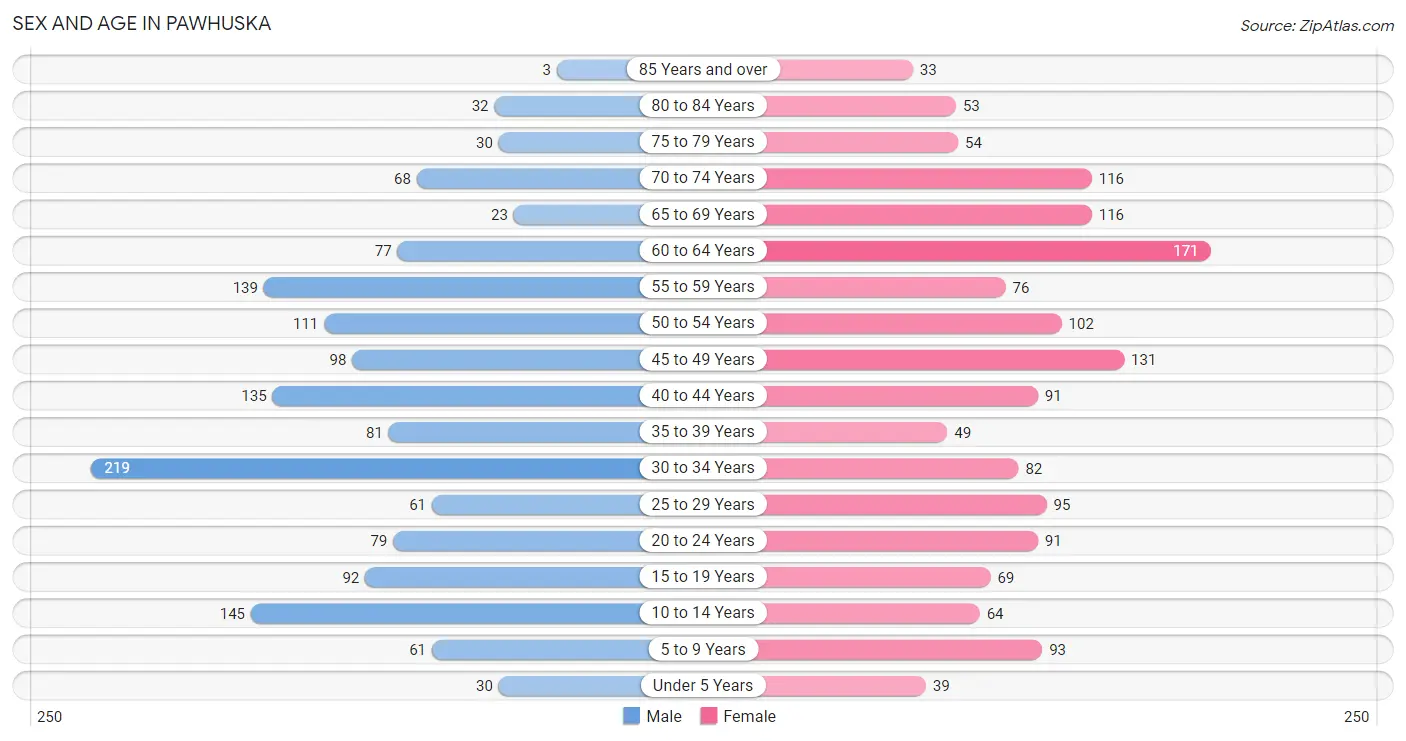
| Age Bracket | Male | Female |
| Under 5 Years | 30 (2.0%) | 39 (2.6%) |
| 5 to 9 Years | 61 (4.1%) | 93 (6.1%) |
| 10 to 14 Years | 145 (9.8%) | 64 (4.2%) |
| 15 to 19 Years | 92 (6.2%) | 69 (4.5%) |
| 20 to 24 Years | 79 (5.3%) | 91 (6.0%) |
| 25 to 29 Years | 61 (4.1%) | 95 (6.2%) |
| 30 to 34 Years | 219 (14.8%) | 82 (5.4%) |
| 35 to 39 Years | 81 (5.5%) | 49 (3.2%) |
| 40 to 44 Years | 135 (9.1%) | 91 (6.0%) |
| 45 to 49 Years | 98 (6.6%) | 131 (8.6%) |
| 50 to 54 Years | 111 (7.5%) | 102 (6.7%) |
| 55 to 59 Years | 139 (9.4%) | 76 (5.0%) |
| 60 to 64 Years | 77 (5.2%) | 171 (11.2%) |
| 65 to 69 Years | 23 (1.5%) | 116 (7.6%) |
| 70 to 74 Years | 68 (4.6%) | 116 (7.6%) |
| 75 to 79 Years | 30 (2.0%) | 54 (3.5%) |
| 80 to 84 Years | 32 (2.2%) | 53 (3.5%) |
| 85 Years and over | 3 (0.2%) | 33 (2.2%) |
| Total | 1,484 (100.0%) | 1,525 (100.0%) |
Families and Households in Pawhuska
Median Family Size in Pawhuska
The median family size in Pawhuska is 3.16 persons per family, with single male/father families (40 | 5.8%) accounting for the largest median family size of 5.15 persons per family. On the other hand, married-couple families (558 | 80.6%) represent the smallest median family size with 3.03 persons per family.
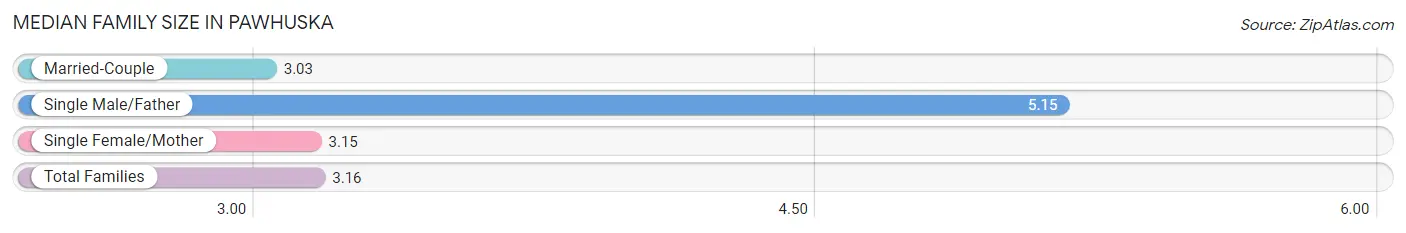
| Family Type | # Families | Family Size |
| Married-Couple | 558 (80.6%) | 3.03 |
| Single Male/Father | 40 (5.8%) | 5.15 |
| Single Female/Mother | 94 (13.6%) | 3.15 |
| Total Families | 692 (100.0%) | 3.16 |
Median Household Size in Pawhuska
The median household size in Pawhuska is 2.28 persons per household, with single male/father households (40 | 3.2%) accounting for the largest median household size of 5.6 persons per household. non-family households (542 | 43.9%) represent the smallest median household size with 1.10 persons per household.
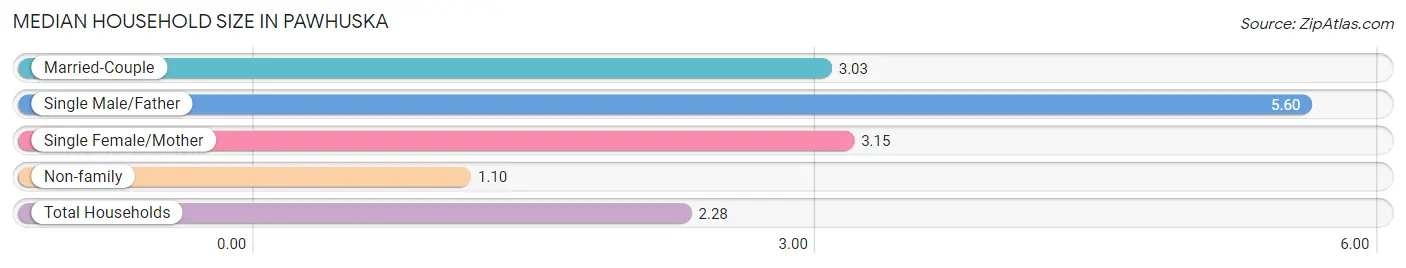
| Household Type | # Households | Household Size |
| Married-Couple | 558 (45.2%) | 3.03 |
| Single Male/Father | 40 (3.2%) | 5.60 |
| Single Female/Mother | 94 (7.6%) | 3.15 |
| Non-family | 542 (43.9%) | 1.10 |
| Total Households | 1,234 (100.0%) | 2.28 |
Household Size by Marriage Status in Pawhuska
Out of a total of 1,234 households in Pawhuska, 692 (56.1%) are family households, while 542 (43.9%) are nonfamily households. The most numerous type of family households are 2-person households, comprising 340, and the most common type of nonfamily households are 1-person households, comprising 499.
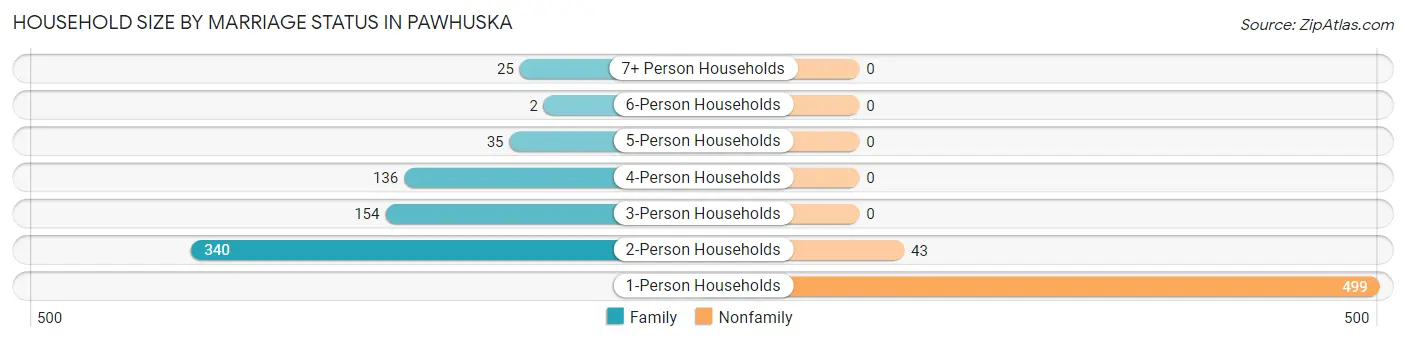
| Household Size | Family Households | Nonfamily Households |
| 1-Person Households | - | 499 (40.4%) |
| 2-Person Households | 340 (27.6%) | 43 (3.5%) |
| 3-Person Households | 154 (12.5%) | 0 (0.0%) |
| 4-Person Households | 136 (11.0%) | 0 (0.0%) |
| 5-Person Households | 35 (2.8%) | 0 (0.0%) |
| 6-Person Households | 2 (0.2%) | 0 (0.0%) |
| 7+ Person Households | 25 (2.0%) | 0 (0.0%) |
| Total | 692 (56.1%) | 542 (43.9%) |
Female Fertility in Pawhuska
Fertility by Age in Pawhuska
Average fertility rate in Pawhuska is 45.0 births per 1,000 women. Women in the age bracket of 20 to 34 years have the highest fertility rate with 104.0 births per 1,000 women. Women in the age bracket of 20 to 34 years acount for 100.0% of all women with births.
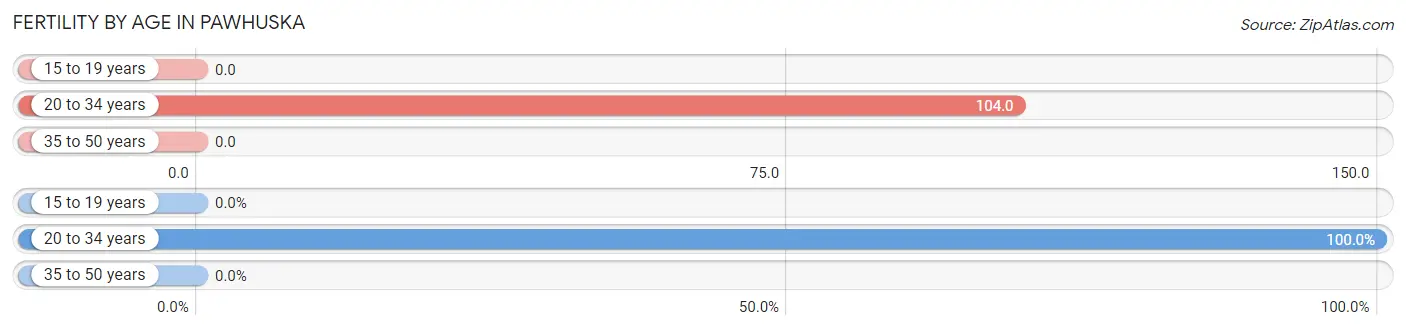
| Age Bracket | Women with Births | Births / 1,000 Women |
| 15 to 19 years | 0 (0.0%) | 0.0 |
| 20 to 34 years | 28 (100.0%) | 104.0 |
| 35 to 50 years | 0 (0.0%) | 0.0 |
| Total | 28 (100.0%) | 45.0 |
Fertility by Age by Marriage Status in Pawhuska
89.3% of women with births (28) in Pawhuska are married. The highest percentage of unmarried women with births falls into 20 to 34 years age bracket with 10.7% of them unmarried at the time of birth, while the lowest percentage of unmarried women with births belong to 20 to 34 years age bracket with 10.7% of them unmarried.
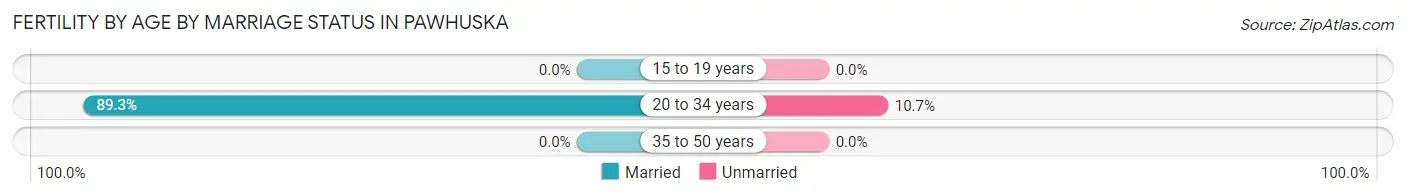
| Age Bracket | Married | Unmarried |
| 15 to 19 years | 0 (0.0%) | 0 (0.0%) |
| 20 to 34 years | 25 (89.3%) | 3 (10.7%) |
| 35 to 50 years | 0 (0.0%) | 0 (0.0%) |
| Total | 25 (89.3%) | 3 (10.7%) |
Fertility by Education in Pawhuska
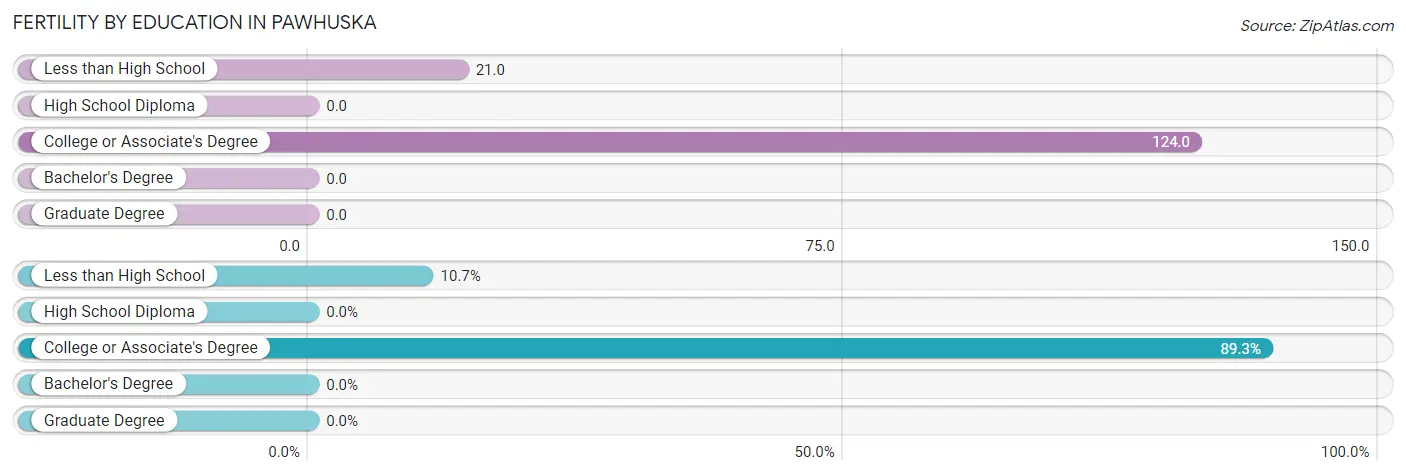
| Educational Attainment | Women with Births | Births / 1,000 Women |
| Less than High School | 3 (10.7%) | 21.0 |
| High School Diploma | 0 (0.0%) | 0.0 |
| College or Associate's Degree | 25 (89.3%) | 124.0 |
| Bachelor's Degree | 0 (0.0%) | 0.0 |
| Graduate Degree | 0 (0.0%) | 0.0 |
| Total | 28 (100.0%) | 45.0 |
Fertility by Education by Marriage Status in Pawhuska
10.7% of women with births in Pawhuska are unmarried. Women with the educational attainment of college or associate's degree are most likely to be married with 100.0% of them married at childbirth, while women with the educational attainment of less than high school are least likely to be married with 100.0% of them unmarried at childbirth.
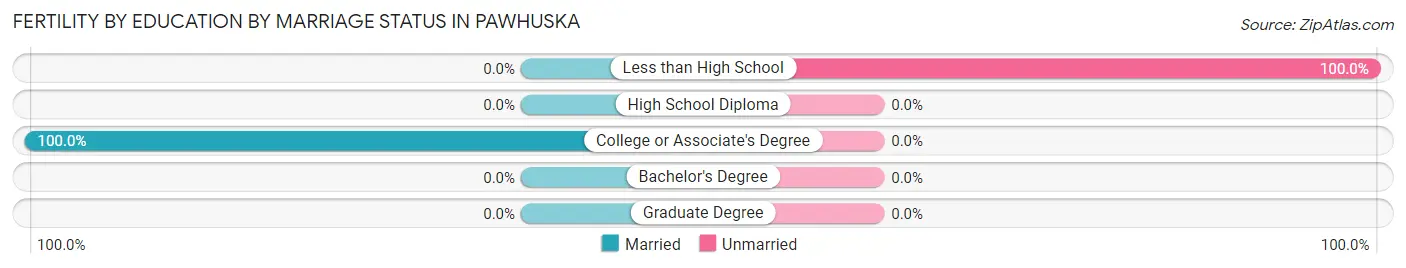
| Educational Attainment | Married | Unmarried |
| Less than High School | 0 (0.0%) | 3 (100.0%) |
| High School Diploma | 0 (0.0%) | 0 (0.0%) |
| College or Associate's Degree | 25 (100.0%) | 0 (0.0%) |
| Bachelor's Degree | 0 (0.0%) | 0 (0.0%) |
| Graduate Degree | 0 (0.0%) | 0 (0.0%) |
| Total | 25 (89.3%) | 3 (10.7%) |
Employment Characteristics in Pawhuska
Employment by Class of Employer in Pawhuska
Among the 1,366 employed individuals in Pawhuska, private company employees (724 | 53.0%), local government employees (174 | 12.7%), and state government employees (117 | 8.6%) make up the most common classes of employment.
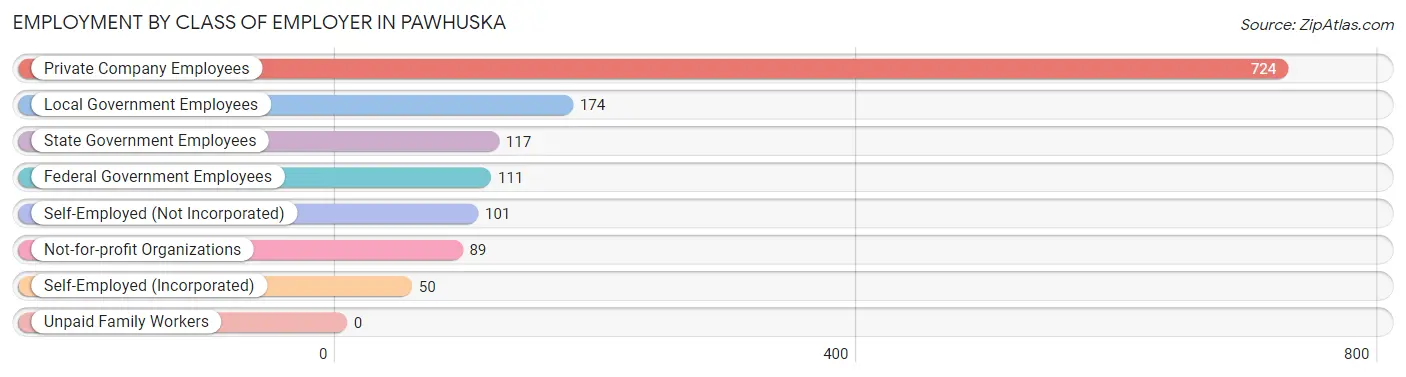
| Employer Class | # Employees | % Employees |
| Private Company Employees | 724 | 53.0% |
| Self-Employed (Incorporated) | 50 | 3.7% |
| Self-Employed (Not Incorporated) | 101 | 7.4% |
| Not-for-profit Organizations | 89 | 6.5% |
| Local Government Employees | 174 | 12.7% |
| State Government Employees | 117 | 8.6% |
| Federal Government Employees | 111 | 8.1% |
| Unpaid Family Workers | 0 | 0.0% |
| Total | 1,366 | 100.0% |
Employment Status by Age in Pawhuska
According to the labor force statistics for Pawhuska, out of the total population over 16 years of age (2,559), 55.5% or 1,420 individuals are in the labor force, with 2.7% or 38 of them unemployed. The age group with the highest labor force participation rate is 35 to 44 years, with 81.7% or 291 individuals in the labor force. Within the labor force, the 16 to 19 years age range has the highest percentage of unemployed individuals, with 13.2% or 5 of them being unemployed.
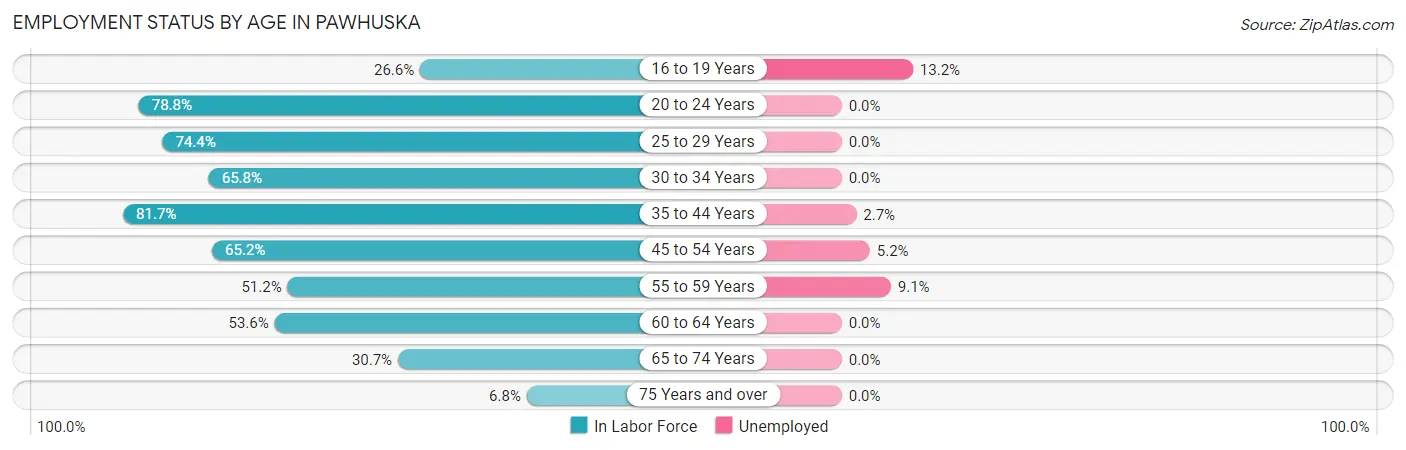
| Age Bracket | In Labor Force | Unemployed |
| 16 to 19 Years | 38 (26.6%) | 5 (13.2%) |
| 20 to 24 Years | 134 (78.8%) | 0 (0.0%) |
| 25 to 29 Years | 116 (74.4%) | 0 (0.0%) |
| 30 to 34 Years | 198 (65.8%) | 0 (0.0%) |
| 35 to 44 Years | 291 (81.7%) | 8 (2.7%) |
| 45 to 54 Years | 288 (65.2%) | 15 (5.2%) |
| 55 to 59 Years | 110 (51.2%) | 10 (9.1%) |
| 60 to 64 Years | 133 (53.6%) | 0 (0.0%) |
| 65 to 74 Years | 99 (30.7%) | 0 (0.0%) |
| 75 Years and over | 14 (6.8%) | 0 (0.0%) |
| Total | 1,420 (55.5%) | 38 (2.7%) |
Employment Status by Educational Attainment in Pawhuska
According to labor force statistics for Pawhuska, 66.1% of individuals (1,136) out of the total population between 25 and 64 years of age (1,718) are in the labor force, with 2.9% or 33 of them being unemployed. The group with the highest labor force participation rate are those with the educational attainment of bachelor's degree or higher, with 96.7% or 232 individuals in the labor force. Within the labor force, individuals with less than high school education have the highest percentage of unemployment, with 9.9% or 15 of them being unemployed.
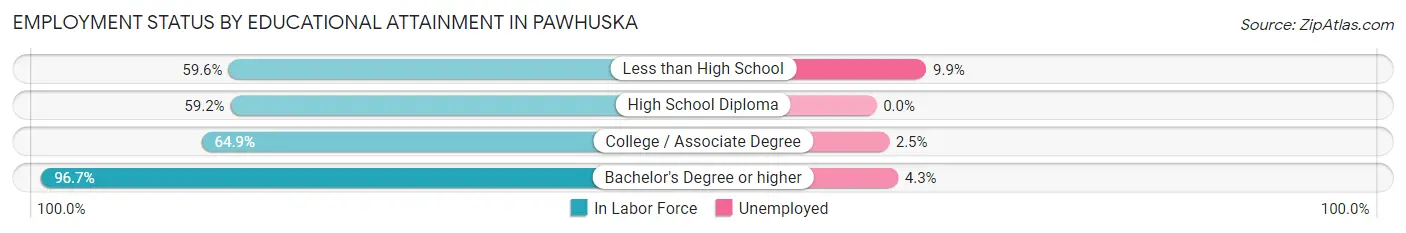
| Educational Attainment | In Labor Force | Unemployed |
| Less than High School | 152 (59.6%) | 25 (9.9%) |
| High School Diploma | 429 (59.2%) | 0 (0.0%) |
| College / Associate Degree | 323 (64.9%) | 12 (2.5%) |
| Bachelor's Degree or higher | 232 (96.7%) | 10 (4.3%) |
| Total | 1,136 (66.1%) | 50 (2.9%) |
Employment Occupations by Sex in Pawhuska
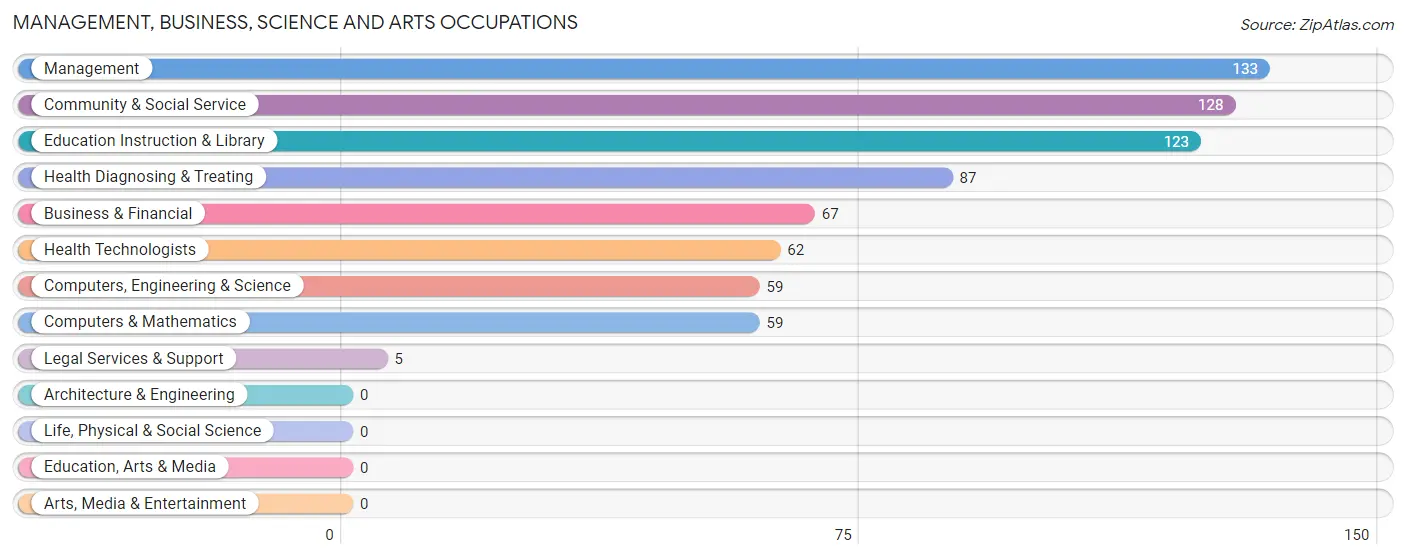
Management, Business, Science and Arts Occupations
The most common Management, Business, Science and Arts occupations in Pawhuska are Management (133 | 9.6%), Community & Social Service (128 | 9.3%), Education Instruction & Library (123 | 8.9%), Health Diagnosing & Treating (87 | 6.3%), and Business & Financial (67 | 4.8%).
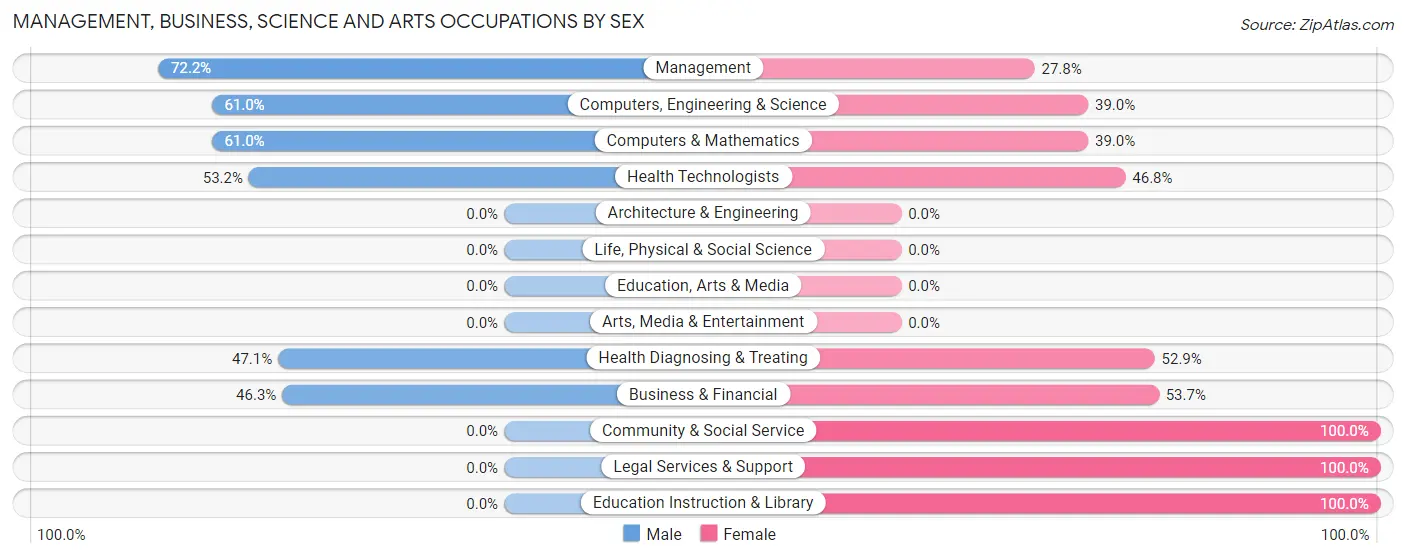
Management, Business, Science and Arts Occupations by Sex
Within the Management, Business, Science and Arts occupations in Pawhuska, the most male-oriented occupations are Management (72.2%), Computers, Engineering & Science (61.0%), and Computers & Mathematics (61.0%), while the most female-oriented occupations are Community & Social Service (100.0%), Legal Services & Support (100.0%), and Education Instruction & Library (100.0%).
| Occupation | Male | Female |
| Management | 96 (72.2%) | 37 (27.8%) |
| Business & Financial | 31 (46.3%) | 36 (53.7%) |
| Computers, Engineering & Science | 36 (61.0%) | 23 (39.0%) |
| Computers & Mathematics | 36 (61.0%) | 23 (39.0%) |
| Architecture & Engineering | 0 (0.0%) | 0 (0.0%) |
| Life, Physical & Social Science | 0 (0.0%) | 0 (0.0%) |
| Community & Social Service | 0 (0.0%) | 128 (100.0%) |
| Education, Arts & Media | 0 (0.0%) | 0 (0.0%) |
| Legal Services & Support | 0 (0.0%) | 5 (100.0%) |
| Education Instruction & Library | 0 (0.0%) | 123 (100.0%) |
| Arts, Media & Entertainment | 0 (0.0%) | 0 (0.0%) |
| Health Diagnosing & Treating | 41 (47.1%) | 46 (52.9%) |
| Health Technologists | 33 (53.2%) | 29 (46.8%) |
| Total (Category) | 204 (43.0%) | 270 (57.0%) |
| Total (Overall) | 698 (50.5%) | 685 (49.5%) |
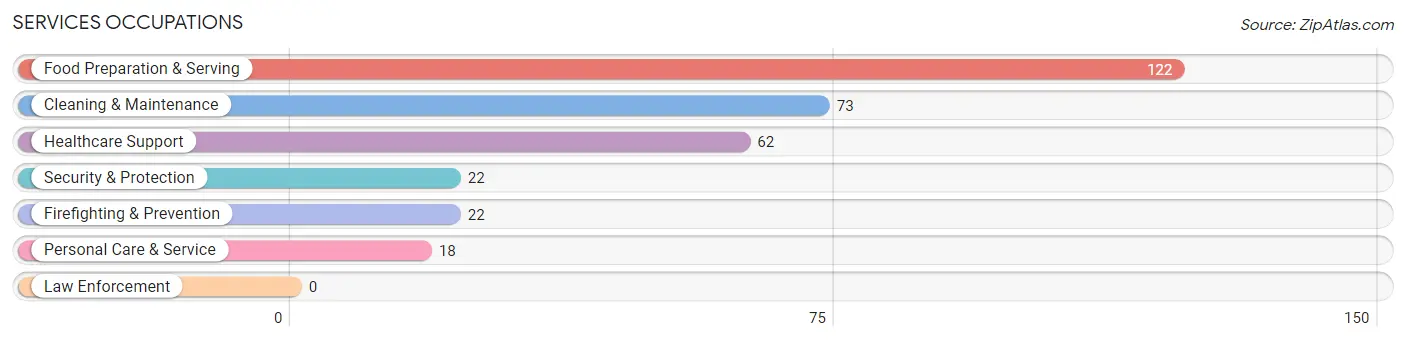
Services Occupations
The most common Services occupations in Pawhuska are Food Preparation & Serving (122 | 8.8%), Cleaning & Maintenance (73 | 5.3%), Healthcare Support (62 | 4.5%), Security & Protection (22 | 1.6%), and Firefighting & Prevention (22 | 1.6%).
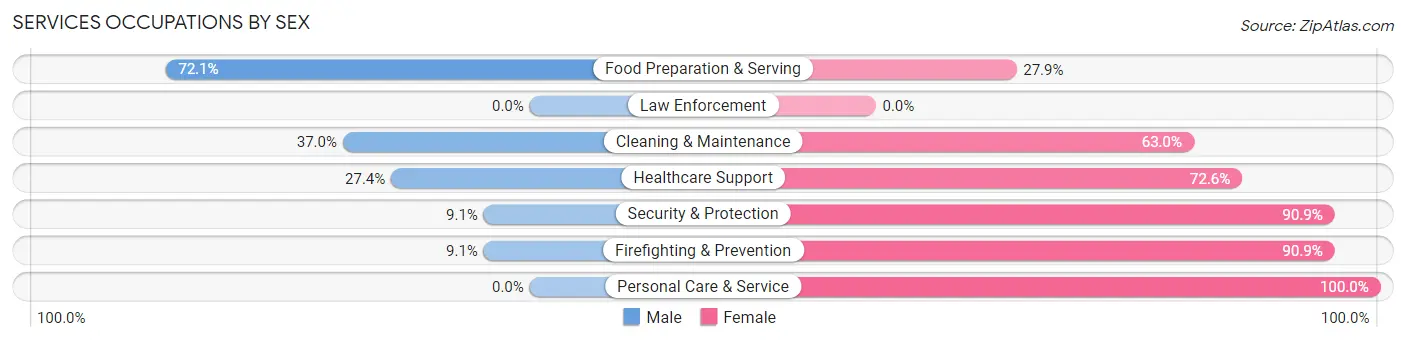
Services Occupations by Sex
Within the Services occupations in Pawhuska, the most male-oriented occupations are Food Preparation & Serving (72.1%), Cleaning & Maintenance (37.0%), and Healthcare Support (27.4%), while the most female-oriented occupations are Personal Care & Service (100.0%), Security & Protection (90.9%), and Firefighting & Prevention (90.9%).
| Occupation | Male | Female |
| Healthcare Support | 17 (27.4%) | 45 (72.6%) |
| Security & Protection | 2 (9.1%) | 20 (90.9%) |
| Firefighting & Prevention | 2 (9.1%) | 20 (90.9%) |
| Law Enforcement | 0 (0.0%) | 0 (0.0%) |
| Food Preparation & Serving | 88 (72.1%) | 34 (27.9%) |
| Cleaning & Maintenance | 27 (37.0%) | 46 (63.0%) |
| Personal Care & Service | 0 (0.0%) | 18 (100.0%) |
| Total (Category) | 134 (45.1%) | 163 (54.9%) |
| Total (Overall) | 698 (50.5%) | 685 (49.5%) |
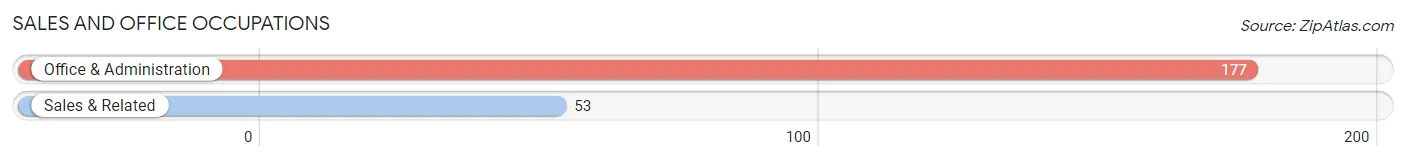
Sales and Office Occupations
The most common Sales and Office occupations in Pawhuska are Office & Administration (177 | 12.8%), and Sales & Related (53 | 3.8%).
Sales and Office Occupations by Sex
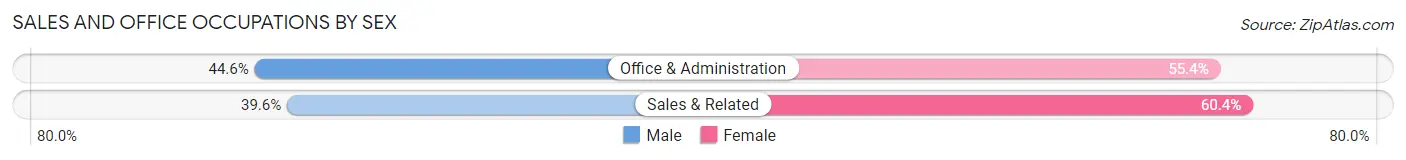
| Occupation | Male | Female |
| Sales & Related | 21 (39.6%) | 32 (60.4%) |
| Office & Administration | 79 (44.6%) | 98 (55.4%) |
| Total (Category) | 100 (43.5%) | 130 (56.5%) |
| Total (Overall) | 698 (50.5%) | 685 (49.5%) |
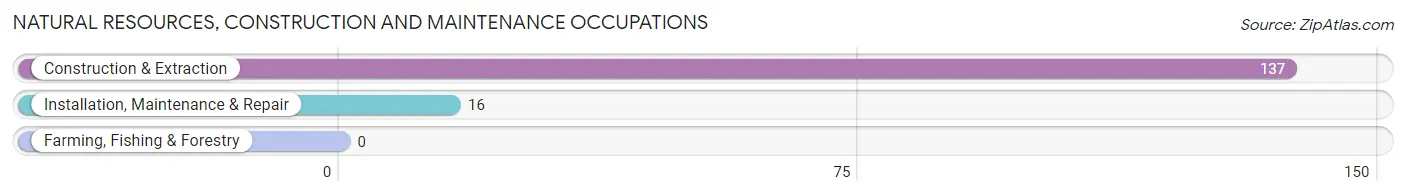
Natural Resources, Construction and Maintenance Occupations
The most common Natural Resources, Construction and Maintenance occupations in Pawhuska are Construction & Extraction (137 | 9.9%), and Installation, Maintenance & Repair (16 | 1.2%).
Natural Resources, Construction and Maintenance Occupations by Sex
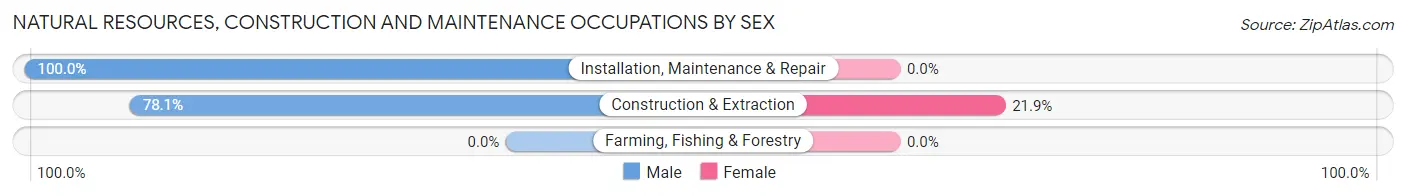
| Occupation | Male | Female |
| Farming, Fishing & Forestry | 0 (0.0%) | 0 (0.0%) |
| Construction & Extraction | 107 (78.1%) | 30 (21.9%) |
| Installation, Maintenance & Repair | 16 (100.0%) | 0 (0.0%) |
| Total (Category) | 123 (80.4%) | 30 (19.6%) |
| Total (Overall) | 698 (50.5%) | 685 (49.5%) |
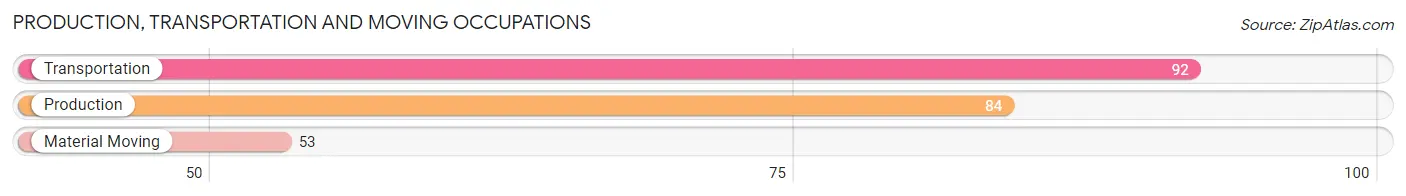
Production, Transportation and Moving Occupations
The most common Production, Transportation and Moving occupations in Pawhuska are Transportation (92 | 6.7%), Production (84 | 6.1%), and Material Moving (53 | 3.8%).
Production, Transportation and Moving Occupations by Sex
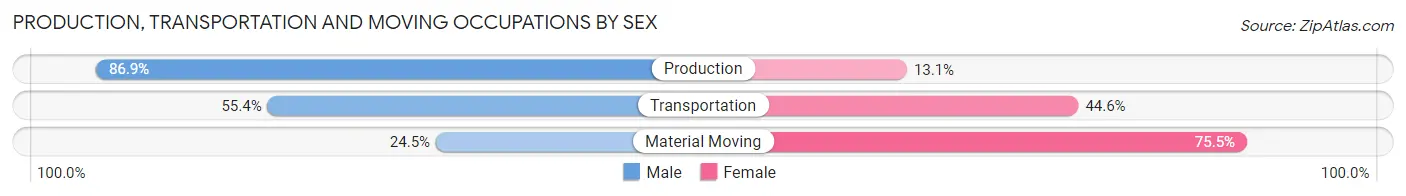
| Occupation | Male | Female |
| Production | 73 (86.9%) | 11 (13.1%) |
| Transportation | 51 (55.4%) | 41 (44.6%) |
| Material Moving | 13 (24.5%) | 40 (75.5%) |
| Total (Category) | 137 (59.8%) | 92 (40.2%) |
| Total (Overall) | 698 (50.5%) | 685 (49.5%) |
Employment Industries by Sex in Pawhuska
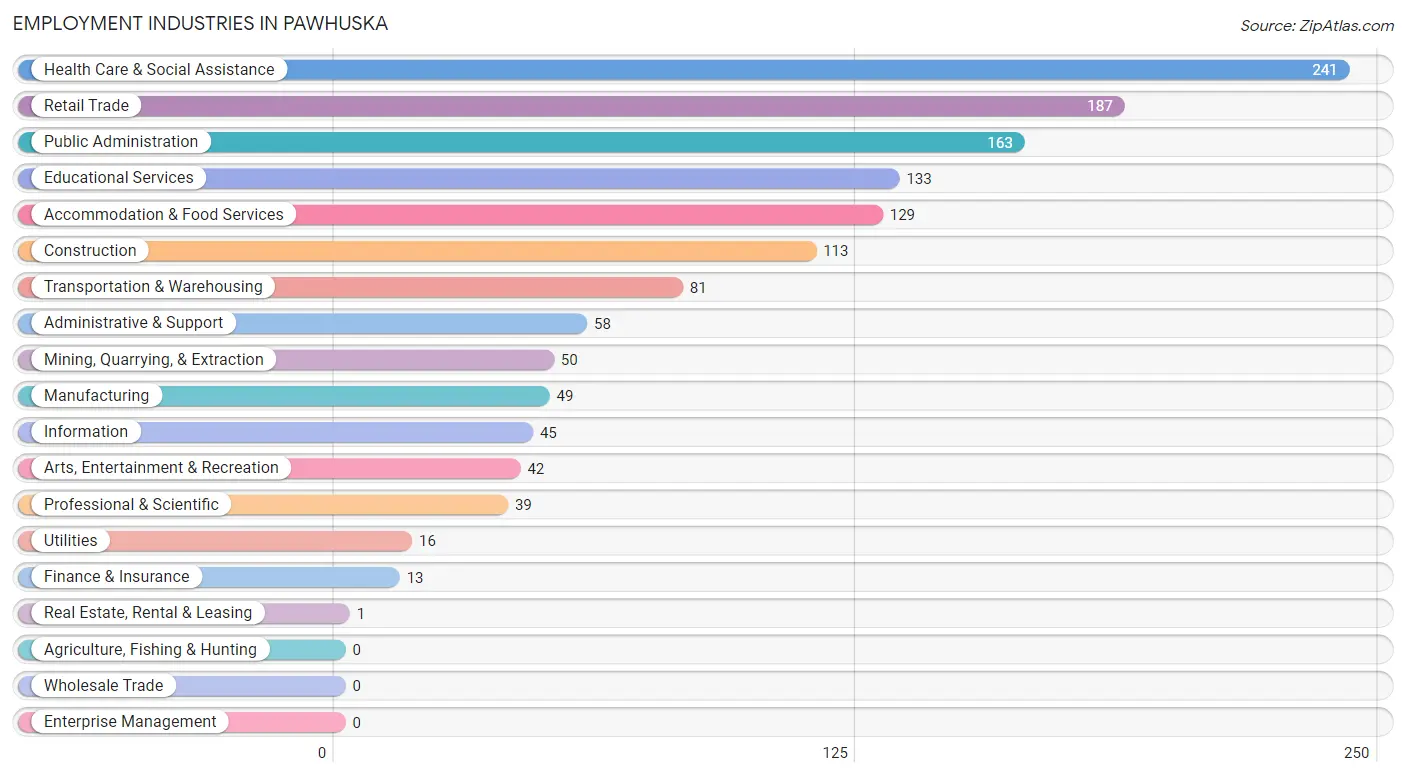
Employment Industries in Pawhuska
The major employment industries in Pawhuska include Health Care & Social Assistance (241 | 17.4%), Retail Trade (187 | 13.5%), Public Administration (163 | 11.8%), Educational Services (133 | 9.6%), and Accommodation & Food Services (129 | 9.3%).
Employment Industries by Sex in Pawhuska
The Pawhuska industries that see more men than women are Construction (100.0%), Utilities (100.0%), and Professional & Scientific (87.2%), whereas the industries that tend to have a higher number of women are Finance & Insurance (100.0%), Real Estate, Rental & Leasing (100.0%), and Administrative & Support (86.2%).
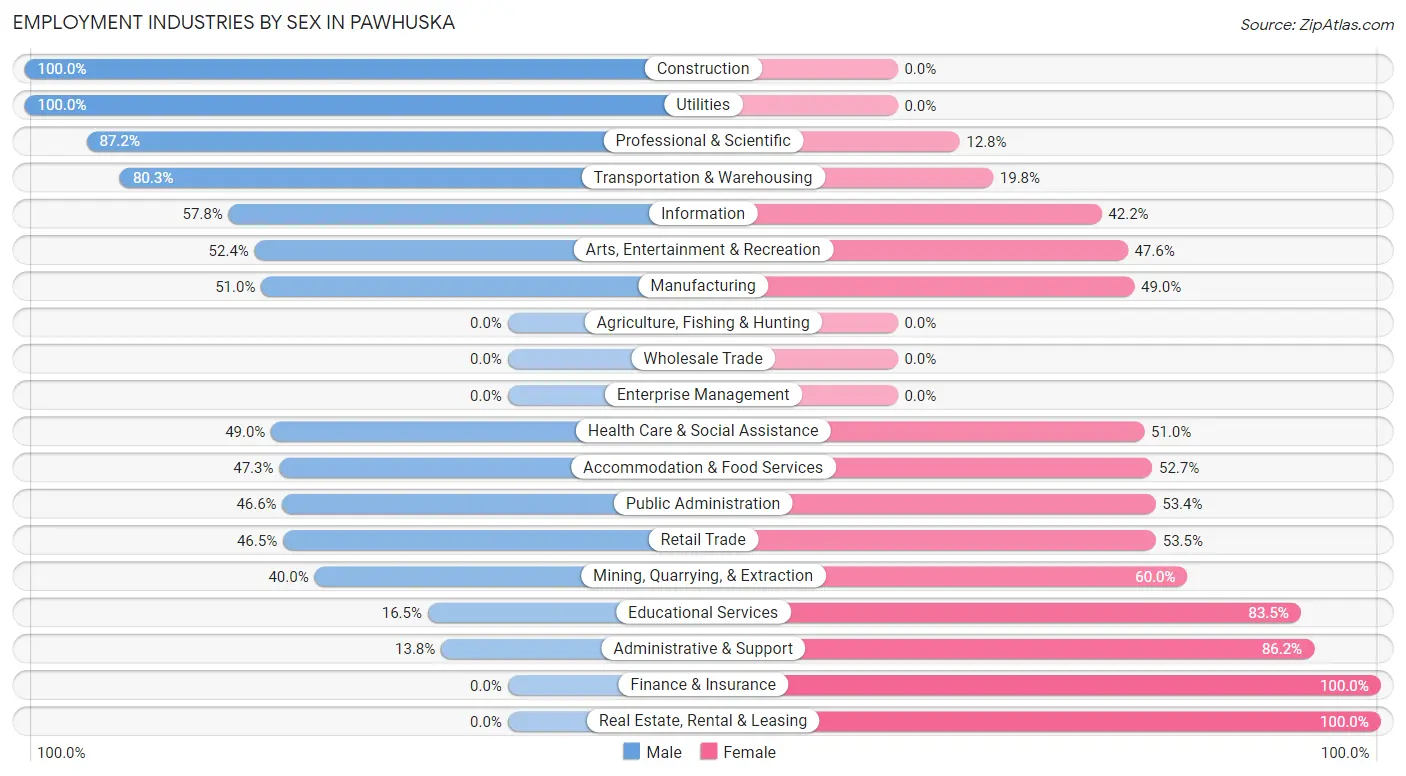
| Industry | Male | Female |
| Agriculture, Fishing & Hunting | 0 (0.0%) | 0 (0.0%) |
| Mining, Quarrying, & Extraction | 20 (40.0%) | 30 (60.0%) |
| Construction | 113 (100.0%) | 0 (0.0%) |
| Manufacturing | 25 (51.0%) | 24 (49.0%) |
| Wholesale Trade | 0 (0.0%) | 0 (0.0%) |
| Retail Trade | 87 (46.5%) | 100 (53.5%) |
| Transportation & Warehousing | 65 (80.2%) | 16 (19.8%) |
| Utilities | 16 (100.0%) | 0 (0.0%) |
| Information | 26 (57.8%) | 19 (42.2%) |
| Finance & Insurance | 0 (0.0%) | 13 (100.0%) |
| Real Estate, Rental & Leasing | 0 (0.0%) | 1 (100.0%) |
| Professional & Scientific | 34 (87.2%) | 5 (12.8%) |
| Enterprise Management | 0 (0.0%) | 0 (0.0%) |
| Administrative & Support | 8 (13.8%) | 50 (86.2%) |
| Educational Services | 22 (16.5%) | 111 (83.5%) |
| Health Care & Social Assistance | 118 (49.0%) | 123 (51.0%) |
| Arts, Entertainment & Recreation | 22 (52.4%) | 20 (47.6%) |
| Accommodation & Food Services | 61 (47.3%) | 68 (52.7%) |
| Public Administration | 76 (46.6%) | 87 (53.4%) |
| Total | 698 (50.5%) | 685 (49.5%) |
Education in Pawhuska
School Enrollment in Pawhuska
The most common levels of schooling among the 579 students in Pawhuska are elementary school (167 | 28.8%), high school (146 | 25.2%), and middle school (127 | 21.9%).
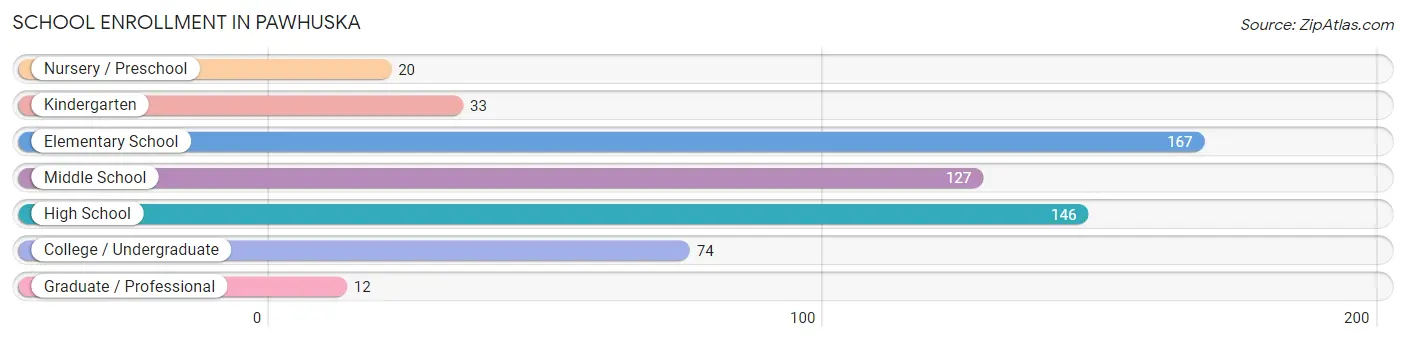
| School Level | # Students | % Students |
| Nursery / Preschool | 20 | 3.5% |
| Kindergarten | 33 | 5.7% |
| Elementary School | 167 | 28.8% |
| Middle School | 127 | 21.9% |
| High School | 146 | 25.2% |
| College / Undergraduate | 74 | 12.8% |
| Graduate / Professional | 12 | 2.1% |
| Total | 579 | 100.0% |
School Enrollment by Age by Funding Source in Pawhuska
Out of a total of 579 students who are enrolled in schools in Pawhuska, 48 (8.3%) attend a private institution, while the remaining 531 (91.7%) are enrolled in public schools. The age group of 35 years and over has the highest likelihood of being enrolled in private schools, with 12 (48.0% in the age bracket) enrolled. Conversely, the age group of 3 to 4 year olds has the lowest likelihood of being enrolled in a private school, with 10 (100.0% in the age bracket) attending a public institution.
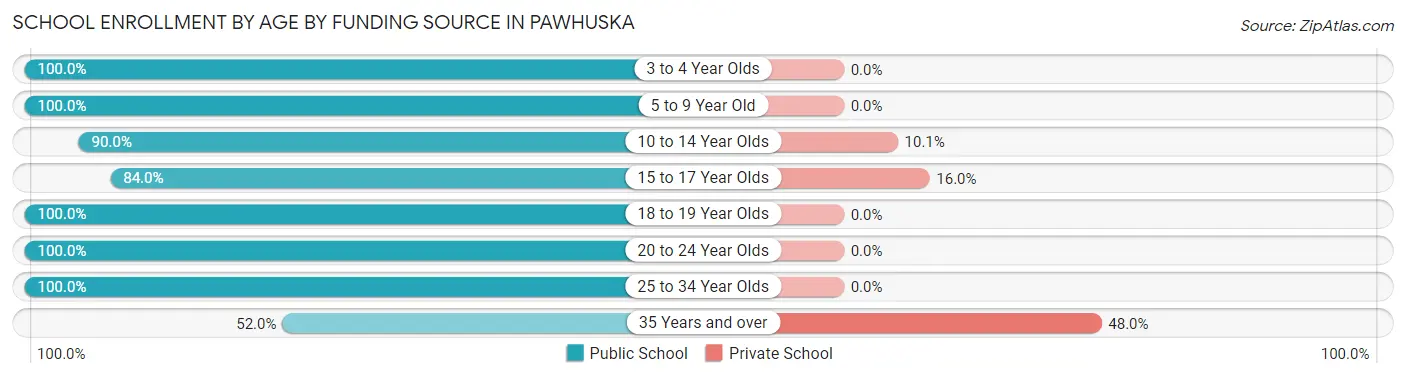
| Age Bracket | Public School | Private School |
| 3 to 4 Year Olds | 10 (100.0%) | 0 (0.0%) |
| 5 to 9 Year Old | 142 (100.0%) | 0 (0.0%) |
| 10 to 14 Year Olds | 188 (89.9%) | 21 (10.1%) |
| 15 to 17 Year Olds | 79 (84.0%) | 15 (16.0%) |
| 18 to 19 Year Olds | 51 (100.0%) | 0 (0.0%) |
| 20 to 24 Year Olds | 42 (100.0%) | 0 (0.0%) |
| 25 to 34 Year Olds | 6 (100.0%) | 0 (0.0%) |
| 35 Years and over | 13 (52.0%) | 12 (48.0%) |
| Total | 531 (91.7%) | 48 (8.3%) |
Educational Attainment by Field of Study in Pawhuska
Education (126 | 39.1%), science & technology (57 | 17.7%), business (40 | 12.4%), arts & humanities (32 | 9.9%), and visual & performing arts (27 | 8.4%) are the most common fields of study among 322 individuals in Pawhuska who have obtained a bachelor's degree or higher.
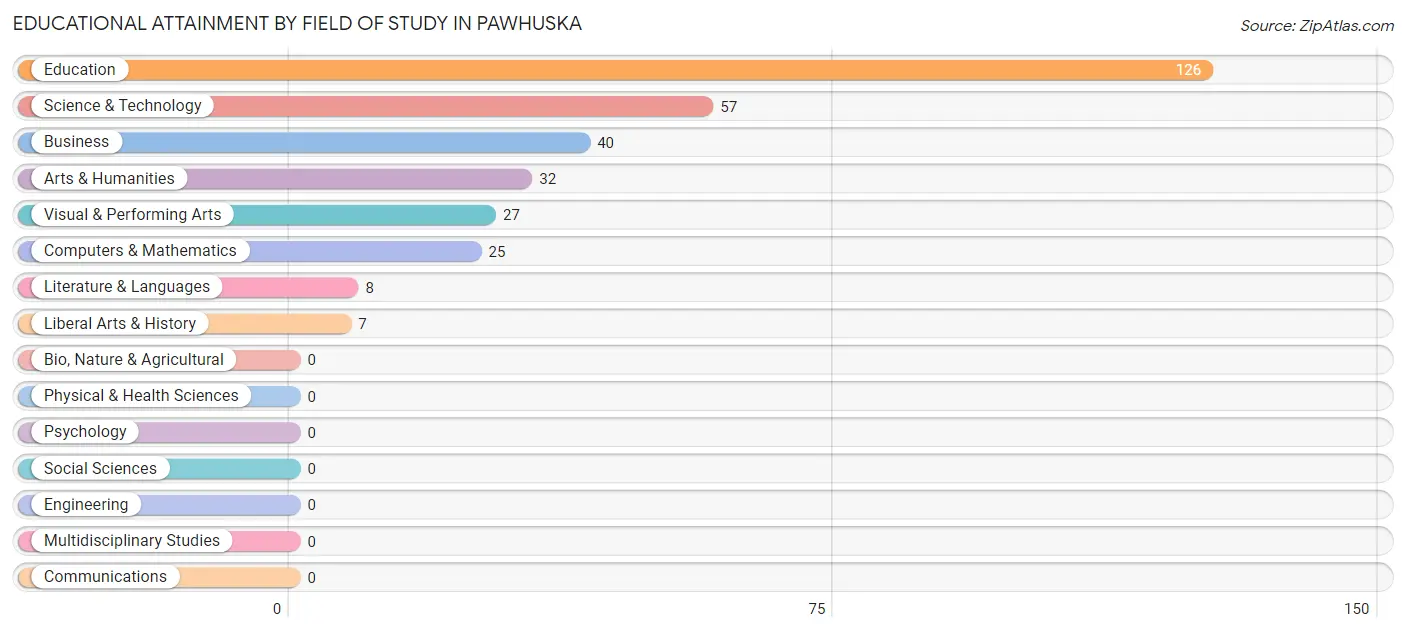
| Field of Study | # Graduates | % Graduates |
| Computers & Mathematics | 25 | 7.8% |
| Bio, Nature & Agricultural | 0 | 0.0% |
| Physical & Health Sciences | 0 | 0.0% |
| Psychology | 0 | 0.0% |
| Social Sciences | 0 | 0.0% |
| Engineering | 0 | 0.0% |
| Multidisciplinary Studies | 0 | 0.0% |
| Science & Technology | 57 | 17.7% |
| Business | 40 | 12.4% |
| Education | 126 | 39.1% |
| Literature & Languages | 8 | 2.5% |
| Liberal Arts & History | 7 | 2.2% |
| Visual & Performing Arts | 27 | 8.4% |
| Communications | 0 | 0.0% |
| Arts & Humanities | 32 | 9.9% |
| Total | 322 | 100.0% |
Transportation & Commute in Pawhuska
Vehicle Availability by Sex in Pawhuska
The most prevalent vehicle ownership categories in Pawhuska are males with 2 vehicles (259, accounting for 38.6%) and females with 2 vehicles (284, making up 37.8%).
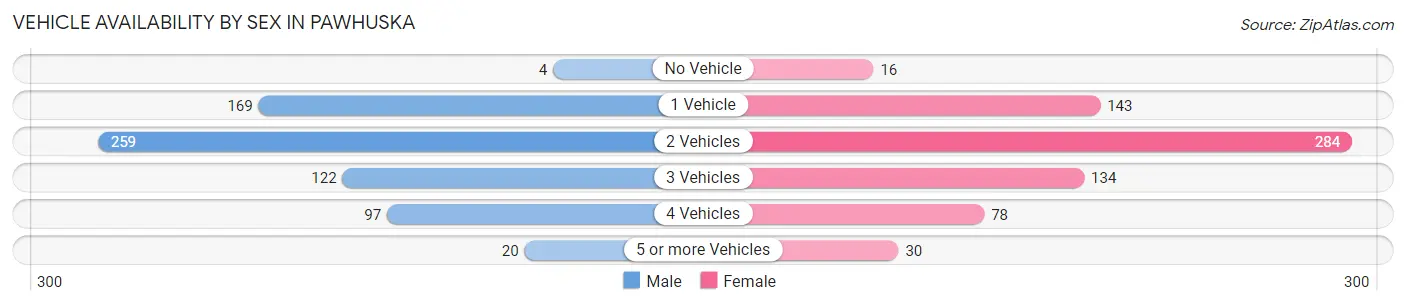
| Vehicles Available | Male | Female |
| No Vehicle | 4 (0.6%) | 16 (2.3%) |
| 1 Vehicle | 169 (25.2%) | 143 (20.9%) |
| 2 Vehicles | 259 (38.6%) | 284 (41.5%) |
| 3 Vehicles | 122 (18.2%) | 134 (19.6%) |
| 4 Vehicles | 97 (14.5%) | 78 (11.4%) |
| 5 or more Vehicles | 20 (3.0%) | 30 (4.4%) |
| Total | 671 (100.0%) | 685 (100.0%) |
Commute Time in Pawhuska
The most frequently occuring commute durations in Pawhuska are less than 5 minutes (379 commuters, 28.3%), 5 to 9 minutes (315 commuters, 23.5%), and 10 to 14 minutes (147 commuters, 11.0%).
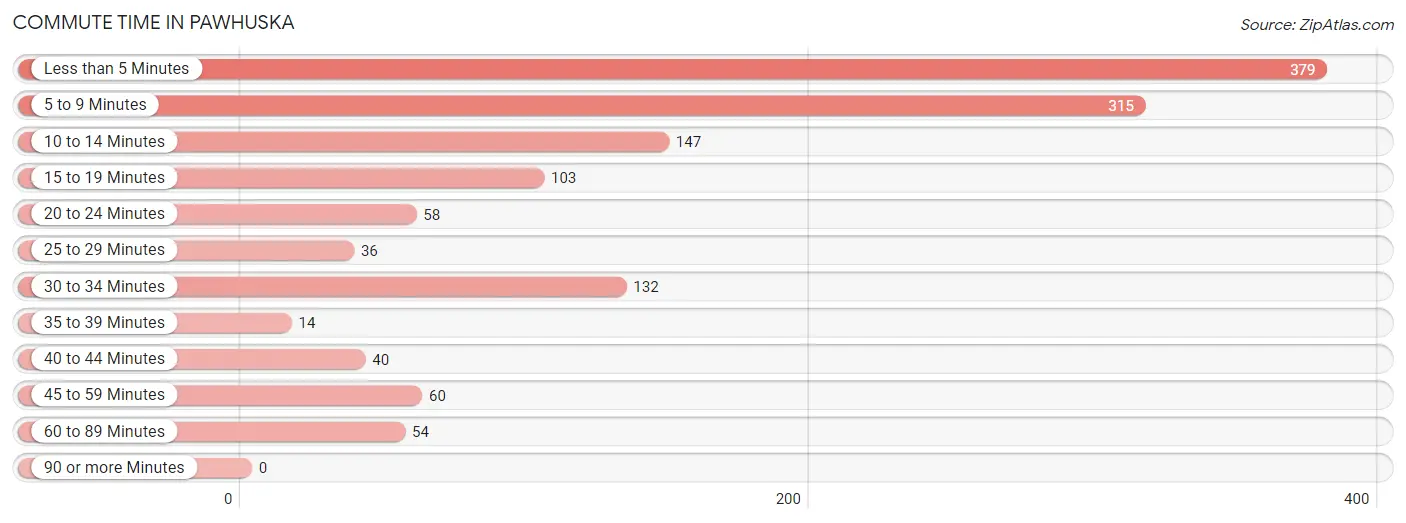
| Commute Time | # Commuters | % Commuters |
| Less than 5 Minutes | 379 | 28.3% |
| 5 to 9 Minutes | 315 | 23.5% |
| 10 to 14 Minutes | 147 | 11.0% |
| 15 to 19 Minutes | 103 | 7.7% |
| 20 to 24 Minutes | 58 | 4.3% |
| 25 to 29 Minutes | 36 | 2.7% |
| 30 to 34 Minutes | 132 | 9.9% |
| 35 to 39 Minutes | 14 | 1.1% |
| 40 to 44 Minutes | 40 | 3.0% |
| 45 to 59 Minutes | 60 | 4.5% |
| 60 to 89 Minutes | 54 | 4.0% |
| 90 or more Minutes | 0 | 0.0% |
Commute Time by Sex in Pawhuska
The most common commute times in Pawhuska are less than 5 minutes (159 commuters, 24.3%) for males and less than 5 minutes (220 commuters, 32.2%) for females.
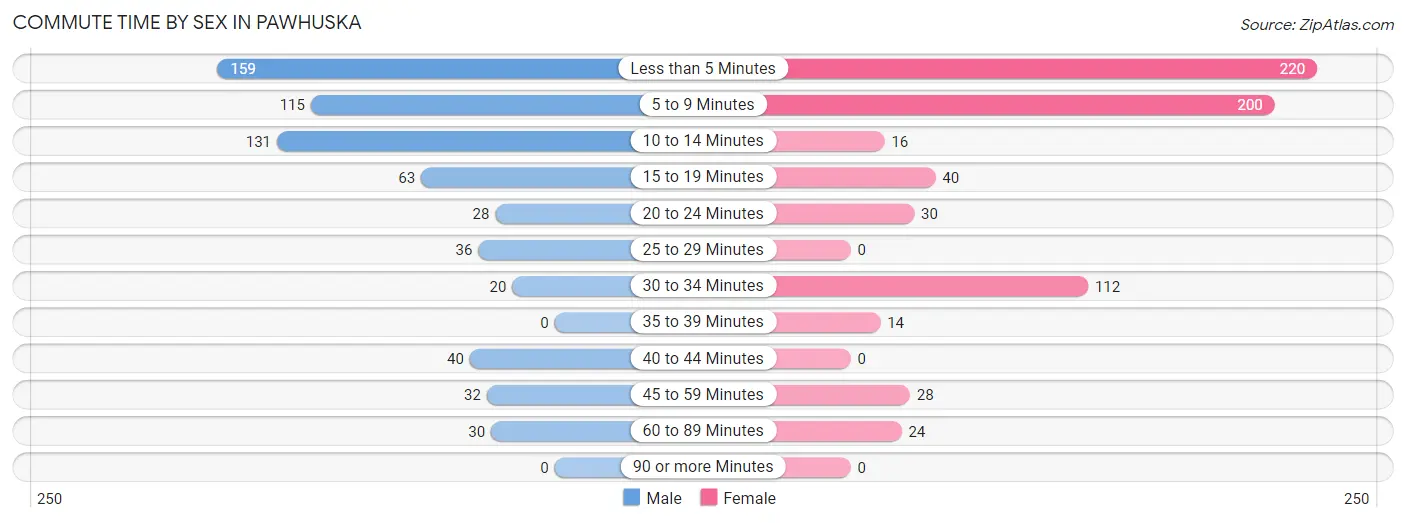
| Commute Time | Male | Female |
| Less than 5 Minutes | 159 (24.3%) | 220 (32.2%) |
| 5 to 9 Minutes | 115 (17.6%) | 200 (29.2%) |
| 10 to 14 Minutes | 131 (20.0%) | 16 (2.3%) |
| 15 to 19 Minutes | 63 (9.6%) | 40 (5.9%) |
| 20 to 24 Minutes | 28 (4.3%) | 30 (4.4%) |
| 25 to 29 Minutes | 36 (5.5%) | 0 (0.0%) |
| 30 to 34 Minutes | 20 (3.1%) | 112 (16.4%) |
| 35 to 39 Minutes | 0 (0.0%) | 14 (2.1%) |
| 40 to 44 Minutes | 40 (6.1%) | 0 (0.0%) |
| 45 to 59 Minutes | 32 (4.9%) | 28 (4.1%) |
| 60 to 89 Minutes | 30 (4.6%) | 24 (3.5%) |
| 90 or more Minutes | 0 (0.0%) | 0 (0.0%) |
Time of Departure to Work by Sex in Pawhuska
The most frequent times of departure to work in Pawhuska are 7:00 AM to 7:29 AM (197, 30.1%) for males and 7:30 AM to 7:59 AM (185, 27.1%) for females.
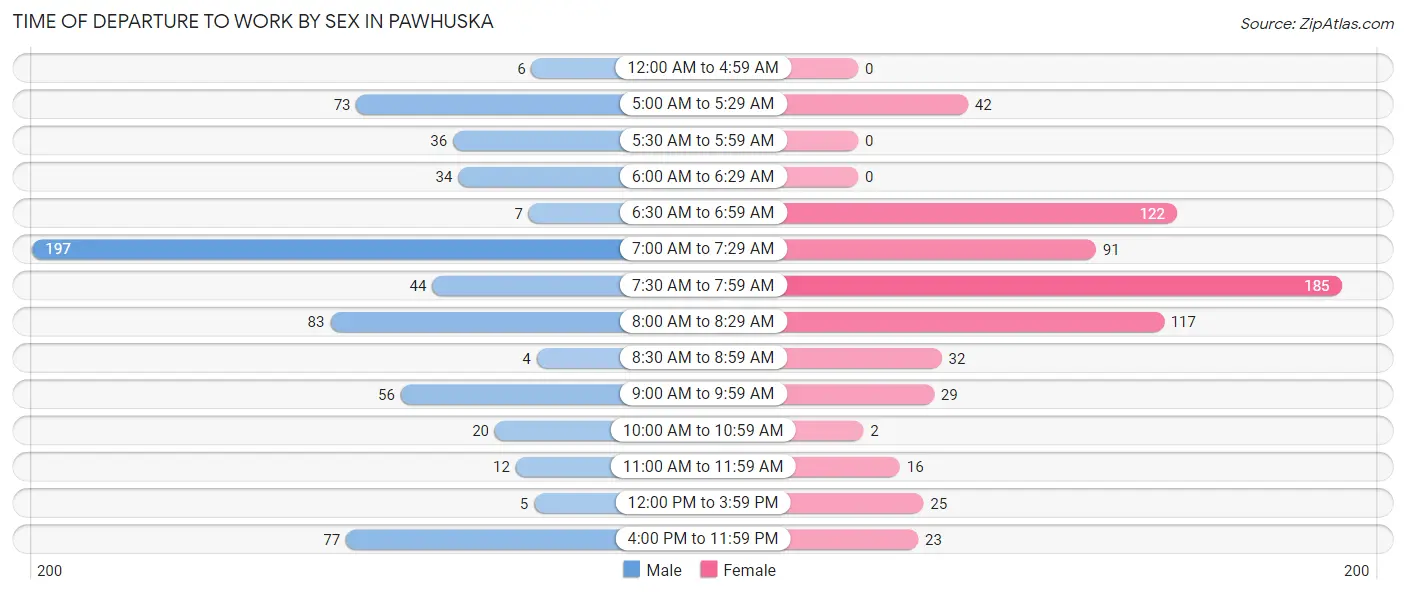
| Time of Departure | Male | Female |
| 12:00 AM to 4:59 AM | 6 (0.9%) | 0 (0.0%) |
| 5:00 AM to 5:29 AM | 73 (11.2%) | 42 (6.1%) |
| 5:30 AM to 5:59 AM | 36 (5.5%) | 0 (0.0%) |
| 6:00 AM to 6:29 AM | 34 (5.2%) | 0 (0.0%) |
| 6:30 AM to 6:59 AM | 7 (1.1%) | 122 (17.8%) |
| 7:00 AM to 7:29 AM | 197 (30.1%) | 91 (13.3%) |
| 7:30 AM to 7:59 AM | 44 (6.7%) | 185 (27.1%) |
| 8:00 AM to 8:29 AM | 83 (12.7%) | 117 (17.1%) |
| 8:30 AM to 8:59 AM | 4 (0.6%) | 32 (4.7%) |
| 9:00 AM to 9:59 AM | 56 (8.6%) | 29 (4.2%) |
| 10:00 AM to 10:59 AM | 20 (3.1%) | 2 (0.3%) |
| 11:00 AM to 11:59 AM | 12 (1.8%) | 16 (2.3%) |
| 12:00 PM to 3:59 PM | 5 (0.8%) | 25 (3.6%) |
| 4:00 PM to 11:59 PM | 77 (11.8%) | 23 (3.4%) |
| Total | 654 (100.0%) | 684 (100.0%) |
Housing Occupancy in Pawhuska
Occupancy by Ownership in Pawhuska
Of the total 1,234 dwellings in Pawhuska, owner-occupied units account for 827 (67.0%), while renter-occupied units make up 407 (33.0%).
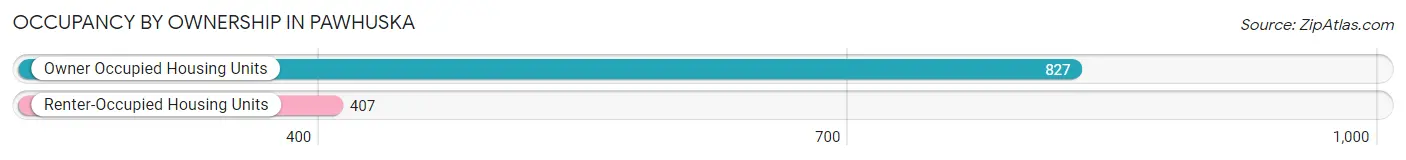
| Occupancy | # Housing Units | % Housing Units |
| Owner Occupied Housing Units | 827 | 67.0% |
| Renter-Occupied Housing Units | 407 | 33.0% |
| Total Occupied Housing Units | 1,234 | 100.0% |
Occupancy by Household Size in Pawhuska
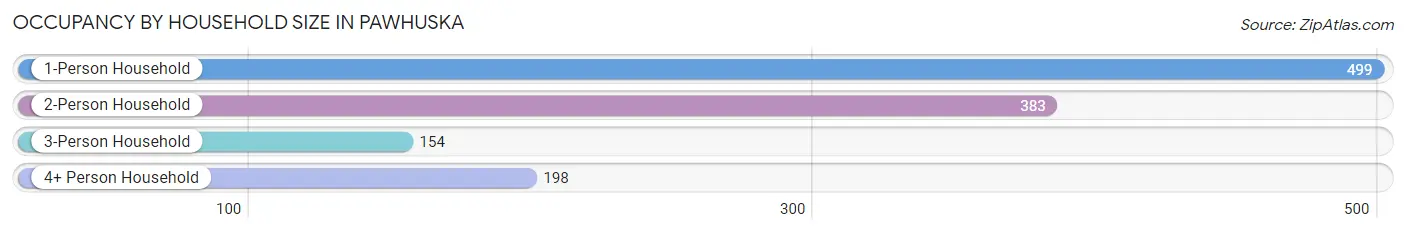
| Household Size | # Housing Units | % Housing Units |
| 1-Person Household | 499 | 40.4% |
| 2-Person Household | 383 | 31.0% |
| 3-Person Household | 154 | 12.5% |
| 4+ Person Household | 198 | 16.1% |
| Total Housing Units | 1,234 | 100.0% |
Occupancy by Ownership by Household Size in Pawhuska
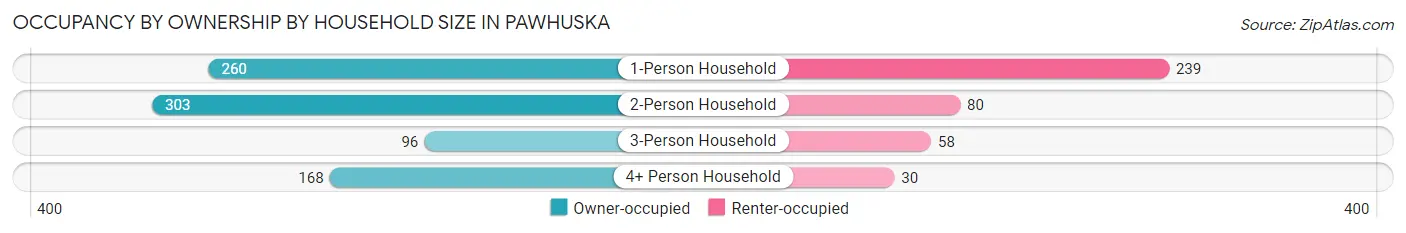
| Household Size | Owner-occupied | Renter-occupied |
| 1-Person Household | 260 (52.1%) | 239 (47.9%) |
| 2-Person Household | 303 (79.1%) | 80 (20.9%) |
| 3-Person Household | 96 (62.3%) | 58 (37.7%) |
| 4+ Person Household | 168 (84.9%) | 30 (15.1%) |
| Total Housing Units | 827 (67.0%) | 407 (33.0%) |
Occupancy by Educational Attainment in Pawhuska
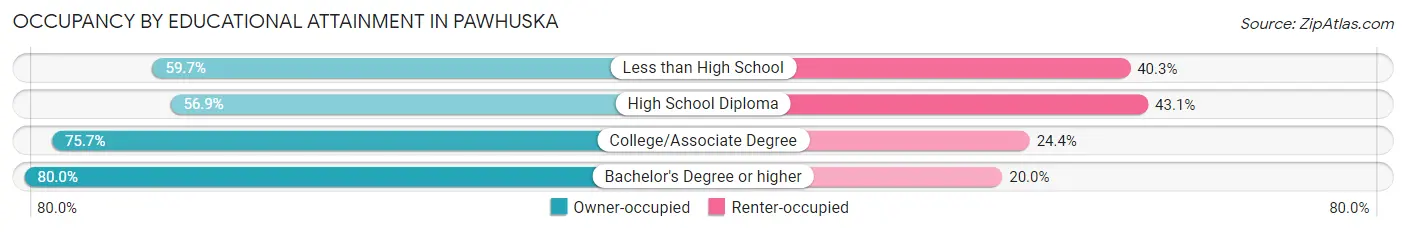
| Household Size | Owner-occupied | Renter-occupied |
| Less than High School | 80 (59.7%) | 54 (40.3%) |
| High School Diploma | 286 (56.9%) | 217 (43.1%) |
| College/Associate Degree | 289 (75.6%) | 93 (24.3%) |
| Bachelor's Degree or higher | 172 (80.0%) | 43 (20.0%) |
Occupancy by Age of Householder in Pawhuska
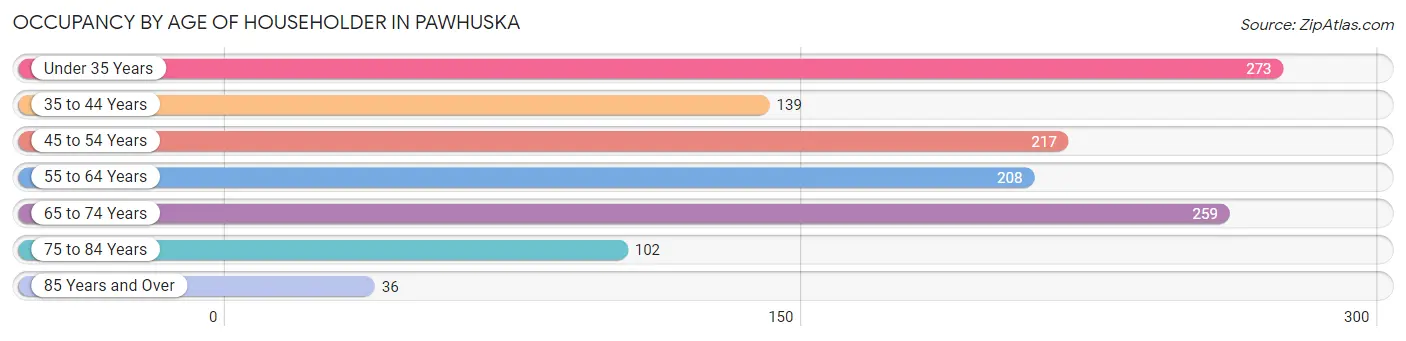
| Age Bracket | # Households | % Households |
| Under 35 Years | 273 | 22.1% |
| 35 to 44 Years | 139 | 11.3% |
| 45 to 54 Years | 217 | 17.6% |
| 55 to 64 Years | 208 | 16.9% |
| 65 to 74 Years | 259 | 21.0% |
| 75 to 84 Years | 102 | 8.3% |
| 85 Years and Over | 36 | 2.9% |
| Total | 1,234 | 100.0% |
Housing Finances in Pawhuska
Median Income by Occupancy in Pawhuska
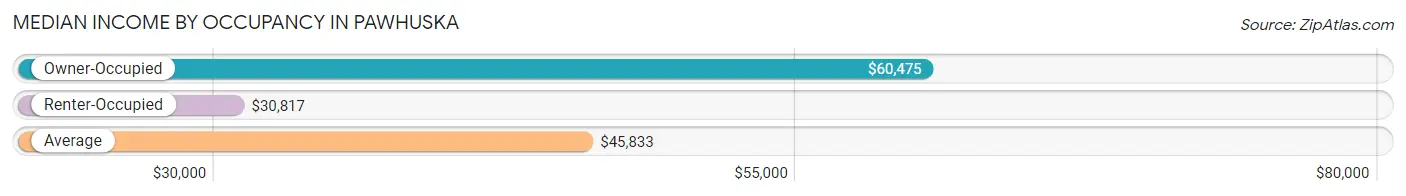
| Occupancy Type | # Households | Median Income |
| Owner-Occupied | 827 (67.0%) | $60,475 |
| Renter-Occupied | 407 (33.0%) | $30,817 |
| Average | 1,234 (100.0%) | $45,833 |
Occupancy by Householder Income Bracket in Pawhuska
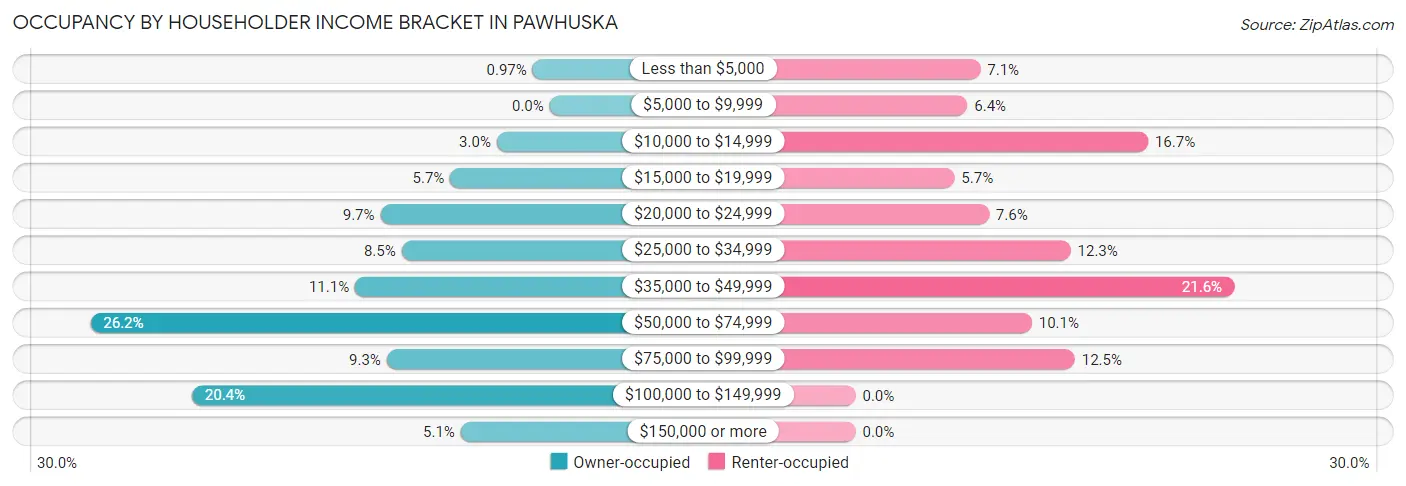
| Income Bracket | Owner-occupied | Renter-occupied |
| Less than $5,000 | 8 (1.0%) | 29 (7.1%) |
| $5,000 to $9,999 | 0 (0.0%) | 26 (6.4%) |
| $10,000 to $14,999 | 25 (3.0%) | 68 (16.7%) |
| $15,000 to $19,999 | 47 (5.7%) | 23 (5.7%) |
| $20,000 to $24,999 | 80 (9.7%) | 31 (7.6%) |
| $25,000 to $34,999 | 70 (8.5%) | 50 (12.3%) |
| $35,000 to $49,999 | 92 (11.1%) | 88 (21.6%) |
| $50,000 to $74,999 | 217 (26.2%) | 41 (10.1%) |
| $75,000 to $99,999 | 77 (9.3%) | 51 (12.5%) |
| $100,000 to $149,999 | 169 (20.4%) | 0 (0.0%) |
| $150,000 or more | 42 (5.1%) | 0 (0.0%) |
| Total | 827 (100.0%) | 407 (100.0%) |
Monthly Housing Cost Tiers in Pawhuska
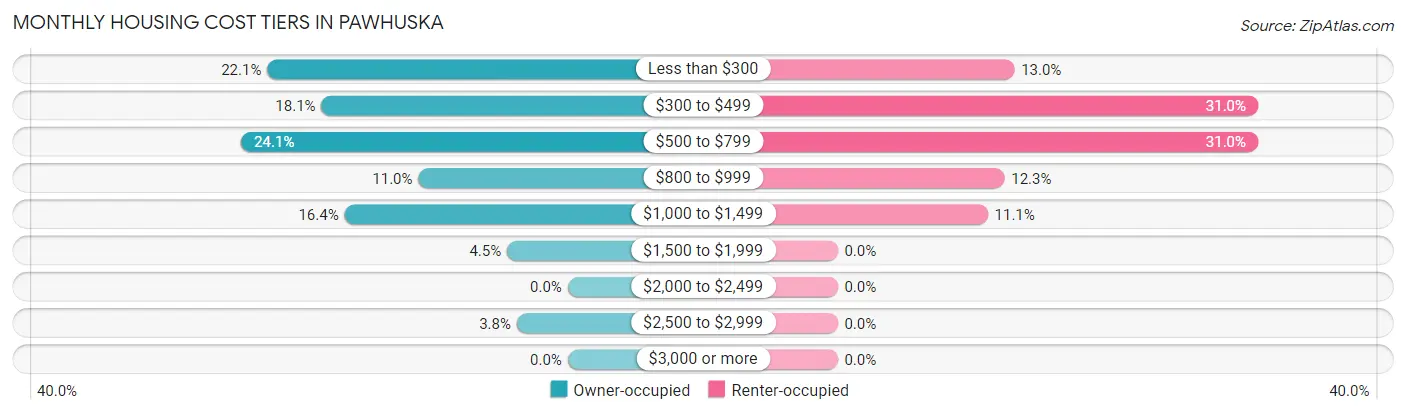
| Monthly Cost | Owner-occupied | Renter-occupied |
| Less than $300 | 183 (22.1%) | 53 (13.0%) |
| $300 to $499 | 150 (18.1%) | 126 (31.0%) |
| $500 to $799 | 199 (24.1%) | 126 (31.0%) |
| $800 to $999 | 91 (11.0%) | 50 (12.3%) |
| $1,000 to $1,499 | 136 (16.4%) | 45 (11.1%) |
| $1,500 to $1,999 | 37 (4.5%) | 0 (0.0%) |
| $2,000 to $2,499 | 0 (0.0%) | 0 (0.0%) |
| $2,500 to $2,999 | 31 (3.7%) | 0 (0.0%) |
| $3,000 or more | 0 (0.0%) | 0 (0.0%) |
| Total | 827 (100.0%) | 407 (100.0%) |
Physical Housing Characteristics in Pawhuska
Housing Structures in Pawhuska
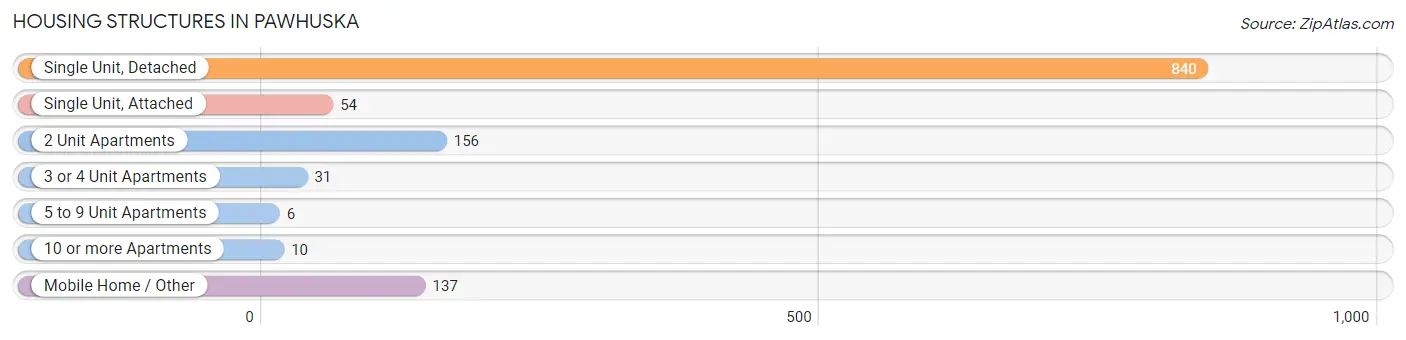
| Structure Type | # Housing Units | % Housing Units |
| Single Unit, Detached | 840 | 68.1% |
| Single Unit, Attached | 54 | 4.4% |
| 2 Unit Apartments | 156 | 12.6% |
| 3 or 4 Unit Apartments | 31 | 2.5% |
| 5 to 9 Unit Apartments | 6 | 0.5% |
| 10 or more Apartments | 10 | 0.8% |
| Mobile Home / Other | 137 | 11.1% |
| Total | 1,234 | 100.0% |
Housing Structures by Occupancy in Pawhuska
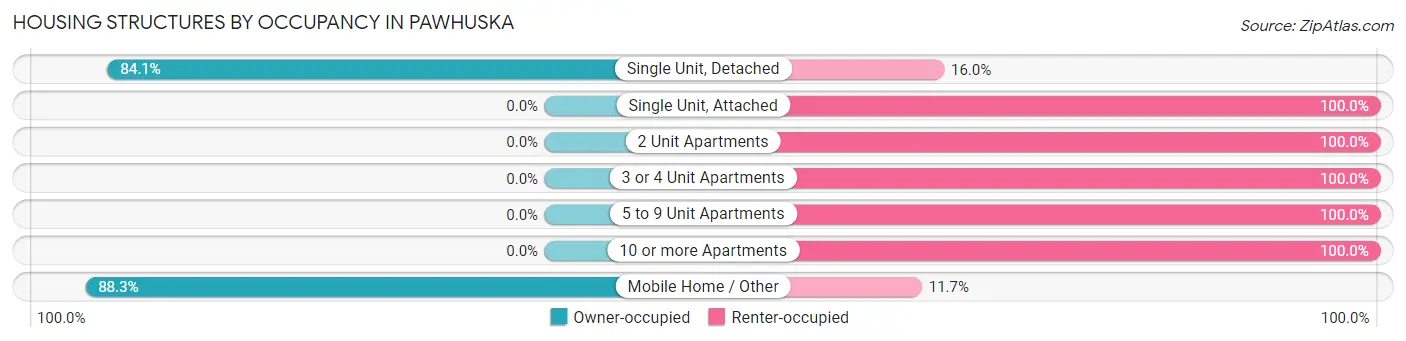
| Structure Type | Owner-occupied | Renter-occupied |
| Single Unit, Detached | 706 (84.1%) | 134 (16.0%) |
| Single Unit, Attached | 0 (0.0%) | 54 (100.0%) |
| 2 Unit Apartments | 0 (0.0%) | 156 (100.0%) |
| 3 or 4 Unit Apartments | 0 (0.0%) | 31 (100.0%) |
| 5 to 9 Unit Apartments | 0 (0.0%) | 6 (100.0%) |
| 10 or more Apartments | 0 (0.0%) | 10 (100.0%) |
| Mobile Home / Other | 121 (88.3%) | 16 (11.7%) |
| Total | 827 (67.0%) | 407 (33.0%) |
Housing Structures by Number of Rooms in Pawhuska
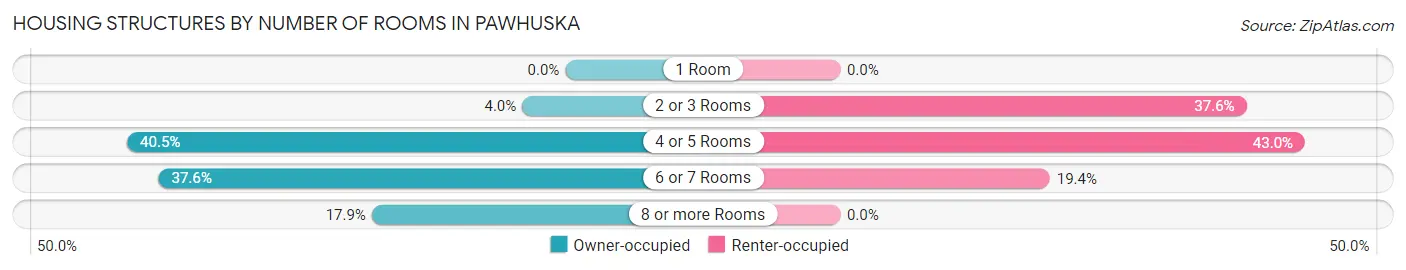
| Number of Rooms | Owner-occupied | Renter-occupied |
| 1 Room | 0 (0.0%) | 0 (0.0%) |
| 2 or 3 Rooms | 33 (4.0%) | 153 (37.6%) |
| 4 or 5 Rooms | 335 (40.5%) | 175 (43.0%) |
| 6 or 7 Rooms | 311 (37.6%) | 79 (19.4%) |
| 8 or more Rooms | 148 (17.9%) | 0 (0.0%) |
| Total | 827 (100.0%) | 407 (100.0%) |
Housing Structure by Heating Type in Pawhuska
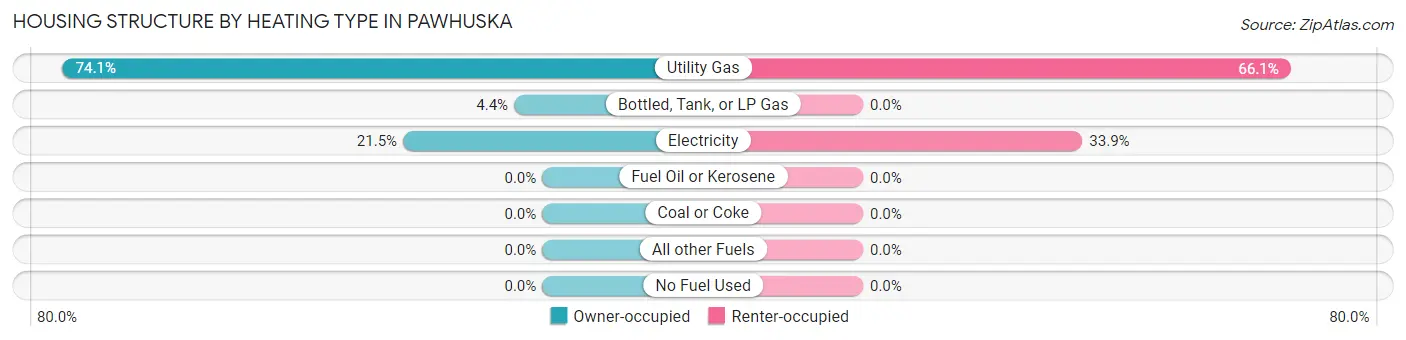
| Heating Type | Owner-occupied | Renter-occupied |
| Utility Gas | 613 (74.1%) | 269 (66.1%) |
| Bottled, Tank, or LP Gas | 36 (4.3%) | 0 (0.0%) |
| Electricity | 178 (21.5%) | 138 (33.9%) |
| Fuel Oil or Kerosene | 0 (0.0%) | 0 (0.0%) |
| Coal or Coke | 0 (0.0%) | 0 (0.0%) |
| All other Fuels | 0 (0.0%) | 0 (0.0%) |
| No Fuel Used | 0 (0.0%) | 0 (0.0%) |
| Total | 827 (100.0%) | 407 (100.0%) |
Household Vehicle Usage in Pawhuska
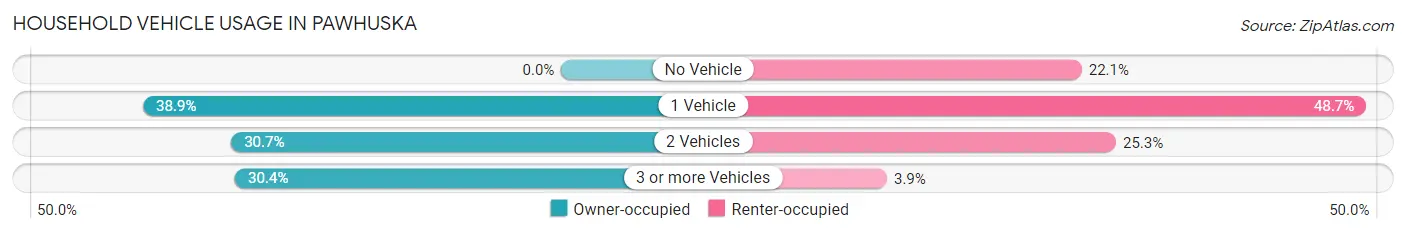
| Vehicles per Household | Owner-occupied | Renter-occupied |
| No Vehicle | 0 (0.0%) | 90 (22.1%) |
| 1 Vehicle | 322 (38.9%) | 198 (48.6%) |
| 2 Vehicles | 254 (30.7%) | 103 (25.3%) |
| 3 or more Vehicles | 251 (30.3%) | 16 (3.9%) |
| Total | 827 (100.0%) | 407 (100.0%) |
Real Estate & Mortgages in Pawhuska
Real Estate and Mortgage Overview in Pawhuska
| Characteristic | Without Mortgage | With Mortgage |
| Housing Units | 511 | 316 |
| Median Property Value | $58,400 | $110,800 |
| Median Household Income | $50,156 | $42 |
| Monthly Housing Costs | $388 | $0 |
| Real Estate Taxes | $437 | $9 |
Property Value by Mortgage Status in Pawhuska
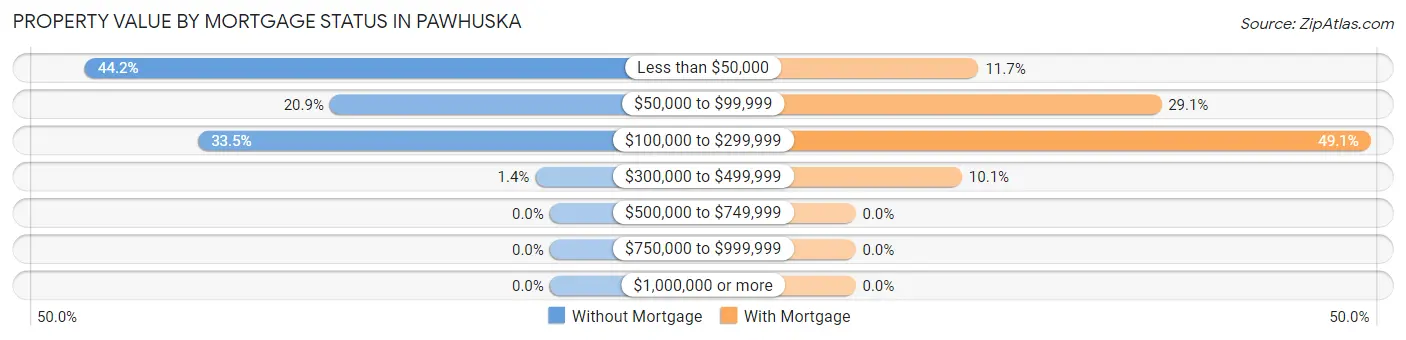
| Property Value | Without Mortgage | With Mortgage |
| Less than $50,000 | 226 (44.2%) | 37 (11.7%) |
| $50,000 to $99,999 | 107 (20.9%) | 92 (29.1%) |
| $100,000 to $299,999 | 171 (33.5%) | 155 (49.0%) |
| $300,000 to $499,999 | 7 (1.4%) | 32 (10.1%) |
| $500,000 to $749,999 | 0 (0.0%) | 0 (0.0%) |
| $750,000 to $999,999 | 0 (0.0%) | 0 (0.0%) |
| $1,000,000 or more | 0 (0.0%) | 0 (0.0%) |
| Total | 511 (100.0%) | 316 (100.0%) |
Household Income by Mortgage Status in Pawhuska
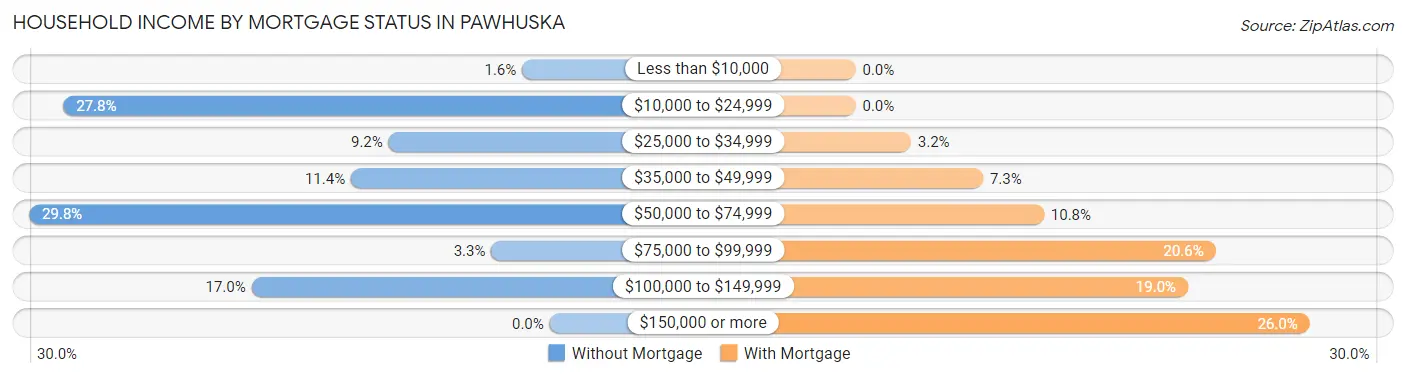
| Household Income | Without Mortgage | With Mortgage |
| Less than $10,000 | 8 (1.6%) | 0 (0.0%) |
| $10,000 to $24,999 | 142 (27.8%) | 0 (0.0%) |
| $25,000 to $34,999 | 47 (9.2%) | 10 (3.2%) |
| $35,000 to $49,999 | 58 (11.4%) | 23 (7.3%) |
| $50,000 to $74,999 | 152 (29.7%) | 34 (10.8%) |
| $75,000 to $99,999 | 17 (3.3%) | 65 (20.6%) |
| $100,000 to $149,999 | 87 (17.0%) | 60 (19.0%) |
| $150,000 or more | 0 (0.0%) | 82 (26.0%) |
| Total | 511 (100.0%) | 316 (100.0%) |
Property Value to Household Income Ratio in Pawhuska
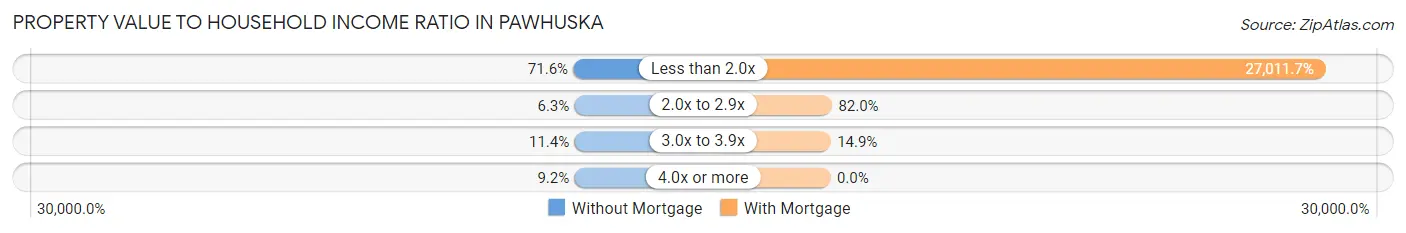
| Value-to-Income Ratio | Without Mortgage | With Mortgage |
| Less than 2.0x | 366 (71.6%) | 85,357 (27,011.7%) |
| 2.0x to 2.9x | 32 (6.3%) | 259 (82.0%) |
| 3.0x to 3.9x | 58 (11.4%) | 47 (14.9%) |
| 4.0x or more | 47 (9.2%) | 0 (0.0%) |
| Total | 511 (100.0%) | 316 (100.0%) |
Real Estate Taxes by Mortgage Status in Pawhuska
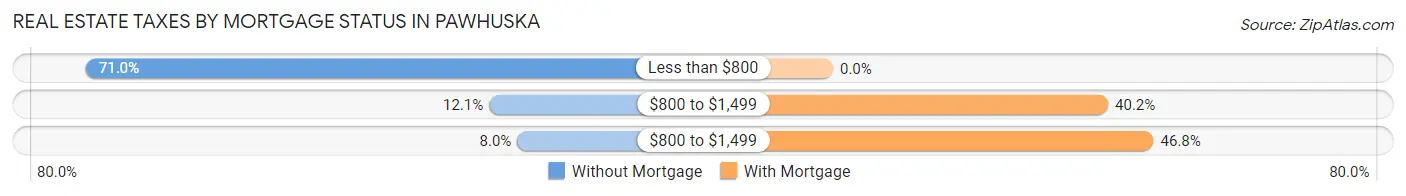
| Property Taxes | Without Mortgage | With Mortgage |
| Less than $800 | 363 (71.0%) | 0 (0.0%) |
| $800 to $1,499 | 62 (12.1%) | 127 (40.2%) |
| $800 to $1,499 | 41 (8.0%) | 148 (46.8%) |
| Total | 511 (100.0%) | 316 (100.0%) |
Health & Disability in Pawhuska
Health Insurance Coverage by Age in Pawhuska
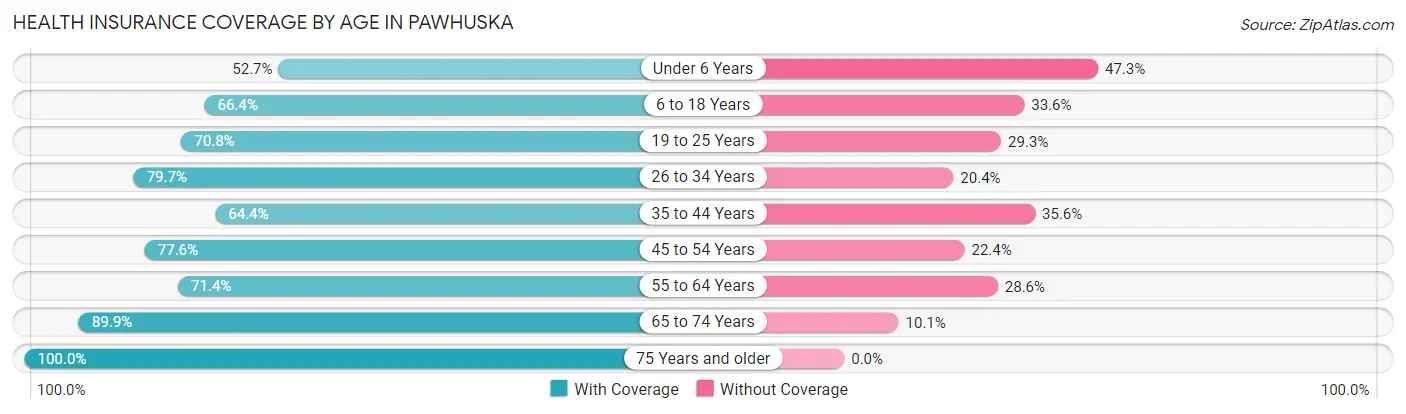
| Age Bracket | With Coverage | Without Coverage |
| Under 6 Years | 59 (52.7%) | 53 (47.3%) |
| 6 to 18 Years | 293 (66.4%) | 148 (33.6%) |
| 19 to 25 Years | 150 (70.8%) | 62 (29.2%) |
| 26 to 34 Years | 317 (79.6%) | 81 (20.3%) |
| 35 to 44 Years | 201 (64.4%) | 111 (35.6%) |
| 45 to 54 Years | 332 (77.6%) | 96 (22.4%) |
| 55 to 64 Years | 309 (71.4%) | 124 (28.6%) |
| 65 to 74 Years | 275 (89.9%) | 31 (10.1%) |
| 75 Years and older | 205 (100.0%) | 0 (0.0%) |
| Total | 2,141 (75.2%) | 706 (24.8%) |
Health Insurance Coverage by Citizenship Status in Pawhuska
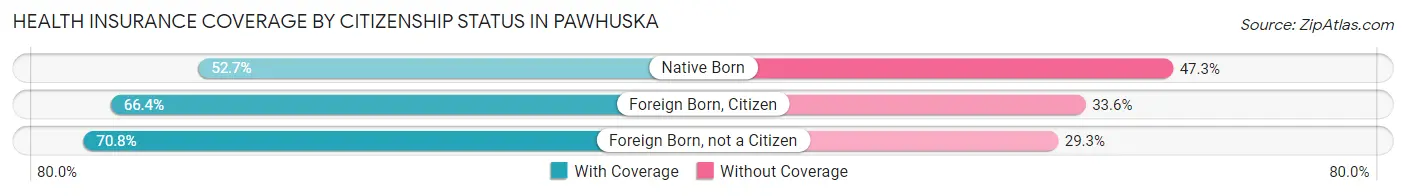
| Citizenship Status | With Coverage | Without Coverage |
| Native Born | 59 (52.7%) | 53 (47.3%) |
| Foreign Born, Citizen | 293 (66.4%) | 148 (33.6%) |
| Foreign Born, not a Citizen | 150 (70.8%) | 62 (29.2%) |
Health Insurance Coverage by Household Income in Pawhuska
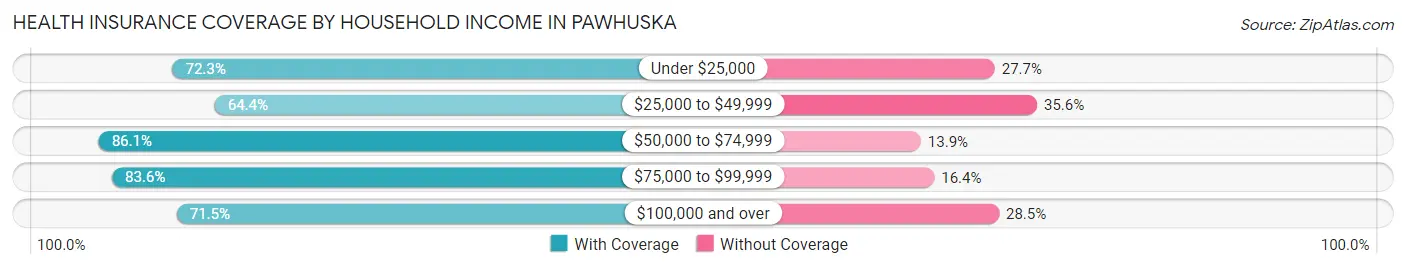
| Household Income | With Coverage | Without Coverage |
| Under $25,000 | 370 (72.3%) | 142 (27.7%) |
| $25,000 to $49,999 | 428 (64.4%) | 237 (35.6%) |
| $50,000 to $74,999 | 589 (86.1%) | 95 (13.9%) |
| $75,000 to $99,999 | 352 (83.6%) | 69 (16.4%) |
| $100,000 and over | 376 (71.5%) | 150 (28.5%) |
Public vs Private Health Insurance Coverage by Age in Pawhuska
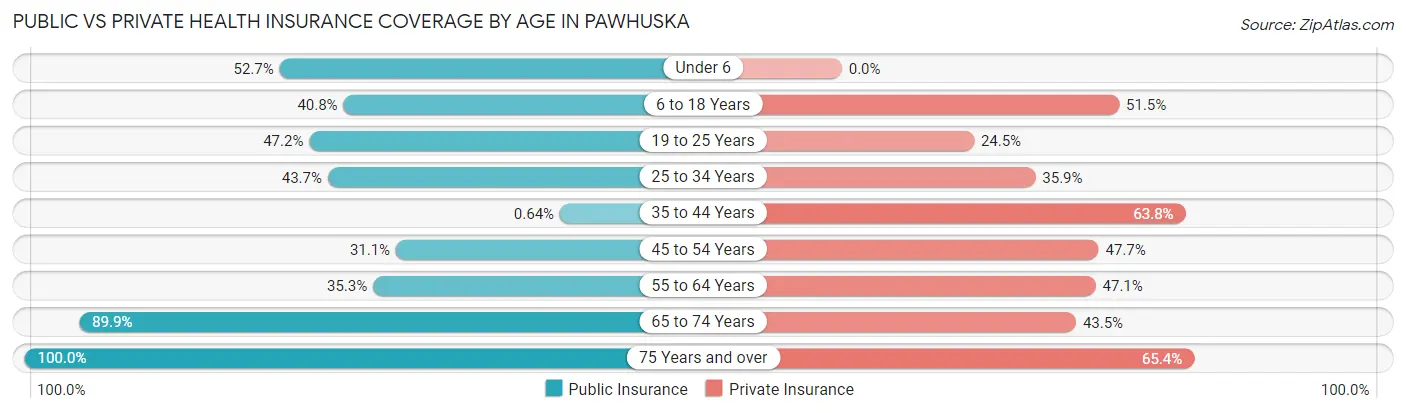
| Age Bracket | Public Insurance | Private Insurance |
| Under 6 | 59 (52.7%) | 0 (0.0%) |
| 6 to 18 Years | 180 (40.8%) | 227 (51.5%) |
| 19 to 25 Years | 100 (47.2%) | 52 (24.5%) |
| 25 to 34 Years | 174 (43.7%) | 143 (35.9%) |
| 35 to 44 Years | 2 (0.6%) | 199 (63.8%) |
| 45 to 54 Years | 133 (31.1%) | 204 (47.7%) |
| 55 to 64 Years | 153 (35.3%) | 204 (47.1%) |
| 65 to 74 Years | 275 (89.9%) | 133 (43.5%) |
| 75 Years and over | 205 (100.0%) | 134 (65.4%) |
| Total | 1,281 (45.0%) | 1,296 (45.5%) |
Disability Status by Sex by Age in Pawhuska
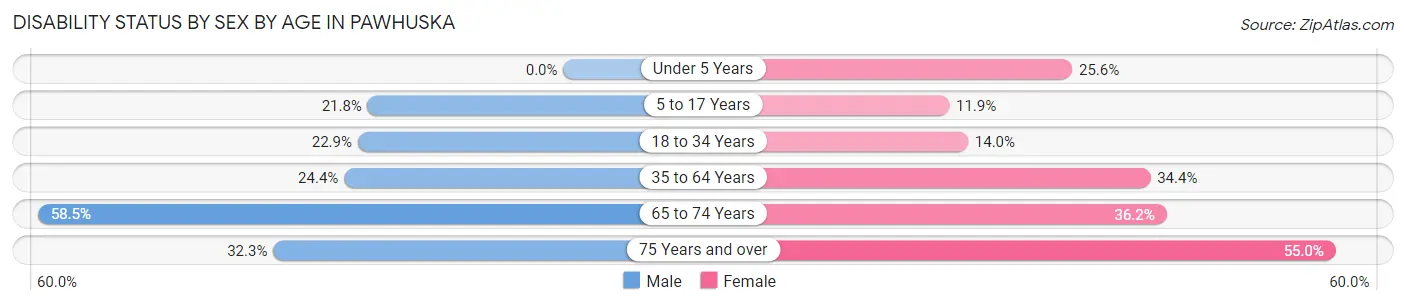
| Age Bracket | Male | Female |
| Under 5 Years | 0 (0.0%) | 10 (25.6%) |
| 5 to 17 Years | 51 (21.8%) | 24 (11.9%) |
| 18 to 34 Years | 84 (22.9%) | 41 (14.0%) |
| 35 to 64 Years | 135 (24.4%) | 213 (34.4%) |
| 65 to 74 Years | 48 (58.5%) | 81 (36.2%) |
| 75 Years and over | 21 (32.3%) | 77 (55.0%) |
Disability Class by Sex by Age in Pawhuska
Disability Class: Hearing Difficulty

| Age Bracket | Male | Female |
| Under 5 Years | 0 (0.0%) | 0 (0.0%) |
| 5 to 17 Years | 0 (0.0%) | 0 (0.0%) |
| 18 to 34 Years | 31 (8.5%) | 0 (0.0%) |
| 35 to 64 Years | 20 (3.6%) | 22 (3.5%) |
| 65 to 74 Years | 14 (17.1%) | 20 (8.9%) |
| 75 Years and over | 21 (32.3%) | 21 (15.0%) |
Disability Class: Vision Difficulty
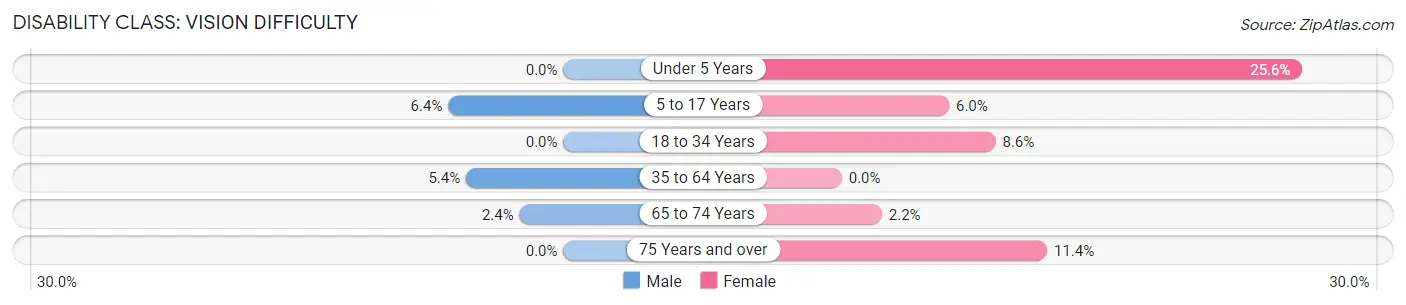
| Age Bracket | Male | Female |
| Under 5 Years | 0 (0.0%) | 10 (25.6%) |
| 5 to 17 Years | 15 (6.4%) | 12 (6.0%) |
| 18 to 34 Years | 0 (0.0%) | 25 (8.6%) |
| 35 to 64 Years | 30 (5.4%) | 0 (0.0%) |
| 65 to 74 Years | 2 (2.4%) | 5 (2.2%) |
| 75 Years and over | 0 (0.0%) | 16 (11.4%) |
Disability Class: Cognitive Difficulty
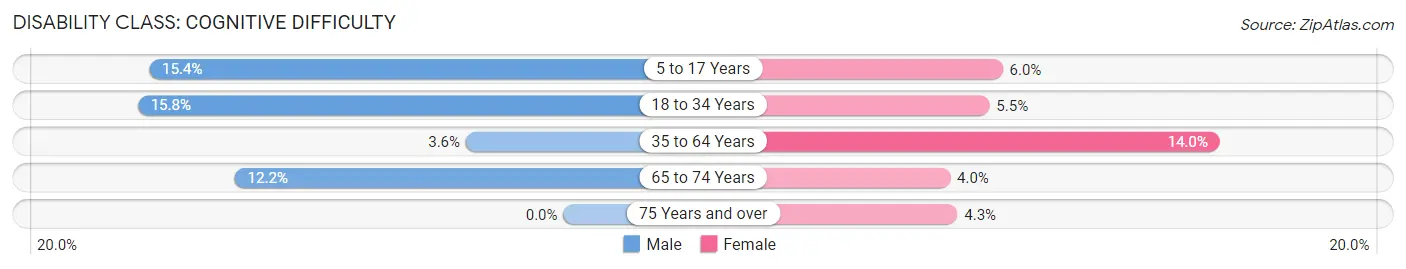
| Age Bracket | Male | Female |
| 5 to 17 Years | 36 (15.4%) | 12 (6.0%) |
| 18 to 34 Years | 58 (15.8%) | 16 (5.5%) |
| 35 to 64 Years | 20 (3.6%) | 87 (14.0%) |
| 65 to 74 Years | 10 (12.2%) | 9 (4.0%) |
| 75 Years and over | 0 (0.0%) | 6 (4.3%) |
Disability Class: Ambulatory Difficulty
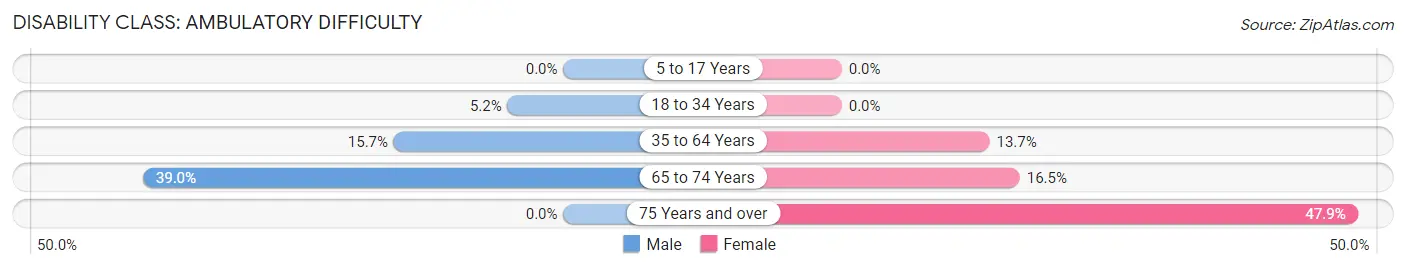
| Age Bracket | Male | Female |
| 5 to 17 Years | 0 (0.0%) | 0 (0.0%) |
| 18 to 34 Years | 19 (5.2%) | 0 (0.0%) |
| 35 to 64 Years | 87 (15.7%) | 85 (13.7%) |
| 65 to 74 Years | 32 (39.0%) | 37 (16.5%) |
| 75 Years and over | 0 (0.0%) | 67 (47.9%) |
Disability Class: Self-Care Difficulty
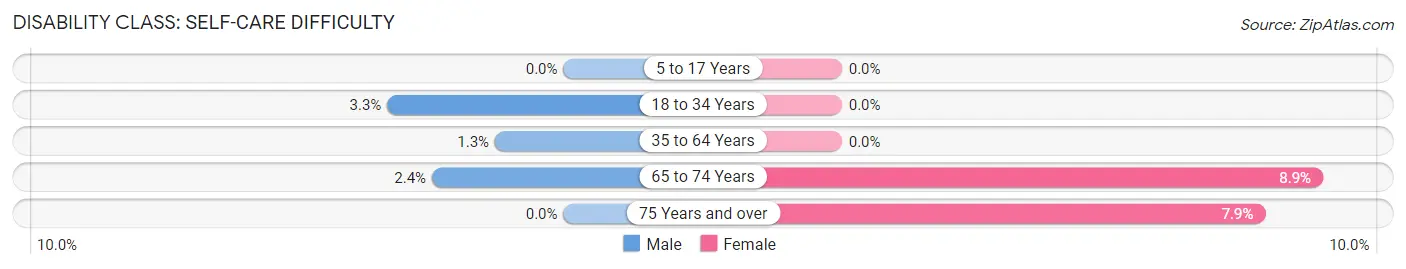
| Age Bracket | Male | Female |
| 5 to 17 Years | 0 (0.0%) | 0 (0.0%) |
| 18 to 34 Years | 12 (3.3%) | 0 (0.0%) |
| 35 to 64 Years | 7 (1.3%) | 0 (0.0%) |
| 65 to 74 Years | 2 (2.4%) | 20 (8.9%) |
| 75 Years and over | 0 (0.0%) | 11 (7.9%) |
Technology Access in Pawhuska
Computing Device Access in Pawhuska
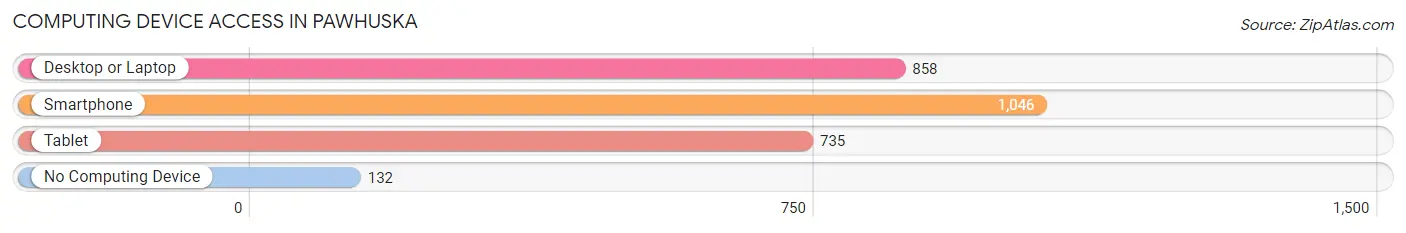
| Device Type | # Households | % Households |
| Desktop or Laptop | 858 | 69.5% |
| Smartphone | 1,046 | 84.8% |
| Tablet | 735 | 59.6% |
| No Computing Device | 132 | 10.7% |
| Total | 1,234 | 100.0% |
Internet Access in Pawhuska
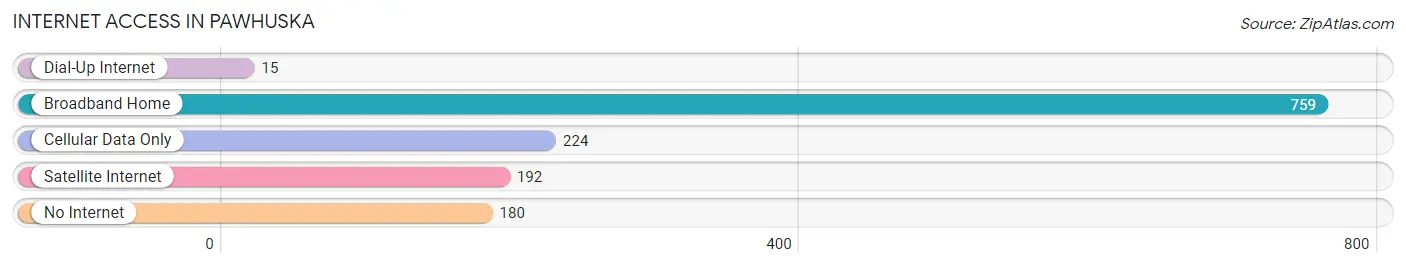
| Internet Type | # Households | % Households |
| Dial-Up Internet | 15 | 1.2% |
| Broadband Home | 759 | 61.5% |
| Cellular Data Only | 224 | 18.1% |
| Satellite Internet | 192 | 15.6% |
| No Internet | 180 | 14.6% |
| Total | 1,234 | 100.0% |
Pawhuska Summary
Pawhuska is a city located in Osage County, Oklahoma. It is the county seat of Osage County and is located approximately 60 miles northwest of Tulsa. The population of Pawhuska was 3,589 at the 2010 census, an increase of 7.4 percent from the 2000 census.
History
Pawhuska was founded in 1872 by the Osage Nation, who had been relocated to the area from their original homelands in Kansas. The city was named after Chief Paw-Hiu-Skah, a prominent leader of the Osage Nation. The city was incorporated in Indian Territory in 1878 and became the county seat of Osage County in 1907.
In the early 1900s, Pawhuska was a major center of the oil and gas industry in Oklahoma. The city was home to the first commercial oil well in the state, which was drilled in 1897. The city also became a major center for the cattle industry, with the first cattle drive in the state taking place in Pawhuska in 1892.
Geography
Pawhuska is located at 36°45'25" North, 96°20'17" West (36.756944, -96.338333). The city is situated in the Osage Plains region of Oklahoma, which is characterized by rolling hills and prairies. The city is located approximately 60 miles northwest of Tulsa and is bordered by the towns of Barnsdall, Hominy, and Fairfax.
The climate in Pawhuska is characterized by hot, humid summers and cold, dry winters. The average annual temperature is 61°F, with an average high of 79°F in July and an average low of 43°F in January. The average annual precipitation is 37.5 inches.
Economy
Pawhuska’s economy is largely based on agriculture and oil and gas production. The city is home to several large agricultural operations, including the Osage Nation’s cattle ranch, which is the largest in the state. The city is also home to several oil and gas production companies, including the Osage Oil and Gas Company, which is the largest producer in the state.
The city is also home to several manufacturing companies, including the Osage Manufacturing Company, which produces a variety of products, including furniture, clothing, and home goods. The city is also home to several retail stores, including the Osage Trading Post, which sells a variety of Native American-made goods.
Demographics
As of the 2010 census, the population of Pawhuska was 3,589, an increase of 7.4 percent from the 2000 census. The racial makeup of the city was 79.2 percent White, 15.2 percent Native American, 0.3 percent African American, 0.2 percent Asian, and 4.9 percent from other races. The median household income was $35,938, and the median family income was $41,944.
The city is home to several Native American tribes, including the Osage Nation, the Pawnee Nation, and the Kaw Nation. The city is also home to several churches, including the First United Methodist Church, the First Baptist Church, and the First Presbyterian Church.
Conclusion
Pawhuska is a city located in Osage County, Oklahoma. It is the county seat of Osage County and is located approximately 60 miles northwest of Tulsa. The city was founded in 1872 by the Osage Nation and has since become a major center for the oil and gas industry in Oklahoma. The city’s economy is largely based on agriculture and oil and gas production, and the population of Pawhuska was 3,589 at the 2010 census. The city is home to several Native American tribes, including the Osage Nation, the Pawnee Nation, and the Kaw Nation.
Common Questions
What is Per Capita Income in Pawhuska?
Per Capita income in Pawhuska is $24,792.
What is the Median Family Income in Pawhuska?
Median Family Income in Pawhuska is $61,350.
What is the Median Household income in Pawhuska?
Median Household Income in Pawhuska is $45,833.
What is Income or Wage Gap in Pawhuska?
Income or Wage Gap in Pawhuska is 15.7%.
Women in Pawhuska earn 84.3 cents for every dollar earned by a man.
What is Inequality or Gini Index in Pawhuska?
Inequality or Gini Index in Pawhuska is 0.41.
What is the Total Population of Pawhuska?
Total Population of Pawhuska is 3,009.
What is the Total Male Population of Pawhuska?
Total Male Population of Pawhuska is 1,484.
What is the Total Female Population of Pawhuska?
Total Female Population of Pawhuska is 1,525.
What is the Ratio of Males per 100 Females in Pawhuska?
There are 97.31 Males per 100 Females in Pawhuska.
What is the Ratio of Females per 100 Males in Pawhuska?
There are 102.76 Females per 100 Males in Pawhuska.
What is the Median Population Age in Pawhuska?
Median Population Age in Pawhuska is 43.9 Years.
What is the Average Family Size in Pawhuska
Average Family Size in Pawhuska is 3.2 People.
What is the Average Household Size in Pawhuska
Average Household Size in Pawhuska is 2.3 People.
How Large is the Labor Force in Pawhuska?
There are 1,420 People in the Labor Forcein in Pawhuska.
What is the Percentage of People in the Labor Force in Pawhuska?
55.5% of People are in the Labor Force in Pawhuska.
What is the Unemployment Rate in Pawhuska?
Unemployment Rate in Pawhuska is 2.7%.