Checotah, OK Map & Demographics
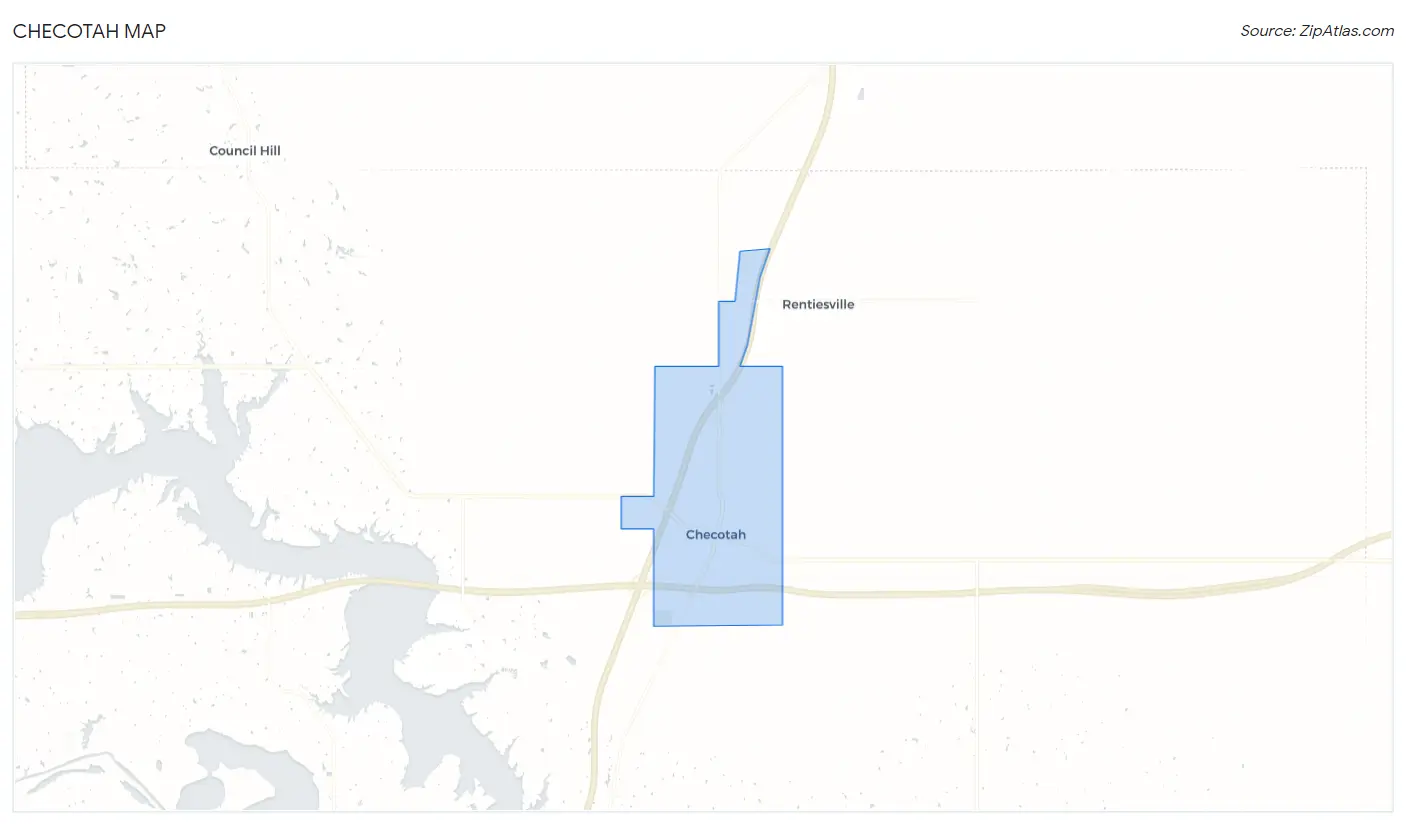
Checotah Map
Checotah Overview
$22,391
PER CAPITA INCOME
$46,985
AVG FAMILY INCOME
$36,208
AVG HOUSEHOLD INCOME
36.9%
WAGE / INCOME GAP [ % ]
63.1¢/ $1
WAGE / INCOME GAP [ $ ]
0.48
INEQUALITY / GINI INDEX
3,048
TOTAL POPULATION
1,347
MALE POPULATION
1,701
FEMALE POPULATION
79.19
MALES / 100 FEMALES
126.28
FEMALES / 100 MALES
40.4
MEDIAN AGE
3.1
AVG FAMILY SIZE
2.5
AVG HOUSEHOLD SIZE
1,171
LABOR FORCE [ PEOPLE ]
48.2%
PERCENT IN LABOR FORCE
9.4%
UNEMPLOYMENT RATE
Checotah Zip Codes
Checotah Area Codes
Income in Checotah
Income Overview in Checotah
Per Capita Income in Checotah is $22,391, while median incomes of families and households are $46,985 and $36,208 respectively.
| Characteristic | Number | Measure |
| Per Capita Income | 3,048 | $22,391 |
| Median Family Income | 758 | $46,985 |
| Mean Family Income | 758 | $65,209 |
| Median Household Income | 1,169 | $36,208 |
| Mean Household Income | 1,169 | $51,543 |
| Income Deficit | 758 | $0 |
| Wage / Income Gap (%) | 3,048 | 36.86% |
| Wage / Income Gap ($) | 3,048 | 63.14¢ per $1 |
| Gini / Inequality Index | 3,048 | 0.48 |
Earnings by Sex in Checotah
Average Earnings in Checotah are $28,194, $35,221 for men and $22,237 for women, a difference of 36.9%.
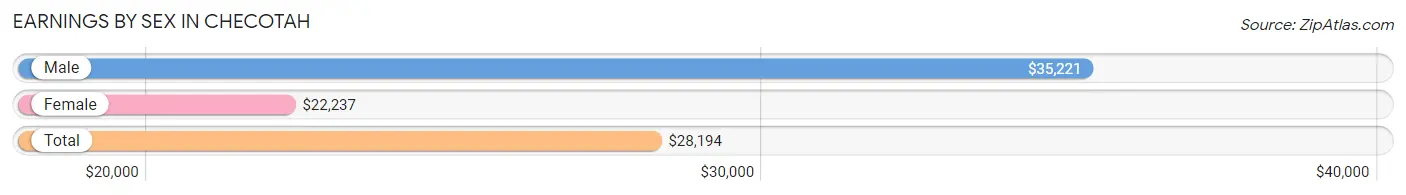
| Sex | Number | Average Earnings |
| Male | 525 (45.4%) | $35,221 |
| Female | 632 (54.6%) | $22,237 |
| Total | 1,157 (100.0%) | $28,194 |
Earnings by Sex by Income Bracket in Checotah
The most common earnings brackets in Checotah are $30,000 to $34,999 for men (72 | 13.7%) and $25,000 to $29,999 for women (77 | 12.2%).
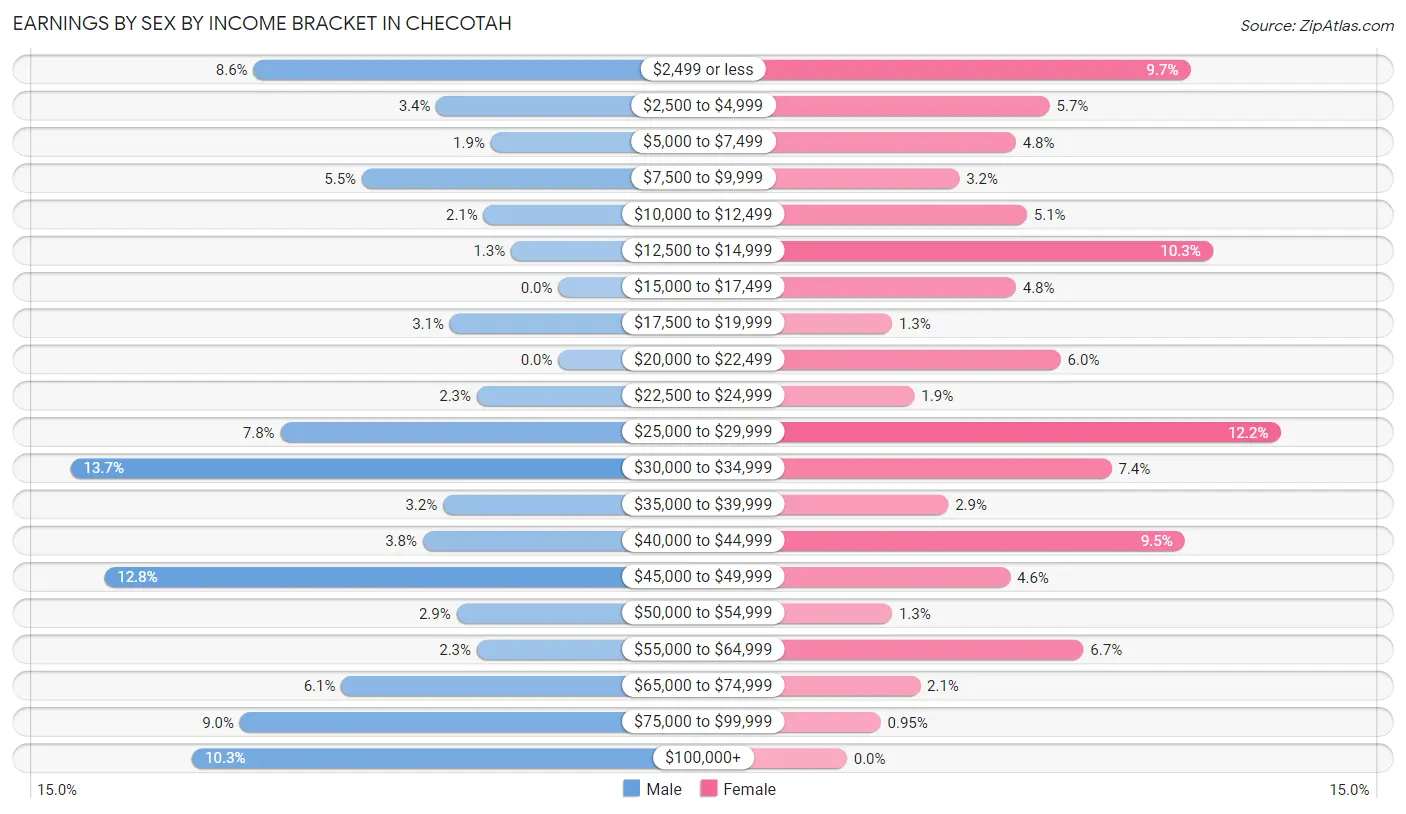
| Income | Male | Female |
| $2,499 or less | 45 (8.6%) | 61 (9.7%) |
| $2,500 to $4,999 | 18 (3.4%) | 36 (5.7%) |
| $5,000 to $7,499 | 10 (1.9%) | 30 (4.8%) |
| $7,500 to $9,999 | 29 (5.5%) | 20 (3.2%) |
| $10,000 to $12,499 | 11 (2.1%) | 32 (5.1%) |
| $12,500 to $14,999 | 7 (1.3%) | 65 (10.3%) |
| $15,000 to $17,499 | 0 (0.0%) | 30 (4.8%) |
| $17,500 to $19,999 | 16 (3.0%) | 8 (1.3%) |
| $20,000 to $22,499 | 0 (0.0%) | 38 (6.0%) |
| $22,500 to $24,999 | 12 (2.3%) | 12 (1.9%) |
| $25,000 to $29,999 | 41 (7.8%) | 77 (12.2%) |
| $30,000 to $34,999 | 72 (13.7%) | 47 (7.4%) |
| $35,000 to $39,999 | 17 (3.2%) | 18 (2.9%) |
| $40,000 to $44,999 | 20 (3.8%) | 60 (9.5%) |
| $45,000 to $49,999 | 67 (12.8%) | 29 (4.6%) |
| $50,000 to $54,999 | 15 (2.9%) | 8 (1.3%) |
| $55,000 to $64,999 | 12 (2.3%) | 42 (6.7%) |
| $65,000 to $74,999 | 32 (6.1%) | 13 (2.1%) |
| $75,000 to $99,999 | 47 (8.9%) | 6 (0.9%) |
| $100,000+ | 54 (10.3%) | 0 (0.0%) |
| Total | 525 (100.0%) | 632 (100.0%) |
Earnings by Sex by Educational Attainment in Checotah
Average earnings in Checotah are $36,029 for men and $25,511 for women, a difference of 29.2%. Men with an educational attainment of high school diploma enjoy the highest average annual earnings of $35,735, while those with college or associate's degree education earn the least with $34,310. Women with an educational attainment of graduate degree earn the most with the average annual earnings of $46,250, while those with high school diploma education have the smallest earnings of $15,208.
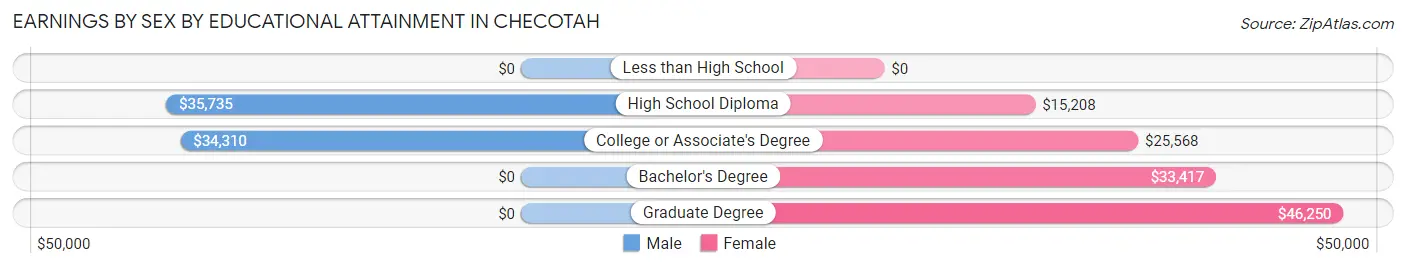
| Educational Attainment | Male Income | Female Income |
| Less than High School | - | - |
| High School Diploma | $35,735 | $15,208 |
| College or Associate's Degree | $34,310 | $25,568 |
| Bachelor's Degree | - | - |
| Graduate Degree | - | - |
| Total | $36,029 | $25,511 |
Family Income in Checotah
Family Income Brackets in Checotah
According to the Checotah family income data, there are 185 families falling into the $75,000 to $99,999 income range, which is the most common income bracket and makes up 24.4% of all families. Conversely, the $200,000+ income bracket is the least frequent group with only 8 families (1.1%) belonging to this category.
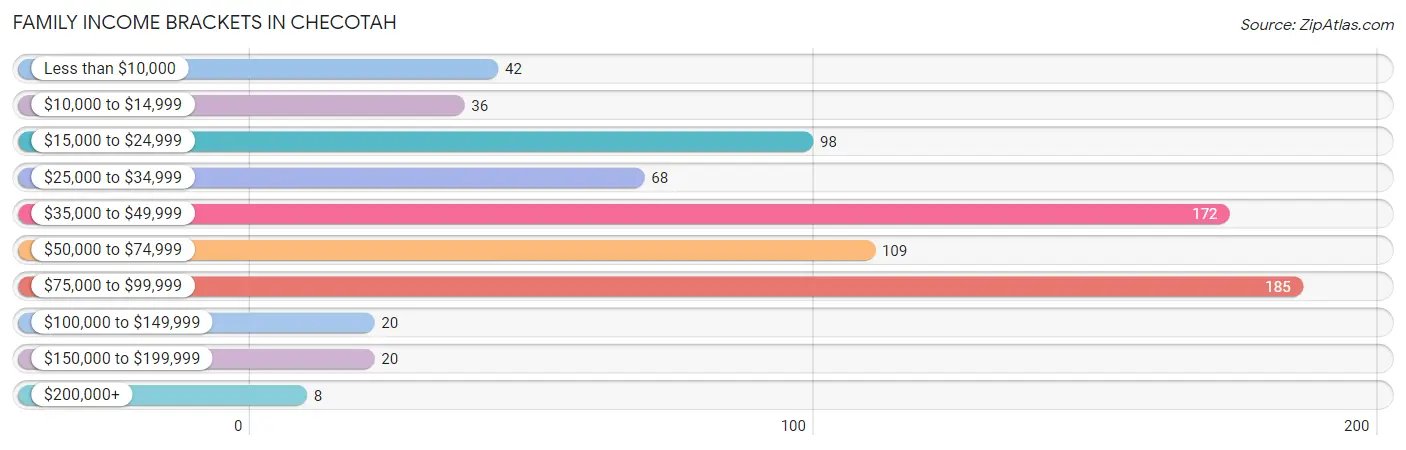
| Income Bracket | # Families | % Families |
| Less than $10,000 | 42 | 5.5% |
| $10,000 to $14,999 | 36 | 4.7% |
| $15,000 to $24,999 | 98 | 12.9% |
| $25,000 to $34,999 | 68 | 9.0% |
| $35,000 to $49,999 | 172 | 22.7% |
| $50,000 to $74,999 | 109 | 14.4% |
| $75,000 to $99,999 | 185 | 24.4% |
| $100,000 to $149,999 | 20 | 2.6% |
| $150,000 to $199,999 | 20 | 2.6% |
| $200,000+ | 8 | 1.1% |
Family Income by Famaliy Size in Checotah
5-person families (72 | 9.5%) account for the highest median family income in Checotah with $82,083 per family, while 2-person families (470 | 62.0%) have the highest median income of $22,678 per family member.
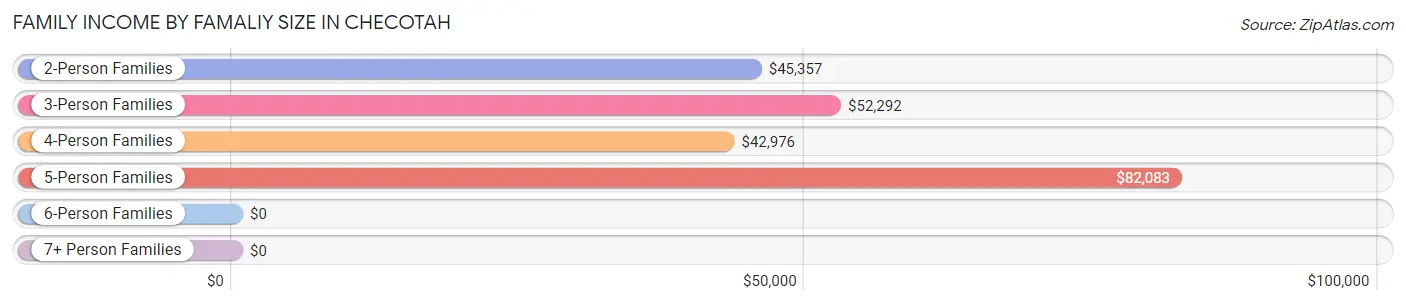
| Income Bracket | # Families | Median Income |
| 2-Person Families | 470 (62.0%) | $45,357 |
| 3-Person Families | 110 (14.5%) | $52,292 |
| 4-Person Families | 98 (12.9%) | $42,976 |
| 5-Person Families | 72 (9.5%) | $82,083 |
| 6-Person Families | 8 (1.1%) | $0 |
| 7+ Person Families | 0 (0.0%) | $0 |
| Total | 758 (100.0%) | $46,985 |
Family Income by Number of Earners in Checotah
The median family income in Checotah is $46,985, with families comprising 3+ earners (54) having the highest median family income of $88,365, while families with no earners (241) have the lowest median family income of $25,855, accounting for 7.1% and 31.8% of families, respectively.
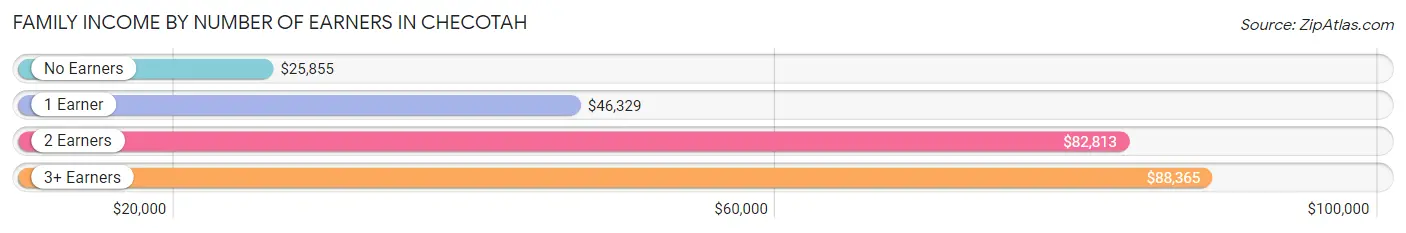
| Number of Earners | # Families | Median Income |
| No Earners | 241 (31.8%) | $25,855 |
| 1 Earner | 303 (40.0%) | $46,329 |
| 2 Earners | 160 (21.1%) | $82,813 |
| 3+ Earners | 54 (7.1%) | $88,365 |
| Total | 758 (100.0%) | $46,985 |
Household Income in Checotah
Household Income Brackets in Checotah
With 203 households falling in the category, the $75,000 to $99,999 income range is the most frequent in Checotah, accounting for 17.4% of all households. In contrast, only 8 households (0.7%) fall into the $200,000+ income bracket, making it the least populous group.
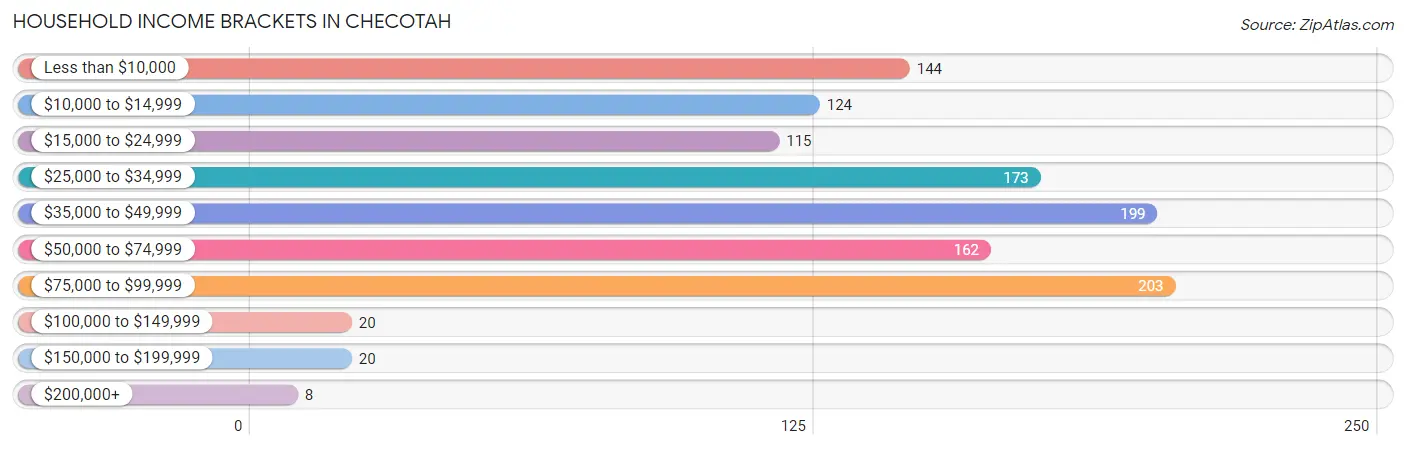
| Income Bracket | # Households | % Households |
| Less than $10,000 | 144 | 12.3% |
| $10,000 to $14,999 | 124 | 10.6% |
| $15,000 to $24,999 | 115 | 9.8% |
| $25,000 to $34,999 | 173 | 14.8% |
| $35,000 to $49,999 | 199 | 17.0% |
| $50,000 to $74,999 | 162 | 13.9% |
| $75,000 to $99,999 | 203 | 17.4% |
| $100,000 to $149,999 | 20 | 1.7% |
| $150,000 to $199,999 | 20 | 1.7% |
| $200,000+ | 8 | 0.7% |
Household Income by Householder Age in Checotah
The median household income in Checotah is $36,208, with the highest median household income of $48,750 found in the 15 to 24 years age bracket for the primary householder. A total of 42 households (3.6%) fall into this category. Meanwhile, the 45 to 64 years age bracket for the primary householder has the lowest median household income of $31,406, with 357 households (30.5%) in this group.
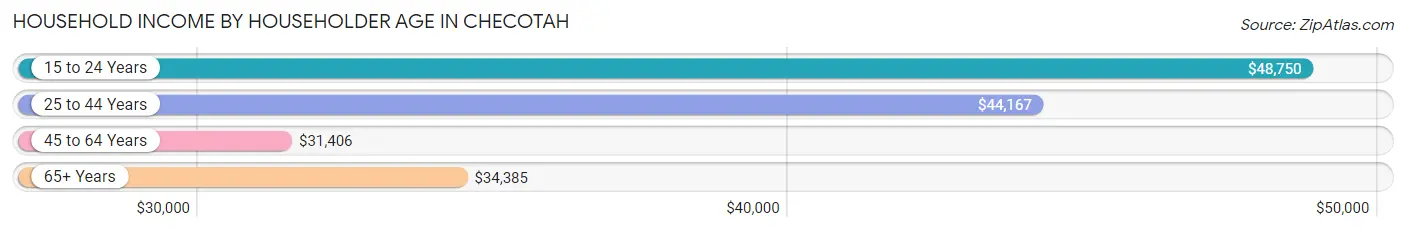
| Income Bracket | # Households | Median Income |
| 15 to 24 Years | 42 (3.6%) | $48,750 |
| 25 to 44 Years | 370 (31.7%) | $44,167 |
| 45 to 64 Years | 357 (30.5%) | $31,406 |
| 65+ Years | 400 (34.2%) | $34,385 |
| Total | 1,169 (100.0%) | $36,208 |
Poverty in Checotah
Income Below Poverty by Sex and Age in Checotah
With 18.7% poverty level for males and 25.3% for females among the residents of Checotah, 45 to 54 year old males and under 5 year old females are the most vulnerable to poverty, with 88 males (44.4%) and 63 females (53.8%) in their respective age groups living below the poverty level.
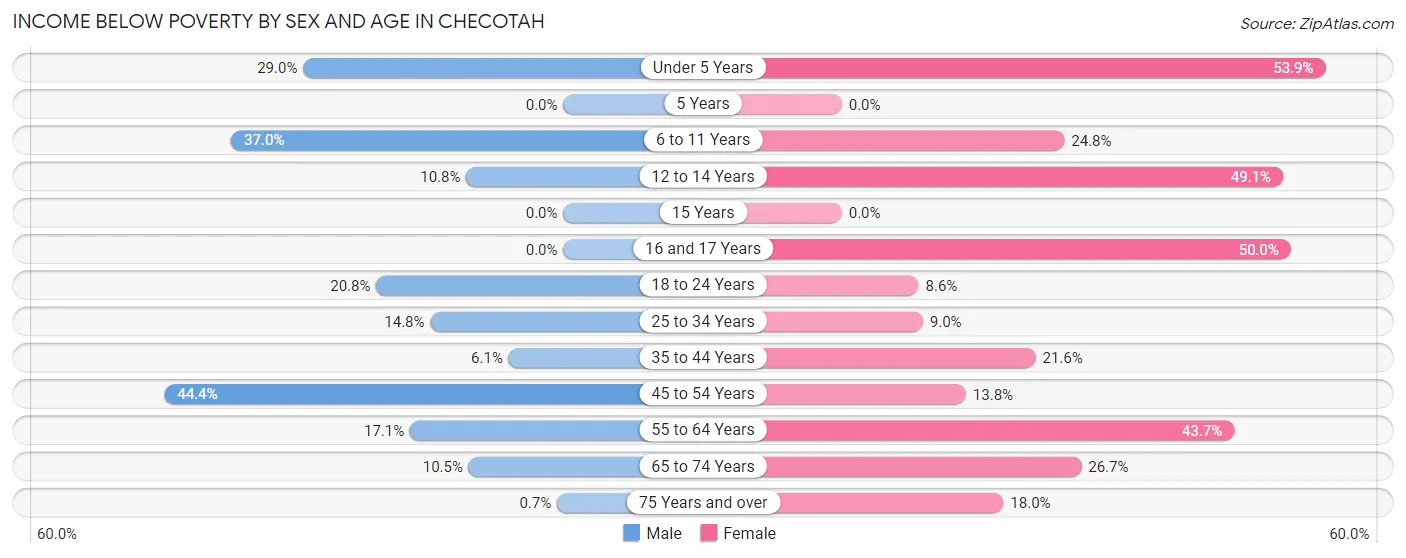
| Age Bracket | Male | Female |
| Under 5 Years | 31 (29.0%) | 63 (53.8%) |
| 5 Years | 0 (0.0%) | 0 (0.0%) |
| 6 to 11 Years | 27 (37.0%) | 28 (24.8%) |
| 12 to 14 Years | 8 (10.8%) | 28 (49.1%) |
| 15 Years | 0 (0.0%) | 0 (0.0%) |
| 16 and 17 Years | 0 (0.0%) | 18 (50.0%) |
| 18 to 24 Years | 15 (20.8%) | 10 (8.6%) |
| 25 to 34 Years | 24 (14.8%) | 29 (9.0%) |
| 35 to 44 Years | 11 (6.1%) | 30 (21.6%) |
| 45 to 54 Years | 88 (44.4%) | 21 (13.8%) |
| 55 to 64 Years | 28 (17.1%) | 121 (43.7%) |
| 65 to 74 Years | 16 (10.5%) | 44 (26.7%) |
| 75 Years and over | 1 (0.7%) | 18 (18.0%) |
| Total | 249 (18.7%) | 410 (25.3%) |
Income Above Poverty by Sex and Age in Checotah
According to the poverty statistics in Checotah, males aged 5 years and females aged 5 years are the age groups that are most secure financially, with 100.0% of males and 100.0% of females in these age groups living above the poverty line.
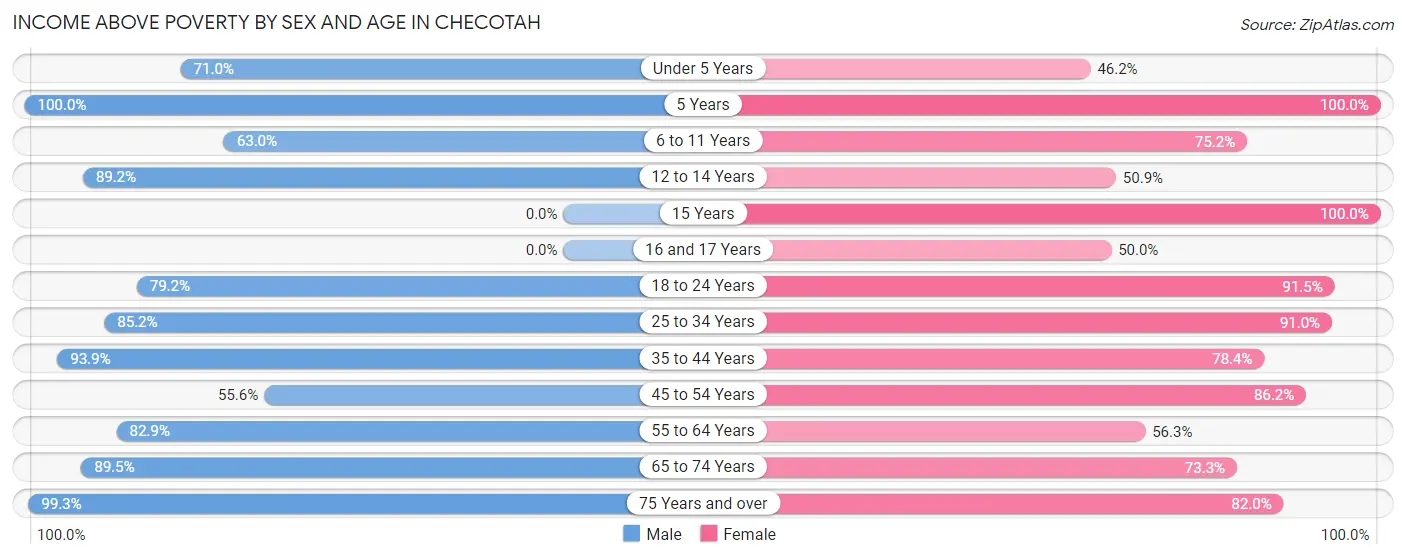
| Age Bracket | Male | Female |
| Under 5 Years | 76 (71.0%) | 54 (46.2%) |
| 5 Years | 7 (100.0%) | 10 (100.0%) |
| 6 to 11 Years | 46 (63.0%) | 85 (75.2%) |
| 12 to 14 Years | 66 (89.2%) | 29 (50.9%) |
| 15 Years | 0 (0.0%) | 20 (100.0%) |
| 16 and 17 Years | 0 (0.0%) | 18 (50.0%) |
| 18 to 24 Years | 57 (79.2%) | 107 (91.4%) |
| 25 to 34 Years | 138 (85.2%) | 292 (91.0%) |
| 35 to 44 Years | 170 (93.9%) | 109 (78.4%) |
| 45 to 54 Years | 110 (55.6%) | 131 (86.2%) |
| 55 to 64 Years | 136 (82.9%) | 156 (56.3%) |
| 65 to 74 Years | 136 (89.5%) | 121 (73.3%) |
| 75 Years and over | 141 (99.3%) | 82 (82.0%) |
| Total | 1,083 (81.3%) | 1,214 (74.8%) |
Income Below Poverty Among Married-Couple Families in Checotah
The poverty statistics for married-couple families in Checotah show that 0.5% or 2 of the total 388 families live below the poverty line. Families with no children have the highest poverty rate of 0.9%, comprising of 2 families. On the other hand, families with 1 or 2 children have the lowest poverty rate of 0.0%, which includes 0 families.
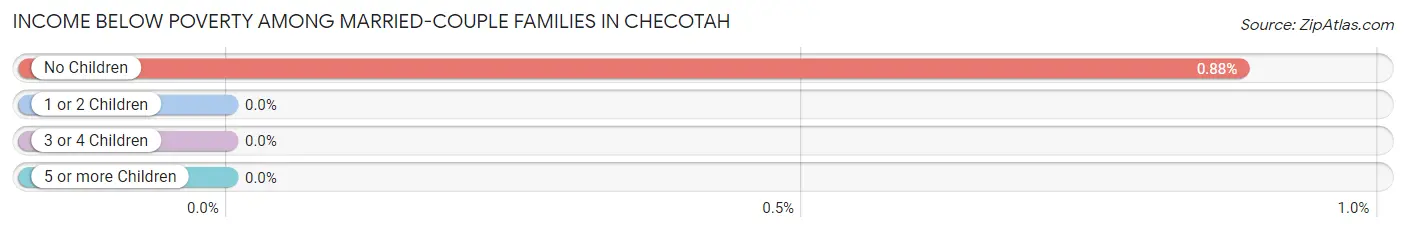
| Children | Above Poverty | Below Poverty |
| No Children | 225 (99.1%) | 2 (0.9%) |
| 1 or 2 Children | 137 (100.0%) | 0 (0.0%) |
| 3 or 4 Children | 24 (100.0%) | 0 (0.0%) |
| 5 or more Children | 0 (0.0%) | 0 (0.0%) |
| Total | 386 (99.5%) | 2 (0.5%) |
Income Below Poverty Among Single-Parent Households in Checotah
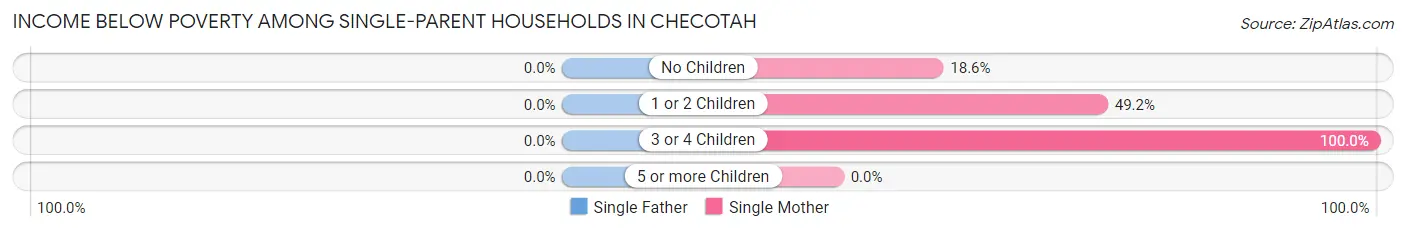
| Children | Single Father | Single Mother |
| No Children | 0 (0.0%) | 13 (18.6%) |
| 1 or 2 Children | 0 (0.0%) | 61 (49.2%) |
| 3 or 4 Children | 0 (0.0%) | 12 (100.0%) |
| 5 or more Children | 0 (0.0%) | 0 (0.0%) |
| Total | 0 (0.0%) | 86 (41.7%) |
Income Below Poverty Among Married-Couple vs Single-Parent Households in Checotah
The poverty data for Checotah shows that 2 of the married-couple family households (0.5%) and 86 of the single-parent households (23.2%) are living below the poverty level. Within the married-couple family households, those with no children have the highest poverty rate, with 2 households (0.9%) falling below the poverty line. Among the single-parent households, those with 3 or 4 children have the highest poverty rate, with 12 household (44.4%) living below poverty.
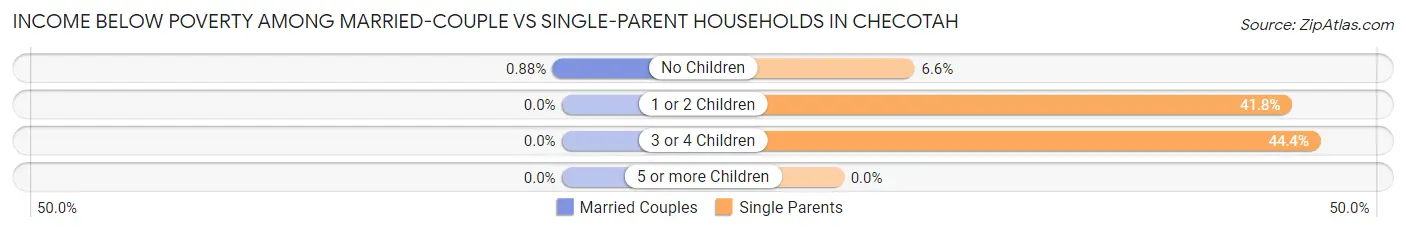
| Children | Married-Couple Families | Single-Parent Households |
| No Children | 2 (0.9%) | 13 (6.6%) |
| 1 or 2 Children | 0 (0.0%) | 61 (41.8%) |
| 3 or 4 Children | 0 (0.0%) | 12 (44.4%) |
| 5 or more Children | 0 (0.0%) | 0 (0.0%) |
| Total | 2 (0.5%) | 86 (23.2%) |
Race in Checotah
The most populous races in Checotah are White / Caucasian (1,602 | 52.6%), Native / Alaskan (614 | 20.1%), and Two or more Races (553 | 18.1%).
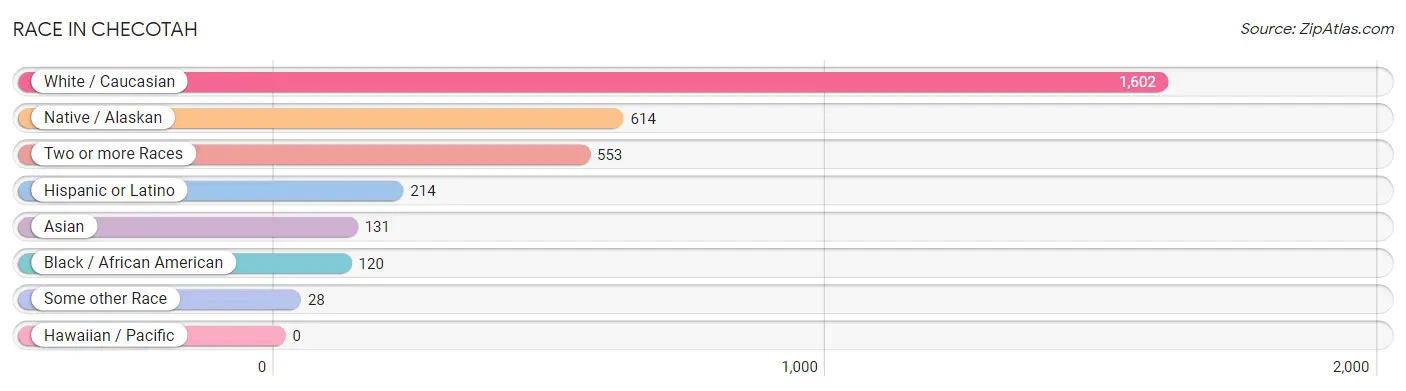
| Race | # Population | % Population |
| Asian | 131 | 4.3% |
| Black / African American | 120 | 3.9% |
| Hawaiian / Pacific | 0 | 0.0% |
| Hispanic or Latino | 214 | 7.0% |
| Native / Alaskan | 614 | 20.1% |
| White / Caucasian | 1,602 | 52.6% |
| Two or more Races | 553 | 18.1% |
| Some other Race | 28 | 0.9% |
| Total | 3,048 | 100.0% |
Ancestry in Checotah
The most populous ancestries reported in Checotah are Creek (477 | 15.7%), Cherokee (407 | 13.4%), German (369 | 12.1%), Irish (282 | 9.2%), and Mexican (214 | 7.0%), together accounting for 57.4% of all Checotah residents.
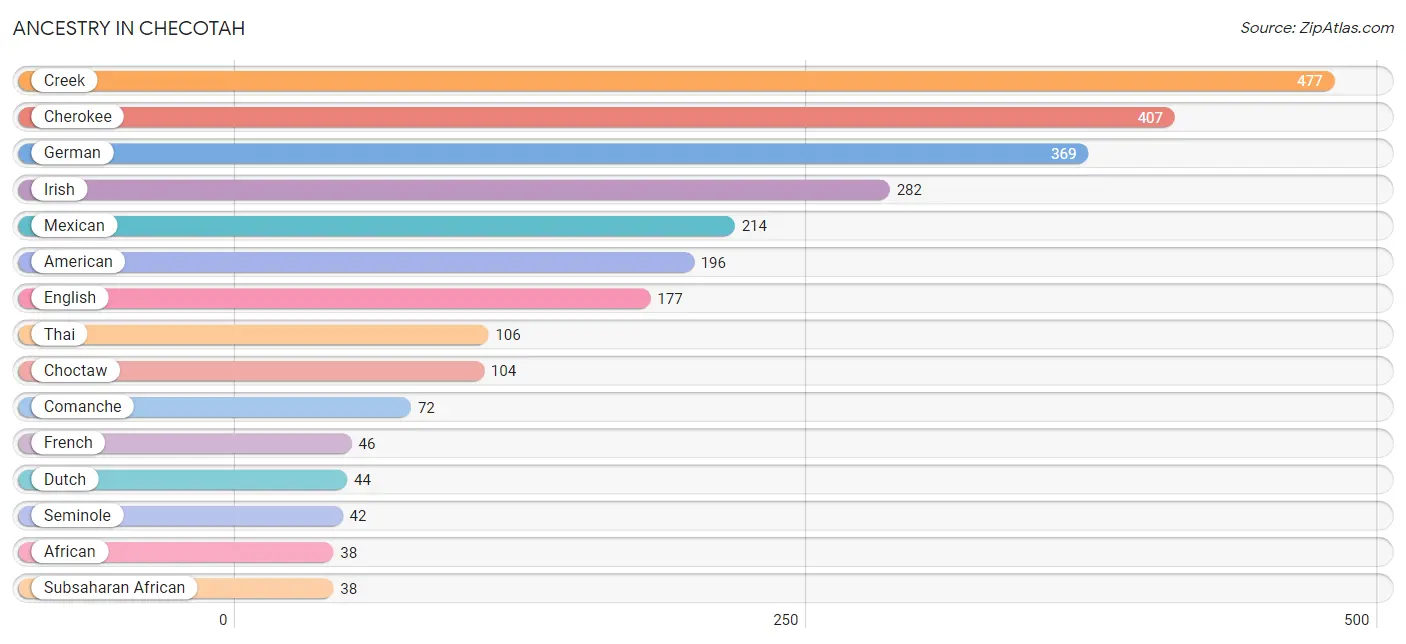
| Ancestry | # Population | % Population |
| African | 38 | 1.3% |
| American | 196 | 6.4% |
| Cherokee | 407 | 13.4% |
| Choctaw | 104 | 3.4% |
| Comanche | 72 | 2.4% |
| Creek | 477 | 15.7% |
| Czech | 12 | 0.4% |
| Dutch | 44 | 1.4% |
| Dutch West Indian | 6 | 0.2% |
| English | 177 | 5.8% |
| European | 27 | 0.9% |
| French | 46 | 1.5% |
| German | 369 | 12.1% |
| Indian (Asian) | 25 | 0.8% |
| Irish | 282 | 9.2% |
| Italian | 23 | 0.7% |
| Mexican | 214 | 7.0% |
| Polish | 15 | 0.5% |
| Portuguese | 9 | 0.3% |
| Scottish | 11 | 0.4% |
| Seminole | 42 | 1.4% |
| Subsaharan African | 38 | 1.3% |
| Swedish | 12 | 0.4% |
| Thai | 106 | 3.5% |
| Turkish | 6 | 0.2% |
| Welsh | 7 | 0.2% | View All 26 Rows |
Immigrants in Checotah
The most numerous immigrant groups reported in Checotah came from Central America (59 | 1.9%), Latin America (59 | 1.9%), Mexico (59 | 1.9%), Asia (14 | 0.5%), and South Eastern Asia (8 | 0.3%), together accounting for 6.5% of all Checotah residents.
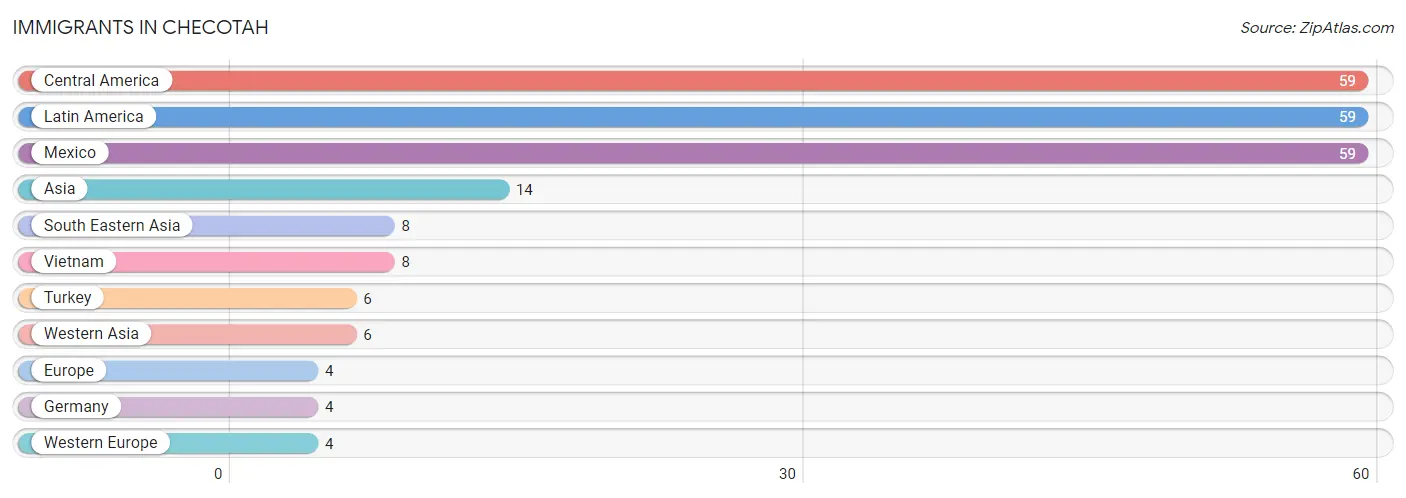
| Immigration Origin | # Population | % Population |
| Asia | 14 | 0.5% |
| Central America | 59 | 1.9% |
| Europe | 4 | 0.1% |
| Germany | 4 | 0.1% |
| Latin America | 59 | 1.9% |
| Mexico | 59 | 1.9% |
| South Eastern Asia | 8 | 0.3% |
| Turkey | 6 | 0.2% |
| Vietnam | 8 | 0.3% |
| Western Asia | 6 | 0.2% |
| Western Europe | 4 | 0.1% | View All 11 Rows |
Sex and Age in Checotah
Sex and Age in Checotah
The most populous age groups in Checotah are 65 to 69 Years (119 | 8.8%) for men and 25 to 29 Years (165 | 9.7%) for women.
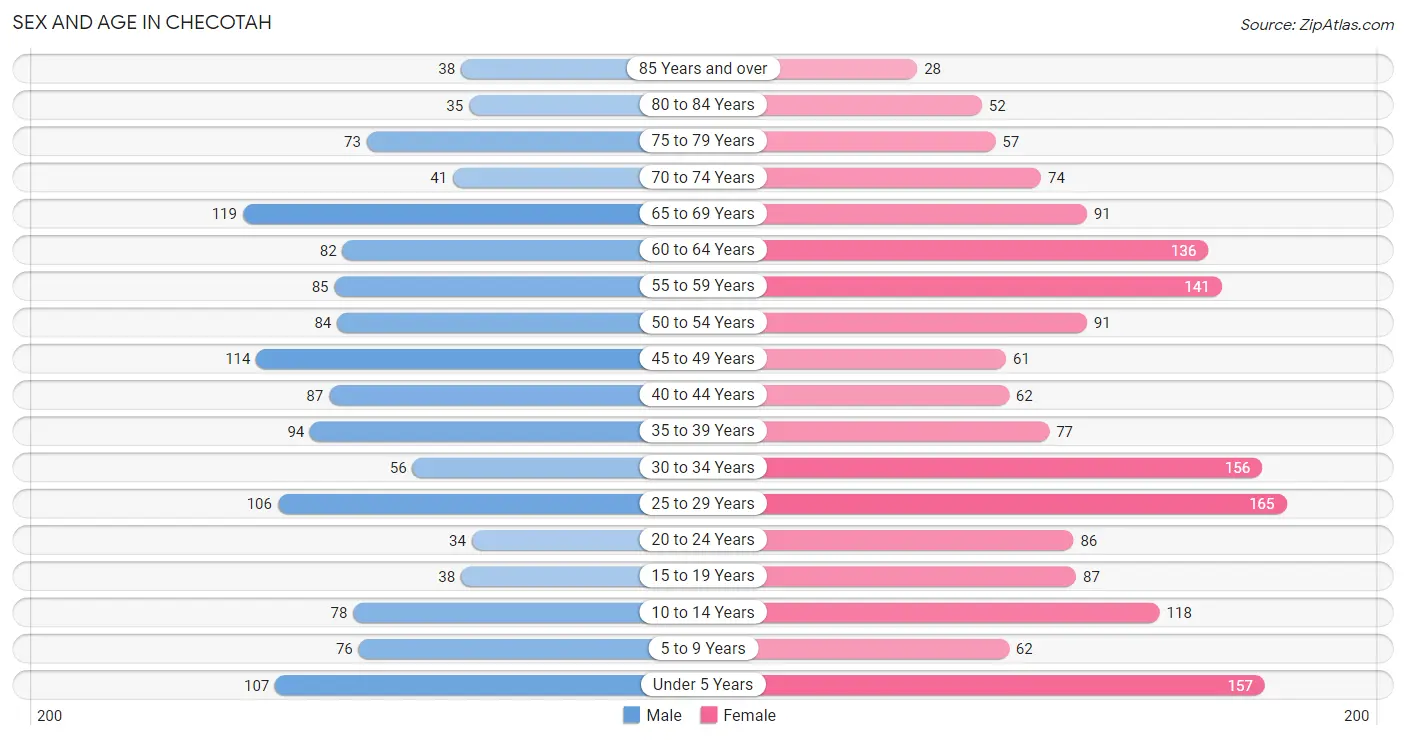
| Age Bracket | Male | Female |
| Under 5 Years | 107 (7.9%) | 157 (9.2%) |
| 5 to 9 Years | 76 (5.6%) | 62 (3.6%) |
| 10 to 14 Years | 78 (5.8%) | 118 (6.9%) |
| 15 to 19 Years | 38 (2.8%) | 87 (5.1%) |
| 20 to 24 Years | 34 (2.5%) | 86 (5.1%) |
| 25 to 29 Years | 106 (7.9%) | 165 (9.7%) |
| 30 to 34 Years | 56 (4.2%) | 156 (9.2%) |
| 35 to 39 Years | 94 (7.0%) | 77 (4.5%) |
| 40 to 44 Years | 87 (6.5%) | 62 (3.6%) |
| 45 to 49 Years | 114 (8.5%) | 61 (3.6%) |
| 50 to 54 Years | 84 (6.2%) | 91 (5.3%) |
| 55 to 59 Years | 85 (6.3%) | 141 (8.3%) |
| 60 to 64 Years | 82 (6.1%) | 136 (8.0%) |
| 65 to 69 Years | 119 (8.8%) | 91 (5.3%) |
| 70 to 74 Years | 41 (3.0%) | 74 (4.3%) |
| 75 to 79 Years | 73 (5.4%) | 57 (3.4%) |
| 80 to 84 Years | 35 (2.6%) | 52 (3.1%) |
| 85 Years and over | 38 (2.8%) | 28 (1.7%) |
| Total | 1,347 (100.0%) | 1,701 (100.0%) |
Families and Households in Checotah
Median Family Size in Checotah
The median family size in Checotah is 3.15 persons per family, with single female/mother families (206 | 27.2%) accounting for the largest median family size of 4.13 persons per family. On the other hand, married-couple families (388 | 51.2%) represent the smallest median family size with 2.69 persons per family.
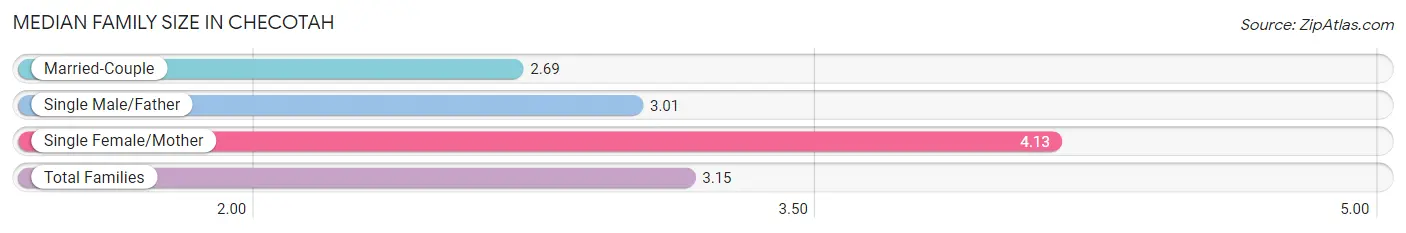
| Family Type | # Families | Family Size |
| Married-Couple | 388 (51.2%) | 2.69 |
| Single Male/Father | 164 (21.6%) | 3.01 |
| Single Female/Mother | 206 (27.2%) | 4.13 |
| Total Families | 758 (100.0%) | 3.15 |
Median Household Size in Checotah
The median household size in Checotah is 2.54 persons per household, with single female/mother households (206 | 17.6%) accounting for the largest median household size of 4.29 persons per household. non-family households (411 | 35.2%) represent the smallest median household size with 1.23 persons per household.
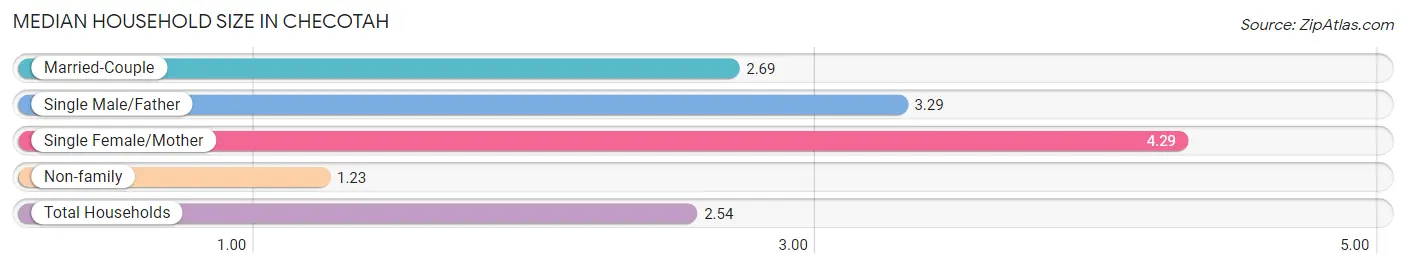
| Household Type | # Households | Household Size |
| Married-Couple | 388 (33.2%) | 2.69 |
| Single Male/Father | 164 (14.0%) | 3.29 |
| Single Female/Mother | 206 (17.6%) | 4.29 |
| Non-family | 411 (35.2%) | 1.23 |
| Total Households | 1,169 (100.0%) | 2.54 |
Household Size by Marriage Status in Checotah
Out of a total of 1,169 households in Checotah, 758 (64.8%) are family households, while 411 (35.2%) are nonfamily households. The most numerous type of family households are 2-person households, comprising 381, and the most common type of nonfamily households are 1-person households, comprising 375.
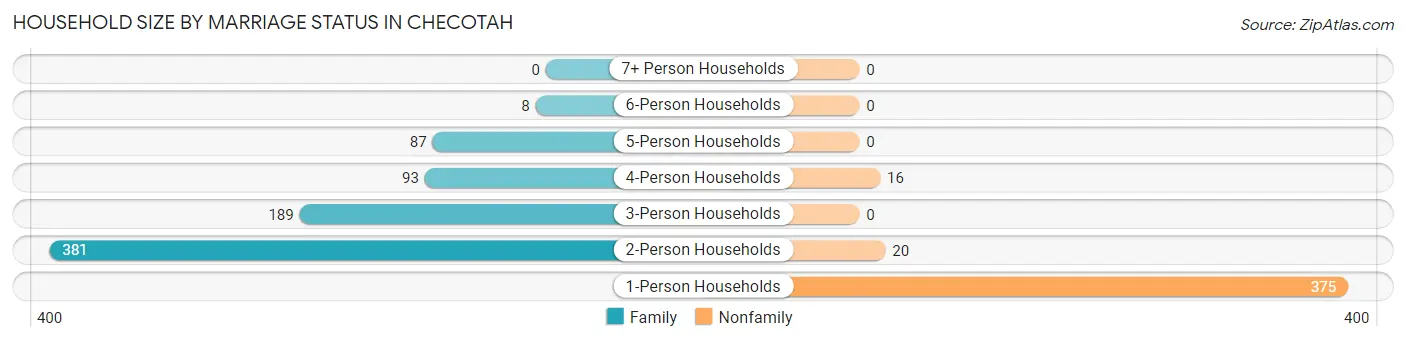
| Household Size | Family Households | Nonfamily Households |
| 1-Person Households | - | 375 (32.1%) |
| 2-Person Households | 381 (32.6%) | 20 (1.7%) |
| 3-Person Households | 189 (16.2%) | 0 (0.0%) |
| 4-Person Households | 93 (8.0%) | 16 (1.4%) |
| 5-Person Households | 87 (7.4%) | 0 (0.0%) |
| 6-Person Households | 8 (0.7%) | 0 (0.0%) |
| 7+ Person Households | 0 (0.0%) | 0 (0.0%) |
| Total | 758 (64.8%) | 411 (35.2%) |
Female Fertility in Checotah
Fertility by Age in Checotah
Average fertility rate in Checotah is 20.0 births per 1,000 women. Women in the age bracket of 20 to 34 years have the highest fertility rate with 37.0 births per 1,000 women. Women in the age bracket of 20 to 34 years acount for 100.0% of all women with births.
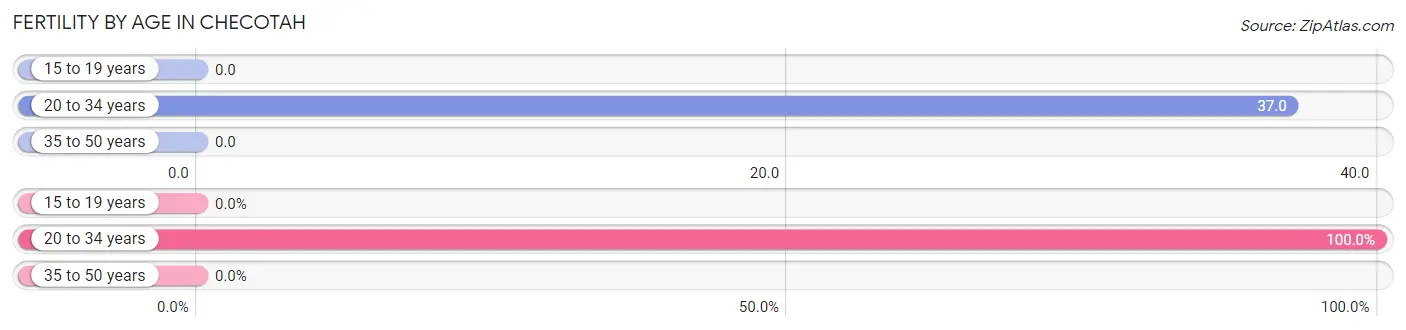
| Age Bracket | Women with Births | Births / 1,000 Women |
| 15 to 19 years | 0 (0.0%) | 0.0 |
| 20 to 34 years | 15 (100.0%) | 37.0 |
| 35 to 50 years | 0 (0.0%) | 0.0 |
| Total | 15 (100.0%) | 20.0 |
Fertility by Age by Marriage Status in Checotah
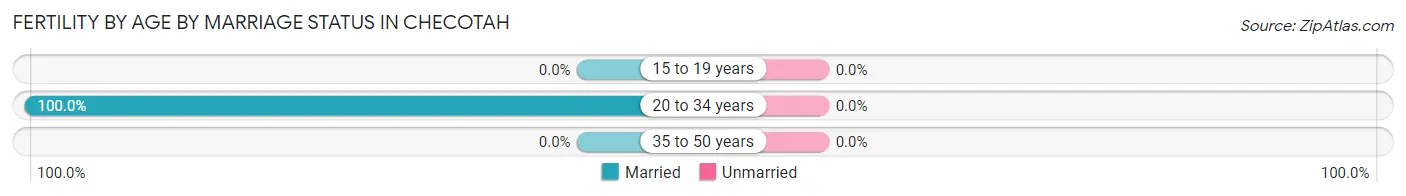
| Age Bracket | Married | Unmarried |
| 15 to 19 years | 0 (0.0%) | 0 (0.0%) |
| 20 to 34 years | 15 (100.0%) | 0 (0.0%) |
| 35 to 50 years | 0 (0.0%) | 0 (0.0%) |
| Total | 15 (100.0%) | 0 (0.0%) |
Fertility by Education in Checotah
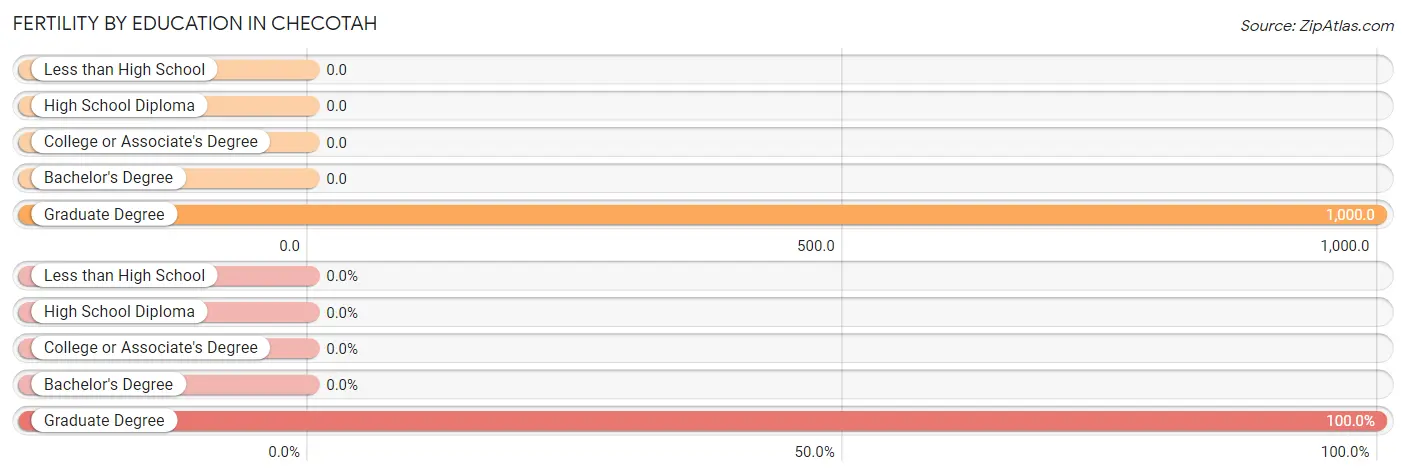
| Educational Attainment | Women with Births | Births / 1,000 Women |
| Less than High School | 0 (0.0%) | 0.0 |
| High School Diploma | 0 (0.0%) | 0.0 |
| College or Associate's Degree | 0 (0.0%) | 0.0 |
| Bachelor's Degree | 0 (0.0%) | 0.0 |
| Graduate Degree | 15 (100.0%) | 1,000.0 |
| Total | 15 (100.0%) | 20.0 |
Fertility by Education by Marriage Status in Checotah
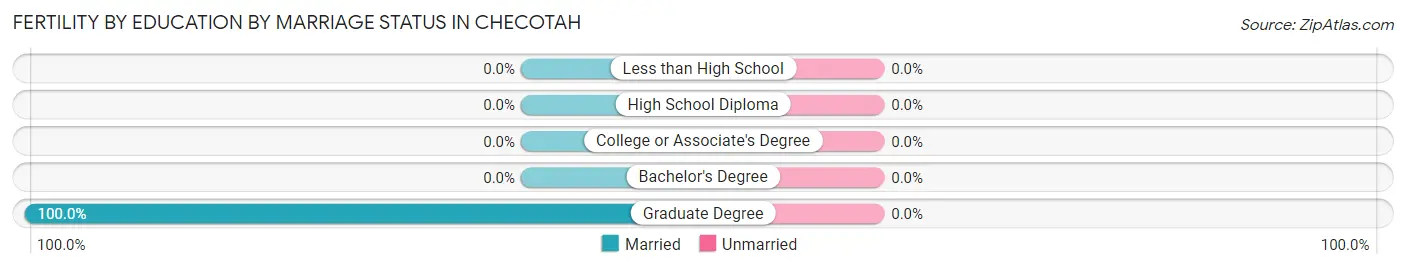
| Educational Attainment | Married | Unmarried |
| Less than High School | 0 (0.0%) | 0 (0.0%) |
| High School Diploma | 0 (0.0%) | 0 (0.0%) |
| College or Associate's Degree | 0 (0.0%) | 0 (0.0%) |
| Bachelor's Degree | 0 (0.0%) | 0 (0.0%) |
| Graduate Degree | 15 (100.0%) | 0 (0.0%) |
| Total | 15 (100.0%) | 0 (0.0%) |
Employment Characteristics in Checotah
Employment by Class of Employer in Checotah
Among the 1,050 employed individuals in Checotah, private company employees (729 | 69.4%), state government employees (87 | 8.3%), and local government employees (80 | 7.6%) make up the most common classes of employment.
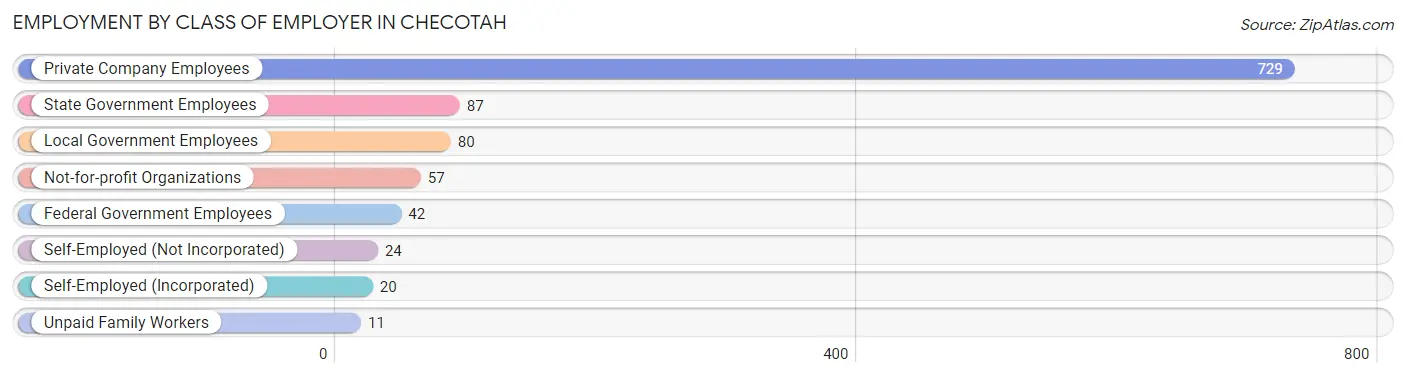
| Employer Class | # Employees | % Employees |
| Private Company Employees | 729 | 69.4% |
| Self-Employed (Incorporated) | 20 | 1.9% |
| Self-Employed (Not Incorporated) | 24 | 2.3% |
| Not-for-profit Organizations | 57 | 5.4% |
| Local Government Employees | 80 | 7.6% |
| State Government Employees | 87 | 8.3% |
| Federal Government Employees | 42 | 4.0% |
| Unpaid Family Workers | 11 | 1.1% |
| Total | 1,050 | 100.0% |
Employment Status by Age in Checotah
According to the labor force statistics for Checotah, out of the total population over 16 years of age (2,430), 48.2% or 1,171 individuals are in the labor force, with 9.4% or 110 of them unemployed. The age group with the highest labor force participation rate is 55 to 59 years, with 72.6% or 164 individuals in the labor force. Within the labor force, the 55 to 59 years age range has the highest percentage of unemployed individuals, with 25.0% or 41 of them being unemployed.
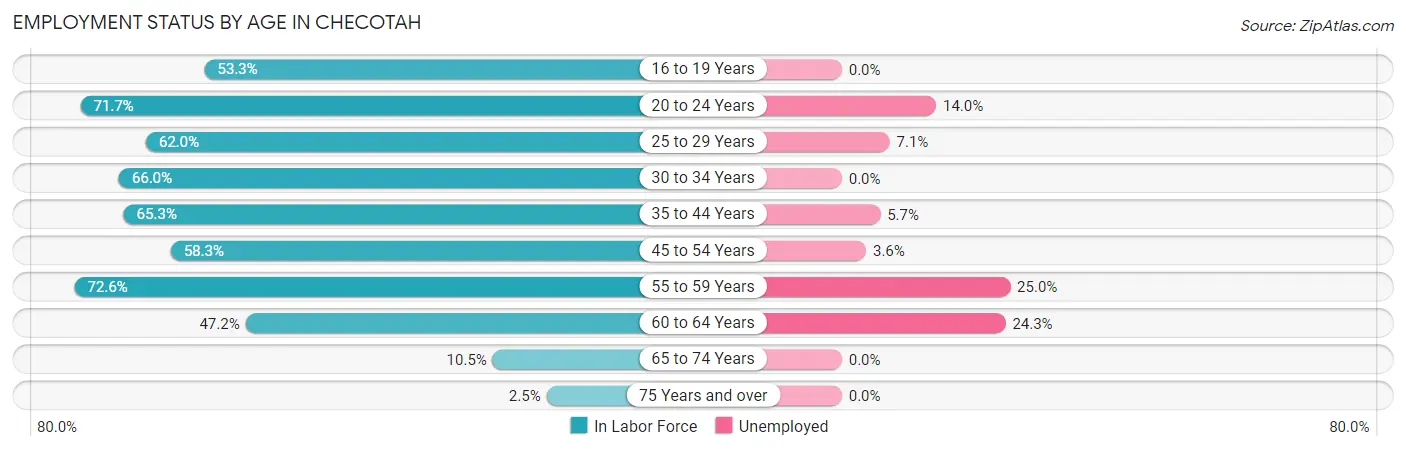
| Age Bracket | In Labor Force | Unemployed |
| 16 to 19 Years | 56 (53.3%) | 0 (0.0%) |
| 20 to 24 Years | 86 (71.7%) | 12 (14.0%) |
| 25 to 29 Years | 168 (62.0%) | 12 (7.1%) |
| 30 to 34 Years | 140 (66.0%) | 0 (0.0%) |
| 35 to 44 Years | 209 (65.3%) | 12 (5.7%) |
| 45 to 54 Years | 204 (58.3%) | 7 (3.6%) |
| 55 to 59 Years | 164 (72.6%) | 41 (25.0%) |
| 60 to 64 Years | 103 (47.2%) | 25 (24.3%) |
| 65 to 74 Years | 34 (10.5%) | 0 (0.0%) |
| 75 Years and over | 7 (2.5%) | 0 (0.0%) |
| Total | 1,171 (48.2%) | 110 (9.4%) |
Employment Status by Educational Attainment in Checotah
According to labor force statistics for Checotah, 61.9% of individuals (989) out of the total population between 25 and 64 years of age (1,597) are in the labor force, with 9.9% or 98 of them being unemployed. The group with the highest labor force participation rate are those with the educational attainment of bachelor's degree or higher, with 77.0% or 134 individuals in the labor force. Within the labor force, individuals with less than high school education have the highest percentage of unemployment, with 25.9% or 22 of them being unemployed.
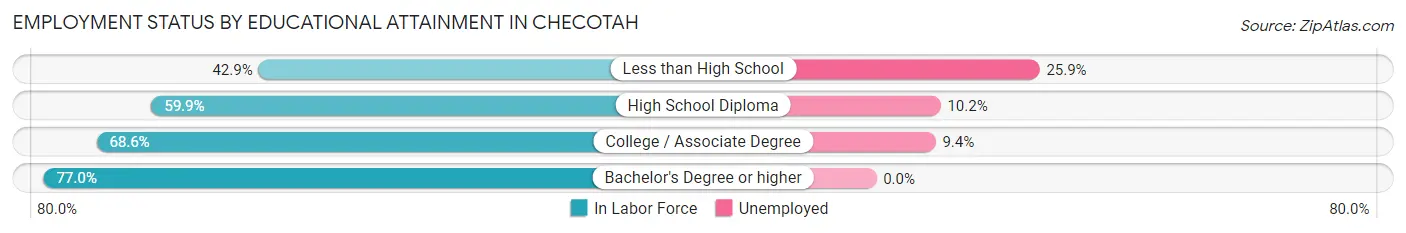
| Educational Attainment | In Labor Force | Unemployed |
| Less than High School | 85 (42.9%) | 51 (25.9%) |
| High School Diploma | 491 (59.9%) | 84 (10.2%) |
| College / Associate Degree | 278 (68.6%) | 38 (9.4%) |
| Bachelor's Degree or higher | 134 (77.0%) | 0 (0.0%) |
| Total | 989 (61.9%) | 158 (9.9%) |
Employment Occupations by Sex in Checotah
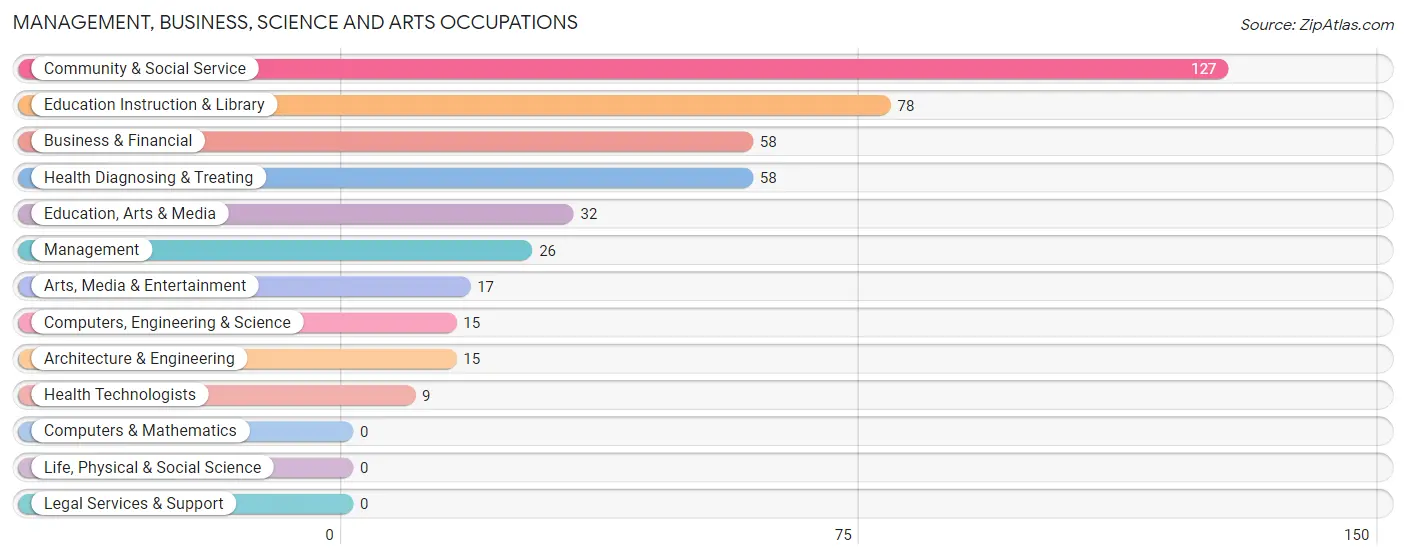
Management, Business, Science and Arts Occupations
The most common Management, Business, Science and Arts occupations in Checotah are Community & Social Service (127 | 12.1%), Education Instruction & Library (78 | 7.4%), Business & Financial (58 | 5.5%), Health Diagnosing & Treating (58 | 5.5%), and Education, Arts & Media (32 | 3.0%).
Management, Business, Science and Arts Occupations by Sex
Within the Management, Business, Science and Arts occupations in Checotah, the most male-oriented occupations are Computers, Engineering & Science (100.0%), Architecture & Engineering (100.0%), and Arts, Media & Entertainment (100.0%), while the most female-oriented occupations are Education, Arts & Media (100.0%), Education Instruction & Library (100.0%), and Health Technologists (100.0%).
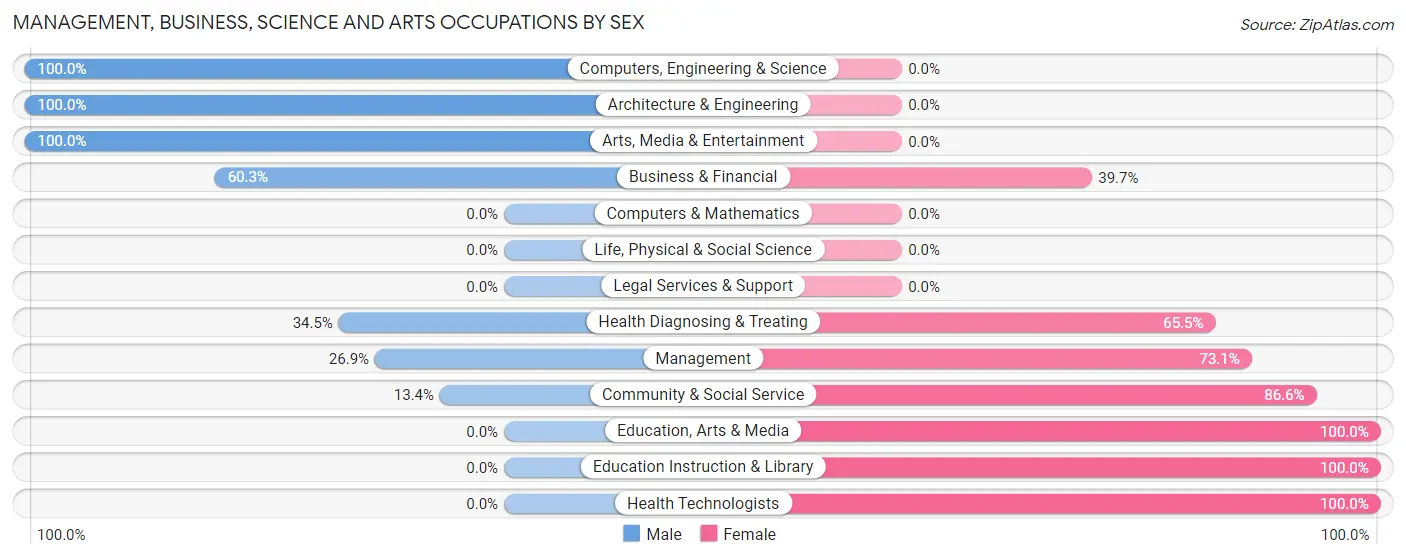
| Occupation | Male | Female |
| Management | 7 (26.9%) | 19 (73.1%) |
| Business & Financial | 35 (60.3%) | 23 (39.7%) |
| Computers, Engineering & Science | 15 (100.0%) | 0 (0.0%) |
| Computers & Mathematics | 0 (0.0%) | 0 (0.0%) |
| Architecture & Engineering | 15 (100.0%) | 0 (0.0%) |
| Life, Physical & Social Science | 0 (0.0%) | 0 (0.0%) |
| Community & Social Service | 17 (13.4%) | 110 (86.6%) |
| Education, Arts & Media | 0 (0.0%) | 32 (100.0%) |
| Legal Services & Support | 0 (0.0%) | 0 (0.0%) |
| Education Instruction & Library | 0 (0.0%) | 78 (100.0%) |
| Arts, Media & Entertainment | 17 (100.0%) | 0 (0.0%) |
| Health Diagnosing & Treating | 20 (34.5%) | 38 (65.5%) |
| Health Technologists | 0 (0.0%) | 9 (100.0%) |
| Total (Category) | 94 (33.1%) | 190 (66.9%) |
| Total (Overall) | 483 (46.0%) | 568 (54.0%) |
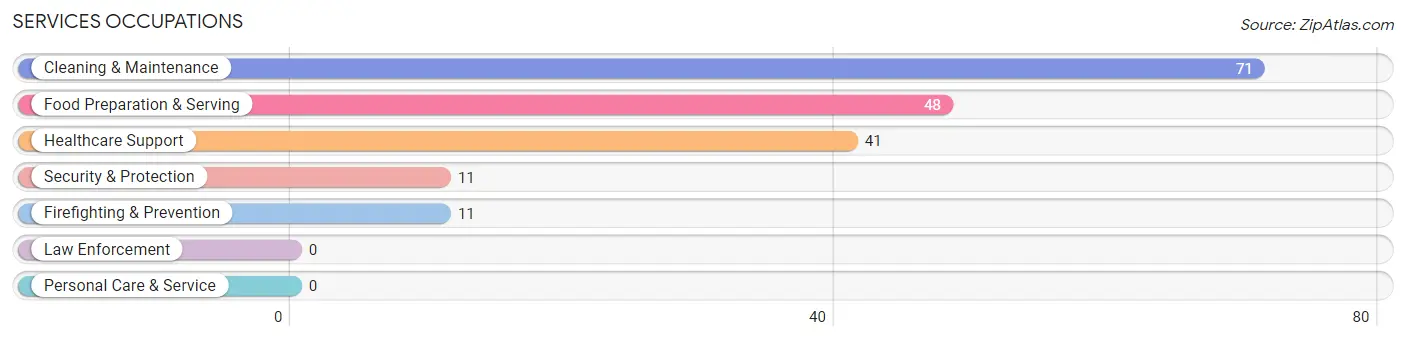
Services Occupations
The most common Services occupations in Checotah are Cleaning & Maintenance (71 | 6.8%), Food Preparation & Serving (48 | 4.6%), Healthcare Support (41 | 3.9%), Security & Protection (11 | 1.1%), and Firefighting & Prevention (11 | 1.1%).
Services Occupations by Sex
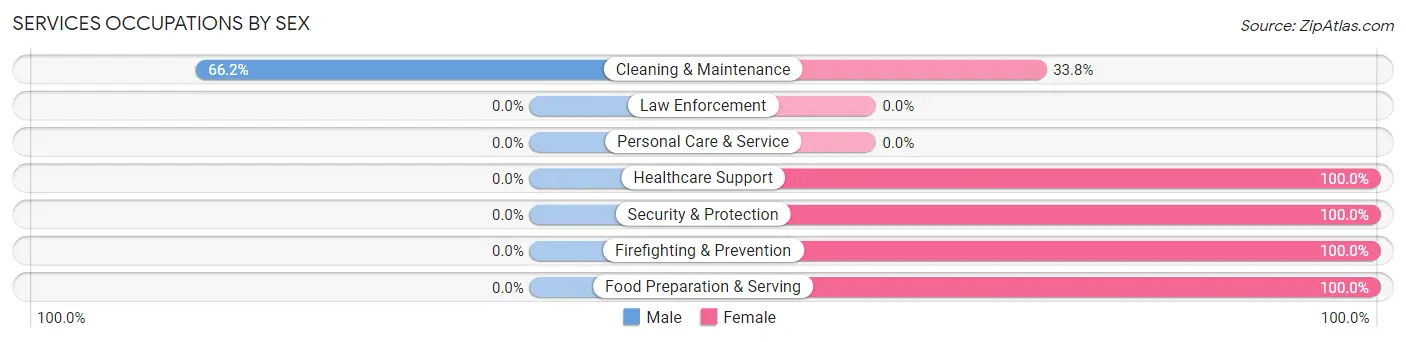
| Occupation | Male | Female |
| Healthcare Support | 0 (0.0%) | 41 (100.0%) |
| Security & Protection | 0 (0.0%) | 11 (100.0%) |
| Firefighting & Prevention | 0 (0.0%) | 11 (100.0%) |
| Law Enforcement | 0 (0.0%) | 0 (0.0%) |
| Food Preparation & Serving | 0 (0.0%) | 48 (100.0%) |
| Cleaning & Maintenance | 47 (66.2%) | 24 (33.8%) |
| Personal Care & Service | 0 (0.0%) | 0 (0.0%) |
| Total (Category) | 47 (27.5%) | 124 (72.5%) |
| Total (Overall) | 483 (46.0%) | 568 (54.0%) |
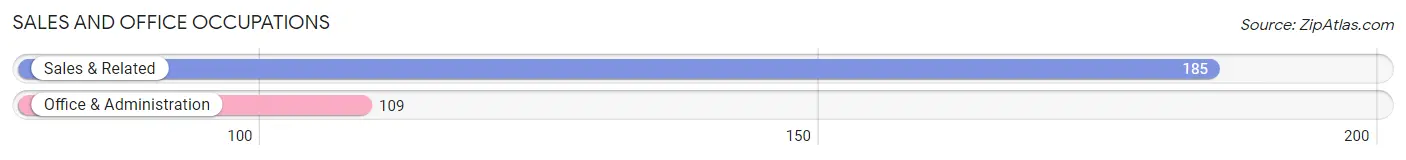
Sales and Office Occupations
The most common Sales and Office occupations in Checotah are Sales & Related (185 | 17.6%), and Office & Administration (109 | 10.4%).
Sales and Office Occupations by Sex
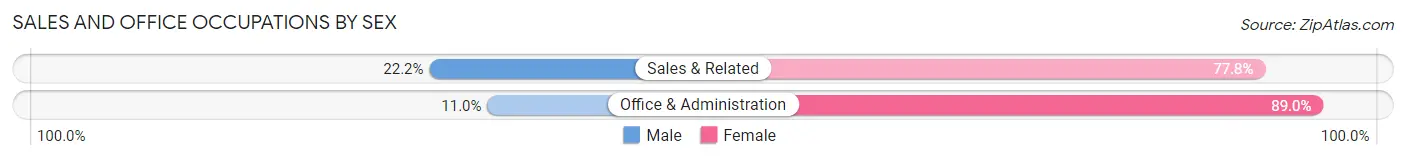
| Occupation | Male | Female |
| Sales & Related | 41 (22.2%) | 144 (77.8%) |
| Office & Administration | 12 (11.0%) | 97 (89.0%) |
| Total (Category) | 53 (18.0%) | 241 (82.0%) |
| Total (Overall) | 483 (46.0%) | 568 (54.0%) |
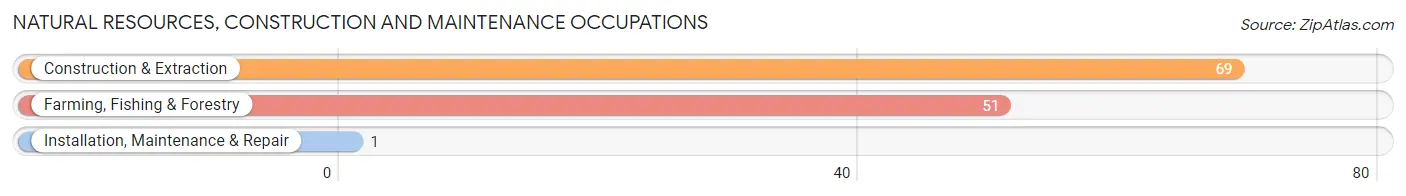
Natural Resources, Construction and Maintenance Occupations
The most common Natural Resources, Construction and Maintenance occupations in Checotah are Construction & Extraction (69 | 6.6%), Farming, Fishing & Forestry (51 | 4.9%), and Installation, Maintenance & Repair (1 | 0.1%).
Natural Resources, Construction and Maintenance Occupations by Sex
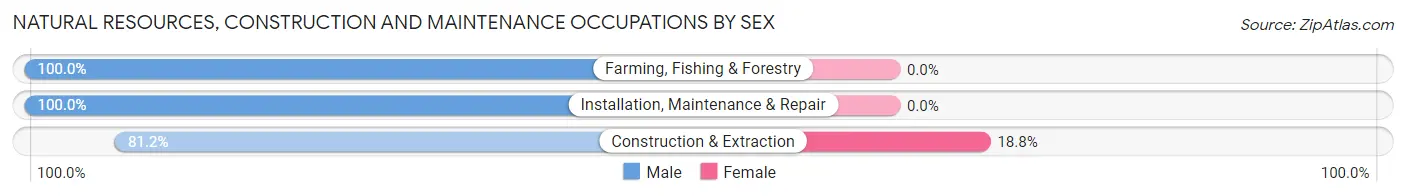
| Occupation | Male | Female |
| Farming, Fishing & Forestry | 51 (100.0%) | 0 (0.0%) |
| Construction & Extraction | 56 (81.2%) | 13 (18.8%) |
| Installation, Maintenance & Repair | 1 (100.0%) | 0 (0.0%) |
| Total (Category) | 108 (89.3%) | 13 (10.7%) |
| Total (Overall) | 483 (46.0%) | 568 (54.0%) |
Production, Transportation and Moving Occupations
The most common Production, Transportation and Moving occupations in Checotah are Transportation (69 | 6.6%), Production (64 | 6.1%), and Material Moving (48 | 4.6%).
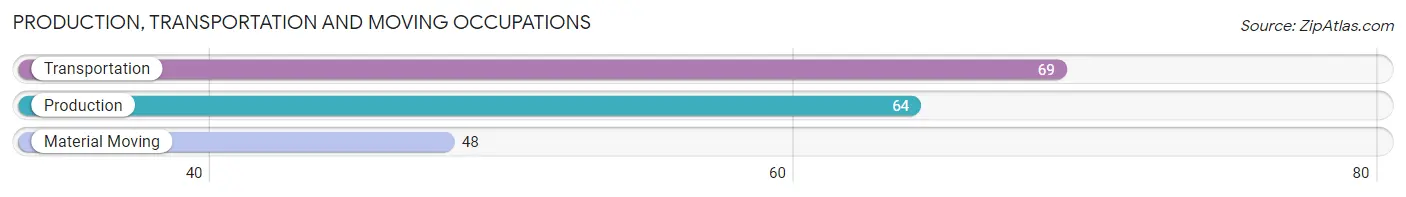
Production, Transportation and Moving Occupations by Sex
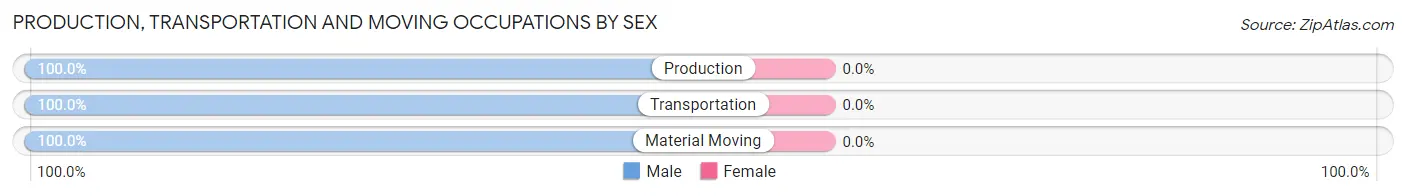
| Occupation | Male | Female |
| Production | 64 (100.0%) | 0 (0.0%) |
| Transportation | 69 (100.0%) | 0 (0.0%) |
| Material Moving | 48 (100.0%) | 0 (0.0%) |
| Total (Category) | 181 (100.0%) | 0 (0.0%) |
| Total (Overall) | 483 (46.0%) | 568 (54.0%) |
Employment Industries by Sex in Checotah
Employment Industries in Checotah
The major employment industries in Checotah include Retail Trade (253 | 24.1%), Health Care & Social Assistance (108 | 10.3%), Accommodation & Food Services (98 | 9.3%), Educational Services (94 | 8.9%), and Construction (63 | 6.0%).
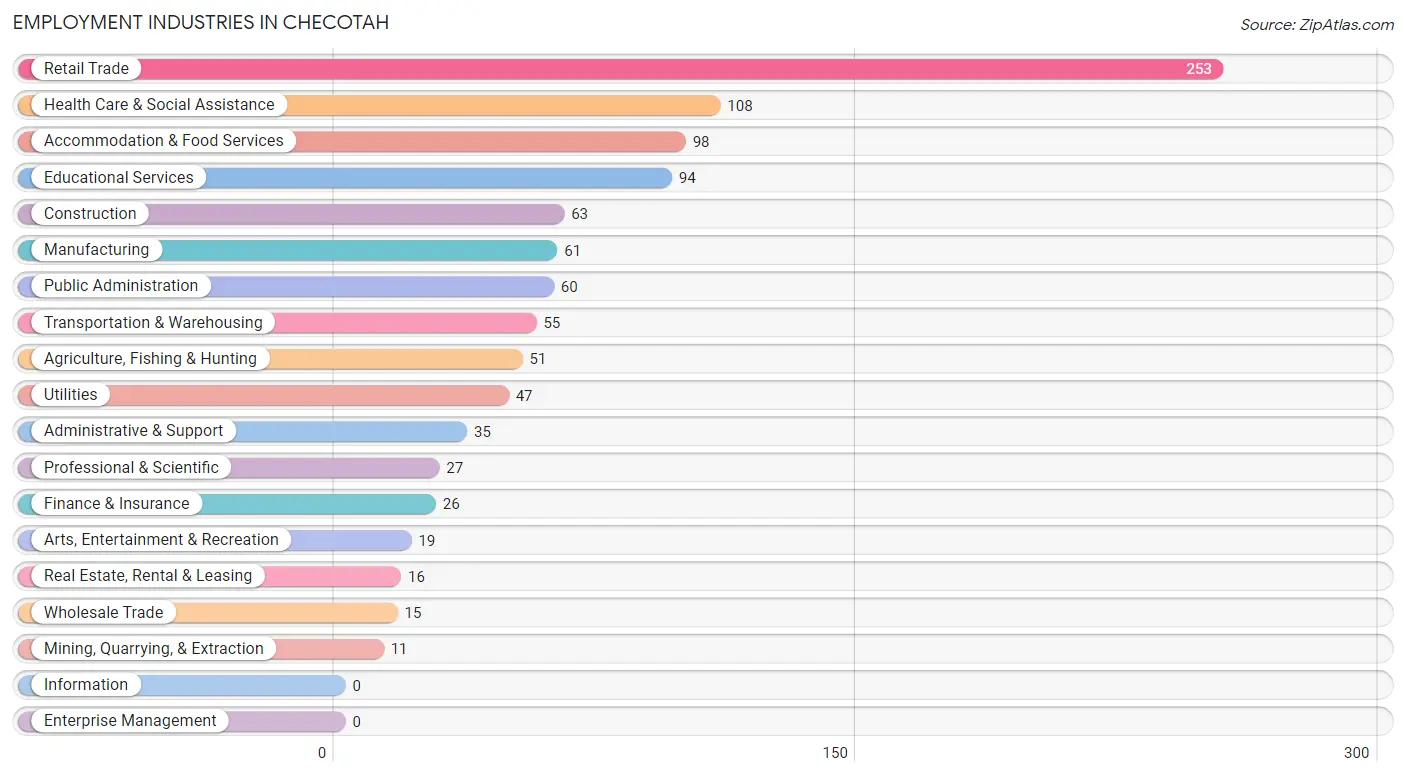
Employment Industries by Sex in Checotah
The Checotah industries that see more men than women are Agriculture, Fishing & Hunting (100.0%), Mining, Quarrying, & Extraction (100.0%), and Construction (100.0%), whereas the industries that tend to have a higher number of women are Finance & Insurance (100.0%), Professional & Scientific (100.0%), and Educational Services (100.0%).
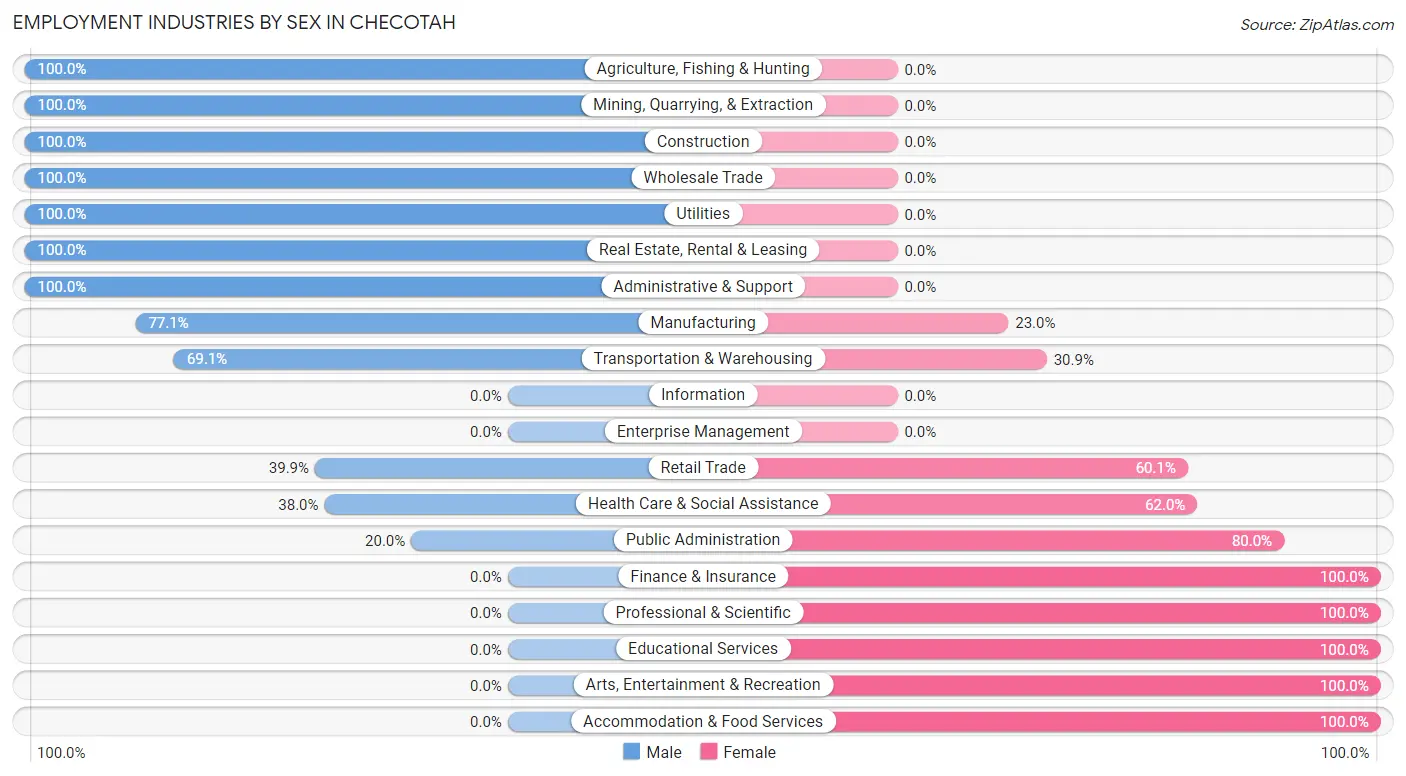
| Industry | Male | Female |
| Agriculture, Fishing & Hunting | 51 (100.0%) | 0 (0.0%) |
| Mining, Quarrying, & Extraction | 11 (100.0%) | 0 (0.0%) |
| Construction | 63 (100.0%) | 0 (0.0%) |
| Manufacturing | 47 (77.0%) | 14 (23.0%) |
| Wholesale Trade | 15 (100.0%) | 0 (0.0%) |
| Retail Trade | 101 (39.9%) | 152 (60.1%) |
| Transportation & Warehousing | 38 (69.1%) | 17 (30.9%) |
| Utilities | 47 (100.0%) | 0 (0.0%) |
| Information | 0 (0.0%) | 0 (0.0%) |
| Finance & Insurance | 0 (0.0%) | 26 (100.0%) |
| Real Estate, Rental & Leasing | 16 (100.0%) | 0 (0.0%) |
| Professional & Scientific | 0 (0.0%) | 27 (100.0%) |
| Enterprise Management | 0 (0.0%) | 0 (0.0%) |
| Administrative & Support | 35 (100.0%) | 0 (0.0%) |
| Educational Services | 0 (0.0%) | 94 (100.0%) |
| Health Care & Social Assistance | 41 (38.0%) | 67 (62.0%) |
| Arts, Entertainment & Recreation | 0 (0.0%) | 19 (100.0%) |
| Accommodation & Food Services | 0 (0.0%) | 98 (100.0%) |
| Public Administration | 12 (20.0%) | 48 (80.0%) |
| Total | 483 (46.0%) | 568 (54.0%) |
Education in Checotah
School Enrollment in Checotah
The most common levels of schooling among the 553 students in Checotah are middle school (167 | 30.2%), high school (141 | 25.5%), and elementary school (95 | 17.2%).
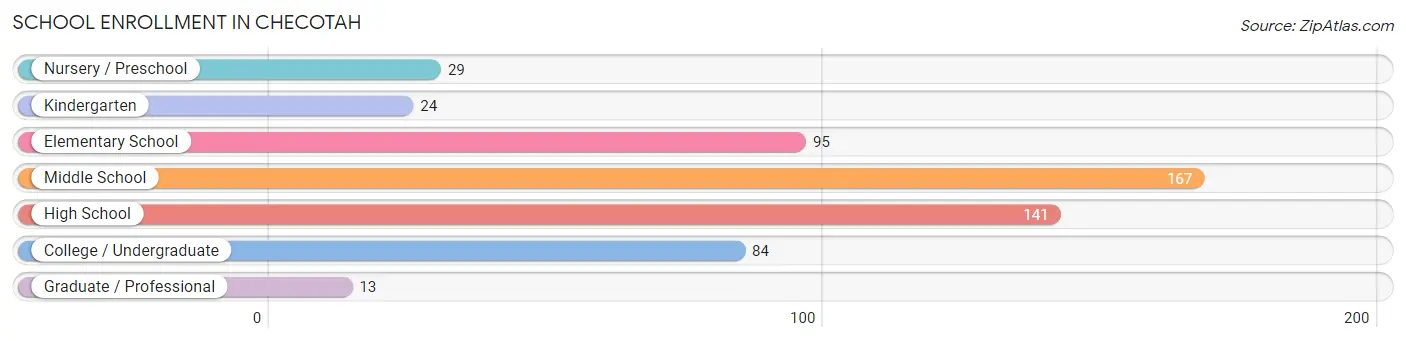
| School Level | # Students | % Students |
| Nursery / Preschool | 29 | 5.2% |
| Kindergarten | 24 | 4.3% |
| Elementary School | 95 | 17.2% |
| Middle School | 167 | 30.2% |
| High School | 141 | 25.5% |
| College / Undergraduate | 84 | 15.2% |
| Graduate / Professional | 13 | 2.4% |
| Total | 553 | 100.0% |
School Enrollment by Age by Funding Source in Checotah
Out of a total of 553 students who are enrolled in schools in Checotah, 80 (14.5%) attend a private institution, while the remaining 473 (85.5%) are enrolled in public schools. The age group of 20 to 24 year olds has the highest likelihood of being enrolled in private schools, with 13 (100.0% in the age bracket) enrolled. Conversely, the age group of 3 to 4 year olds has the lowest likelihood of being enrolled in a private school, with 31 (100.0% in the age bracket) attending a public institution.
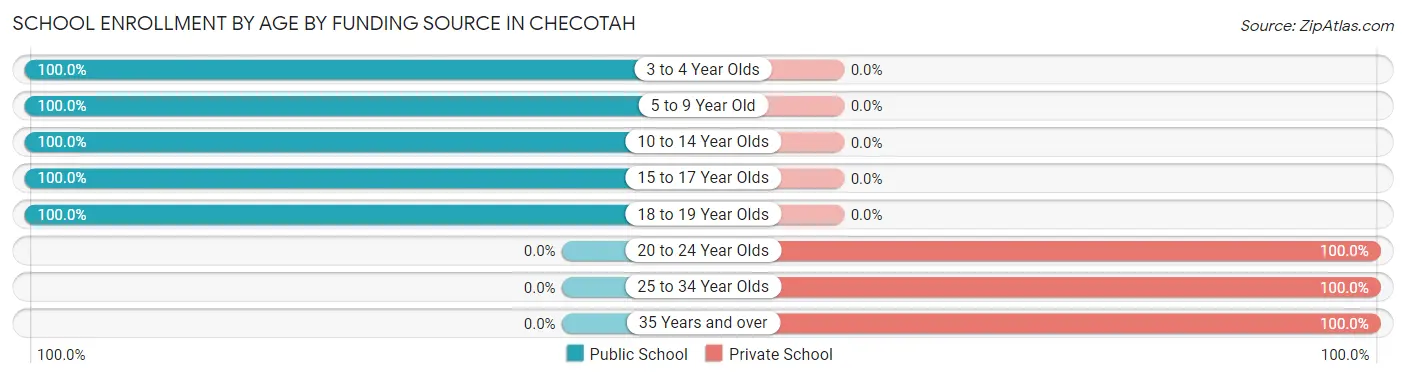
| Age Bracket | Public School | Private School |
| 3 to 4 Year Olds | 31 (100.0%) | 0 (0.0%) |
| 5 to 9 Year Old | 138 (100.0%) | 0 (0.0%) |
| 10 to 14 Year Olds | 196 (100.0%) | 0 (0.0%) |
| 15 to 17 Year Olds | 50 (100.0%) | 0 (0.0%) |
| 18 to 19 Year Olds | 58 (100.0%) | 0 (0.0%) |
| 20 to 24 Year Olds | 0 (0.0%) | 13 (100.0%) |
| 25 to 34 Year Olds | 0 (0.0%) | 20 (100.0%) |
| 35 Years and over | 0 (0.0%) | 47 (100.0%) |
| Total | 473 (85.5%) | 80 (14.5%) |
Educational Attainment by Field of Study in Checotah
Education (66 | 29.1%), computers & mathematics (39 | 17.2%), psychology (30 | 13.2%), business (30 | 13.2%), and arts & humanities (22 | 9.7%) are the most common fields of study among 227 individuals in Checotah who have obtained a bachelor's degree or higher.
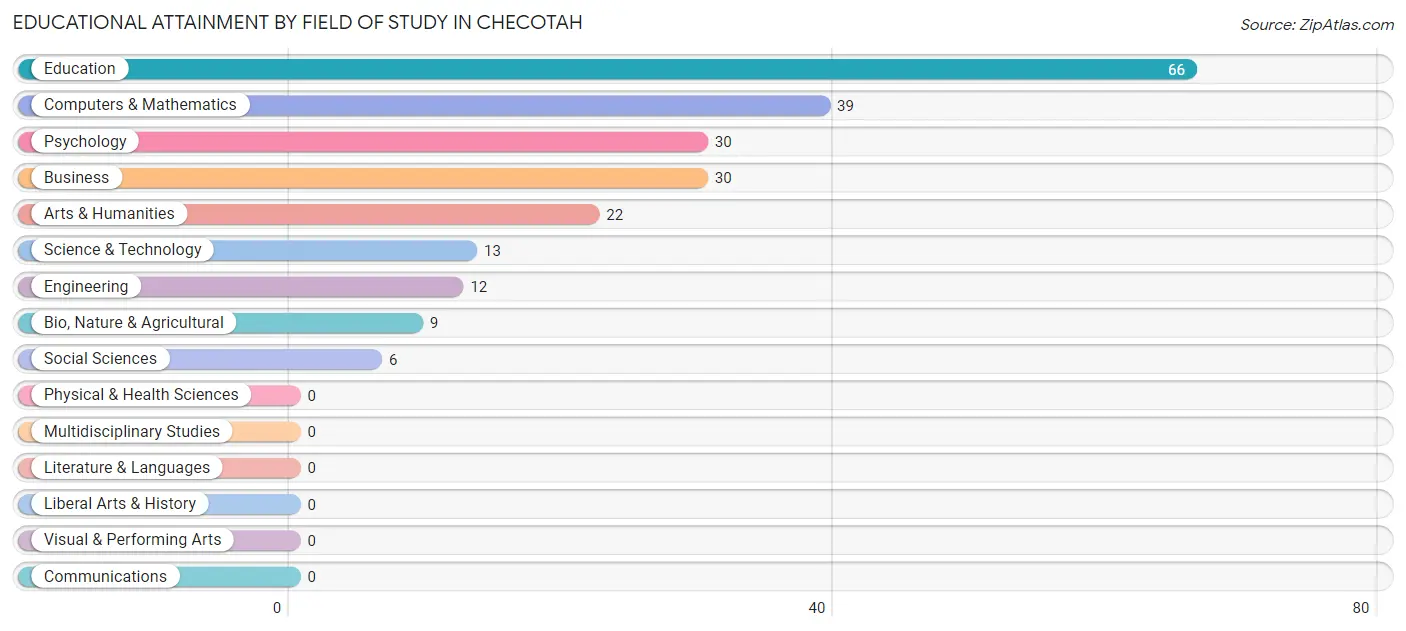
| Field of Study | # Graduates | % Graduates |
| Computers & Mathematics | 39 | 17.2% |
| Bio, Nature & Agricultural | 9 | 4.0% |
| Physical & Health Sciences | 0 | 0.0% |
| Psychology | 30 | 13.2% |
| Social Sciences | 6 | 2.6% |
| Engineering | 12 | 5.3% |
| Multidisciplinary Studies | 0 | 0.0% |
| Science & Technology | 13 | 5.7% |
| Business | 30 | 13.2% |
| Education | 66 | 29.1% |
| Literature & Languages | 0 | 0.0% |
| Liberal Arts & History | 0 | 0.0% |
| Visual & Performing Arts | 0 | 0.0% |
| Communications | 0 | 0.0% |
| Arts & Humanities | 22 | 9.7% |
| Total | 227 | 100.0% |
Transportation & Commute in Checotah
Vehicle Availability by Sex in Checotah
The most prevalent vehicle ownership categories in Checotah are males with 2 vehicles (175, accounting for 37.1%) and females with 2 vehicles (131, making up 30.8%).
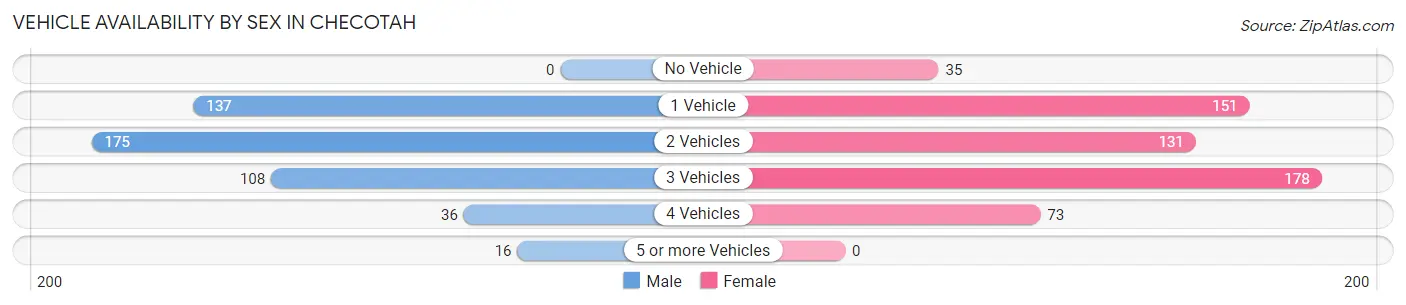
| Vehicles Available | Male | Female |
| No Vehicle | 0 (0.0%) | 35 (6.2%) |
| 1 Vehicle | 137 (29.0%) | 151 (26.6%) |
| 2 Vehicles | 175 (37.1%) | 131 (23.1%) |
| 3 Vehicles | 108 (22.9%) | 178 (31.3%) |
| 4 Vehicles | 36 (7.6%) | 73 (12.9%) |
| 5 or more Vehicles | 16 (3.4%) | 0 (0.0%) |
| Total | 472 (100.0%) | 568 (100.0%) |
Commute Time in Checotah
The most frequently occuring commute durations in Checotah are 5 to 9 minutes (243 commuters, 24.7%), 30 to 34 minutes (200 commuters, 20.3%), and 15 to 19 minutes (150 commuters, 15.2%).
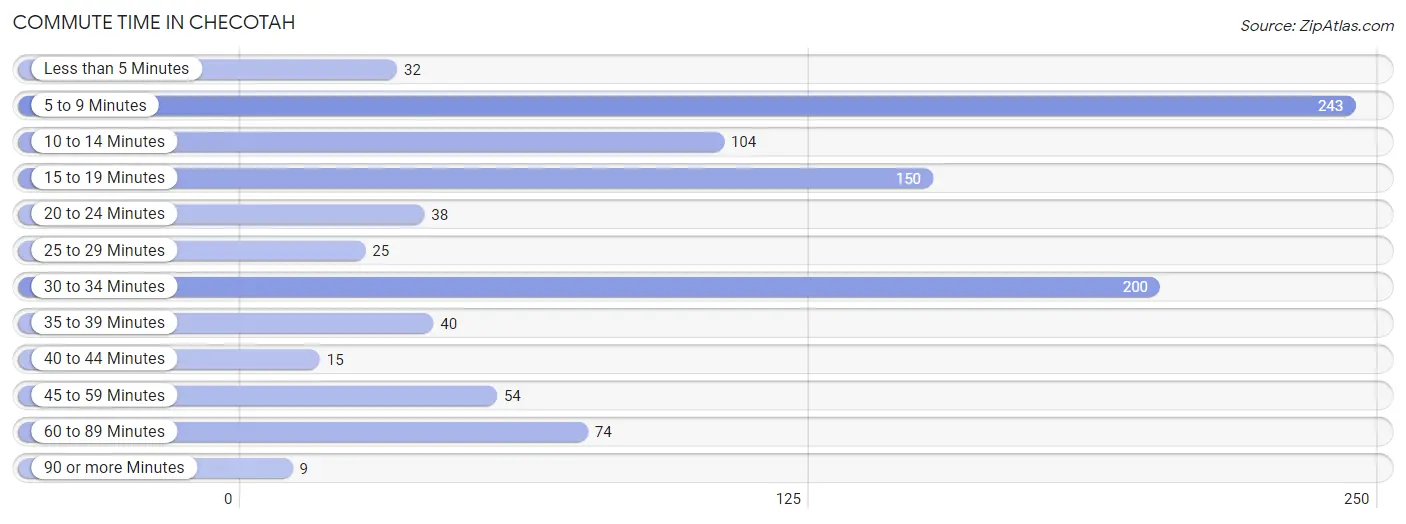
| Commute Time | # Commuters | % Commuters |
| Less than 5 Minutes | 32 | 3.3% |
| 5 to 9 Minutes | 243 | 24.7% |
| 10 to 14 Minutes | 104 | 10.6% |
| 15 to 19 Minutes | 150 | 15.2% |
| 20 to 24 Minutes | 38 | 3.9% |
| 25 to 29 Minutes | 25 | 2.5% |
| 30 to 34 Minutes | 200 | 20.3% |
| 35 to 39 Minutes | 40 | 4.1% |
| 40 to 44 Minutes | 15 | 1.5% |
| 45 to 59 Minutes | 54 | 5.5% |
| 60 to 89 Minutes | 74 | 7.5% |
| 90 or more Minutes | 9 | 0.9% |
Commute Time by Sex in Checotah
The most common commute times in Checotah are 5 to 9 minutes (115 commuters, 25.0%) for males and 5 to 9 minutes (128 commuters, 24.4%) for females.
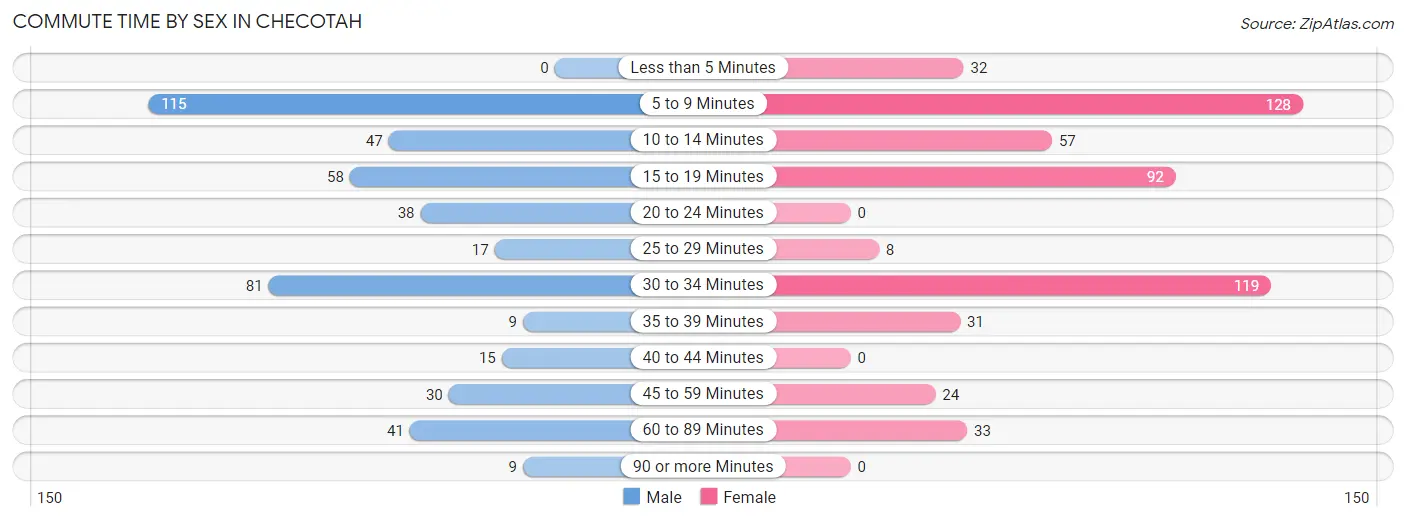
| Commute Time | Male | Female |
| Less than 5 Minutes | 0 (0.0%) | 32 (6.1%) |
| 5 to 9 Minutes | 115 (25.0%) | 128 (24.4%) |
| 10 to 14 Minutes | 47 (10.2%) | 57 (10.9%) |
| 15 to 19 Minutes | 58 (12.6%) | 92 (17.6%) |
| 20 to 24 Minutes | 38 (8.3%) | 0 (0.0%) |
| 25 to 29 Minutes | 17 (3.7%) | 8 (1.5%) |
| 30 to 34 Minutes | 81 (17.6%) | 119 (22.7%) |
| 35 to 39 Minutes | 9 (2.0%) | 31 (5.9%) |
| 40 to 44 Minutes | 15 (3.3%) | 0 (0.0%) |
| 45 to 59 Minutes | 30 (6.5%) | 24 (4.6%) |
| 60 to 89 Minutes | 41 (8.9%) | 33 (6.3%) |
| 90 or more Minutes | 9 (2.0%) | 0 (0.0%) |
Time of Departure to Work by Sex in Checotah
The most frequent times of departure to work in Checotah are 9:00 AM to 9:59 AM (96, 20.9%) for males and 4:00 PM to 11:59 PM (148, 28.2%) for females.
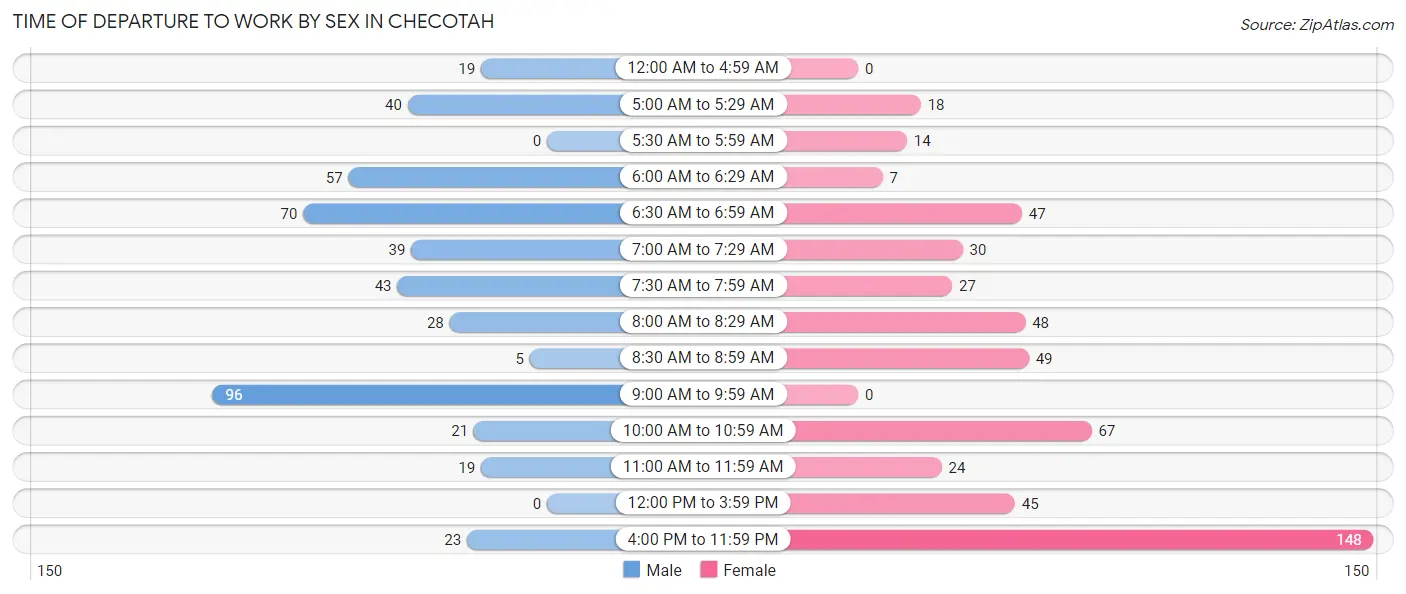
| Time of Departure | Male | Female |
| 12:00 AM to 4:59 AM | 19 (4.1%) | 0 (0.0%) |
| 5:00 AM to 5:29 AM | 40 (8.7%) | 18 (3.4%) |
| 5:30 AM to 5:59 AM | 0 (0.0%) | 14 (2.7%) |
| 6:00 AM to 6:29 AM | 57 (12.4%) | 7 (1.3%) |
| 6:30 AM to 6:59 AM | 70 (15.2%) | 47 (9.0%) |
| 7:00 AM to 7:29 AM | 39 (8.5%) | 30 (5.7%) |
| 7:30 AM to 7:59 AM | 43 (9.3%) | 27 (5.1%) |
| 8:00 AM to 8:29 AM | 28 (6.1%) | 48 (9.2%) |
| 8:30 AM to 8:59 AM | 5 (1.1%) | 49 (9.3%) |
| 9:00 AM to 9:59 AM | 96 (20.9%) | 0 (0.0%) |
| 10:00 AM to 10:59 AM | 21 (4.6%) | 67 (12.8%) |
| 11:00 AM to 11:59 AM | 19 (4.1%) | 24 (4.6%) |
| 12:00 PM to 3:59 PM | 0 (0.0%) | 45 (8.6%) |
| 4:00 PM to 11:59 PM | 23 (5.0%) | 148 (28.2%) |
| Total | 460 (100.0%) | 524 (100.0%) |
Housing Occupancy in Checotah
Occupancy by Ownership in Checotah
Of the total 1,169 dwellings in Checotah, owner-occupied units account for 654 (55.9%), while renter-occupied units make up 515 (44.1%).
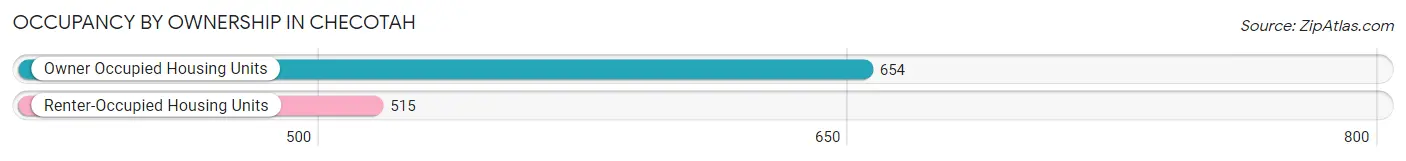
| Occupancy | # Housing Units | % Housing Units |
| Owner Occupied Housing Units | 654 | 55.9% |
| Renter-Occupied Housing Units | 515 | 44.1% |
| Total Occupied Housing Units | 1,169 | 100.0% |
Occupancy by Household Size in Checotah
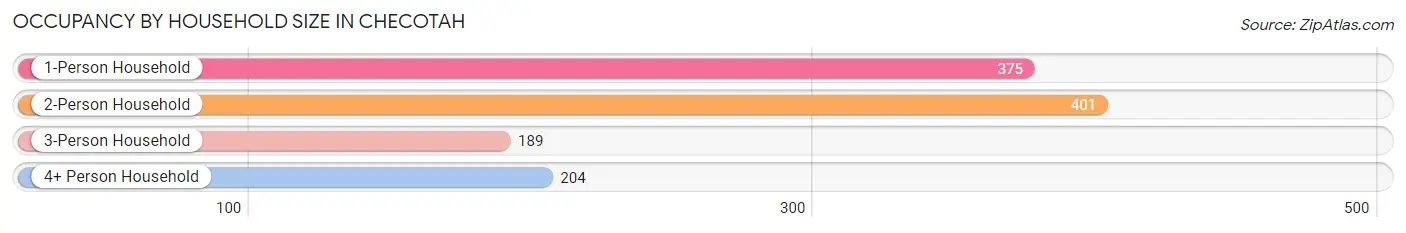
| Household Size | # Housing Units | % Housing Units |
| 1-Person Household | 375 | 32.1% |
| 2-Person Household | 401 | 34.3% |
| 3-Person Household | 189 | 16.2% |
| 4+ Person Household | 204 | 17.4% |
| Total Housing Units | 1,169 | 100.0% |
Occupancy by Ownership by Household Size in Checotah
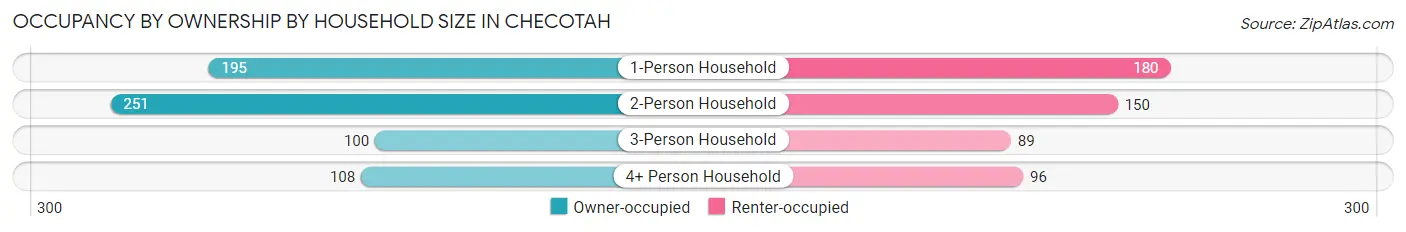
| Household Size | Owner-occupied | Renter-occupied |
| 1-Person Household | 195 (52.0%) | 180 (48.0%) |
| 2-Person Household | 251 (62.6%) | 150 (37.4%) |
| 3-Person Household | 100 (52.9%) | 89 (47.1%) |
| 4+ Person Household | 108 (52.9%) | 96 (47.1%) |
| Total Housing Units | 654 (55.9%) | 515 (44.1%) |
Occupancy by Educational Attainment in Checotah
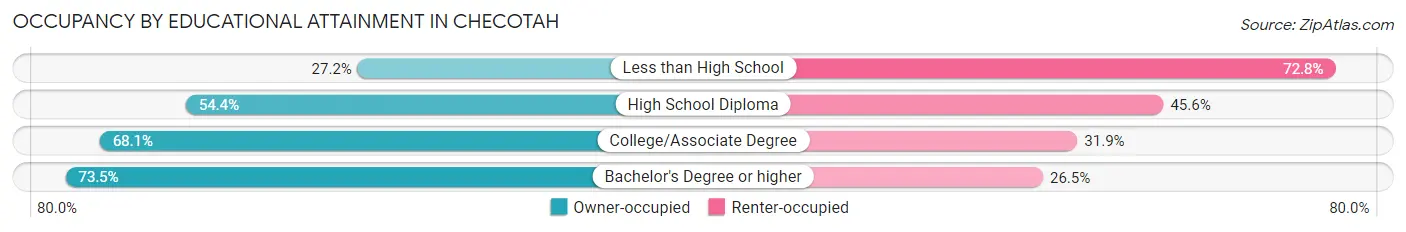
| Household Size | Owner-occupied | Renter-occupied |
| Less than High School | 50 (27.2%) | 134 (72.8%) |
| High School Diploma | 295 (54.4%) | 247 (45.6%) |
| College/Associate Degree | 209 (68.1%) | 98 (31.9%) |
| Bachelor's Degree or higher | 100 (73.5%) | 36 (26.5%) |
Occupancy by Age of Householder in Checotah
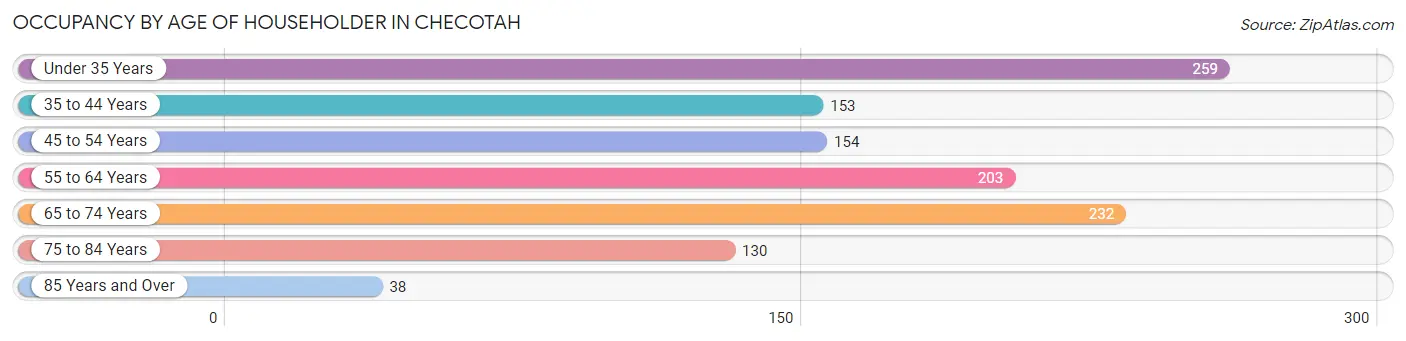
| Age Bracket | # Households | % Households |
| Under 35 Years | 259 | 22.2% |
| 35 to 44 Years | 153 | 13.1% |
| 45 to 54 Years | 154 | 13.2% |
| 55 to 64 Years | 203 | 17.4% |
| 65 to 74 Years | 232 | 19.9% |
| 75 to 84 Years | 130 | 11.1% |
| 85 Years and Over | 38 | 3.3% |
| Total | 1,169 | 100.0% |
Housing Finances in Checotah
Median Income by Occupancy in Checotah
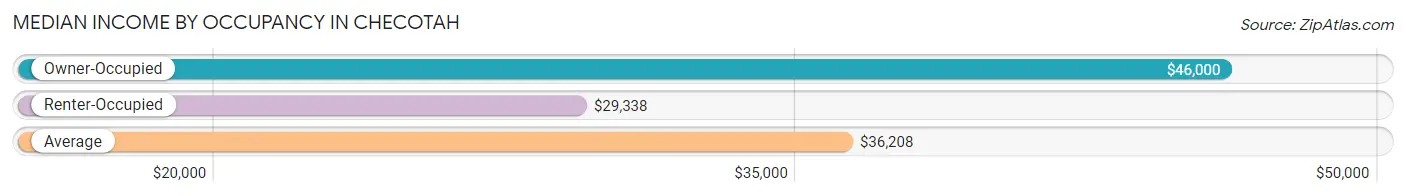
| Occupancy Type | # Households | Median Income |
| Owner-Occupied | 654 (55.9%) | $46,000 |
| Renter-Occupied | 515 (44.1%) | $29,338 |
| Average | 1,169 (100.0%) | $36,208 |
Occupancy by Householder Income Bracket in Checotah
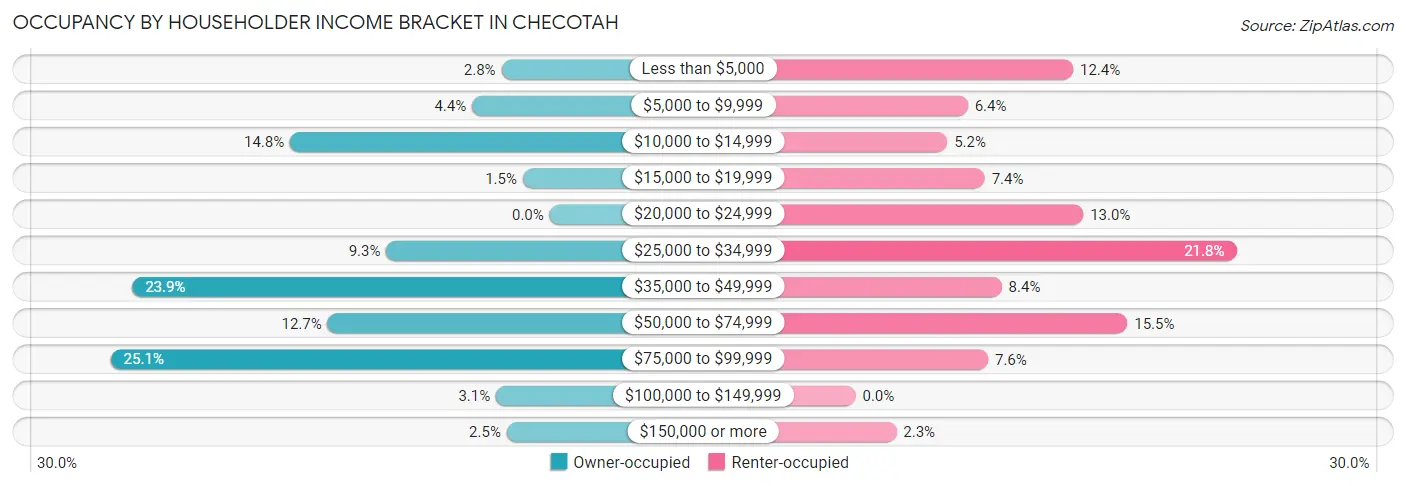
| Income Bracket | Owner-occupied | Renter-occupied |
| Less than $5,000 | 18 (2.8%) | 64 (12.4%) |
| $5,000 to $9,999 | 29 (4.4%) | 33 (6.4%) |
| $10,000 to $14,999 | 97 (14.8%) | 27 (5.2%) |
| $15,000 to $19,999 | 10 (1.5%) | 38 (7.4%) |
| $20,000 to $24,999 | 0 (0.0%) | 67 (13.0%) |
| $25,000 to $34,999 | 61 (9.3%) | 112 (21.7%) |
| $35,000 to $49,999 | 156 (23.8%) | 43 (8.4%) |
| $50,000 to $74,999 | 83 (12.7%) | 80 (15.5%) |
| $75,000 to $99,999 | 164 (25.1%) | 39 (7.6%) |
| $100,000 to $149,999 | 20 (3.1%) | 0 (0.0%) |
| $150,000 or more | 16 (2.5%) | 12 (2.3%) |
| Total | 654 (100.0%) | 515 (100.0%) |
Monthly Housing Cost Tiers in Checotah
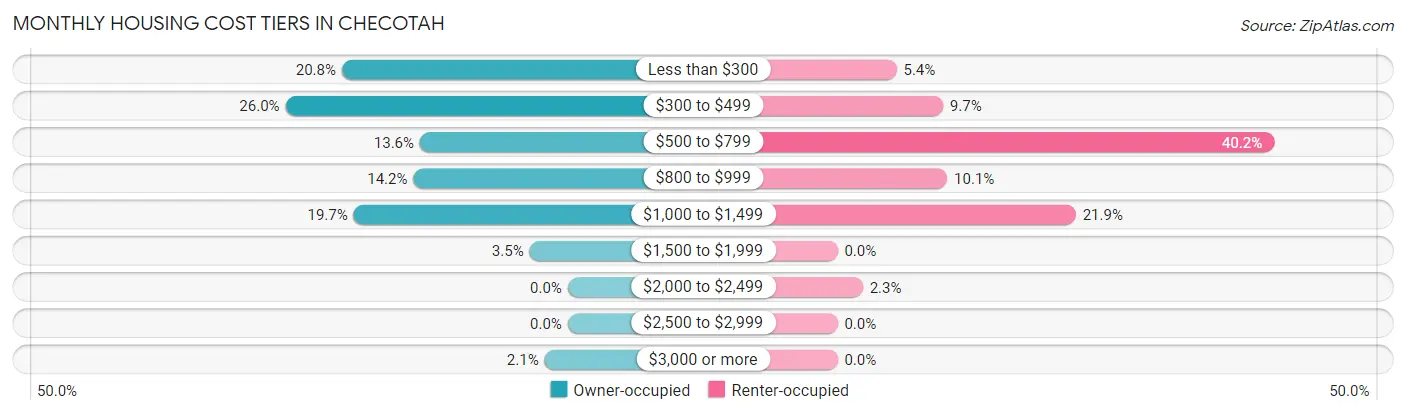
| Monthly Cost | Owner-occupied | Renter-occupied |
| Less than $300 | 136 (20.8%) | 28 (5.4%) |
| $300 to $499 | 170 (26.0%) | 50 (9.7%) |
| $500 to $799 | 89 (13.6%) | 207 (40.2%) |
| $800 to $999 | 93 (14.2%) | 52 (10.1%) |
| $1,000 to $1,499 | 129 (19.7%) | 113 (21.9%) |
| $1,500 to $1,999 | 23 (3.5%) | 0 (0.0%) |
| $2,000 to $2,499 | 0 (0.0%) | 12 (2.3%) |
| $2,500 to $2,999 | 0 (0.0%) | 0 (0.0%) |
| $3,000 or more | 14 (2.1%) | 0 (0.0%) |
| Total | 654 (100.0%) | 515 (100.0%) |
Physical Housing Characteristics in Checotah
Housing Structures in Checotah
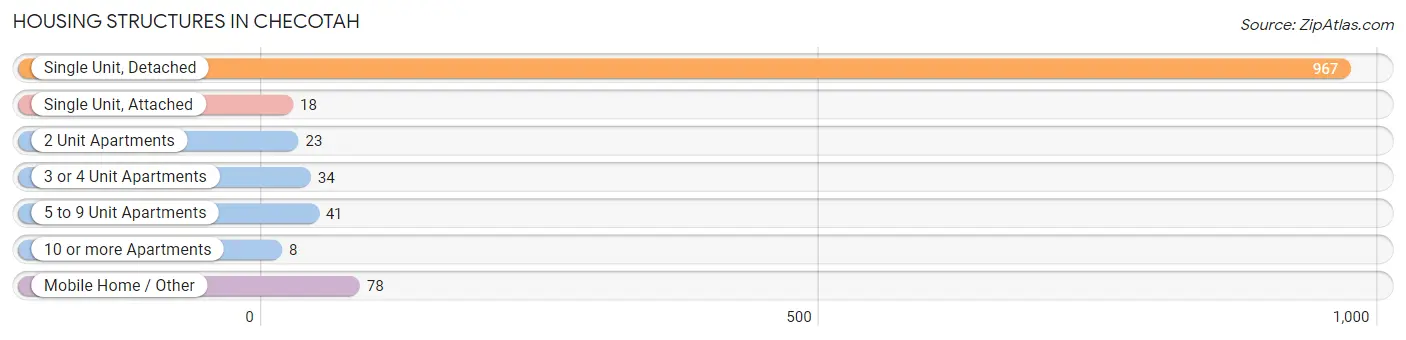
| Structure Type | # Housing Units | % Housing Units |
| Single Unit, Detached | 967 | 82.7% |
| Single Unit, Attached | 18 | 1.5% |
| 2 Unit Apartments | 23 | 2.0% |
| 3 or 4 Unit Apartments | 34 | 2.9% |
| 5 to 9 Unit Apartments | 41 | 3.5% |
| 10 or more Apartments | 8 | 0.7% |
| Mobile Home / Other | 78 | 6.7% |
| Total | 1,169 | 100.0% |
Housing Structures by Occupancy in Checotah
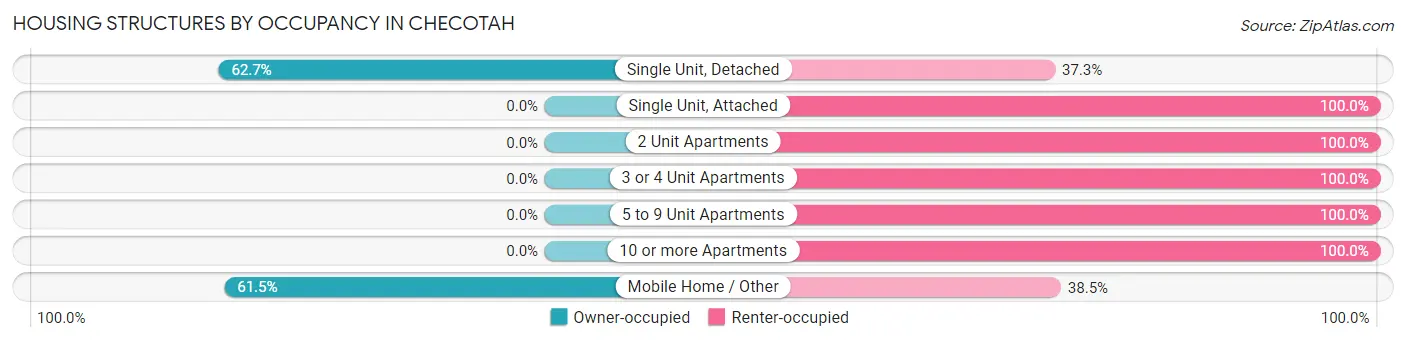
| Structure Type | Owner-occupied | Renter-occupied |
| Single Unit, Detached | 606 (62.7%) | 361 (37.3%) |
| Single Unit, Attached | 0 (0.0%) | 18 (100.0%) |
| 2 Unit Apartments | 0 (0.0%) | 23 (100.0%) |
| 3 or 4 Unit Apartments | 0 (0.0%) | 34 (100.0%) |
| 5 to 9 Unit Apartments | 0 (0.0%) | 41 (100.0%) |
| 10 or more Apartments | 0 (0.0%) | 8 (100.0%) |
| Mobile Home / Other | 48 (61.5%) | 30 (38.5%) |
| Total | 654 (55.9%) | 515 (44.1%) |
Housing Structures by Number of Rooms in Checotah
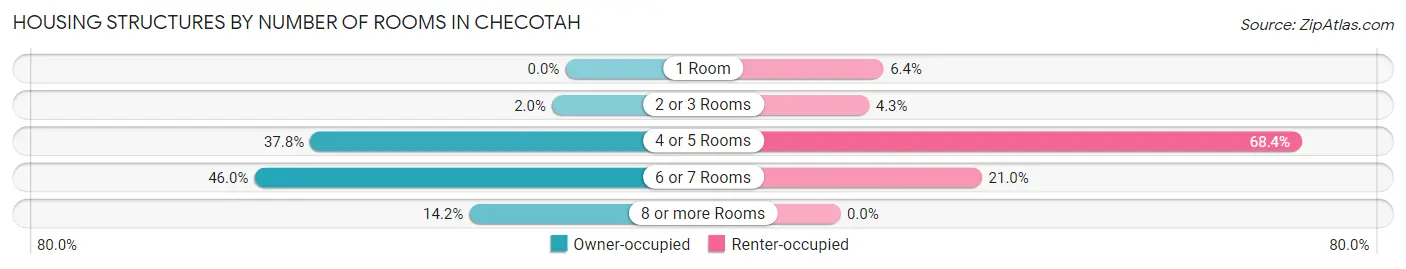
| Number of Rooms | Owner-occupied | Renter-occupied |
| 1 Room | 0 (0.0%) | 33 (6.4%) |
| 2 or 3 Rooms | 13 (2.0%) | 22 (4.3%) |
| 4 or 5 Rooms | 247 (37.8%) | 352 (68.3%) |
| 6 or 7 Rooms | 301 (46.0%) | 108 (21.0%) |
| 8 or more Rooms | 93 (14.2%) | 0 (0.0%) |
| Total | 654 (100.0%) | 515 (100.0%) |
Housing Structure by Heating Type in Checotah
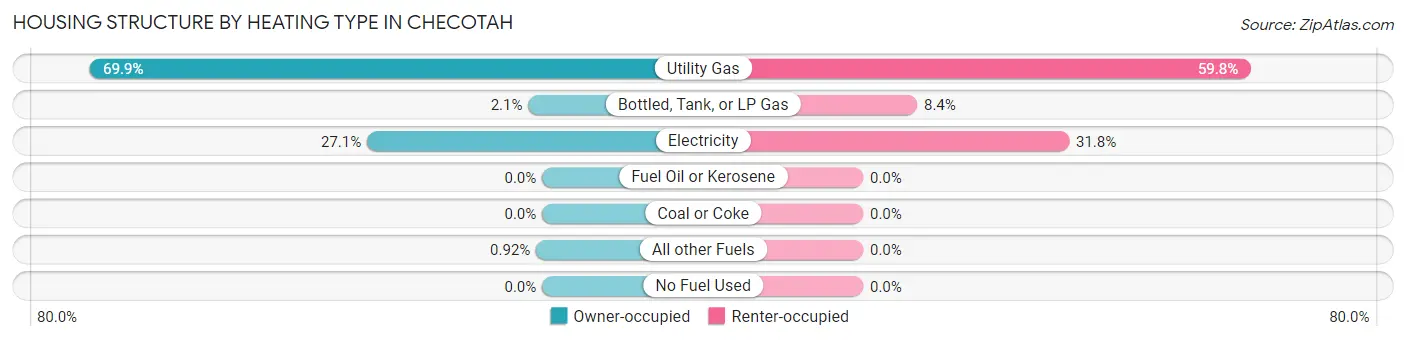
| Heating Type | Owner-occupied | Renter-occupied |
| Utility Gas | 457 (69.9%) | 308 (59.8%) |
| Bottled, Tank, or LP Gas | 14 (2.1%) | 43 (8.4%) |
| Electricity | 177 (27.1%) | 164 (31.8%) |
| Fuel Oil or Kerosene | 0 (0.0%) | 0 (0.0%) |
| Coal or Coke | 0 (0.0%) | 0 (0.0%) |
| All other Fuels | 6 (0.9%) | 0 (0.0%) |
| No Fuel Used | 0 (0.0%) | 0 (0.0%) |
| Total | 654 (100.0%) | 515 (100.0%) |
Household Vehicle Usage in Checotah
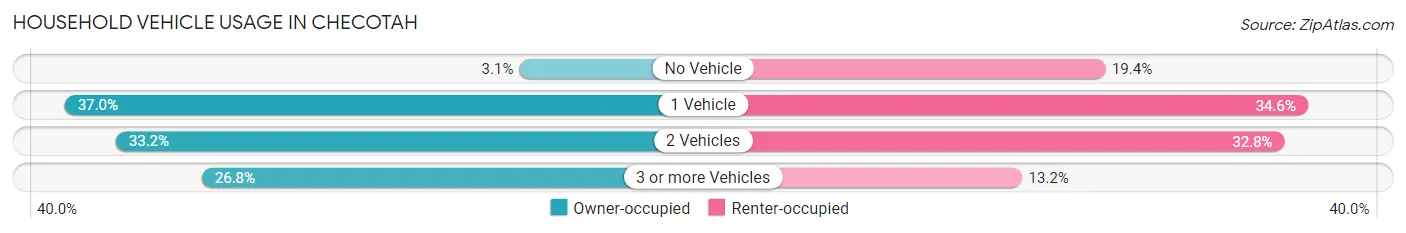
| Vehicles per Household | Owner-occupied | Renter-occupied |
| No Vehicle | 20 (3.1%) | 100 (19.4%) |
| 1 Vehicle | 242 (37.0%) | 178 (34.6%) |
| 2 Vehicles | 217 (33.2%) | 169 (32.8%) |
| 3 or more Vehicles | 175 (26.8%) | 68 (13.2%) |
| Total | 654 (100.0%) | 515 (100.0%) |
Real Estate & Mortgages in Checotah
Real Estate and Mortgage Overview in Checotah
| Characteristic | Without Mortgage | With Mortgage |
| Housing Units | 316 | 338 |
| Median Property Value | $106,400 | $103,600 |
| Median Household Income | $35,682 | $8 |
| Monthly Housing Costs | $317 | $0 |
| Real Estate Taxes | $634 | $46 |
Property Value by Mortgage Status in Checotah
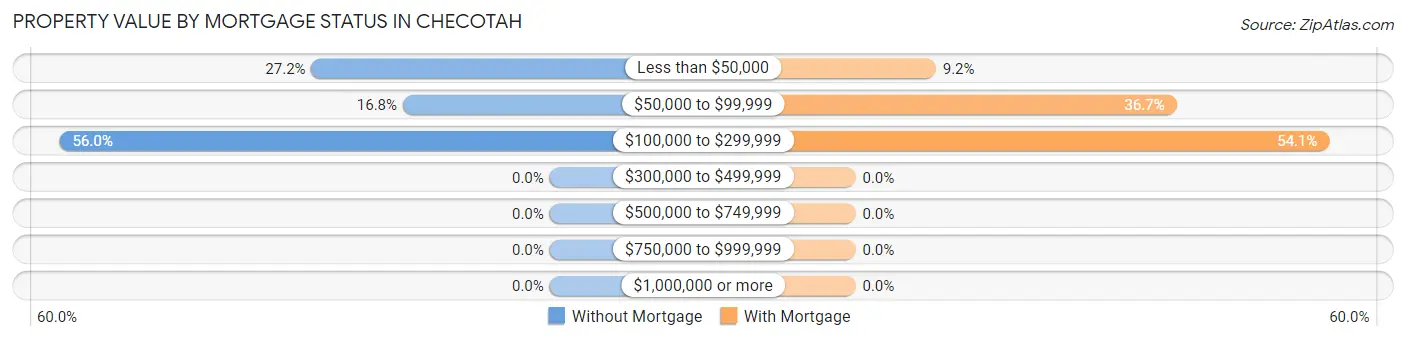
| Property Value | Without Mortgage | With Mortgage |
| Less than $50,000 | 86 (27.2%) | 31 (9.2%) |
| $50,000 to $99,999 | 53 (16.8%) | 124 (36.7%) |
| $100,000 to $299,999 | 177 (56.0%) | 183 (54.1%) |
| $300,000 to $499,999 | 0 (0.0%) | 0 (0.0%) |
| $500,000 to $749,999 | 0 (0.0%) | 0 (0.0%) |
| $750,000 to $999,999 | 0 (0.0%) | 0 (0.0%) |
| $1,000,000 or more | 0 (0.0%) | 0 (0.0%) |
| Total | 316 (100.0%) | 338 (100.0%) |
Household Income by Mortgage Status in Checotah
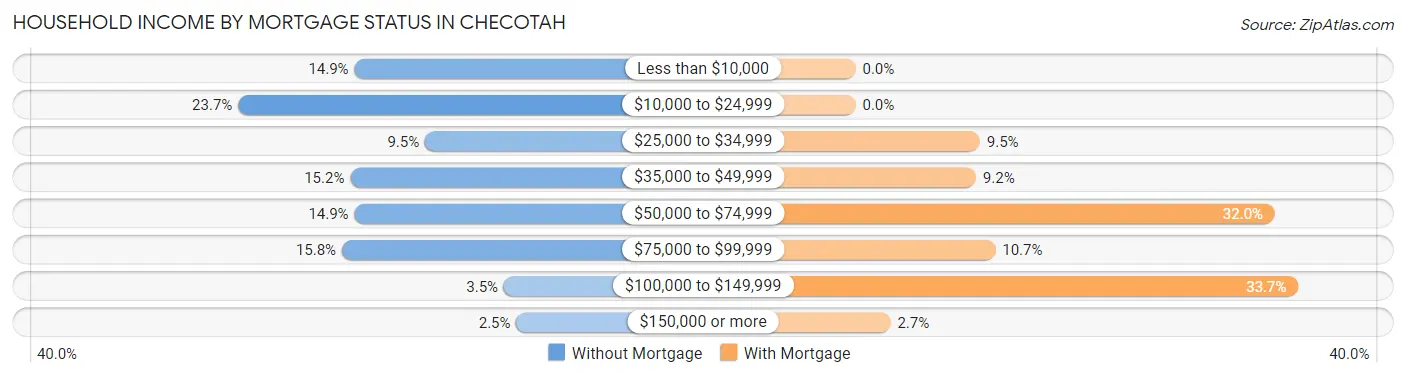
| Household Income | Without Mortgage | With Mortgage |
| Less than $10,000 | 47 (14.9%) | 0 (0.0%) |
| $10,000 to $24,999 | 75 (23.7%) | 0 (0.0%) |
| $25,000 to $34,999 | 30 (9.5%) | 32 (9.5%) |
| $35,000 to $49,999 | 48 (15.2%) | 31 (9.2%) |
| $50,000 to $74,999 | 47 (14.9%) | 108 (32.0%) |
| $75,000 to $99,999 | 50 (15.8%) | 36 (10.6%) |
| $100,000 to $149,999 | 11 (3.5%) | 114 (33.7%) |
| $150,000 or more | 8 (2.5%) | 9 (2.7%) |
| Total | 316 (100.0%) | 338 (100.0%) |
Property Value to Household Income Ratio in Checotah
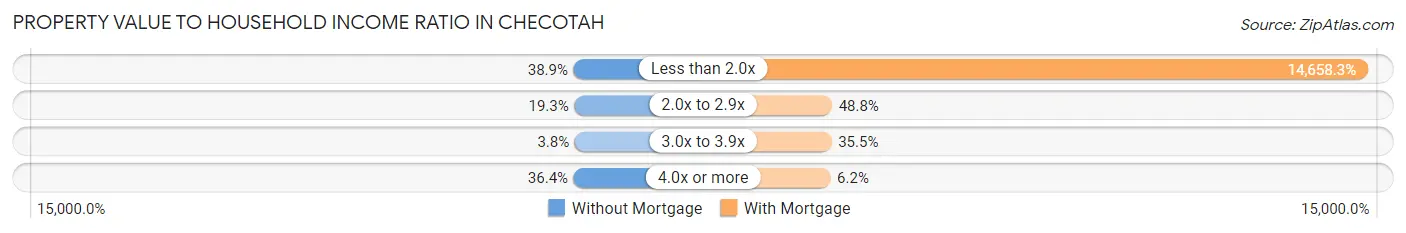
| Value-to-Income Ratio | Without Mortgage | With Mortgage |
| Less than 2.0x | 123 (38.9%) | 49,545 (14,658.3%) |
| 2.0x to 2.9x | 61 (19.3%) | 165 (48.8%) |
| 3.0x to 3.9x | 12 (3.8%) | 120 (35.5%) |
| 4.0x or more | 115 (36.4%) | 21 (6.2%) |
| Total | 316 (100.0%) | 338 (100.0%) |
Real Estate Taxes by Mortgage Status in Checotah
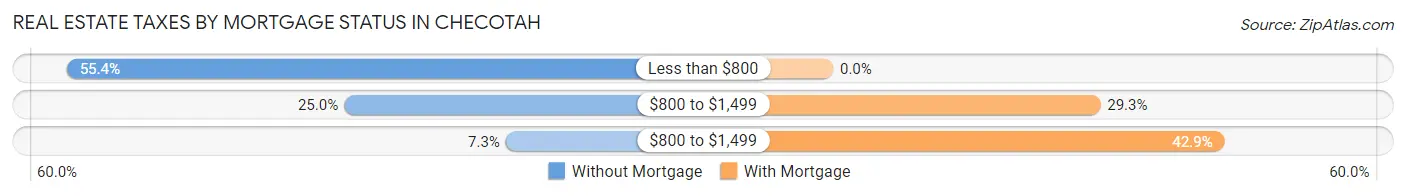
| Property Taxes | Without Mortgage | With Mortgage |
| Less than $800 | 175 (55.4%) | 0 (0.0%) |
| $800 to $1,499 | 79 (25.0%) | 99 (29.3%) |
| $800 to $1,499 | 23 (7.3%) | 145 (42.9%) |
| Total | 316 (100.0%) | 338 (100.0%) |
Health & Disability in Checotah
Health Insurance Coverage by Age in Checotah
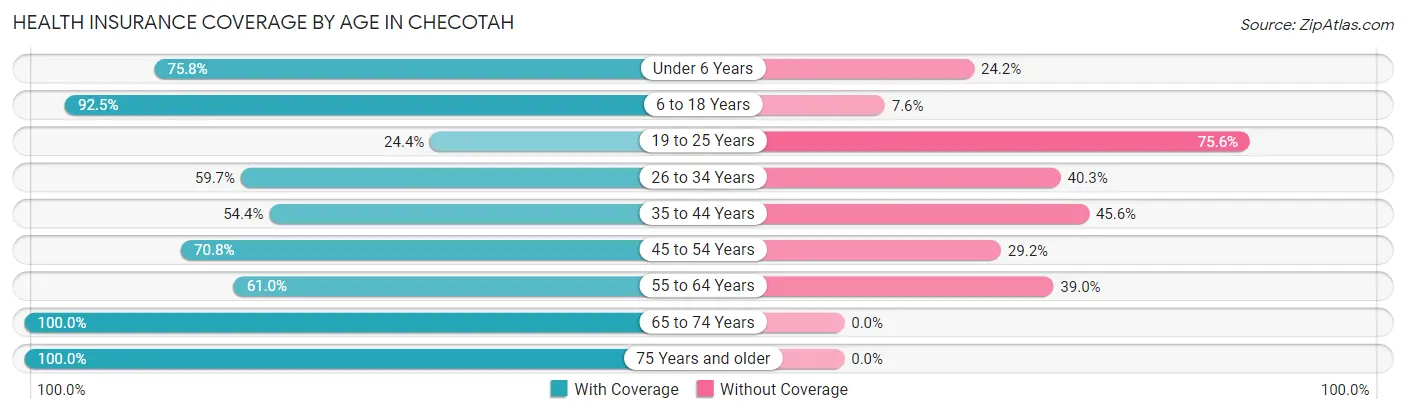
| Age Bracket | With Coverage | Without Coverage |
| Under 6 Years | 213 (75.8%) | 68 (24.2%) |
| 6 to 18 Years | 392 (92.4%) | 32 (7.5%) |
| 19 to 25 Years | 48 (24.4%) | 149 (75.6%) |
| 26 to 34 Years | 253 (59.7%) | 171 (40.3%) |
| 35 to 44 Years | 174 (54.4%) | 146 (45.6%) |
| 45 to 54 Years | 240 (70.8%) | 99 (29.2%) |
| 55 to 64 Years | 269 (61.0%) | 172 (39.0%) |
| 65 to 74 Years | 317 (100.0%) | 0 (0.0%) |
| 75 Years and older | 242 (100.0%) | 0 (0.0%) |
| Total | 2,148 (72.0%) | 837 (28.0%) |
Health Insurance Coverage by Citizenship Status in Checotah
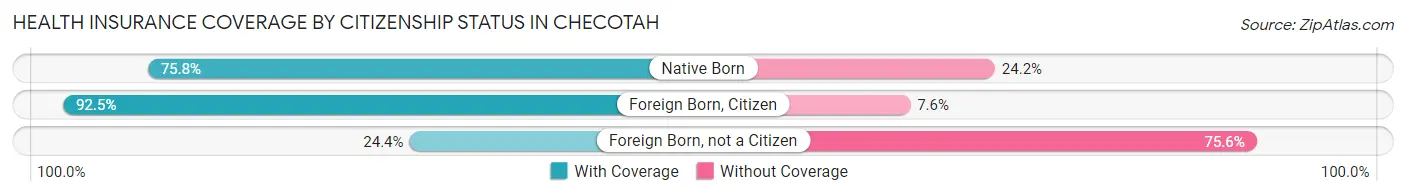
| Citizenship Status | With Coverage | Without Coverage |
| Native Born | 213 (75.8%) | 68 (24.2%) |
| Foreign Born, Citizen | 392 (92.4%) | 32 (7.5%) |
| Foreign Born, not a Citizen | 48 (24.4%) | 149 (75.6%) |
Health Insurance Coverage by Household Income in Checotah
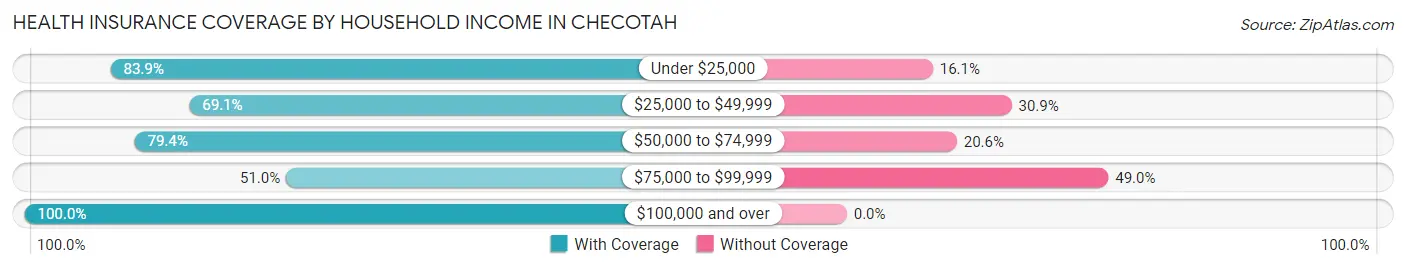
| Household Income | With Coverage | Without Coverage |
| Under $25,000 | 552 (83.9%) | 106 (16.1%) |
| $25,000 to $49,999 | 609 (69.1%) | 272 (30.9%) |
| $50,000 to $74,999 | 466 (79.4%) | 121 (20.6%) |
| $75,000 to $99,999 | 352 (51.0%) | 338 (49.0%) |
| $100,000 and over | 148 (100.0%) | 0 (0.0%) |
Public vs Private Health Insurance Coverage by Age in Checotah
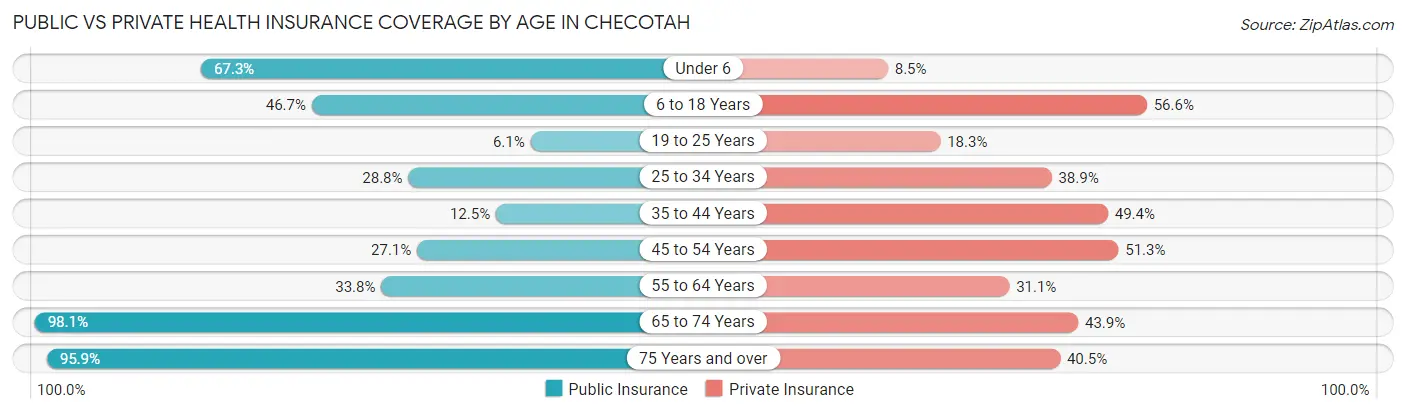
| Age Bracket | Public Insurance | Private Insurance |
| Under 6 | 189 (67.3%) | 24 (8.5%) |
| 6 to 18 Years | 198 (46.7%) | 240 (56.6%) |
| 19 to 25 Years | 12 (6.1%) | 36 (18.3%) |
| 25 to 34 Years | 122 (28.8%) | 165 (38.9%) |
| 35 to 44 Years | 40 (12.5%) | 158 (49.4%) |
| 45 to 54 Years | 92 (27.1%) | 174 (51.3%) |
| 55 to 64 Years | 149 (33.8%) | 137 (31.1%) |
| 65 to 74 Years | 311 (98.1%) | 139 (43.9%) |
| 75 Years and over | 232 (95.9%) | 98 (40.5%) |
| Total | 1,345 (45.1%) | 1,171 (39.2%) |
Disability Status by Sex by Age in Checotah
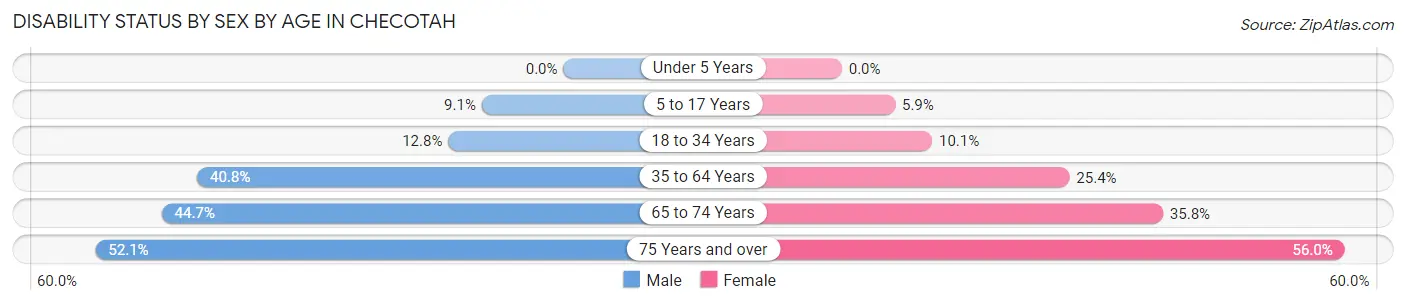
| Age Bracket | Male | Female |
| Under 5 Years | 0 (0.0%) | 0 (0.0%) |
| 5 to 17 Years | 14 (9.1%) | 14 (5.9%) |
| 18 to 34 Years | 30 (12.8%) | 44 (10.1%) |
| 35 to 64 Years | 217 (40.8%) | 144 (25.4%) |
| 65 to 74 Years | 68 (44.7%) | 59 (35.8%) |
| 75 Years and over | 74 (52.1%) | 56 (56.0%) |
Disability Class by Sex by Age in Checotah
Disability Class: Hearing Difficulty
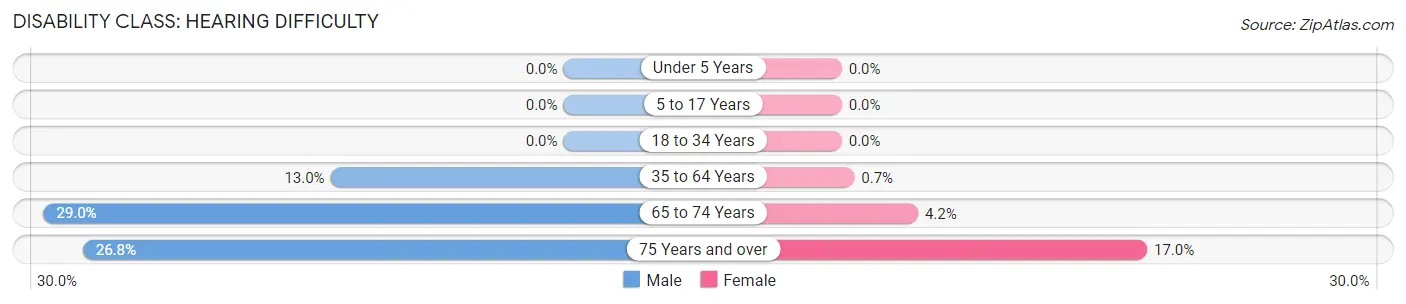
| Age Bracket | Male | Female |
| Under 5 Years | 0 (0.0%) | 0 (0.0%) |
| 5 to 17 Years | 0 (0.0%) | 0 (0.0%) |
| 18 to 34 Years | 0 (0.0%) | 0 (0.0%) |
| 35 to 64 Years | 69 (13.0%) | 4 (0.7%) |
| 65 to 74 Years | 44 (28.9%) | 7 (4.2%) |
| 75 Years and over | 38 (26.8%) | 17 (17.0%) |
Disability Class: Vision Difficulty
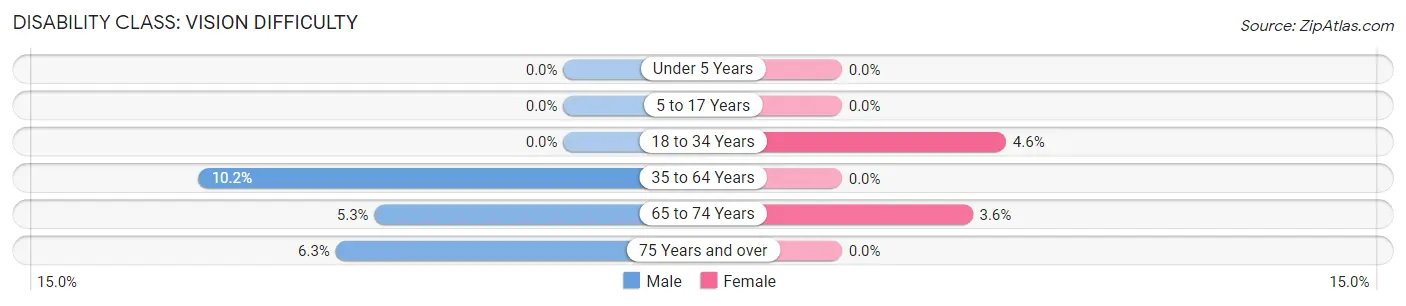
| Age Bracket | Male | Female |
| Under 5 Years | 0 (0.0%) | 0 (0.0%) |
| 5 to 17 Years | 0 (0.0%) | 0 (0.0%) |
| 18 to 34 Years | 0 (0.0%) | 20 (4.6%) |
| 35 to 64 Years | 54 (10.2%) | 0 (0.0%) |
| 65 to 74 Years | 8 (5.3%) | 6 (3.6%) |
| 75 Years and over | 9 (6.3%) | 0 (0.0%) |
Disability Class: Cognitive Difficulty
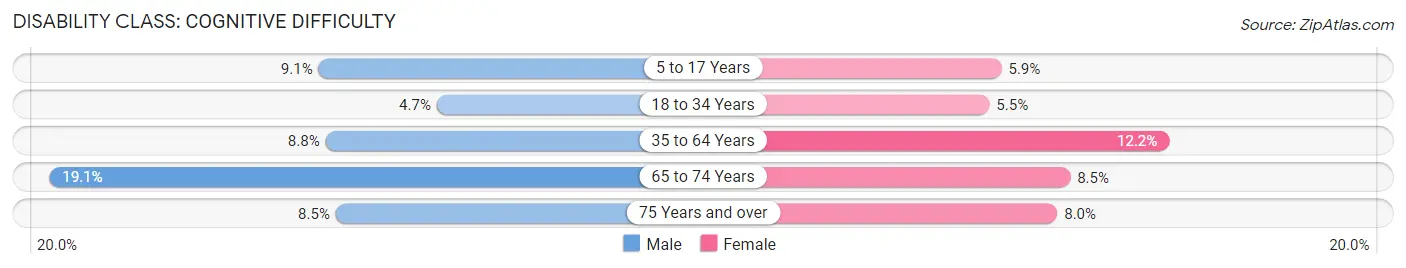
| Age Bracket | Male | Female |
| 5 to 17 Years | 14 (9.1%) | 14 (5.9%) |
| 18 to 34 Years | 11 (4.7%) | 24 (5.5%) |
| 35 to 64 Years | 47 (8.8%) | 69 (12.1%) |
| 65 to 74 Years | 29 (19.1%) | 14 (8.5%) |
| 75 Years and over | 12 (8.5%) | 8 (8.0%) |
Disability Class: Ambulatory Difficulty
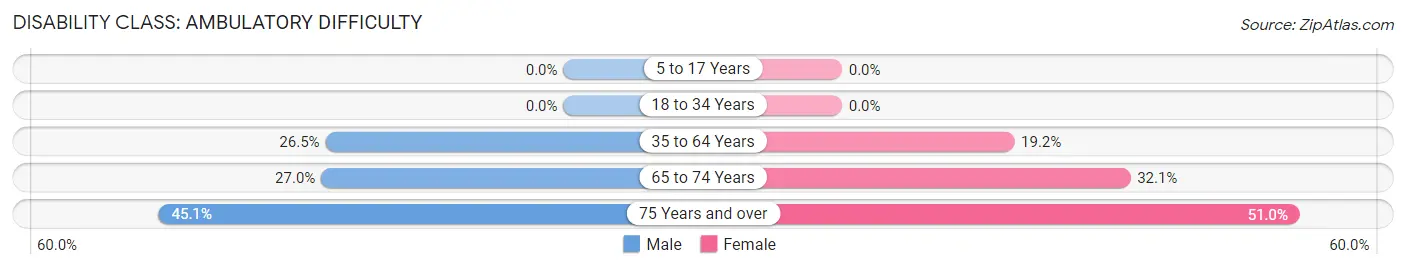
| Age Bracket | Male | Female |
| 5 to 17 Years | 0 (0.0%) | 0 (0.0%) |
| 18 to 34 Years | 0 (0.0%) | 0 (0.0%) |
| 35 to 64 Years | 141 (26.5%) | 109 (19.2%) |
| 65 to 74 Years | 41 (27.0%) | 53 (32.1%) |
| 75 Years and over | 64 (45.1%) | 51 (51.0%) |
Disability Class: Self-Care Difficulty
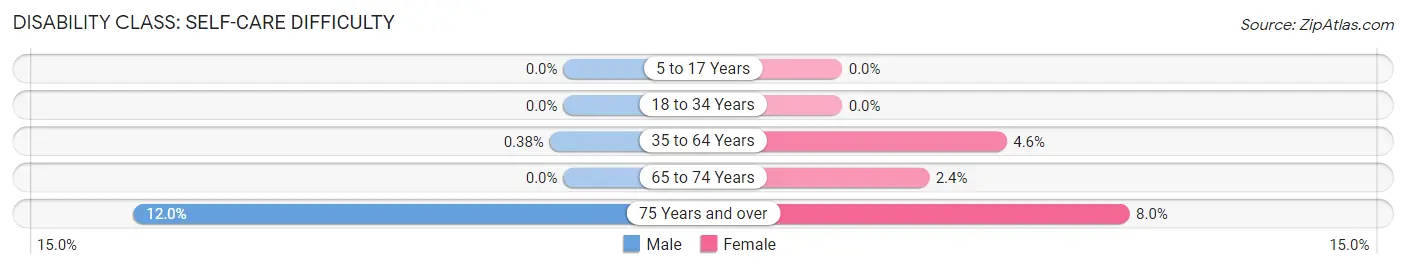
| Age Bracket | Male | Female |
| 5 to 17 Years | 0 (0.0%) | 0 (0.0%) |
| 18 to 34 Years | 0 (0.0%) | 0 (0.0%) |
| 35 to 64 Years | 2 (0.4%) | 26 (4.6%) |
| 65 to 74 Years | 0 (0.0%) | 4 (2.4%) |
| 75 Years and over | 17 (12.0%) | 8 (8.0%) |
Technology Access in Checotah
Computing Device Access in Checotah
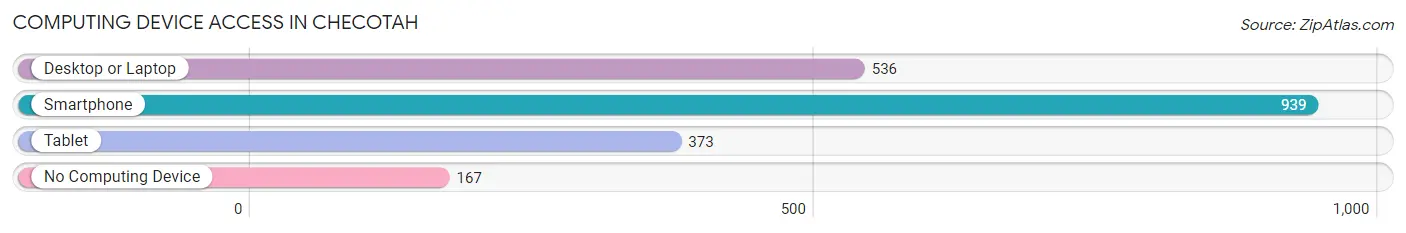
| Device Type | # Households | % Households |
| Desktop or Laptop | 536 | 45.9% |
| Smartphone | 939 | 80.3% |
| Tablet | 373 | 31.9% |
| No Computing Device | 167 | 14.3% |
| Total | 1,169 | 100.0% |
Internet Access in Checotah
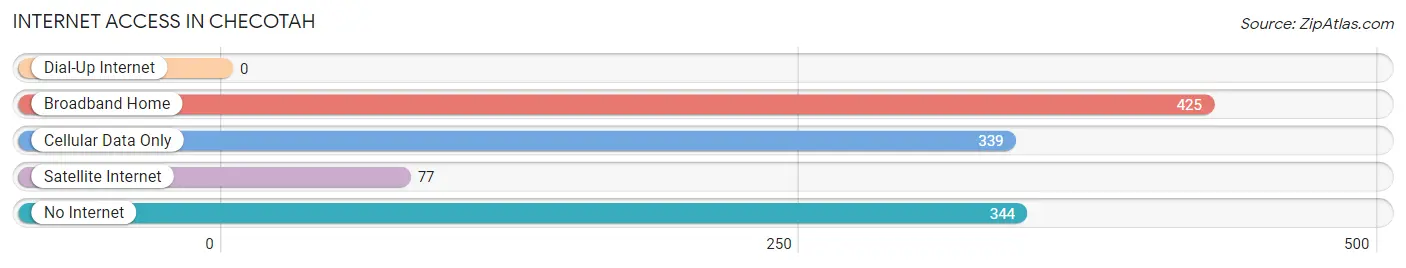
| Internet Type | # Households | % Households |
| Dial-Up Internet | 0 | 0.0% |
| Broadband Home | 425 | 36.4% |
| Cellular Data Only | 339 | 29.0% |
| Satellite Internet | 77 | 6.6% |
| No Internet | 344 | 29.4% |
| Total | 1,169 | 100.0% |
Checotah Summary
Checotah, Oklahoma is a small town located in McIntosh County, Oklahoma. It is situated on the banks of the Arkansas River, approximately 50 miles southeast of Tulsa. The town was founded in 1872 by the Choctaw Nation and was named after Chief Checote, a prominent leader of the tribe. The population of Checotah was 2,481 at the 2010 census, making it the largest town in McIntosh County.
Geography
Checotah is located at 35°25'25" North, 95°30'45" West (35.423, -95.512). According to the United States Census Bureau, the town has a total area of 2.2 square miles (5.7 km2), all of it land.
The town is situated on the Arkansas River, which is a major tributary of the Mississippi River. The Arkansas River is a popular destination for fishing, boating, and other recreational activities.
Climate
Checotah has a humid subtropical climate, with hot, humid summers and mild winters. The average annual temperature is 64°F (18°C). The average annual precipitation is 44.3 inches (112 cm).
Demographics
As of the 2010 census, there were 2,481 people, 1,039 households, and 645 families residing in the town. The population density was 1,125.2 people per square mile (435.3/km2). There were 1,164 housing units at an average density of 527.3 per square mile (203.3/km2). The racial makeup of the town was 79.2% White, 15.2% African American, 0.7% Native American, 0.3% Asian, 0.1% Pacific Islander, 1.2% from other races, and 3.3% from two or more races. Hispanic or Latino of any race were 3.3% of the population.
Economy
Checotah is a small town with a limited economy. The town is home to several small businesses, including a grocery store, a hardware store, a pharmacy, and a few restaurants. The town is also home to a few manufacturing companies, including a furniture manufacturer and a plastics manufacturer.
The town is also home to a few tourist attractions, including the Checotah Indian Nation Museum, the Checotah Historical Museum, and the Checotah Wildlife Refuge.
The town is served by the Checotah Public School System, which consists of three elementary schools, one middle school, and one high school.
Conclusion
Checotah, Oklahoma is a small town located in McIntosh County, Oklahoma. It is situated on the banks of the Arkansas River, approximately 50 miles southeast of Tulsa. The town was founded in 1872 by the Choctaw Nation and was named after Chief Checote, a prominent leader of the tribe. The population of Checotah was 2,481 at the 2010 census, making it the largest town in McIntosh County. The town is home to several small businesses, including a grocery store, a hardware store, a pharmacy, and a few restaurants. The town is also home to a few manufacturing companies, including a furniture manufacturer and a plastics manufacturer. The town is served by the Checotah Public School System, which consists of three elementary schools, one middle school, and one high school. Checotah is a small town with a limited economy, but it is a great place to live and visit.
Common Questions
What is Per Capita Income in Checotah?
Per Capita income in Checotah is $22,391.
What is the Median Family Income in Checotah?
Median Family Income in Checotah is $46,985.
What is the Median Household income in Checotah?
Median Household Income in Checotah is $36,208.
What is Income or Wage Gap in Checotah?
Income or Wage Gap in Checotah is 36.9%.
Women in Checotah earn 63.1 cents for every dollar earned by a man.
What is Inequality or Gini Index in Checotah?
Inequality or Gini Index in Checotah is 0.48.
What is the Total Population of Checotah?
Total Population of Checotah is 3,048.
What is the Total Male Population of Checotah?
Total Male Population of Checotah is 1,347.
What is the Total Female Population of Checotah?
Total Female Population of Checotah is 1,701.
What is the Ratio of Males per 100 Females in Checotah?
There are 79.19 Males per 100 Females in Checotah.
What is the Ratio of Females per 100 Males in Checotah?
There are 126.28 Females per 100 Males in Checotah.
What is the Median Population Age in Checotah?
Median Population Age in Checotah is 40.4 Years.
What is the Average Family Size in Checotah
Average Family Size in Checotah is 3.1 People.
What is the Average Household Size in Checotah
Average Household Size in Checotah is 2.5 People.
How Large is the Labor Force in Checotah?
There are 1,171 People in the Labor Forcein in Checotah.
What is the Percentage of People in the Labor Force in Checotah?
48.2% of People are in the Labor Force in Checotah.
What is the Unemployment Rate in Checotah?
Unemployment Rate in Checotah is 9.4%.