Alva, OK Map & Demographics
Alva Map
Alva Overview
$28,218
PER CAPITA INCOME
$81,091
AVG FAMILY INCOME
$41,809
AVG HOUSEHOLD INCOME
32.2%
WAGE / INCOME GAP [ % ]
67.8¢/ $1
WAGE / INCOME GAP [ $ ]
0.48
INEQUALITY / GINI INDEX
5,020
TOTAL POPULATION
2,436
MALE POPULATION
2,584
FEMALE POPULATION
94.27
MALES / 100 FEMALES
106.08
FEMALES / 100 MALES
29.2
MEDIAN AGE
3.1
AVG FAMILY SIZE
2.3
AVG HOUSEHOLD SIZE
2,678
LABOR FORCE [ PEOPLE ]
66.0%
PERCENT IN LABOR FORCE
5.1%
UNEMPLOYMENT RATE
Alva Zip Codes
Alva Area Codes
Income in Alva
Income Overview in Alva
Per Capita Income in Alva is $28,218, while median incomes of families and households are $81,091 and $41,809 respectively.
| Characteristic | Number | Measure |
| Per Capita Income | 5,020 | $28,218 |
| Median Family Income | 950 | $81,091 |
| Mean Family Income | 950 | $87,471 |
| Median Household Income | 1,955 | $41,809 |
| Mean Household Income | 1,955 | $68,496 |
| Income Deficit | 950 | $0 |
| Wage / Income Gap (%) | 5,020 | 32.19% |
| Wage / Income Gap ($) | 5,020 | 67.81¢ per $1 |
| Gini / Inequality Index | 5,020 | 0.48 |
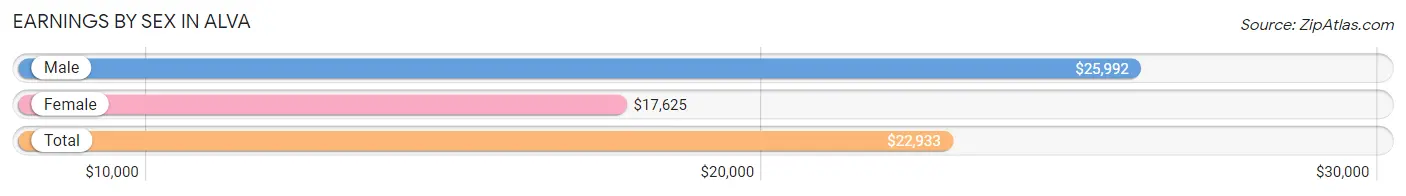
Earnings by Sex in Alva
Average Earnings in Alva are $22,933, $25,992 for men and $17,625 for women, a difference of 32.2%.
| Sex | Number | Average Earnings |
| Male | 1,588 (53.0%) | $25,992 |
| Female | 1,406 (47.0%) | $17,625 |
| Total | 2,994 (100.0%) | $22,933 |
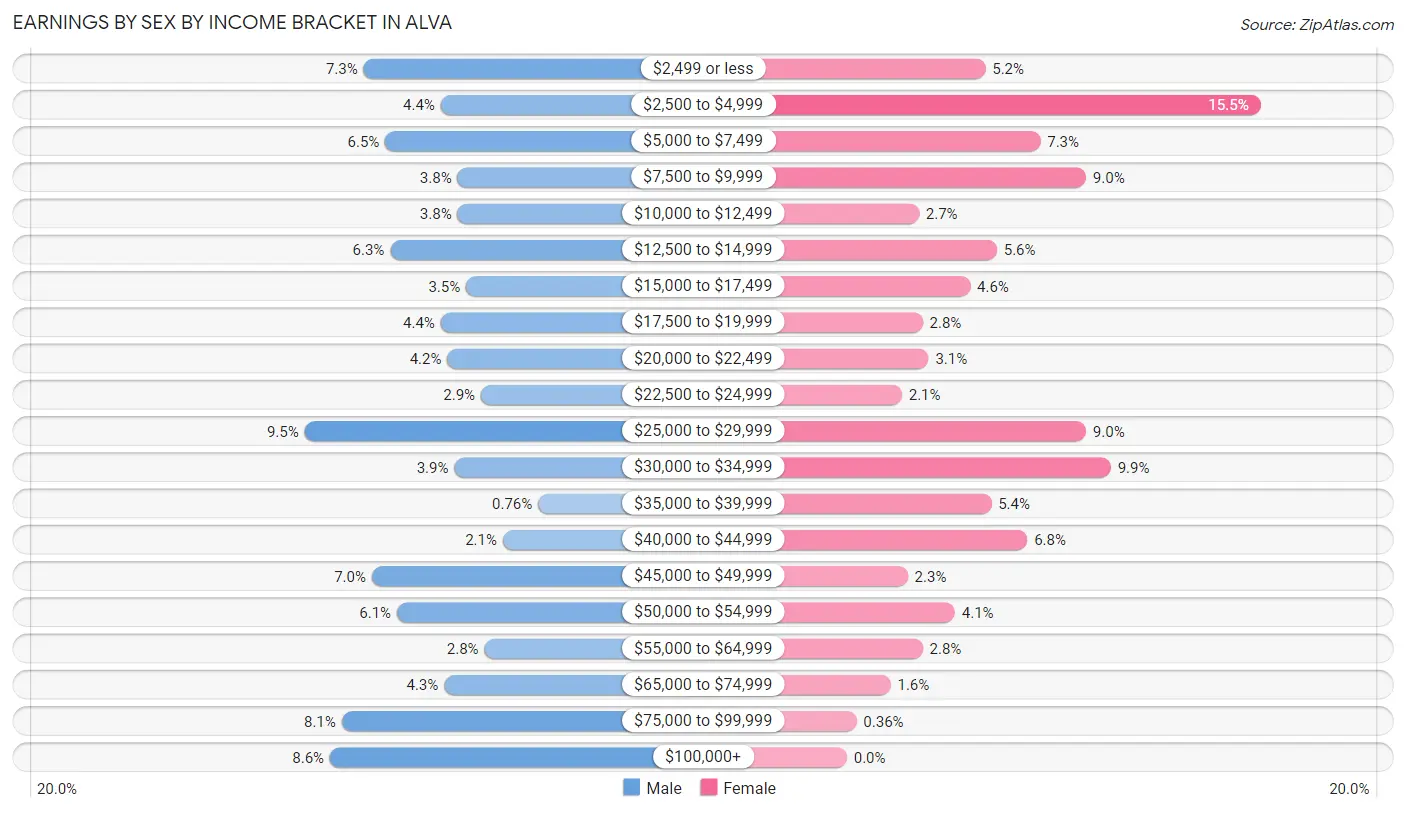
Earnings by Sex by Income Bracket in Alva
The most common earnings brackets in Alva are $25,000 to $29,999 for men (151 | 9.5%) and $2,500 to $4,999 for women (218 | 15.5%).
| Income | Male | Female |
| $2,499 or less | 116 (7.3%) | 73 (5.2%) |
| $2,500 to $4,999 | 70 (4.4%) | 218 (15.5%) |
| $5,000 to $7,499 | 103 (6.5%) | 102 (7.2%) |
| $7,500 to $9,999 | 60 (3.8%) | 126 (9.0%) |
| $10,000 to $12,499 | 60 (3.8%) | 38 (2.7%) |
| $12,500 to $14,999 | 100 (6.3%) | 79 (5.6%) |
| $15,000 to $17,499 | 55 (3.5%) | 65 (4.6%) |
| $17,500 to $19,999 | 70 (4.4%) | 40 (2.8%) |
| $20,000 to $22,499 | 66 (4.2%) | 43 (3.1%) |
| $22,500 to $24,999 | 46 (2.9%) | 29 (2.1%) |
| $25,000 to $29,999 | 151 (9.5%) | 126 (9.0%) |
| $30,000 to $34,999 | 62 (3.9%) | 139 (9.9%) |
| $35,000 to $39,999 | 12 (0.8%) | 76 (5.4%) |
| $40,000 to $44,999 | 33 (2.1%) | 95 (6.8%) |
| $45,000 to $49,999 | 111 (7.0%) | 32 (2.3%) |
| $50,000 to $54,999 | 96 (6.0%) | 57 (4.1%) |
| $55,000 to $64,999 | 44 (2.8%) | 40 (2.8%) |
| $65,000 to $74,999 | 68 (4.3%) | 23 (1.6%) |
| $75,000 to $99,999 | 129 (8.1%) | 5 (0.4%) |
| $100,000+ | 136 (8.6%) | 0 (0.0%) |
| Total | 1,588 (100.0%) | 1,406 (100.0%) |
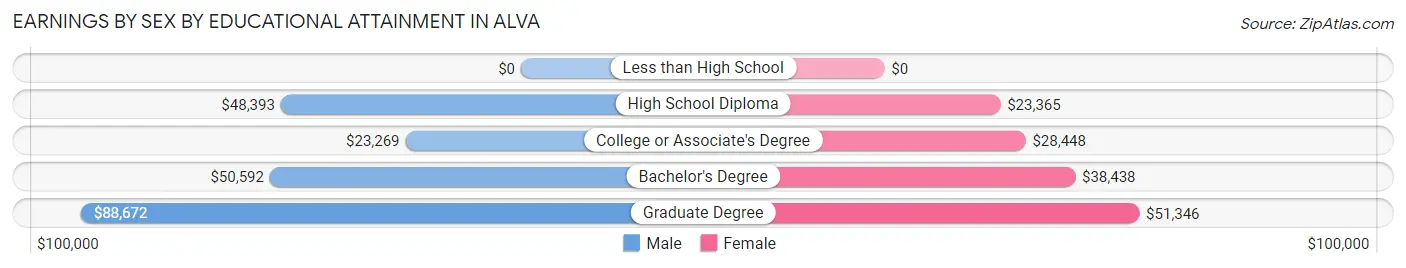
Earnings by Sex by Educational Attainment in Alva
Average earnings in Alva are $46,168 for men and $29,500 for women, a difference of 36.1%. Men with an educational attainment of graduate degree enjoy the highest average annual earnings of $88,672, while those with college or associate's degree education earn the least with $23,269. Women with an educational attainment of graduate degree earn the most with the average annual earnings of $51,346, while those with high school diploma education have the smallest earnings of $23,365.
| Educational Attainment | Male Income | Female Income |
| Less than High School | - | - |
| High School Diploma | $48,393 | $23,365 |
| College or Associate's Degree | $23,269 | $28,448 |
| Bachelor's Degree | $50,592 | $38,438 |
| Graduate Degree | $88,672 | $51,346 |
| Total | $46,168 | $29,500 |
Family Income in Alva
Family Income Brackets in Alva
According to the Alva family income data, there are 280 families falling into the $100,000 to $149,999 income range, which is the most common income bracket and makes up 29.5% of all families.
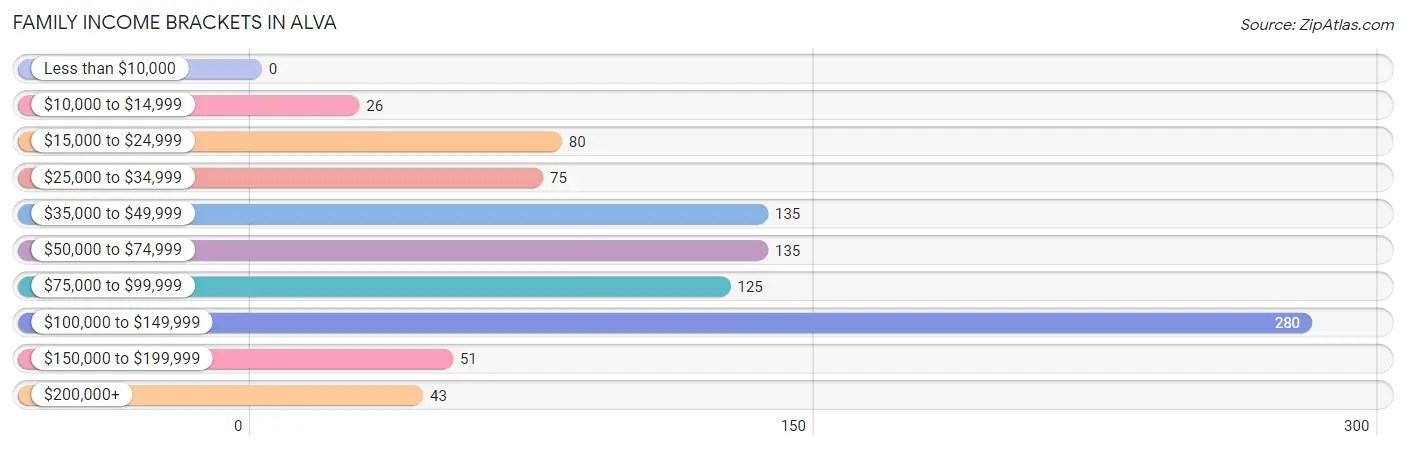
| Income Bracket | # Families | % Families |
| Less than $10,000 | 0 | 0.0% |
| $10,000 to $14,999 | 26 | 2.7% |
| $15,000 to $24,999 | 80 | 8.4% |
| $25,000 to $34,999 | 75 | 7.9% |
| $35,000 to $49,999 | 135 | 14.2% |
| $50,000 to $74,999 | 135 | 14.2% |
| $75,000 to $99,999 | 125 | 13.2% |
| $100,000 to $149,999 | 280 | 29.5% |
| $150,000 to $199,999 | 51 | 5.4% |
| $200,000+ | 43 | 4.5% |
Family Income by Famaliy Size in Alva
5-person families (61 | 6.4%) account for the highest median family income in Alva with $177,689 per family, while 5-person families (61 | 6.4%) have the highest median income of $35,538 per family member.
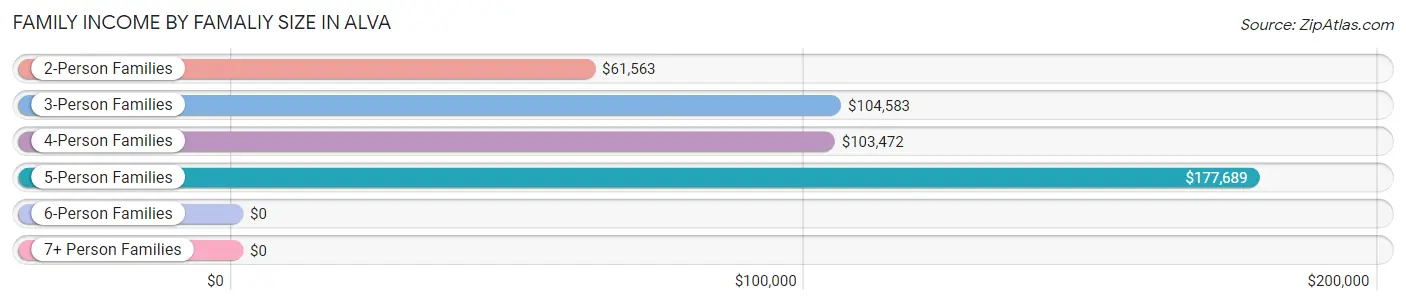
| Income Bracket | # Families | Median Income |
| 2-Person Families | 584 (61.5%) | $61,563 |
| 3-Person Families | 125 (13.2%) | $104,583 |
| 4-Person Families | 180 (19.0%) | $103,472 |
| 5-Person Families | 61 (6.4%) | $177,689 |
| 6-Person Families | 0 (0.0%) | $0 |
| 7+ Person Families | 0 (0.0%) | $0 |
| Total | 950 (100.0%) | $81,091 |
Family Income by Number of Earners in Alva
The median family income in Alva is $81,091, with families comprising 3+ earners (41) having the highest median family income of $95,982, while families with 1 earner (413) have the lowest median family income of $64,345, accounting for 4.3% and 43.5% of families, respectively.
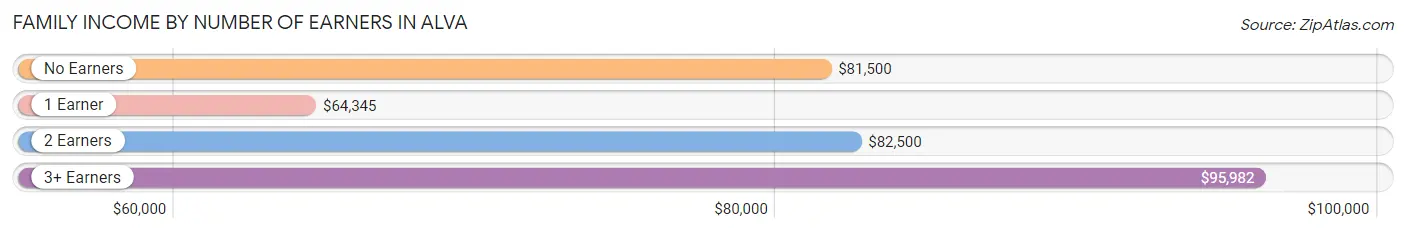
| Number of Earners | # Families | Median Income |
| No Earners | 74 (7.8%) | $81,500 |
| 1 Earner | 413 (43.5%) | $64,345 |
| 2 Earners | 422 (44.4%) | $82,500 |
| 3+ Earners | 41 (4.3%) | $95,982 |
| Total | 950 (100.0%) | $81,091 |
Household Income in Alva
Household Income Brackets in Alva
With 414 households falling in the category, the $25,000 to $34,999 income range is the most frequent in Alva, accounting for 21.2% of all households. In contrast, only 57 households (2.9%) fall into the $150,000 to $199,999 income bracket, making it the least populous group.
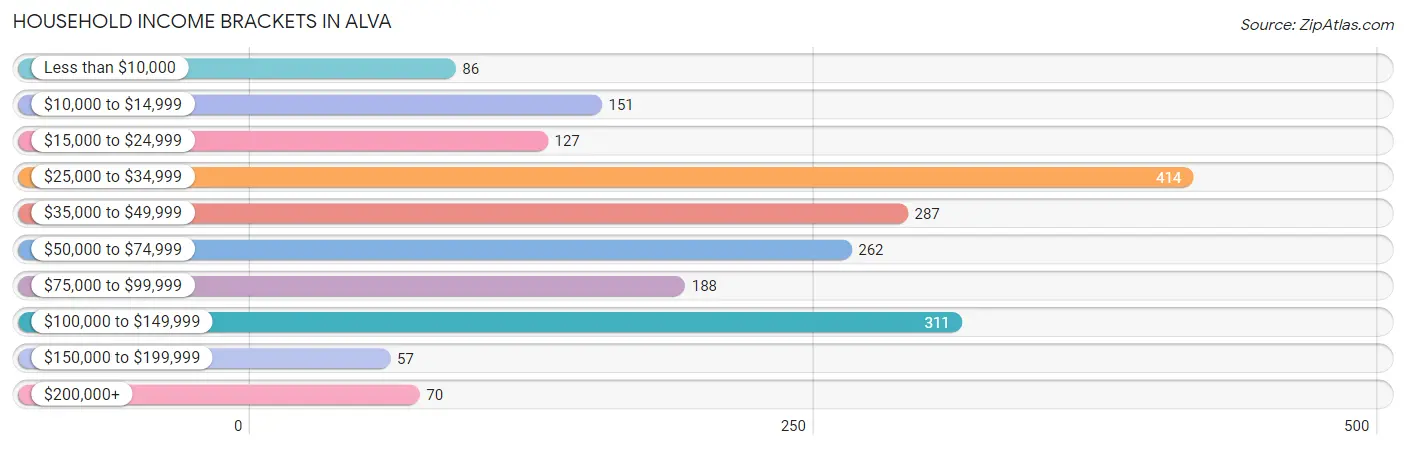
| Income Bracket | # Households | % Households |
| Less than $10,000 | 86 | 4.4% |
| $10,000 to $14,999 | 151 | 7.7% |
| $15,000 to $24,999 | 127 | 6.5% |
| $25,000 to $34,999 | 414 | 21.2% |
| $35,000 to $49,999 | 287 | 14.7% |
| $50,000 to $74,999 | 262 | 13.4% |
| $75,000 to $99,999 | 188 | 9.6% |
| $100,000 to $149,999 | 311 | 15.9% |
| $150,000 to $199,999 | 57 | 2.9% |
| $200,000+ | 70 | 3.6% |
Household Income by Householder Age in Alva
The median household income in Alva is $41,809, with the highest median household income of $58,162 found in the 65+ years age bracket for the primary householder. A total of 499 households (25.5%) fall into this category. Meanwhile, the 15 to 24 years age bracket for the primary householder has the lowest median household income of $30,938, with 291 households (14.9%) in this group.
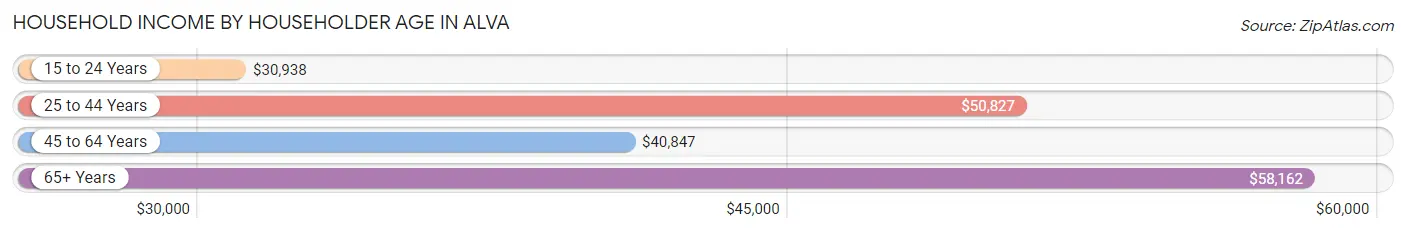
| Income Bracket | # Households | Median Income |
| 15 to 24 Years | 291 (14.9%) | $30,938 |
| 25 to 44 Years | 701 (35.9%) | $50,827 |
| 45 to 64 Years | 464 (23.7%) | $40,847 |
| 65+ Years | 499 (25.5%) | $58,162 |
| Total | 1,955 (100.0%) | $41,809 |
Poverty in Alva
Income Below Poverty by Sex and Age in Alva
With 22.8% poverty level for males and 20.9% for females among the residents of Alva, 18 to 24 year old males and 18 to 24 year old females are the most vulnerable to poverty, with 354 males (67.2%) and 289 females (76.5%) in their respective age groups living below the poverty level.
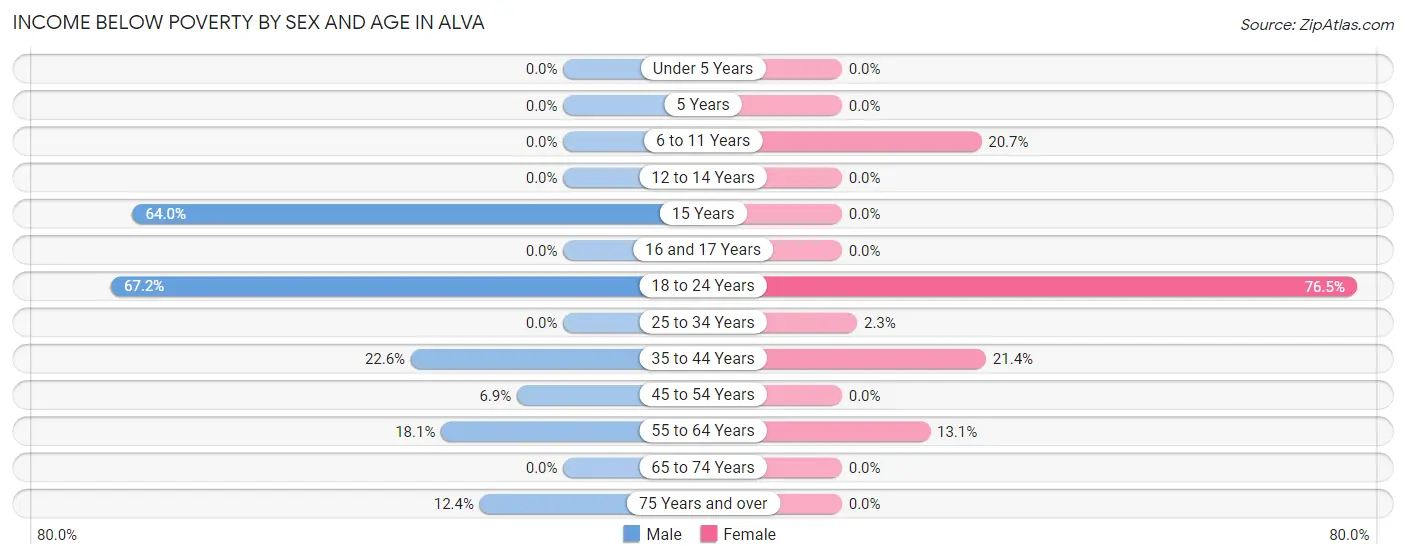
| Age Bracket | Male | Female |
| Under 5 Years | 0 (0.0%) | 0 (0.0%) |
| 5 Years | 0 (0.0%) | 0 (0.0%) |
| 6 to 11 Years | 0 (0.0%) | 58 (20.7%) |
| 12 to 14 Years | 0 (0.0%) | 0 (0.0%) |
| 15 Years | 55 (63.9%) | 0 (0.0%) |
| 16 and 17 Years | 0 (0.0%) | 0 (0.0%) |
| 18 to 24 Years | 354 (67.2%) | 289 (76.5%) |
| 25 to 34 Years | 0 (0.0%) | 5 (2.3%) |
| 35 to 44 Years | 74 (22.6%) | 61 (21.4%) |
| 45 to 54 Years | 11 (6.9%) | 0 (0.0%) |
| 55 to 64 Years | 31 (18.1%) | 41 (13.1%) |
| 65 to 74 Years | 0 (0.0%) | 0 (0.0%) |
| 75 Years and over | 17 (12.4%) | 0 (0.0%) |
| Total | 542 (22.8%) | 454 (20.9%) |
Income Above Poverty by Sex and Age in Alva
According to the poverty statistics in Alva, males aged under 5 years and females aged under 5 years are the age groups that are most secure financially, with 100.0% of males and 100.0% of females in these age groups living above the poverty line.
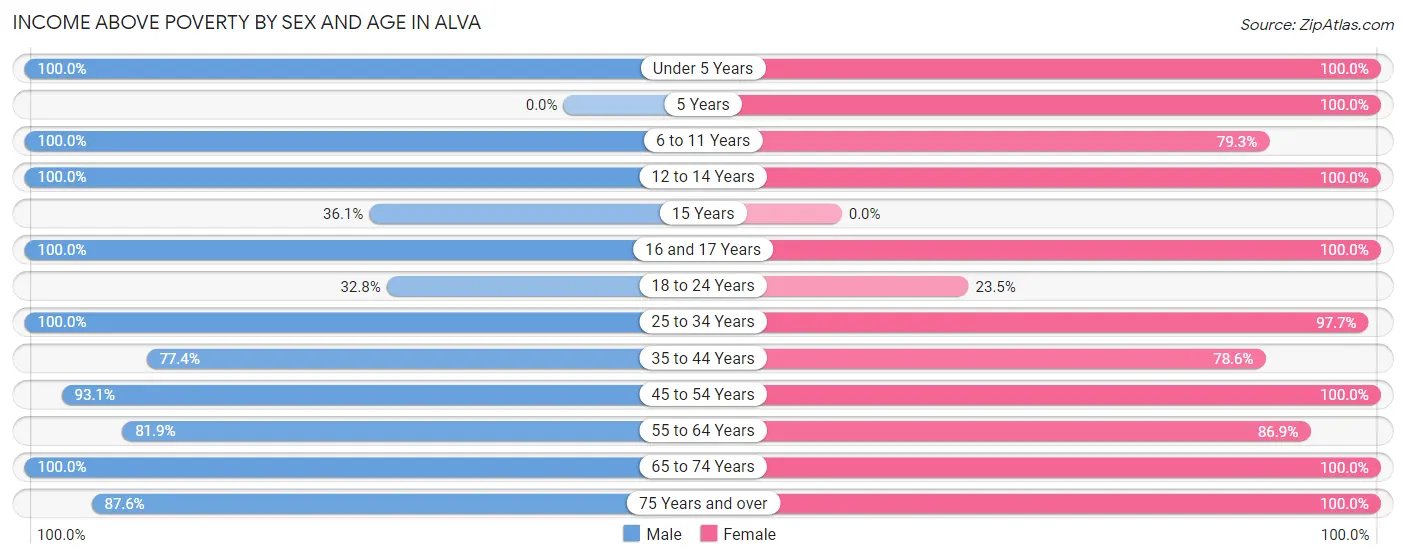
| Age Bracket | Male | Female |
| Under 5 Years | 114 (100.0%) | 129 (100.0%) |
| 5 Years | 0 (0.0%) | 24 (100.0%) |
| 6 to 11 Years | 137 (100.0%) | 222 (79.3%) |
| 12 to 14 Years | 133 (100.0%) | 58 (100.0%) |
| 15 Years | 31 (36.0%) | 0 (0.0%) |
| 16 and 17 Years | 23 (100.0%) | 15 (100.0%) |
| 18 to 24 Years | 173 (32.8%) | 89 (23.5%) |
| 25 to 34 Years | 381 (100.0%) | 216 (97.7%) |
| 35 to 44 Years | 253 (77.4%) | 224 (78.6%) |
| 45 to 54 Years | 149 (93.1%) | 162 (100.0%) |
| 55 to 64 Years | 140 (81.9%) | 272 (86.9%) |
| 65 to 74 Years | 179 (100.0%) | 149 (100.0%) |
| 75 Years and over | 120 (87.6%) | 158 (100.0%) |
| Total | 1,833 (77.2%) | 1,718 (79.1%) |
Income Below Poverty Among Married-Couple Families in Alva
The poverty statistics for married-couple families in Alva show that 1.9% or 15 of the total 793 families live below the poverty line. Families with no children have the highest poverty rate of 3.0%, comprising of 15 families. On the other hand, families with 1 or 2 children have the lowest poverty rate of 0.0%, which includes 0 families.
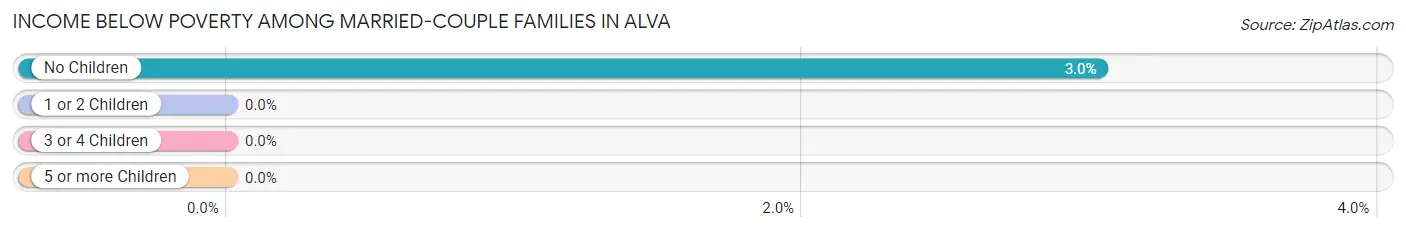
| Children | Above Poverty | Below Poverty |
| No Children | 480 (97.0%) | 15 (3.0%) |
| 1 or 2 Children | 237 (100.0%) | 0 (0.0%) |
| 3 or 4 Children | 61 (100.0%) | 0 (0.0%) |
| 5 or more Children | 0 (0.0%) | 0 (0.0%) |
| Total | 778 (98.1%) | 15 (1.9%) |
Income Below Poverty Among Single-Parent Households in Alva
According to the poverty data in Alva, 44.7% or 17 single-father households and 39.5% or 47 single-mother households are living below the poverty line. Among single-father households, those with no children have the highest poverty rate, with 17 households (100.0%) experiencing poverty. Likewise, among single-mother households, those with no children have the highest poverty rate, with 31 households (100.0%) falling below the poverty line.
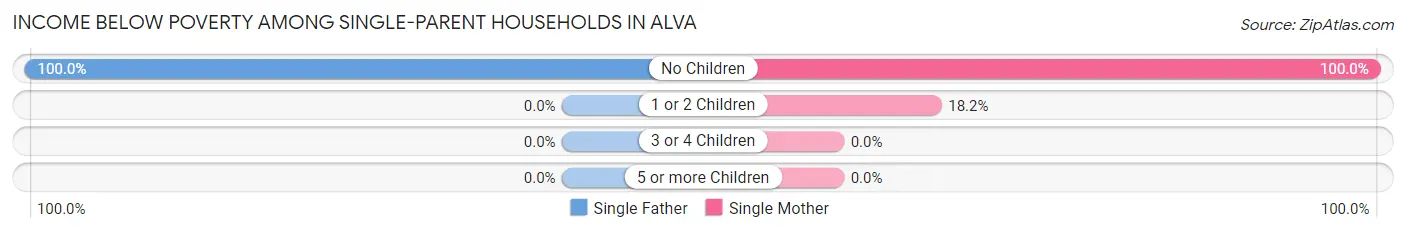
| Children | Single Father | Single Mother |
| No Children | 17 (100.0%) | 31 (100.0%) |
| 1 or 2 Children | 0 (0.0%) | 16 (18.2%) |
| 3 or 4 Children | 0 (0.0%) | 0 (0.0%) |
| 5 or more Children | 0 (0.0%) | 0 (0.0%) |
| Total | 17 (44.7%) | 47 (39.5%) |
Income Below Poverty Among Married-Couple vs Single-Parent Households in Alva
The poverty data for Alva shows that 15 of the married-couple family households (1.9%) and 64 of the single-parent households (40.8%) are living below the poverty level. Within the married-couple family households, those with no children have the highest poverty rate, with 15 households (3.0%) falling below the poverty line. Among the single-parent households, those with no children have the highest poverty rate, with 48 household (100.0%) living below poverty.
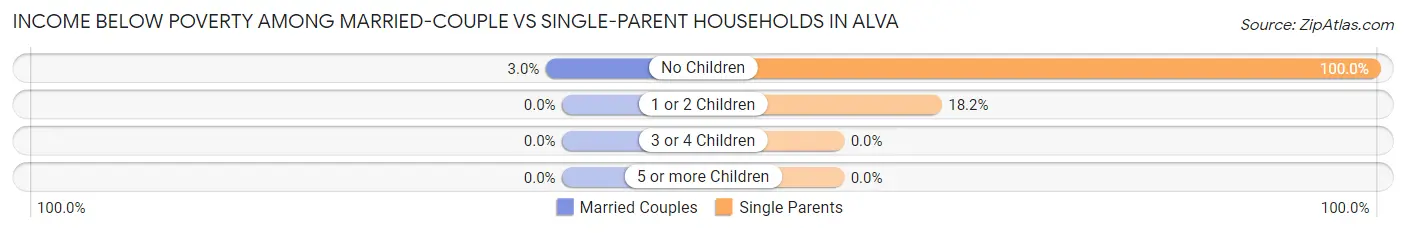
| Children | Married-Couple Families | Single-Parent Households |
| No Children | 15 (3.0%) | 48 (100.0%) |
| 1 or 2 Children | 0 (0.0%) | 16 (18.2%) |
| 3 or 4 Children | 0 (0.0%) | 0 (0.0%) |
| 5 or more Children | 0 (0.0%) | 0 (0.0%) |
| Total | 15 (1.9%) | 64 (40.8%) |
Race in Alva
The most populous races in Alva are White / Caucasian (4,533 | 90.3%), Hispanic or Latino (548 | 10.9%), and Two or more Races (220 | 4.4%).
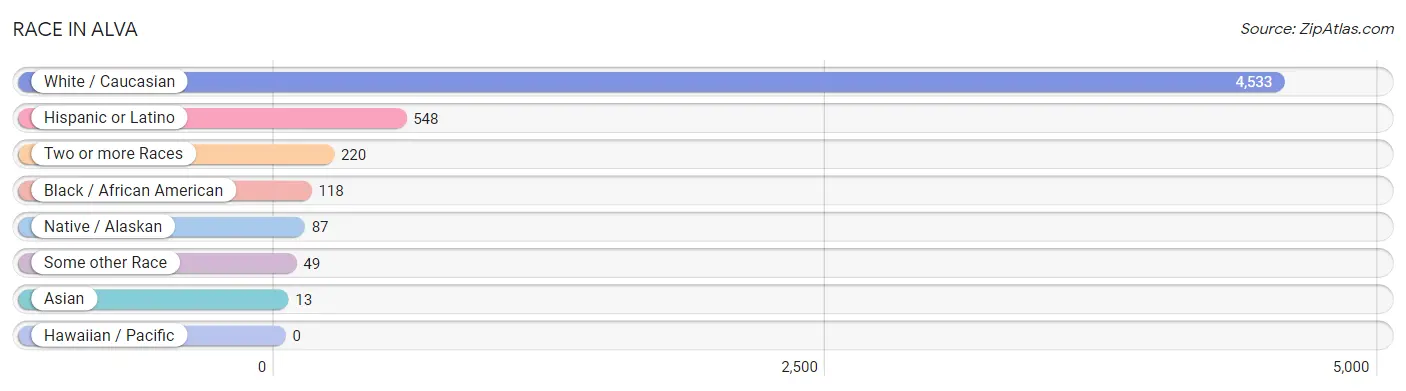
| Race | # Population | % Population |
| Asian | 13 | 0.3% |
| Black / African American | 118 | 2.4% |
| Hawaiian / Pacific | 0 | 0.0% |
| Hispanic or Latino | 548 | 10.9% |
| Native / Alaskan | 87 | 1.7% |
| White / Caucasian | 4,533 | 90.3% |
| Two or more Races | 220 | 4.4% |
| Some other Race | 49 | 1.0% |
| Total | 5,020 | 100.0% |
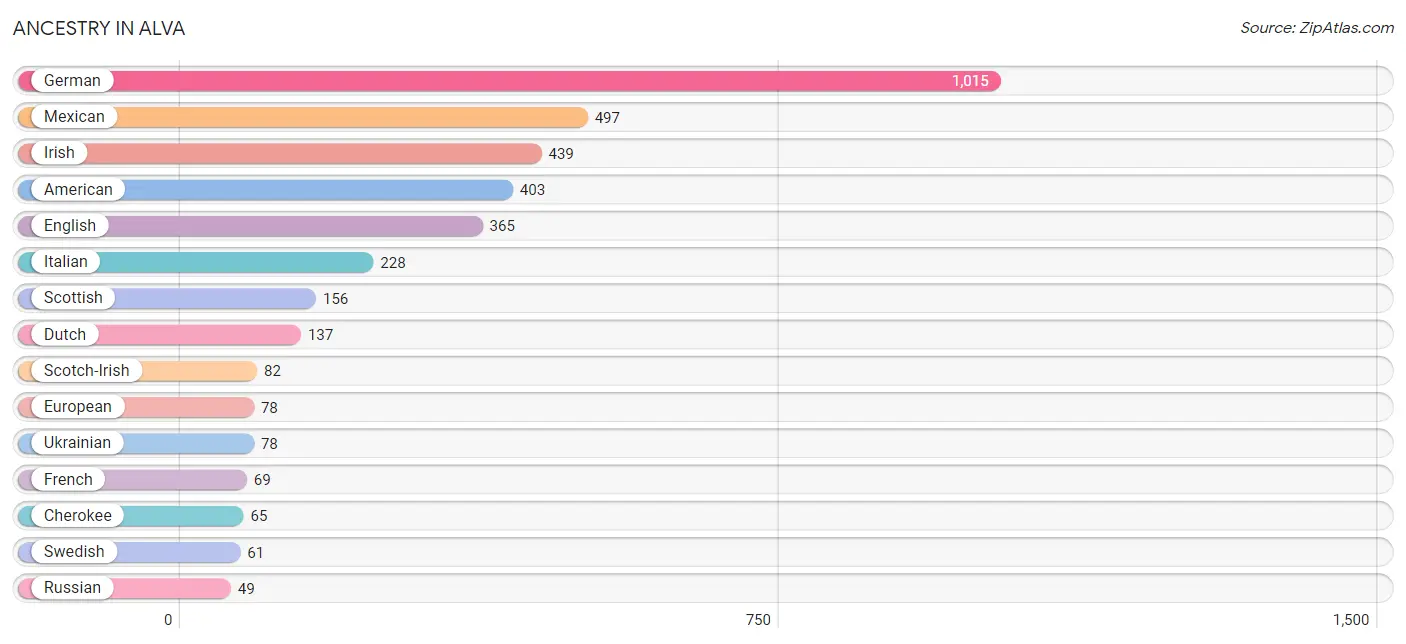
Ancestry in Alva
The most populous ancestries reported in Alva are German (1,015 | 20.2%), Mexican (497 | 9.9%), Irish (439 | 8.7%), American (403 | 8.0%), and English (365 | 7.3%), together accounting for 54.2% of all Alva residents.
| Ancestry | # Population | % Population |
| American | 403 | 8.0% |
| Apache | 26 | 0.5% |
| Arab | 8 | 0.2% |
| Belgian | 31 | 0.6% |
| Blackfeet | 46 | 0.9% |
| British | 44 | 0.9% |
| Canadian | 7 | 0.1% |
| Cherokee | 65 | 1.3% |
| Cheyenne | 9 | 0.2% |
| Chickasaw | 25 | 0.5% |
| Comanche | 26 | 0.5% |
| Creek | 12 | 0.2% |
| Czech | 25 | 0.5% |
| Danish | 24 | 0.5% |
| Dutch | 137 | 2.7% |
| English | 365 | 7.3% |
| European | 78 | 1.5% |
| French | 69 | 1.4% |
| German | 1,015 | 20.2% |
| Greek | 12 | 0.2% |
| Hungarian | 25 | 0.5% |
| Indian (Asian) | 5 | 0.1% |
| Irish | 439 | 8.7% |
| Italian | 228 | 4.5% |
| Korean | 16 | 0.3% |
| Lebanese | 8 | 0.2% |
| Mexican | 497 | 9.9% |
| Norwegian | 31 | 0.6% |
| Polish | 27 | 0.5% |
| Puerto Rican | 21 | 0.4% |
| Russian | 49 | 1.0% |
| Scandinavian | 12 | 0.2% |
| Scotch-Irish | 82 | 1.6% |
| Scottish | 156 | 3.1% |
| Spaniard | 21 | 0.4% |
| Spanish | 9 | 0.2% |
| Spanish American Indian | 1 | 0.0% |
| Swedish | 61 | 1.2% |
| Swiss | 41 | 0.8% |
| Ukrainian | 78 | 1.5% |
| Welsh | 21 | 0.4% | View All 41 Rows |
Immigrants in Alva
The most numerous immigrant groups reported in Alva came from Europe (88 | 1.8%), Eastern Europe (78 | 1.5%), Ukraine (78 | 1.5%), Central America (23 | 0.5%), and Latin America (23 | 0.5%), together accounting for 5.8% of all Alva residents.
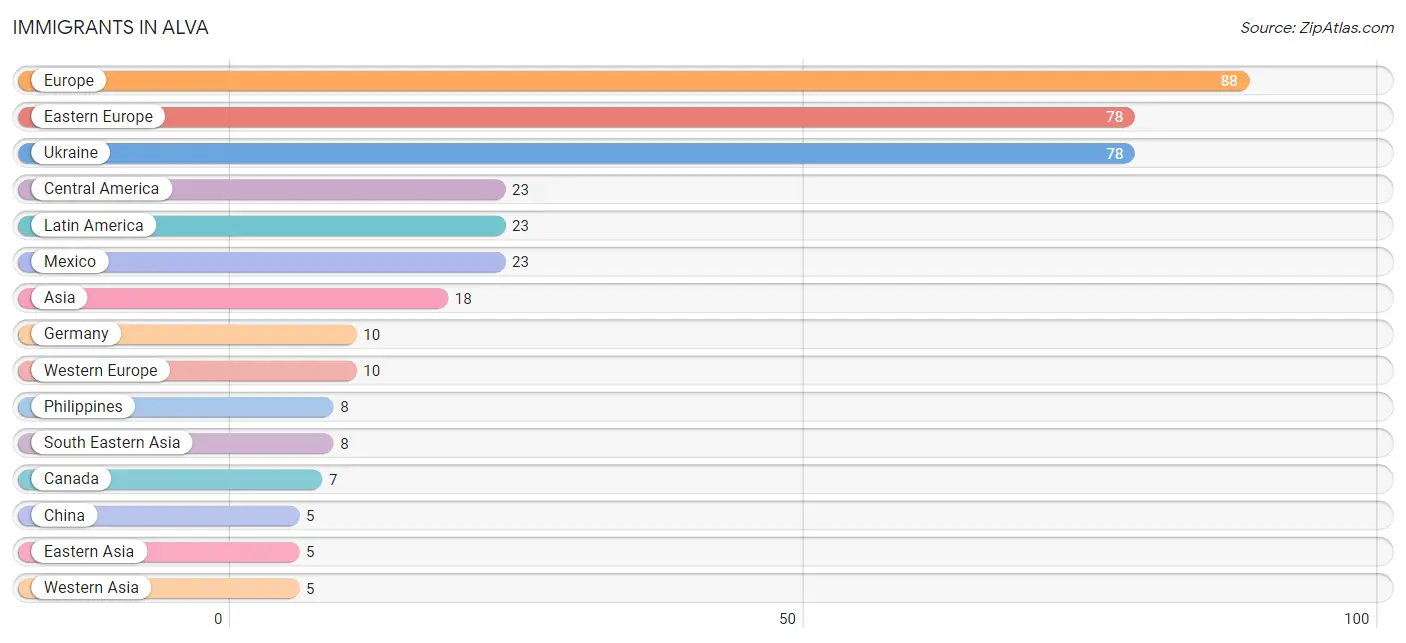
| Immigration Origin | # Population | % Population |
| Asia | 18 | 0.4% |
| Canada | 7 | 0.1% |
| Central America | 23 | 0.5% |
| China | 5 | 0.1% |
| Eastern Asia | 5 | 0.1% |
| Eastern Europe | 78 | 1.5% |
| Europe | 88 | 1.8% |
| Germany | 10 | 0.2% |
| Latin America | 23 | 0.5% |
| Mexico | 23 | 0.5% |
| Philippines | 8 | 0.2% |
| South Eastern Asia | 8 | 0.2% |
| Ukraine | 78 | 1.5% |
| Western Asia | 5 | 0.1% |
| Western Europe | 10 | 0.2% | View All 15 Rows |
Sex and Age in Alva
Sex and Age in Alva
The most populous age groups in Alva are 20 to 24 Years (500 | 20.5%) for men and 20 to 24 Years (458 | 17.7%) for women.
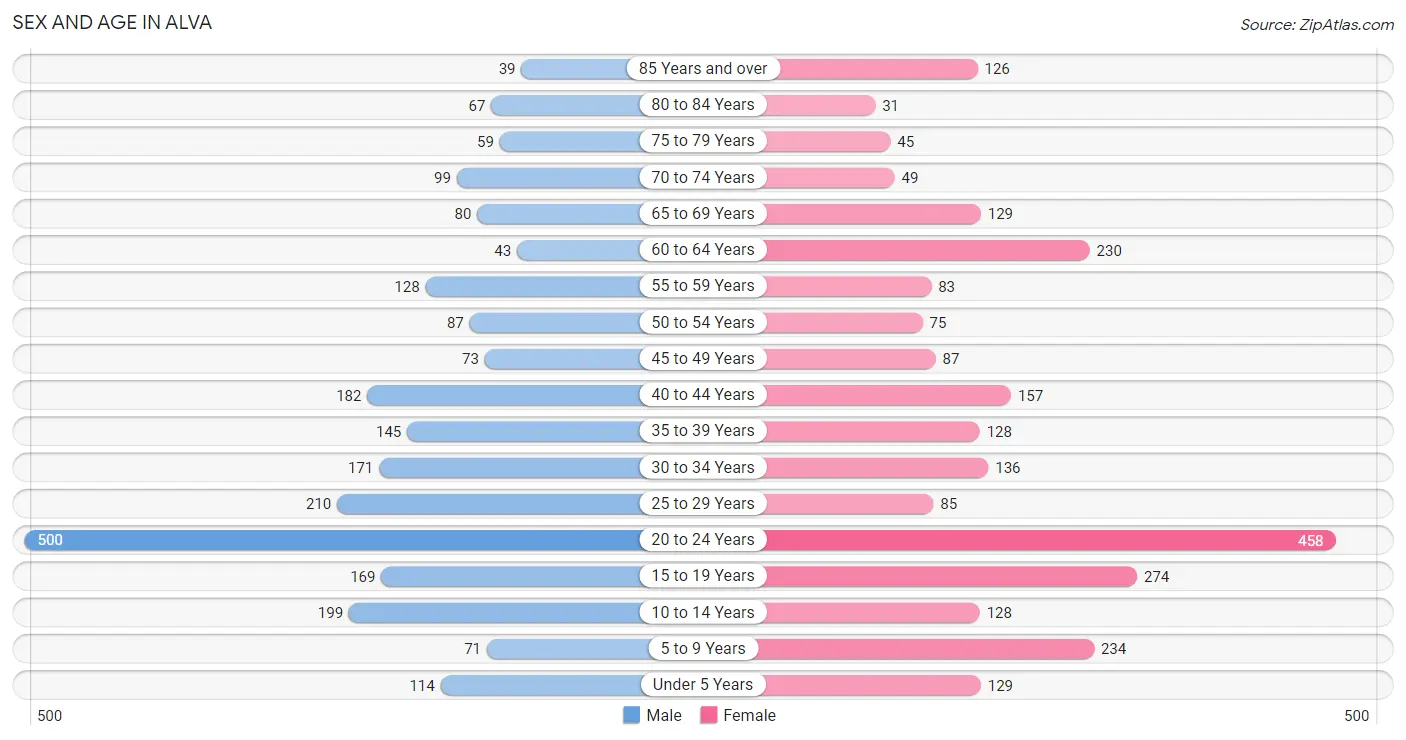
| Age Bracket | Male | Female |
| Under 5 Years | 114 (4.7%) | 129 (5.0%) |
| 5 to 9 Years | 71 (2.9%) | 234 (9.1%) |
| 10 to 14 Years | 199 (8.2%) | 128 (5.0%) |
| 15 to 19 Years | 169 (6.9%) | 274 (10.6%) |
| 20 to 24 Years | 500 (20.5%) | 458 (17.7%) |
| 25 to 29 Years | 210 (8.6%) | 85 (3.3%) |
| 30 to 34 Years | 171 (7.0%) | 136 (5.3%) |
| 35 to 39 Years | 145 (5.9%) | 128 (5.0%) |
| 40 to 44 Years | 182 (7.5%) | 157 (6.1%) |
| 45 to 49 Years | 73 (3.0%) | 87 (3.4%) |
| 50 to 54 Years | 87 (3.6%) | 75 (2.9%) |
| 55 to 59 Years | 128 (5.2%) | 83 (3.2%) |
| 60 to 64 Years | 43 (1.8%) | 230 (8.9%) |
| 65 to 69 Years | 80 (3.3%) | 129 (5.0%) |
| 70 to 74 Years | 99 (4.1%) | 49 (1.9%) |
| 75 to 79 Years | 59 (2.4%) | 45 (1.7%) |
| 80 to 84 Years | 67 (2.8%) | 31 (1.2%) |
| 85 Years and over | 39 (1.6%) | 126 (4.9%) |
| Total | 2,436 (100.0%) | 2,584 (100.0%) |
Families and Households in Alva
Median Family Size in Alva
The median family size in Alva is 3.12 persons per family, with single male/father families (38 | 4.0%) accounting for the largest median family size of 5.45 persons per family. On the other hand, married-couple families (793 | 83.5%) represent the smallest median family size with 2.99 persons per family.
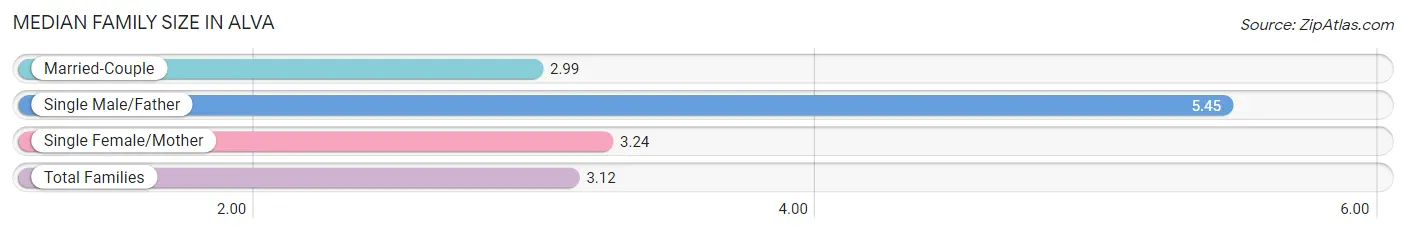
| Family Type | # Families | Family Size |
| Married-Couple | 793 (83.5%) | 2.99 |
| Single Male/Father | 38 (4.0%) | 5.45 |
| Single Female/Mother | 119 (12.5%) | 3.24 |
| Total Families | 950 (100.0%) | 3.12 |
Median Household Size in Alva
The median household size in Alva is 2.33 persons per household, with single male/father households (38 | 1.9%) accounting for the largest median household size of 6.37 persons per household. non-family households (1,005 | 51.4%) represent the smallest median household size with 1.51 persons per household.
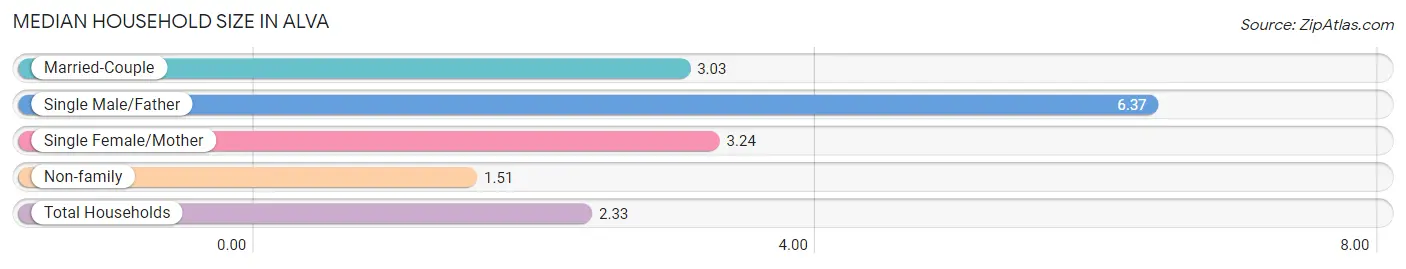
| Household Type | # Households | Household Size |
| Married-Couple | 793 (40.6%) | 3.03 |
| Single Male/Father | 38 (1.9%) | 6.37 |
| Single Female/Mother | 119 (6.1%) | 3.24 |
| Non-family | 1,005 (51.4%) | 1.51 |
| Total Households | 1,955 (100.0%) | 2.33 |
Household Size by Marriage Status in Alva
Out of a total of 1,955 households in Alva, 950 (48.6%) are family households, while 1,005 (51.4%) are nonfamily households. The most numerous type of family households are 2-person households, comprising 569, and the most common type of nonfamily households are 1-person households, comprising 770.
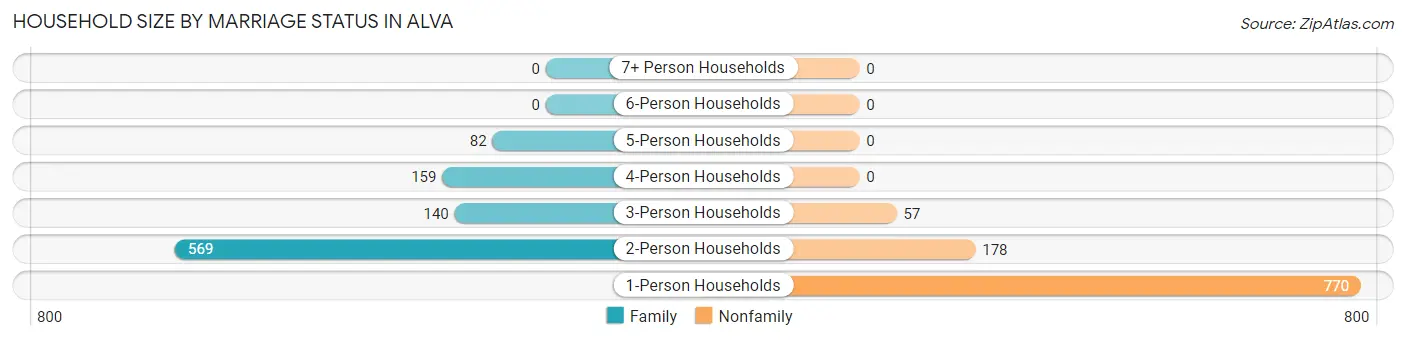
| Household Size | Family Households | Nonfamily Households |
| 1-Person Households | - | 770 (39.4%) |
| 2-Person Households | 569 (29.1%) | 178 (9.1%) |
| 3-Person Households | 140 (7.2%) | 57 (2.9%) |
| 4-Person Households | 159 (8.1%) | 0 (0.0%) |
| 5-Person Households | 82 (4.2%) | 0 (0.0%) |
| 6-Person Households | 0 (0.0%) | 0 (0.0%) |
| 7+ Person Households | 0 (0.0%) | 0 (0.0%) |
| Total | 950 (48.6%) | 1,005 (51.4%) |
Female Fertility in Alva
Fertility by Age in Alva
Average fertility rate in Alva is 52.0 births per 1,000 women. Women in the age bracket of 20 to 34 years have the highest fertility rate with 102.0 births per 1,000 women. Women in the age bracket of 20 to 34 years acount for 100.0% of all women with births.
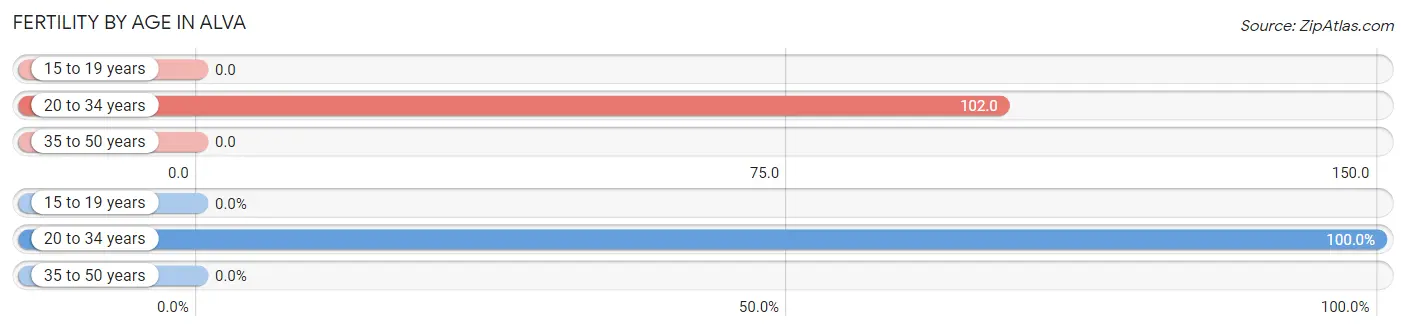
| Age Bracket | Women with Births | Births / 1,000 Women |
| 15 to 19 years | 0 (0.0%) | 0.0 |
| 20 to 34 years | 69 (100.0%) | 102.0 |
| 35 to 50 years | 0 (0.0%) | 0.0 |
| Total | 69 (100.0%) | 52.0 |
Fertility by Age by Marriage Status in Alva
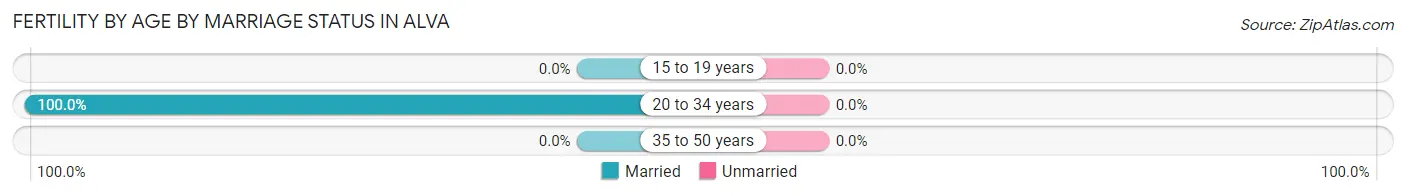
| Age Bracket | Married | Unmarried |
| 15 to 19 years | 0 (0.0%) | 0 (0.0%) |
| 20 to 34 years | 69 (100.0%) | 0 (0.0%) |
| 35 to 50 years | 0 (0.0%) | 0 (0.0%) |
| Total | 69 (100.0%) | 0 (0.0%) |
Fertility by Education in Alva
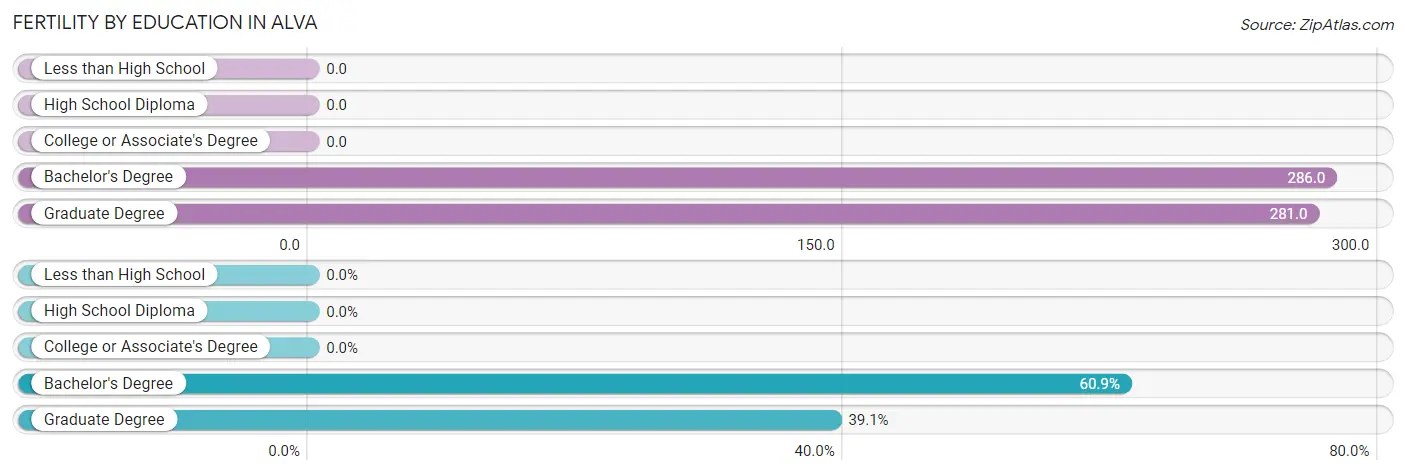
| Educational Attainment | Women with Births | Births / 1,000 Women |
| Less than High School | 0 (0.0%) | 0.0 |
| High School Diploma | 0 (0.0%) | 0.0 |
| College or Associate's Degree | 0 (0.0%) | 0.0 |
| Bachelor's Degree | 42 (60.9%) | 286.0 |
| Graduate Degree | 27 (39.1%) | 281.0 |
| Total | 69 (100.0%) | 52.0 |
Fertility by Education by Marriage Status in Alva
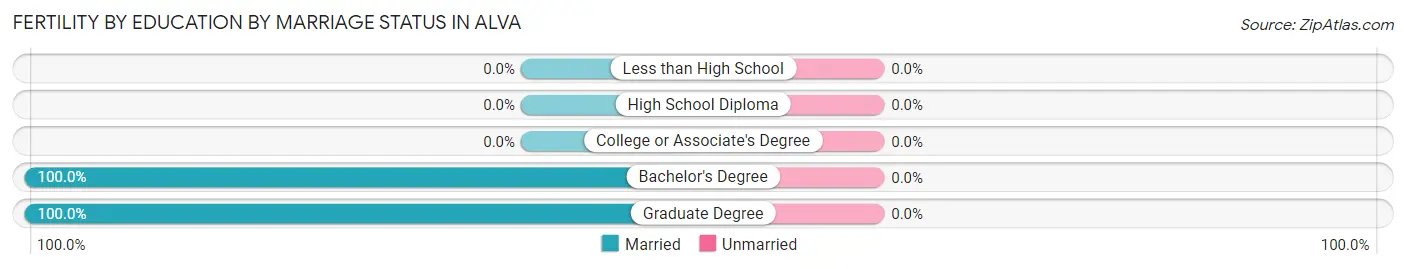
| Educational Attainment | Married | Unmarried |
| Less than High School | 0 (0.0%) | 0 (0.0%) |
| High School Diploma | 0 (0.0%) | 0 (0.0%) |
| College or Associate's Degree | 0 (0.0%) | 0 (0.0%) |
| Bachelor's Degree | 42 (100.0%) | 0 (0.0%) |
| Graduate Degree | 27 (100.0%) | 0 (0.0%) |
| Total | 69 (100.0%) | 0 (0.0%) |
Employment Characteristics in Alva
Employment by Class of Employer in Alva
Among the 2,538 employed individuals in Alva, private company employees (1,722 | 67.8%), state government employees (371 | 14.6%), and self-employed (not incorporated) (179 | 7.0%) make up the most common classes of employment.
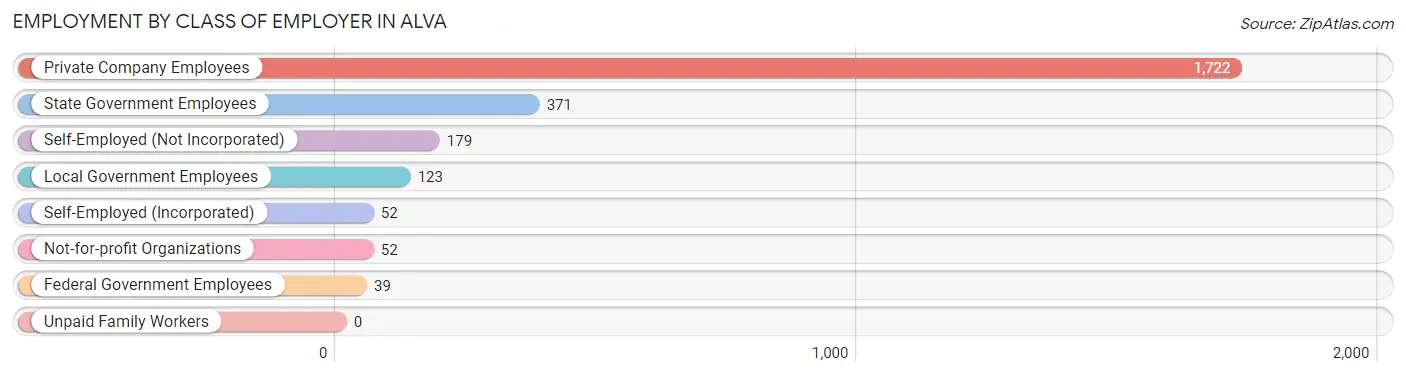
| Employer Class | # Employees | % Employees |
| Private Company Employees | 1,722 | 67.8% |
| Self-Employed (Incorporated) | 52 | 2.1% |
| Self-Employed (Not Incorporated) | 179 | 7.0% |
| Not-for-profit Organizations | 52 | 2.1% |
| Local Government Employees | 123 | 4.9% |
| State Government Employees | 371 | 14.6% |
| Federal Government Employees | 39 | 1.5% |
| Unpaid Family Workers | 0 | 0.0% |
| Total | 2,538 | 100.0% |
Employment Status by Age in Alva
According to the labor force statistics for Alva, out of the total population over 16 years of age (4,058), 66.0% or 2,678 individuals are in the labor force, with 5.1% or 137 of them unemployed. The age group with the highest labor force participation rate is 25 to 29 years, with 98.0% or 289 individuals in the labor force. Within the labor force, the 60 to 64 years age range has the highest percentage of unemployed individuals, with 9.8% or 16 of them being unemployed.
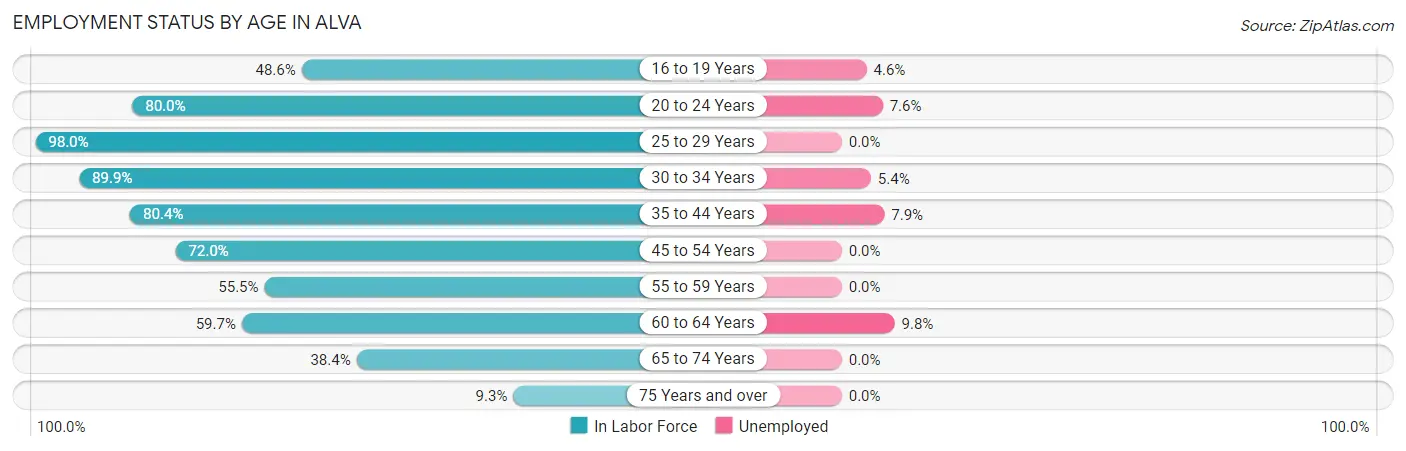
| Age Bracket | In Labor Force | Unemployed |
| 16 to 19 Years | 173 (48.6%) | 8 (4.6%) |
| 20 to 24 Years | 766 (80.0%) | 58 (7.6%) |
| 25 to 29 Years | 289 (98.0%) | 0 (0.0%) |
| 30 to 34 Years | 276 (89.9%) | 15 (5.4%) |
| 35 to 44 Years | 492 (80.4%) | 39 (7.9%) |
| 45 to 54 Years | 232 (72.0%) | 0 (0.0%) |
| 55 to 59 Years | 117 (55.5%) | 0 (0.0%) |
| 60 to 64 Years | 163 (59.7%) | 16 (9.8%) |
| 65 to 74 Years | 137 (38.4%) | 0 (0.0%) |
| 75 Years and over | 34 (9.3%) | 0 (0.0%) |
| Total | 2,678 (66.0%) | 137 (5.1%) |
Employment Status by Educational Attainment in Alva
According to labor force statistics for Alva, 77.7% of individuals (1,570) out of the total population between 25 and 64 years of age (2,020) are in the labor force, with 4.5% or 71 of them being unemployed. The group with the highest labor force participation rate are those with the educational attainment of college / associate degree, with 93.5% or 463 individuals in the labor force. Within the labor force, individuals with high school diploma education have the highest percentage of unemployment, with 8.6% or 40 of them being unemployed.
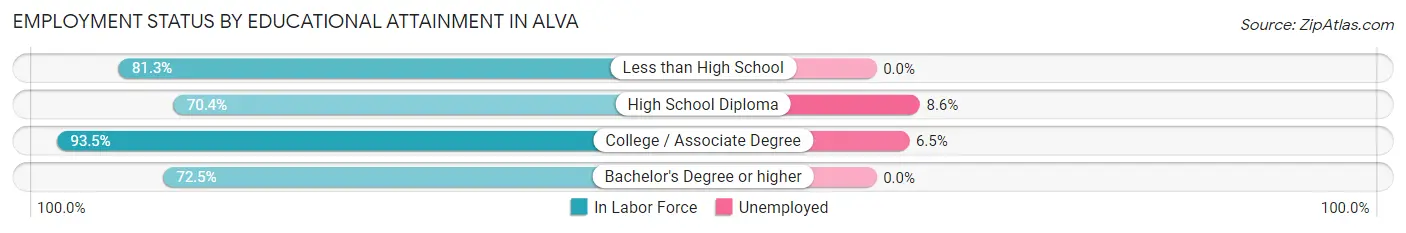
| Educational Attainment | In Labor Force | Unemployed |
| Less than High School | 135 (81.3%) | 0 (0.0%) |
| High School Diploma | 466 (70.4%) | 57 (8.6%) |
| College / Associate Degree | 463 (93.5%) | 32 (6.5%) |
| Bachelor's Degree or higher | 505 (72.5%) | 0 (0.0%) |
| Total | 1,570 (77.7%) | 91 (4.5%) |
Employment Occupations by Sex in Alva
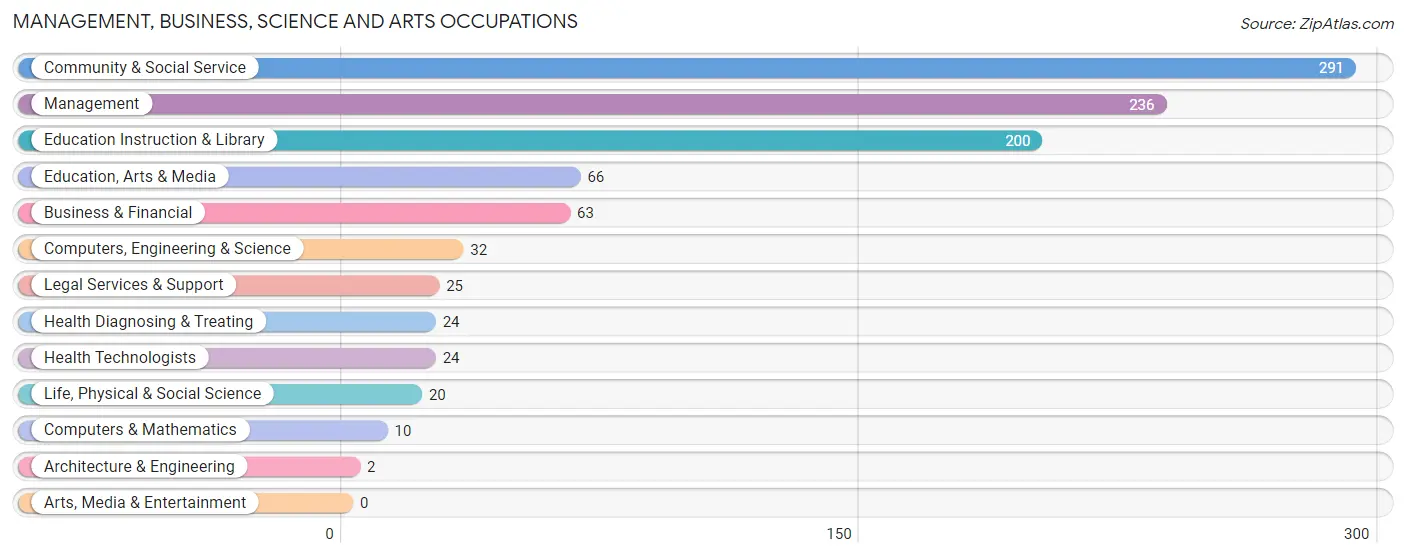
Management, Business, Science and Arts Occupations
The most common Management, Business, Science and Arts occupations in Alva are Community & Social Service (291 | 11.4%), Management (236 | 9.3%), Education Instruction & Library (200 | 7.9%), Education, Arts & Media (66 | 2.6%), and Business & Financial (63 | 2.5%).
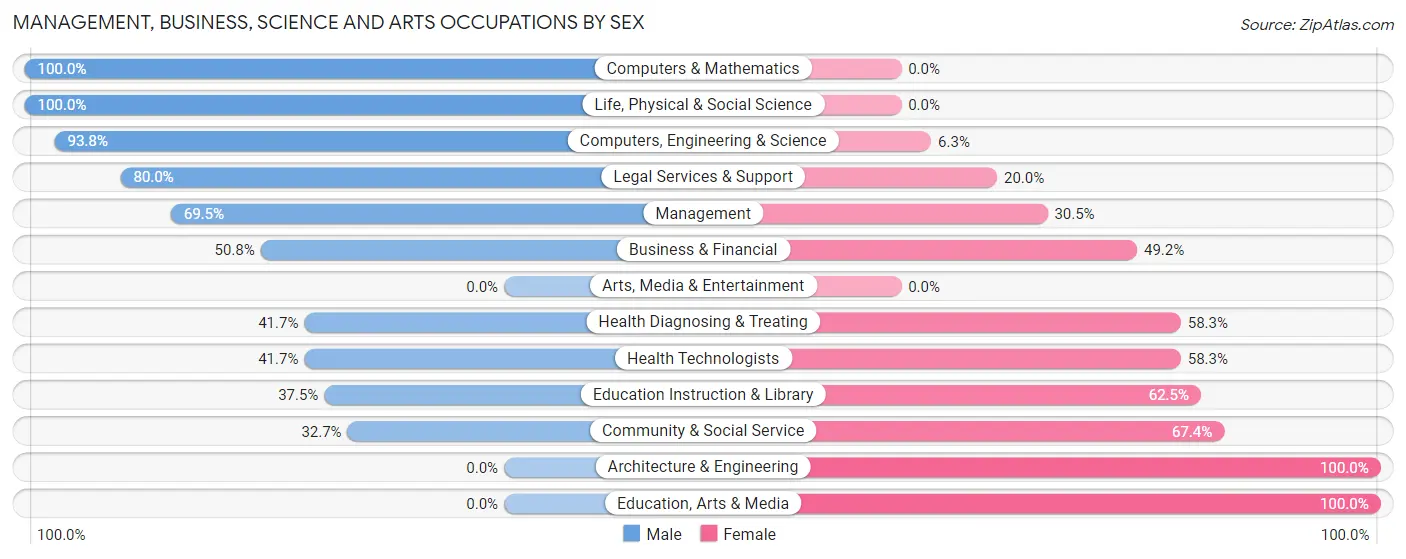
Management, Business, Science and Arts Occupations by Sex
Within the Management, Business, Science and Arts occupations in Alva, the most male-oriented occupations are Computers & Mathematics (100.0%), Life, Physical & Social Science (100.0%), and Computers, Engineering & Science (93.8%), while the most female-oriented occupations are Architecture & Engineering (100.0%), Education, Arts & Media (100.0%), and Community & Social Service (67.3%).
| Occupation | Male | Female |
| Management | 164 (69.5%) | 72 (30.5%) |
| Business & Financial | 32 (50.8%) | 31 (49.2%) |
| Computers, Engineering & Science | 30 (93.8%) | 2 (6.2%) |
| Computers & Mathematics | 10 (100.0%) | 0 (0.0%) |
| Architecture & Engineering | 0 (0.0%) | 2 (100.0%) |
| Life, Physical & Social Science | 20 (100.0%) | 0 (0.0%) |
| Community & Social Service | 95 (32.7%) | 196 (67.3%) |
| Education, Arts & Media | 0 (0.0%) | 66 (100.0%) |
| Legal Services & Support | 20 (80.0%) | 5 (20.0%) |
| Education Instruction & Library | 75 (37.5%) | 125 (62.5%) |
| Arts, Media & Entertainment | 0 (0.0%) | 0 (0.0%) |
| Health Diagnosing & Treating | 10 (41.7%) | 14 (58.3%) |
| Health Technologists | 10 (41.7%) | 14 (58.3%) |
| Total (Category) | 331 (51.2%) | 315 (48.8%) |
| Total (Overall) | 1,399 (55.0%) | 1,144 (45.0%) |
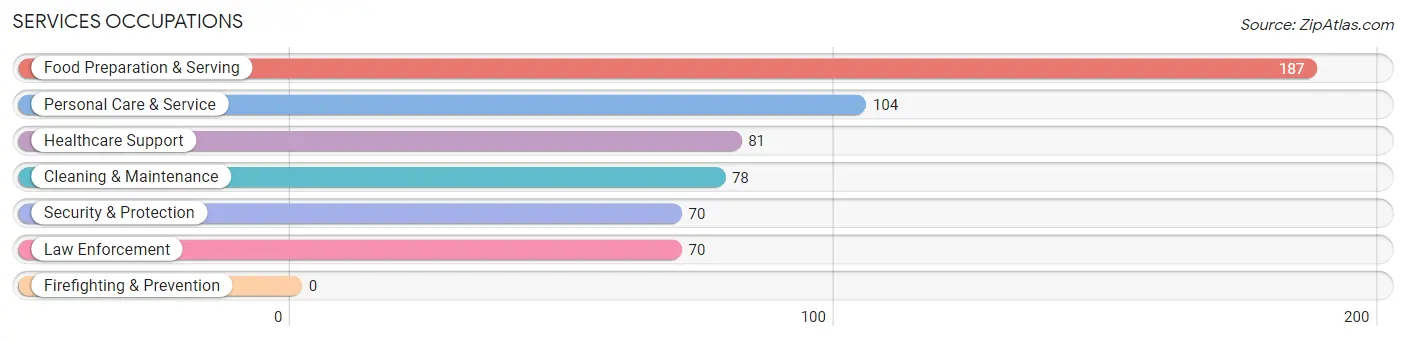
Services Occupations
The most common Services occupations in Alva are Food Preparation & Serving (187 | 7.3%), Personal Care & Service (104 | 4.1%), Healthcare Support (81 | 3.2%), Cleaning & Maintenance (78 | 3.1%), and Security & Protection (70 | 2.8%).
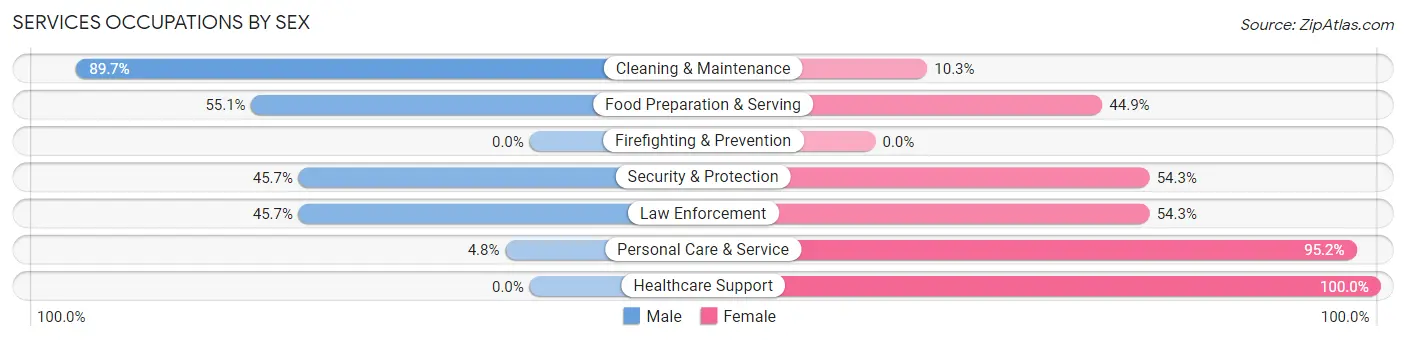
Services Occupations by Sex
Within the Services occupations in Alva, the most male-oriented occupations are Cleaning & Maintenance (89.7%), Food Preparation & Serving (55.1%), and Security & Protection (45.7%), while the most female-oriented occupations are Healthcare Support (100.0%), Personal Care & Service (95.2%), and Security & Protection (54.3%).
| Occupation | Male | Female |
| Healthcare Support | 0 (0.0%) | 81 (100.0%) |
| Security & Protection | 32 (45.7%) | 38 (54.3%) |
| Firefighting & Prevention | 0 (0.0%) | 0 (0.0%) |
| Law Enforcement | 32 (45.7%) | 38 (54.3%) |
| Food Preparation & Serving | 103 (55.1%) | 84 (44.9%) |
| Cleaning & Maintenance | 70 (89.7%) | 8 (10.3%) |
| Personal Care & Service | 5 (4.8%) | 99 (95.2%) |
| Total (Category) | 210 (40.4%) | 310 (59.6%) |
| Total (Overall) | 1,399 (55.0%) | 1,144 (45.0%) |
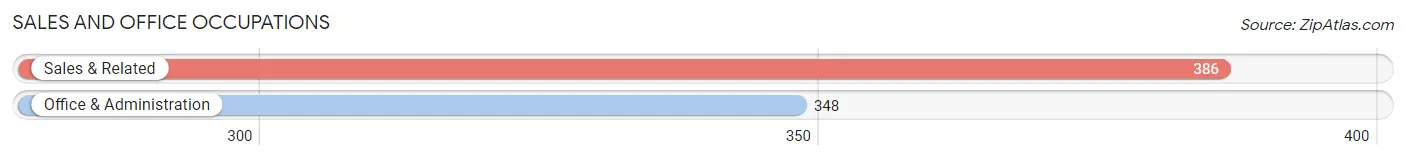
Sales and Office Occupations
The most common Sales and Office occupations in Alva are Sales & Related (386 | 15.2%), and Office & Administration (348 | 13.7%).
Sales and Office Occupations by Sex
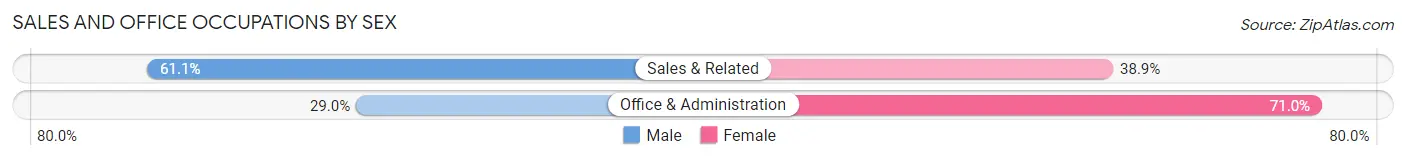
| Occupation | Male | Female |
| Sales & Related | 236 (61.1%) | 150 (38.9%) |
| Office & Administration | 101 (29.0%) | 247 (71.0%) |
| Total (Category) | 337 (45.9%) | 397 (54.1%) |
| Total (Overall) | 1,399 (55.0%) | 1,144 (45.0%) |
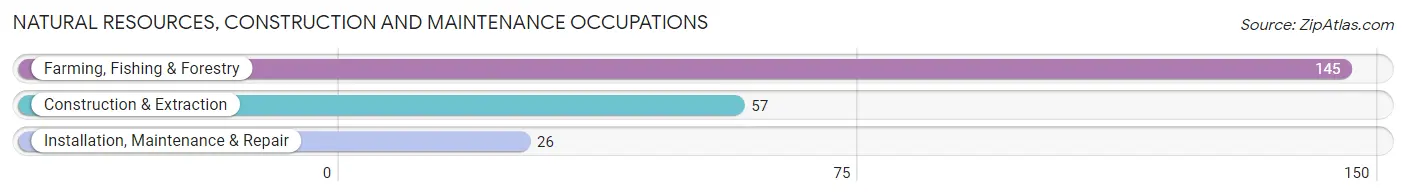
Natural Resources, Construction and Maintenance Occupations
The most common Natural Resources, Construction and Maintenance occupations in Alva are Farming, Fishing & Forestry (145 | 5.7%), Construction & Extraction (57 | 2.2%), and Installation, Maintenance & Repair (26 | 1.0%).
Natural Resources, Construction and Maintenance Occupations by Sex
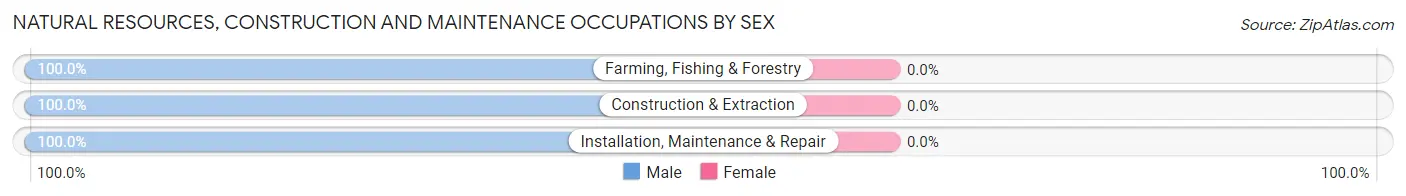
| Occupation | Male | Female |
| Farming, Fishing & Forestry | 145 (100.0%) | 0 (0.0%) |
| Construction & Extraction | 57 (100.0%) | 0 (0.0%) |
| Installation, Maintenance & Repair | 26 (100.0%) | 0 (0.0%) |
| Total (Category) | 228 (100.0%) | 0 (0.0%) |
| Total (Overall) | 1,399 (55.0%) | 1,144 (45.0%) |
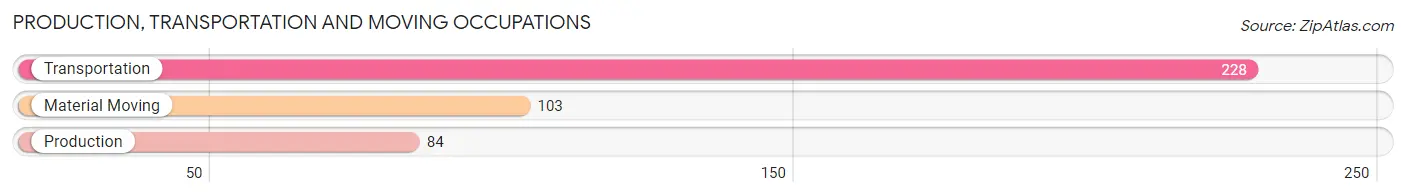
Production, Transportation and Moving Occupations
The most common Production, Transportation and Moving occupations in Alva are Transportation (228 | 9.0%), Material Moving (103 | 4.1%), and Production (84 | 3.3%).
Production, Transportation and Moving Occupations by Sex
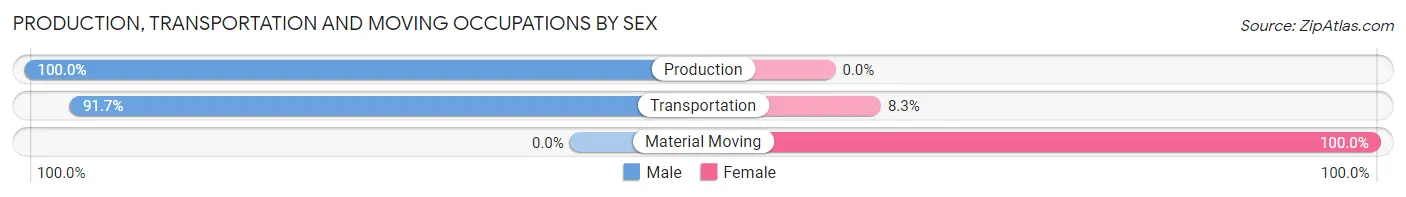
| Occupation | Male | Female |
| Production | 84 (100.0%) | 0 (0.0%) |
| Transportation | 209 (91.7%) | 19 (8.3%) |
| Material Moving | 0 (0.0%) | 103 (100.0%) |
| Total (Category) | 293 (70.6%) | 122 (29.4%) |
| Total (Overall) | 1,399 (55.0%) | 1,144 (45.0%) |
Employment Industries by Sex in Alva
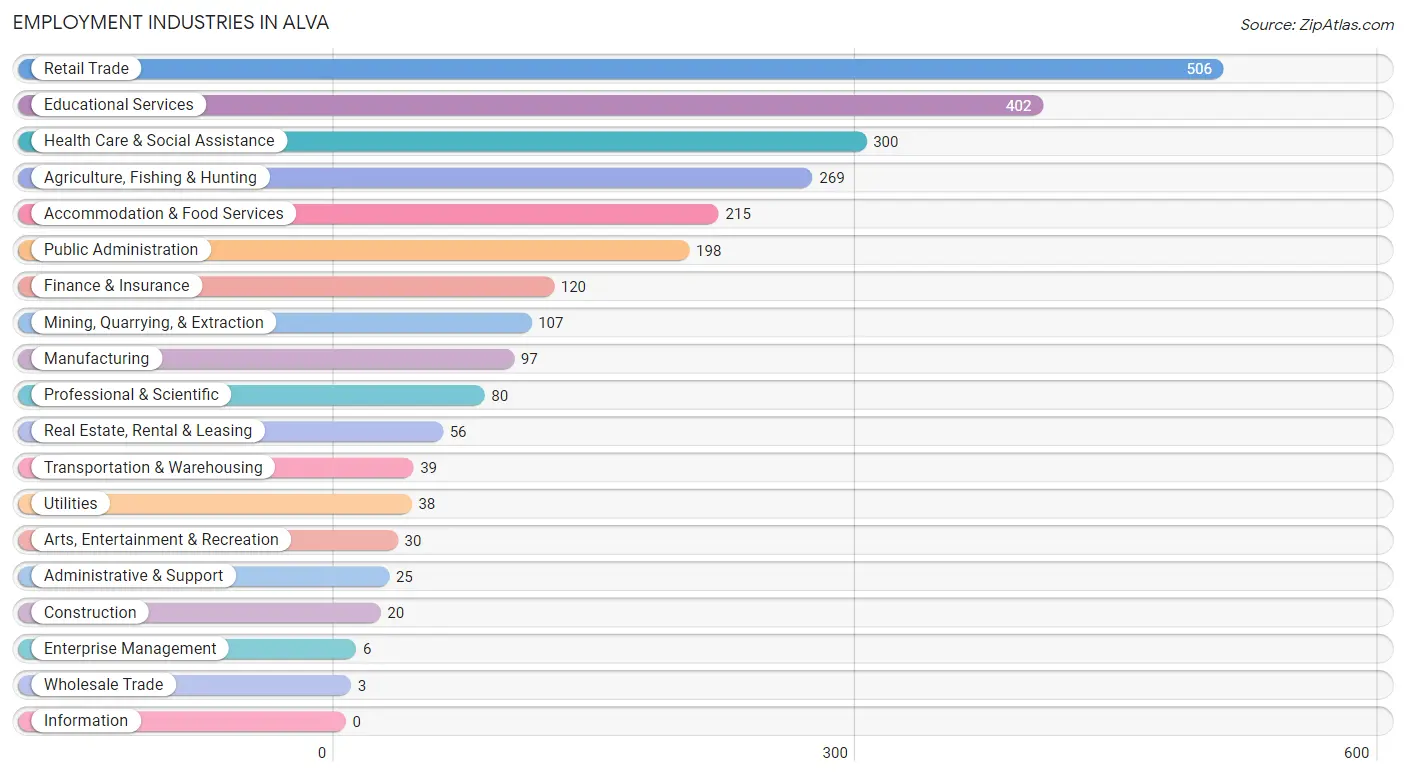
Employment Industries in Alva
The major employment industries in Alva include Retail Trade (506 | 19.9%), Educational Services (402 | 15.8%), Health Care & Social Assistance (300 | 11.8%), Agriculture, Fishing & Hunting (269 | 10.6%), and Accommodation & Food Services (215 | 8.5%).
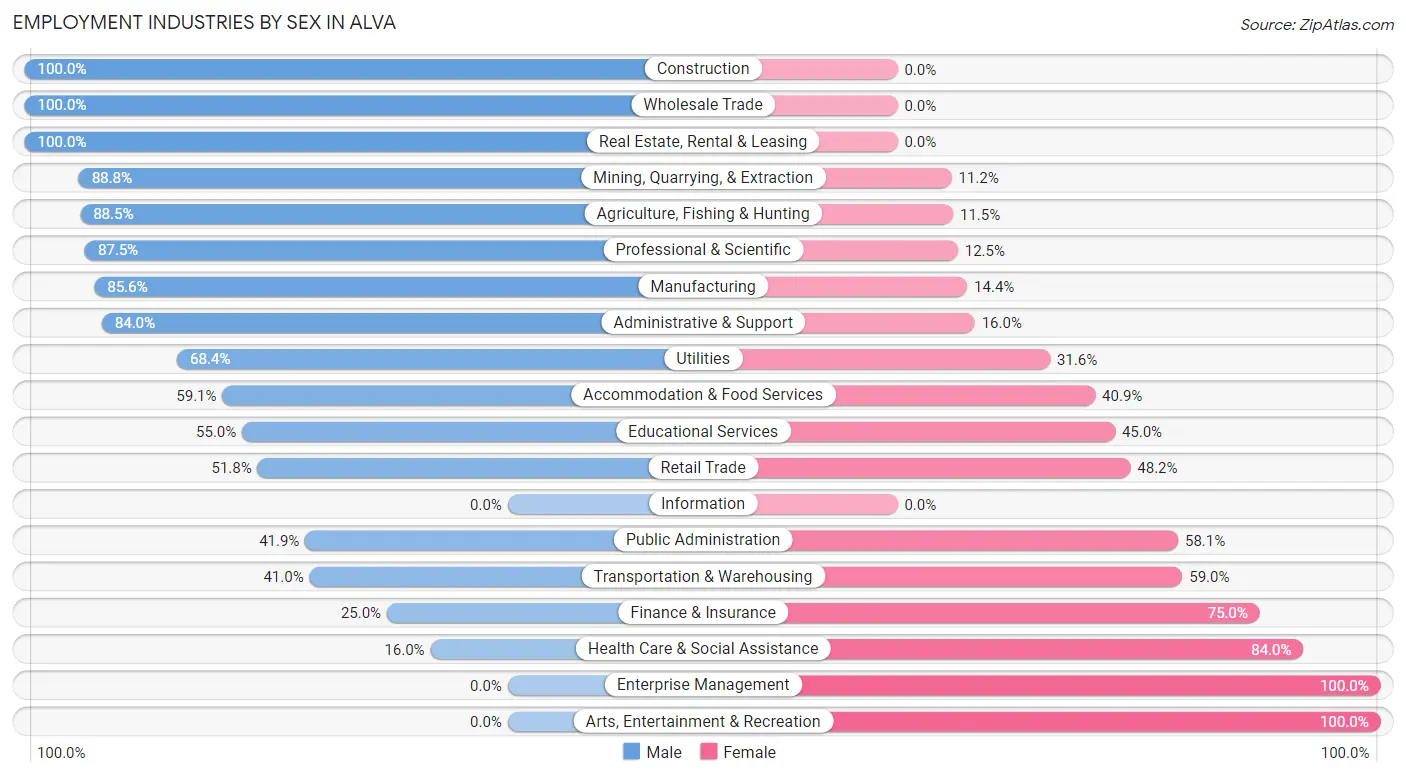
Employment Industries by Sex in Alva
The Alva industries that see more men than women are Construction (100.0%), Wholesale Trade (100.0%), and Real Estate, Rental & Leasing (100.0%), whereas the industries that tend to have a higher number of women are Enterprise Management (100.0%), Arts, Entertainment & Recreation (100.0%), and Health Care & Social Assistance (84.0%).
| Industry | Male | Female |
| Agriculture, Fishing & Hunting | 238 (88.5%) | 31 (11.5%) |
| Mining, Quarrying, & Extraction | 95 (88.8%) | 12 (11.2%) |
| Construction | 20 (100.0%) | 0 (0.0%) |
| Manufacturing | 83 (85.6%) | 14 (14.4%) |
| Wholesale Trade | 3 (100.0%) | 0 (0.0%) |
| Retail Trade | 262 (51.8%) | 244 (48.2%) |
| Transportation & Warehousing | 16 (41.0%) | 23 (59.0%) |
| Utilities | 26 (68.4%) | 12 (31.6%) |
| Information | 0 (0.0%) | 0 (0.0%) |
| Finance & Insurance | 30 (25.0%) | 90 (75.0%) |
| Real Estate, Rental & Leasing | 56 (100.0%) | 0 (0.0%) |
| Professional & Scientific | 70 (87.5%) | 10 (12.5%) |
| Enterprise Management | 0 (0.0%) | 6 (100.0%) |
| Administrative & Support | 21 (84.0%) | 4 (16.0%) |
| Educational Services | 221 (55.0%) | 181 (45.0%) |
| Health Care & Social Assistance | 48 (16.0%) | 252 (84.0%) |
| Arts, Entertainment & Recreation | 0 (0.0%) | 30 (100.0%) |
| Accommodation & Food Services | 127 (59.1%) | 88 (40.9%) |
| Public Administration | 83 (41.9%) | 115 (58.1%) |
| Total | 1,399 (55.0%) | 1,144 (45.0%) |
Education in Alva
School Enrollment in Alva
The most common levels of schooling among the 1,826 students in Alva are college / undergraduate (901 | 49.3%), middle school (304 | 16.7%), and elementary school (228 | 12.5%).
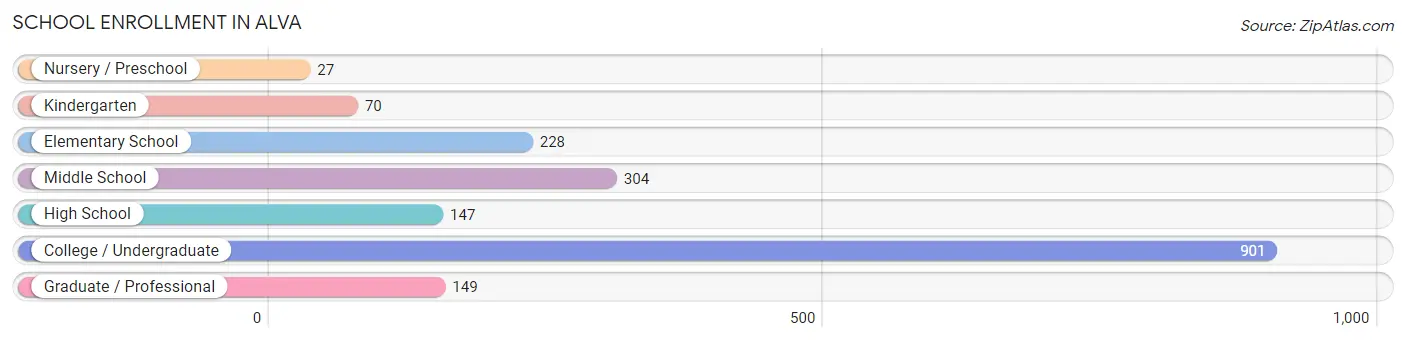
| School Level | # Students | % Students |
| Nursery / Preschool | 27 | 1.5% |
| Kindergarten | 70 | 3.8% |
| Elementary School | 228 | 12.5% |
| Middle School | 304 | 16.7% |
| High School | 147 | 8.1% |
| College / Undergraduate | 901 | 49.3% |
| Graduate / Professional | 149 | 8.2% |
| Total | 1,826 | 100.0% |
School Enrollment by Age by Funding Source in Alva
Out of a total of 1,826 students who are enrolled in schools in Alva, 22 (1.2%) attend a private institution, while the remaining 1,804 (98.8%) are enrolled in public schools. The age group of 15 to 17 year olds has the highest likelihood of being enrolled in private schools, with 5 (3.6% in the age bracket) enrolled. Conversely, the age group of 3 to 4 year olds has the lowest likelihood of being enrolled in a private school, with 27 (100.0% in the age bracket) attending a public institution.
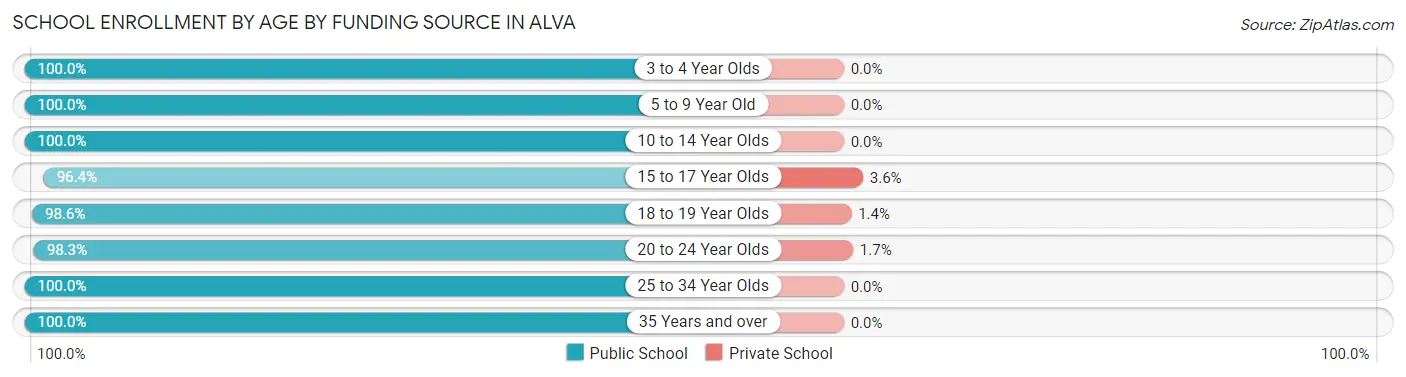
| Age Bracket | Public School | Private School |
| 3 to 4 Year Olds | 27 (100.0%) | 0 (0.0%) |
| 5 to 9 Year Old | 305 (100.0%) | 0 (0.0%) |
| 10 to 14 Year Olds | 297 (100.0%) | 0 (0.0%) |
| 15 to 17 Year Olds | 135 (96.4%) | 5 (3.6%) |
| 18 to 19 Year Olds | 281 (98.6%) | 4 (1.4%) |
| 20 to 24 Year Olds | 684 (98.3%) | 12 (1.7%) |
| 25 to 34 Year Olds | 29 (100.0%) | 0 (0.0%) |
| 35 Years and over | 47 (100.0%) | 0 (0.0%) |
| Total | 1,804 (98.8%) | 22 (1.2%) |
Educational Attainment by Field of Study in Alva
Education (258 | 22.7%), business (158 | 13.9%), arts & humanities (154 | 13.6%), bio, nature & agricultural (106 | 9.3%), and science & technology (98 | 8.6%) are the most common fields of study among 1,136 individuals in Alva who have obtained a bachelor's degree or higher.
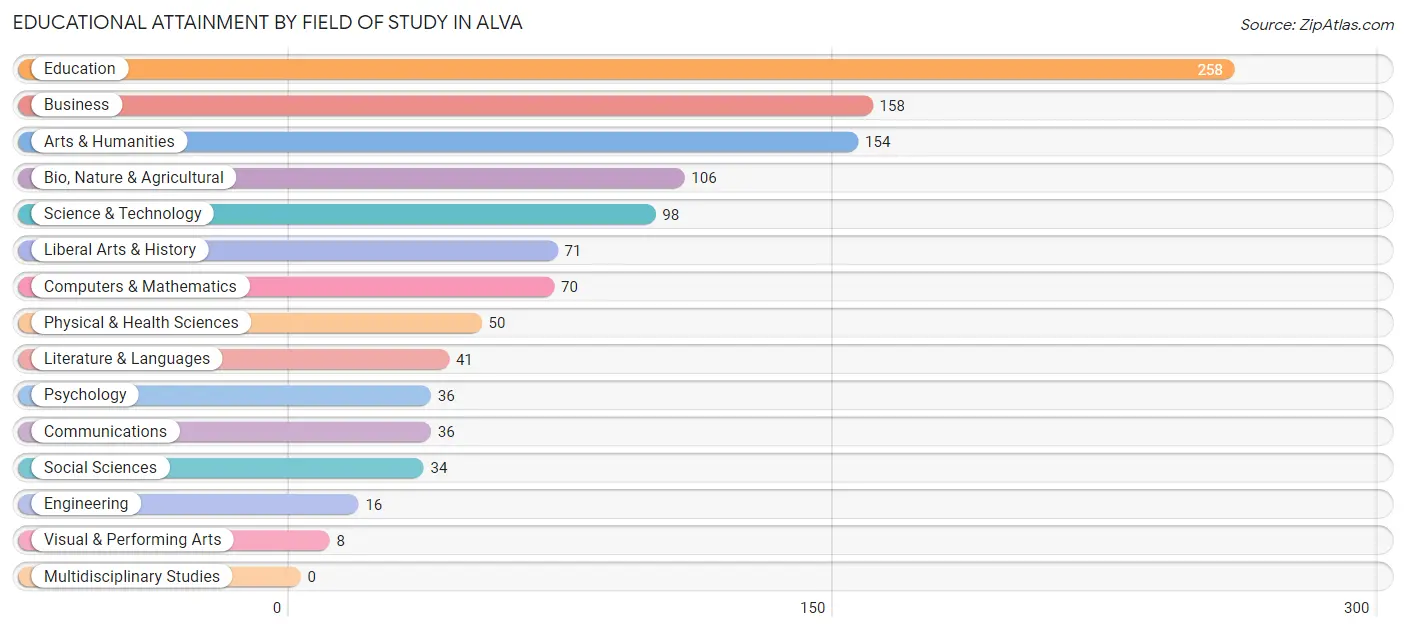
| Field of Study | # Graduates | % Graduates |
| Computers & Mathematics | 70 | 6.2% |
| Bio, Nature & Agricultural | 106 | 9.3% |
| Physical & Health Sciences | 50 | 4.4% |
| Psychology | 36 | 3.2% |
| Social Sciences | 34 | 3.0% |
| Engineering | 16 | 1.4% |
| Multidisciplinary Studies | 0 | 0.0% |
| Science & Technology | 98 | 8.6% |
| Business | 158 | 13.9% |
| Education | 258 | 22.7% |
| Literature & Languages | 41 | 3.6% |
| Liberal Arts & History | 71 | 6.2% |
| Visual & Performing Arts | 8 | 0.7% |
| Communications | 36 | 3.2% |
| Arts & Humanities | 154 | 13.6% |
| Total | 1,136 | 100.0% |
Transportation & Commute in Alva
Vehicle Availability by Sex in Alva
The most prevalent vehicle ownership categories in Alva are males with 2 vehicles (646, accounting for 46.8%) and females with 2 vehicles (450, making up 62.8%).
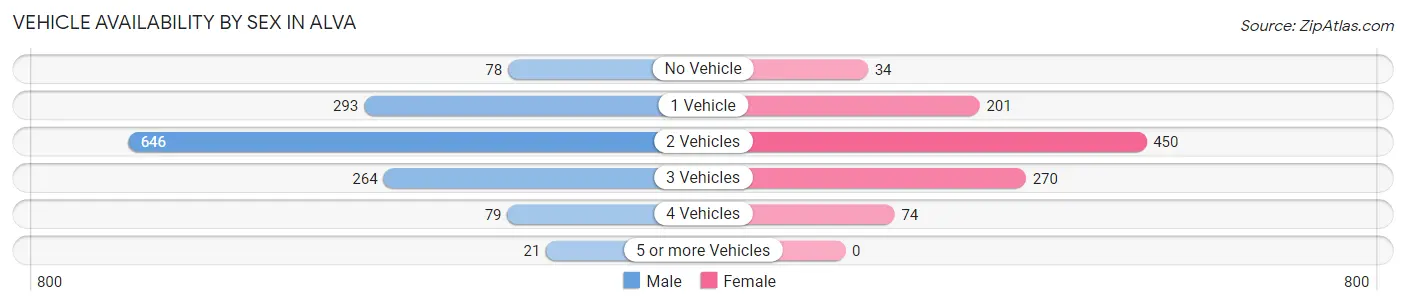
| Vehicles Available | Male | Female |
| No Vehicle | 78 (5.7%) | 34 (3.3%) |
| 1 Vehicle | 293 (21.2%) | 201 (19.5%) |
| 2 Vehicles | 646 (46.8%) | 450 (43.7%) |
| 3 Vehicles | 264 (19.1%) | 270 (26.2%) |
| 4 Vehicles | 79 (5.7%) | 74 (7.2%) |
| 5 or more Vehicles | 21 (1.5%) | 0 (0.0%) |
| Total | 1,381 (100.0%) | 1,029 (100.0%) |
Commute Time in Alva
The most frequently occuring commute durations in Alva are 5 to 9 minutes (1,146 commuters, 45.9%), less than 5 minutes (575 commuters, 23.1%), and 20 to 24 minutes (230 commuters, 9.2%).
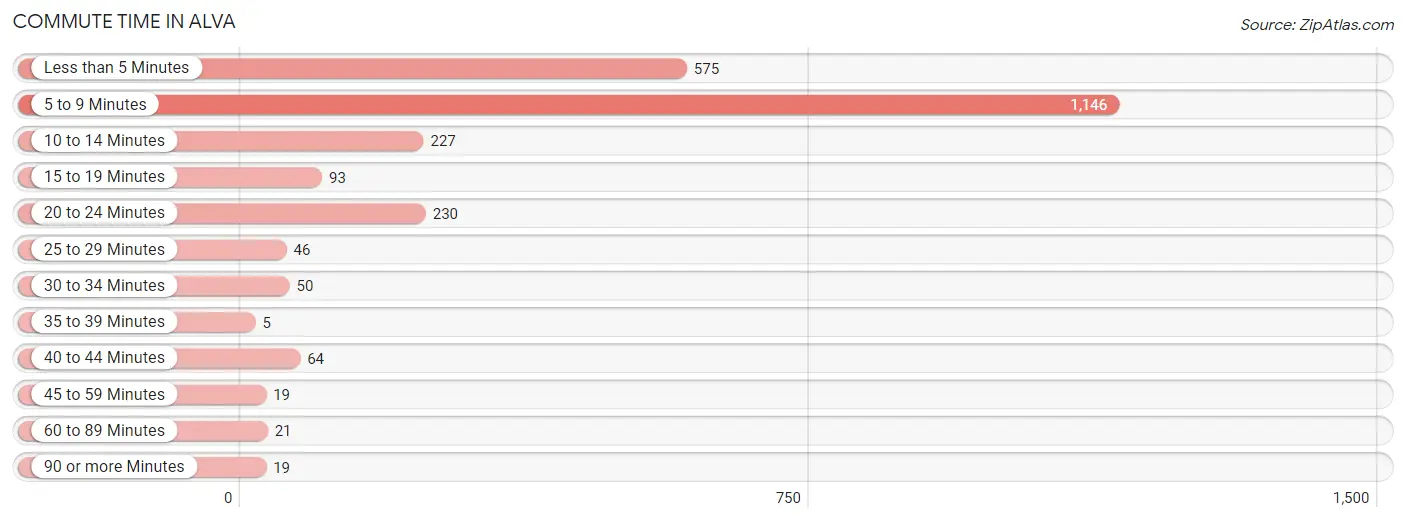
| Commute Time | # Commuters | % Commuters |
| Less than 5 Minutes | 575 | 23.1% |
| 5 to 9 Minutes | 1,146 | 45.9% |
| 10 to 14 Minutes | 227 | 9.1% |
| 15 to 19 Minutes | 93 | 3.7% |
| 20 to 24 Minutes | 230 | 9.2% |
| 25 to 29 Minutes | 46 | 1.8% |
| 30 to 34 Minutes | 50 | 2.0% |
| 35 to 39 Minutes | 5 | 0.2% |
| 40 to 44 Minutes | 64 | 2.6% |
| 45 to 59 Minutes | 19 | 0.8% |
| 60 to 89 Minutes | 21 | 0.8% |
| 90 or more Minutes | 19 | 0.8% |
Commute Time by Sex in Alva
The most common commute times in Alva are 5 to 9 minutes (519 commuters, 37.7%) for males and 5 to 9 minutes (627 commuters, 56.1%) for females.
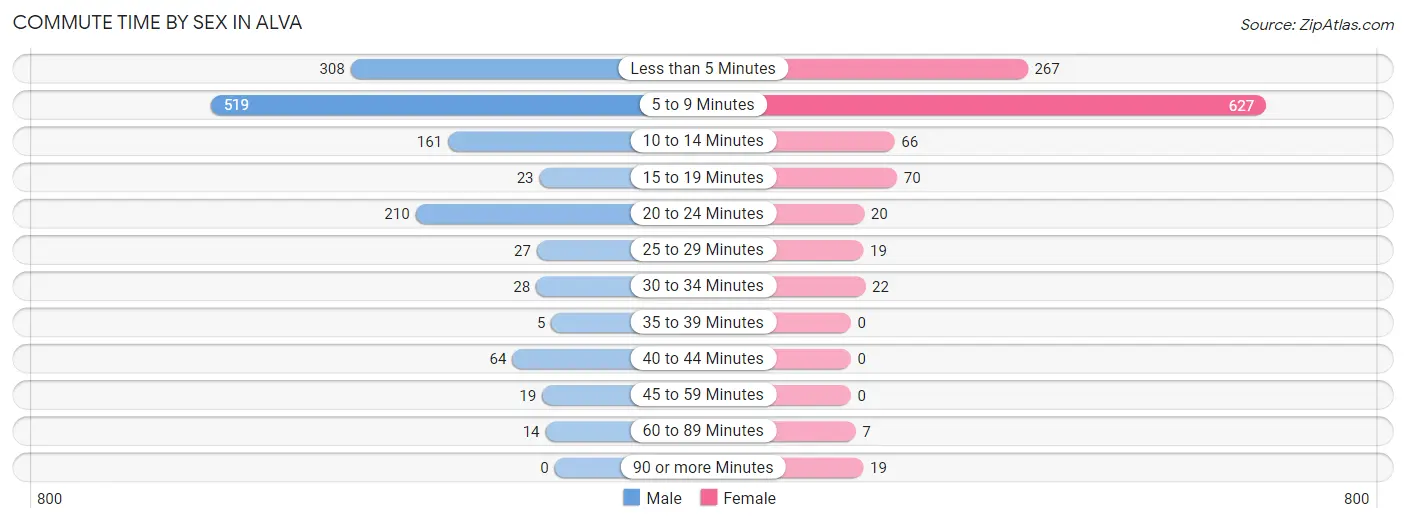
| Commute Time | Male | Female |
| Less than 5 Minutes | 308 (22.4%) | 267 (23.9%) |
| 5 to 9 Minutes | 519 (37.7%) | 627 (56.1%) |
| 10 to 14 Minutes | 161 (11.7%) | 66 (5.9%) |
| 15 to 19 Minutes | 23 (1.7%) | 70 (6.3%) |
| 20 to 24 Minutes | 210 (15.2%) | 20 (1.8%) |
| 25 to 29 Minutes | 27 (2.0%) | 19 (1.7%) |
| 30 to 34 Minutes | 28 (2.0%) | 22 (2.0%) |
| 35 to 39 Minutes | 5 (0.4%) | 0 (0.0%) |
| 40 to 44 Minutes | 64 (4.6%) | 0 (0.0%) |
| 45 to 59 Minutes | 19 (1.4%) | 0 (0.0%) |
| 60 to 89 Minutes | 14 (1.0%) | 7 (0.6%) |
| 90 or more Minutes | 0 (0.0%) | 19 (1.7%) |
Time of Departure to Work by Sex in Alva
The most frequent times of departure to work in Alva are 7:30 AM to 7:59 AM (267, 19.4%) for males and 7:30 AM to 7:59 AM (349, 31.2%) for females.
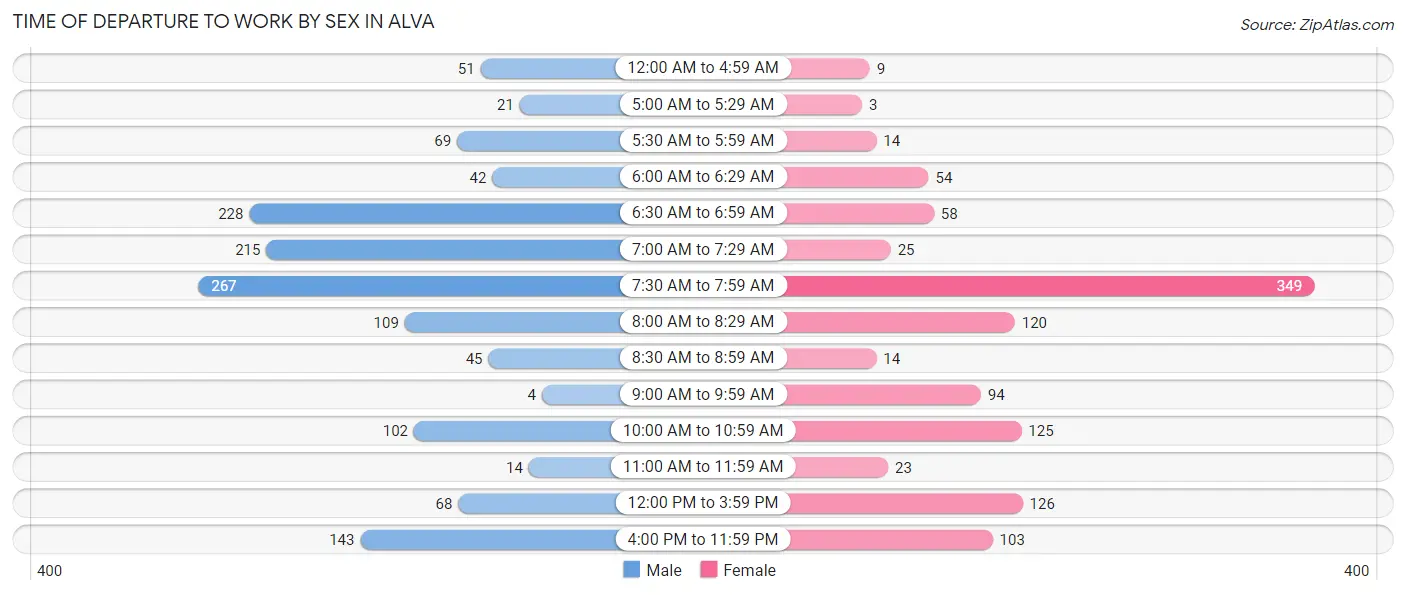
| Time of Departure | Male | Female |
| 12:00 AM to 4:59 AM | 51 (3.7%) | 9 (0.8%) |
| 5:00 AM to 5:29 AM | 21 (1.5%) | 3 (0.3%) |
| 5:30 AM to 5:59 AM | 69 (5.0%) | 14 (1.3%) |
| 6:00 AM to 6:29 AM | 42 (3.0%) | 54 (4.8%) |
| 6:30 AM to 6:59 AM | 228 (16.6%) | 58 (5.2%) |
| 7:00 AM to 7:29 AM | 215 (15.6%) | 25 (2.2%) |
| 7:30 AM to 7:59 AM | 267 (19.4%) | 349 (31.2%) |
| 8:00 AM to 8:29 AM | 109 (7.9%) | 120 (10.7%) |
| 8:30 AM to 8:59 AM | 45 (3.3%) | 14 (1.3%) |
| 9:00 AM to 9:59 AM | 4 (0.3%) | 94 (8.4%) |
| 10:00 AM to 10:59 AM | 102 (7.4%) | 125 (11.2%) |
| 11:00 AM to 11:59 AM | 14 (1.0%) | 23 (2.1%) |
| 12:00 PM to 3:59 PM | 68 (4.9%) | 126 (11.3%) |
| 4:00 PM to 11:59 PM | 143 (10.4%) | 103 (9.2%) |
| Total | 1,378 (100.0%) | 1,117 (100.0%) |
Housing Occupancy in Alva
Occupancy by Ownership in Alva
Of the total 1,955 dwellings in Alva, owner-occupied units account for 1,126 (57.6%), while renter-occupied units make up 829 (42.4%).
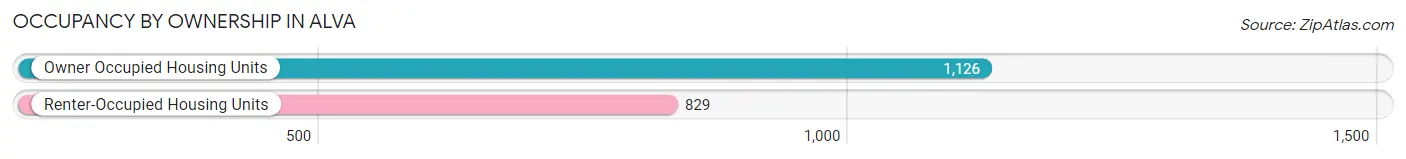
| Occupancy | # Housing Units | % Housing Units |
| Owner Occupied Housing Units | 1,126 | 57.6% |
| Renter-Occupied Housing Units | 829 | 42.4% |
| Total Occupied Housing Units | 1,955 | 100.0% |
Occupancy by Household Size in Alva
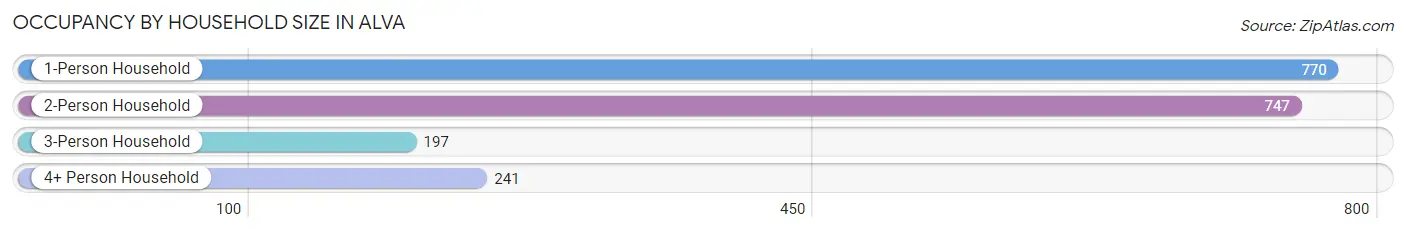
| Household Size | # Housing Units | % Housing Units |
| 1-Person Household | 770 | 39.4% |
| 2-Person Household | 747 | 38.2% |
| 3-Person Household | 197 | 10.1% |
| 4+ Person Household | 241 | 12.3% |
| Total Housing Units | 1,955 | 100.0% |
Occupancy by Ownership by Household Size in Alva
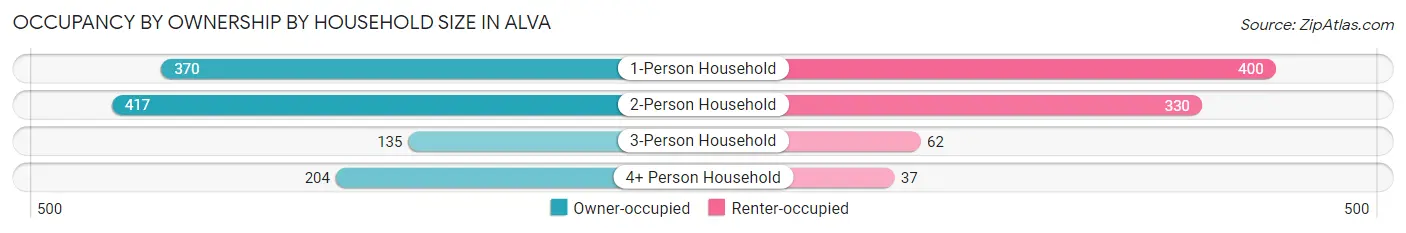
| Household Size | Owner-occupied | Renter-occupied |
| 1-Person Household | 370 (48.0%) | 400 (51.9%) |
| 2-Person Household | 417 (55.8%) | 330 (44.2%) |
| 3-Person Household | 135 (68.5%) | 62 (31.5%) |
| 4+ Person Household | 204 (84.7%) | 37 (15.3%) |
| Total Housing Units | 1,126 (57.6%) | 829 (42.4%) |
Occupancy by Educational Attainment in Alva
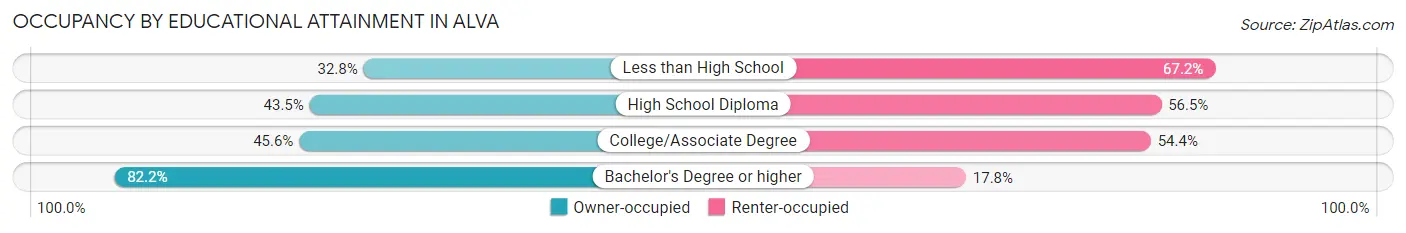
| Household Size | Owner-occupied | Renter-occupied |
| Less than High School | 61 (32.8%) | 125 (67.2%) |
| High School Diploma | 187 (43.5%) | 243 (56.5%) |
| College/Associate Degree | 277 (45.6%) | 331 (54.4%) |
| Bachelor's Degree or higher | 601 (82.2%) | 130 (17.8%) |
Occupancy by Age of Householder in Alva
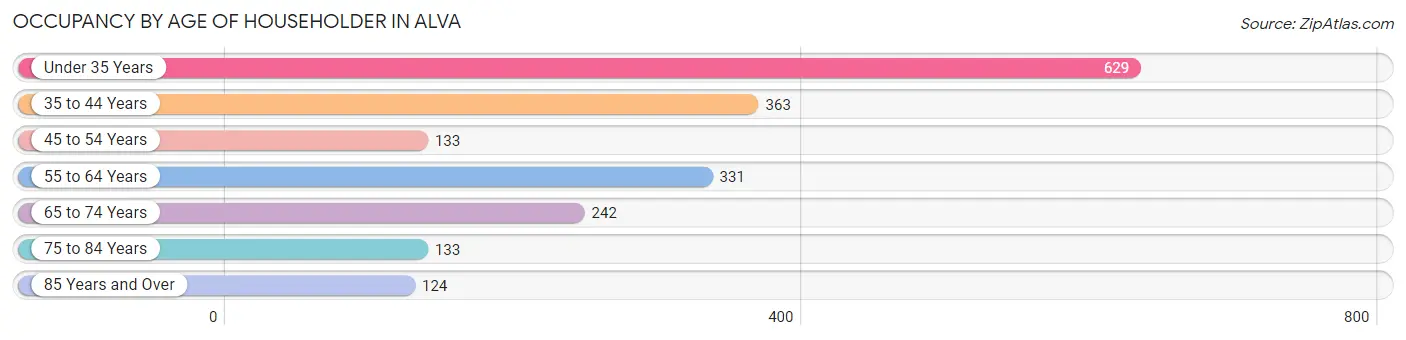
| Age Bracket | # Households | % Households |
| Under 35 Years | 629 | 32.2% |
| 35 to 44 Years | 363 | 18.6% |
| 45 to 54 Years | 133 | 6.8% |
| 55 to 64 Years | 331 | 16.9% |
| 65 to 74 Years | 242 | 12.4% |
| 75 to 84 Years | 133 | 6.8% |
| 85 Years and Over | 124 | 6.3% |
| Total | 1,955 | 100.0% |
Housing Finances in Alva
Median Income by Occupancy in Alva
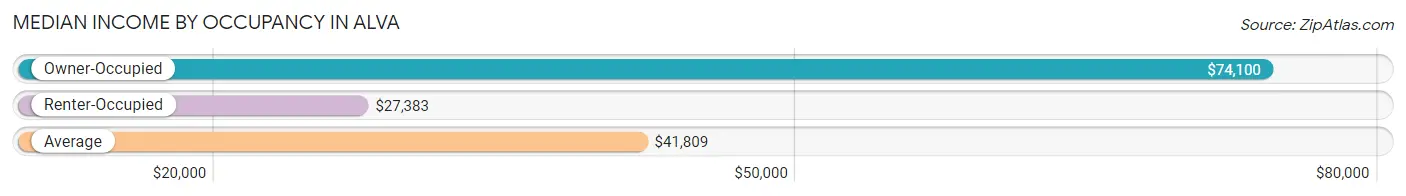
| Occupancy Type | # Households | Median Income |
| Owner-Occupied | 1,126 (57.6%) | $74,100 |
| Renter-Occupied | 829 (42.4%) | $27,383 |
| Average | 1,955 (100.0%) | $41,809 |
Occupancy by Householder Income Bracket in Alva
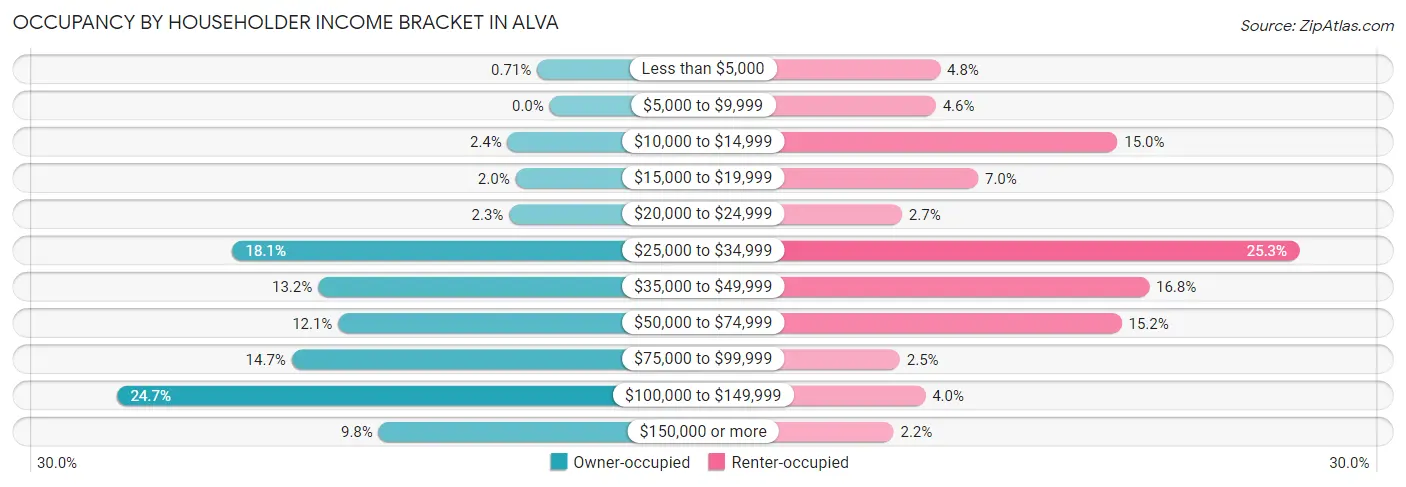
| Income Bracket | Owner-occupied | Renter-occupied |
| Less than $5,000 | 8 (0.7%) | 40 (4.8%) |
| $5,000 to $9,999 | 0 (0.0%) | 38 (4.6%) |
| $10,000 to $14,999 | 27 (2.4%) | 124 (15.0%) |
| $15,000 to $19,999 | 22 (1.9%) | 58 (7.0%) |
| $20,000 to $24,999 | 26 (2.3%) | 22 (2.6%) |
| $25,000 to $34,999 | 204 (18.1%) | 210 (25.3%) |
| $35,000 to $49,999 | 149 (13.2%) | 139 (16.8%) |
| $50,000 to $74,999 | 136 (12.1%) | 126 (15.2%) |
| $75,000 to $99,999 | 166 (14.7%) | 21 (2.5%) |
| $100,000 to $149,999 | 278 (24.7%) | 33 (4.0%) |
| $150,000 or more | 110 (9.8%) | 18 (2.2%) |
| Total | 1,126 (100.0%) | 829 (100.0%) |
Monthly Housing Cost Tiers in Alva
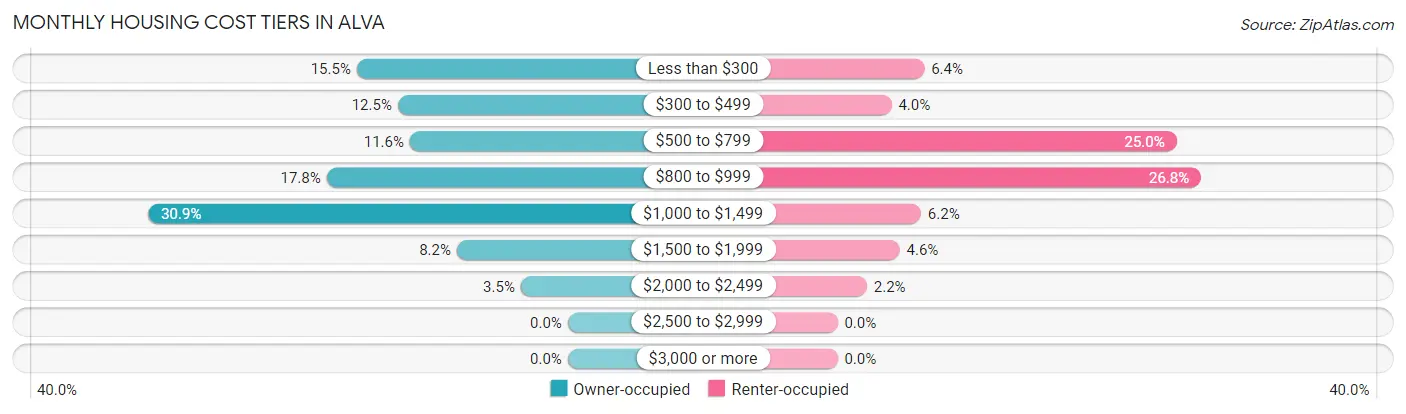
| Monthly Cost | Owner-occupied | Renter-occupied |
| Less than $300 | 175 (15.5%) | 53 (6.4%) |
| $300 to $499 | 141 (12.5%) | 33 (4.0%) |
| $500 to $799 | 131 (11.6%) | 207 (25.0%) |
| $800 to $999 | 200 (17.8%) | 222 (26.8%) |
| $1,000 to $1,499 | 348 (30.9%) | 51 (6.1%) |
| $1,500 to $1,999 | 92 (8.2%) | 38 (4.6%) |
| $2,000 to $2,499 | 39 (3.5%) | 18 (2.2%) |
| $2,500 to $2,999 | 0 (0.0%) | 0 (0.0%) |
| $3,000 or more | 0 (0.0%) | 0 (0.0%) |
| Total | 1,126 (100.0%) | 829 (100.0%) |
Physical Housing Characteristics in Alva
Housing Structures in Alva
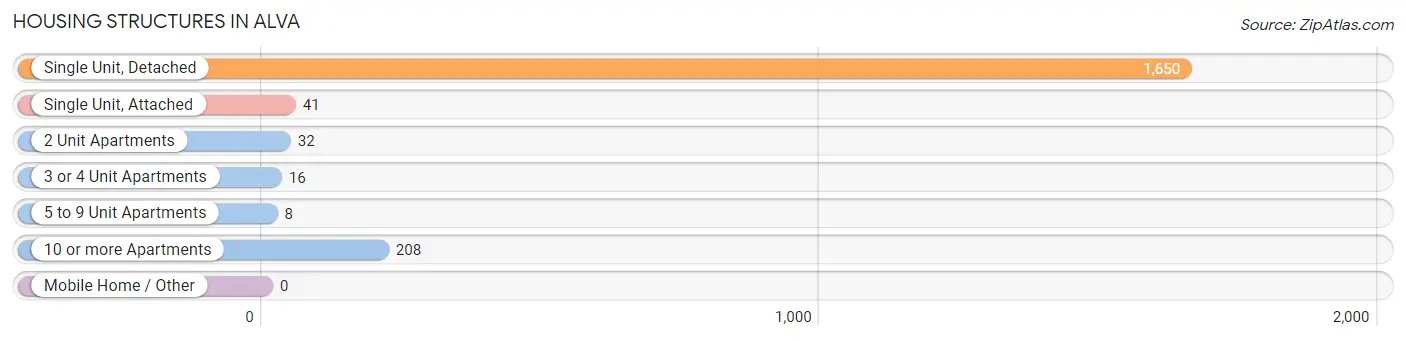
| Structure Type | # Housing Units | % Housing Units |
| Single Unit, Detached | 1,650 | 84.4% |
| Single Unit, Attached | 41 | 2.1% |
| 2 Unit Apartments | 32 | 1.6% |
| 3 or 4 Unit Apartments | 16 | 0.8% |
| 5 to 9 Unit Apartments | 8 | 0.4% |
| 10 or more Apartments | 208 | 10.6% |
| Mobile Home / Other | 0 | 0.0% |
| Total | 1,955 | 100.0% |
Housing Structures by Occupancy in Alva
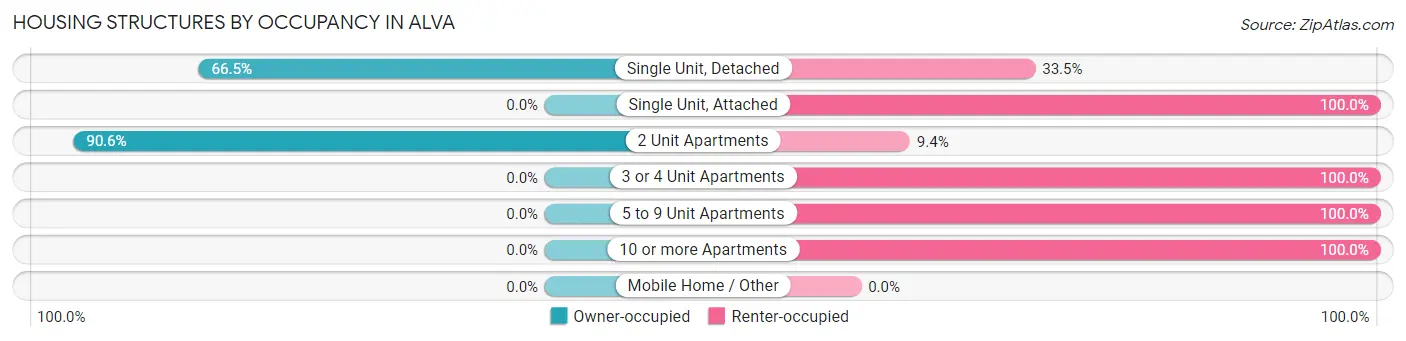
| Structure Type | Owner-occupied | Renter-occupied |
| Single Unit, Detached | 1,097 (66.5%) | 553 (33.5%) |
| Single Unit, Attached | 0 (0.0%) | 41 (100.0%) |
| 2 Unit Apartments | 29 (90.6%) | 3 (9.4%) |
| 3 or 4 Unit Apartments | 0 (0.0%) | 16 (100.0%) |
| 5 to 9 Unit Apartments | 0 (0.0%) | 8 (100.0%) |
| 10 or more Apartments | 0 (0.0%) | 208 (100.0%) |
| Mobile Home / Other | 0 (0.0%) | 0 (0.0%) |
| Total | 1,126 (57.6%) | 829 (42.4%) |
Housing Structures by Number of Rooms in Alva
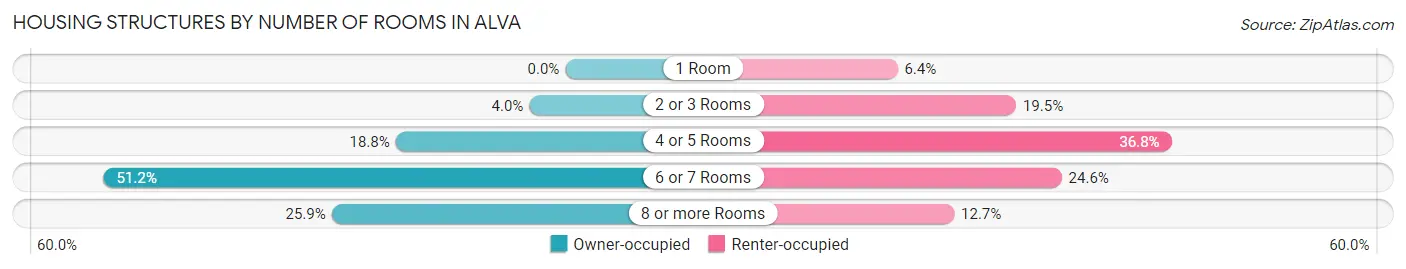
| Number of Rooms | Owner-occupied | Renter-occupied |
| 1 Room | 0 (0.0%) | 53 (6.4%) |
| 2 or 3 Rooms | 45 (4.0%) | 162 (19.5%) |
| 4 or 5 Rooms | 212 (18.8%) | 305 (36.8%) |
| 6 or 7 Rooms | 577 (51.2%) | 204 (24.6%) |
| 8 or more Rooms | 292 (25.9%) | 105 (12.7%) |
| Total | 1,126 (100.0%) | 829 (100.0%) |
Housing Structure by Heating Type in Alva
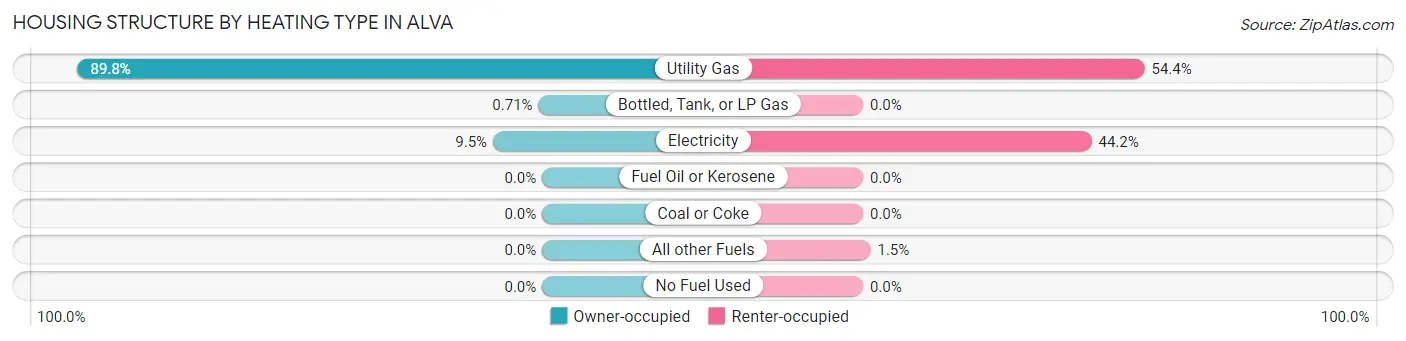
| Heating Type | Owner-occupied | Renter-occupied |
| Utility Gas | 1,011 (89.8%) | 451 (54.4%) |
| Bottled, Tank, or LP Gas | 8 (0.7%) | 0 (0.0%) |
| Electricity | 107 (9.5%) | 366 (44.2%) |
| Fuel Oil or Kerosene | 0 (0.0%) | 0 (0.0%) |
| Coal or Coke | 0 (0.0%) | 0 (0.0%) |
| All other Fuels | 0 (0.0%) | 12 (1.5%) |
| No Fuel Used | 0 (0.0%) | 0 (0.0%) |
| Total | 1,126 (100.0%) | 829 (100.0%) |
Household Vehicle Usage in Alva
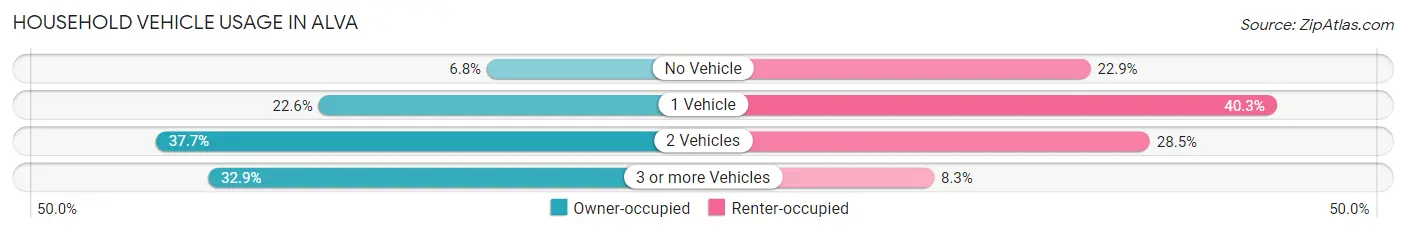
| Vehicles per Household | Owner-occupied | Renter-occupied |
| No Vehicle | 77 (6.8%) | 190 (22.9%) |
| 1 Vehicle | 254 (22.6%) | 334 (40.3%) |
| 2 Vehicles | 425 (37.7%) | 236 (28.5%) |
| 3 or more Vehicles | 370 (32.9%) | 69 (8.3%) |
| Total | 1,126 (100.0%) | 829 (100.0%) |
Real Estate & Mortgages in Alva
Real Estate and Mortgage Overview in Alva
| Characteristic | Without Mortgage | With Mortgage |
| Housing Units | 423 | 703 |
| Median Property Value | $87,400 | $137,600 |
| Median Household Income | $37,266 | $72 |
| Monthly Housing Costs | $353 | $0 |
| Real Estate Taxes | $297 | $31 |
Property Value by Mortgage Status in Alva
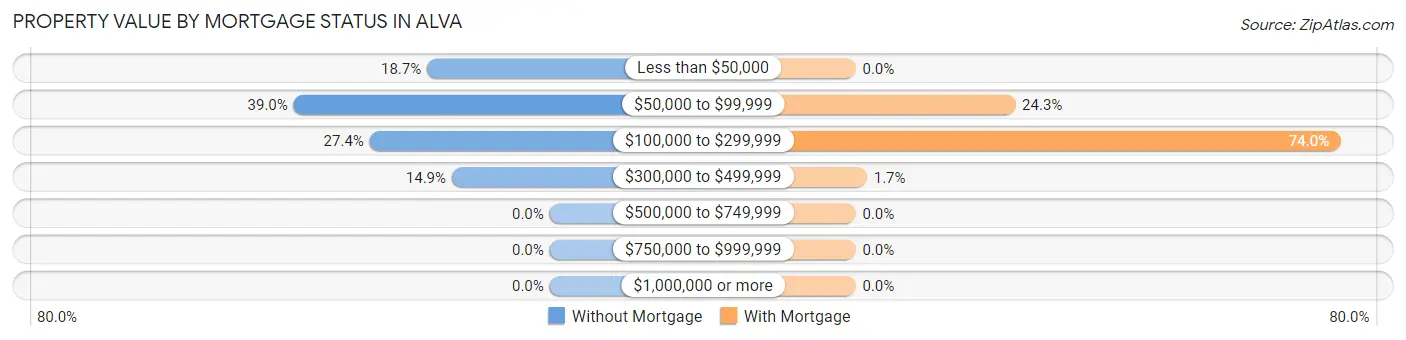
| Property Value | Without Mortgage | With Mortgage |
| Less than $50,000 | 79 (18.7%) | 0 (0.0%) |
| $50,000 to $99,999 | 165 (39.0%) | 171 (24.3%) |
| $100,000 to $299,999 | 116 (27.4%) | 520 (74.0%) |
| $300,000 to $499,999 | 63 (14.9%) | 12 (1.7%) |
| $500,000 to $749,999 | 0 (0.0%) | 0 (0.0%) |
| $750,000 to $999,999 | 0 (0.0%) | 0 (0.0%) |
| $1,000,000 or more | 0 (0.0%) | 0 (0.0%) |
| Total | 423 (100.0%) | 703 (100.0%) |
Household Income by Mortgage Status in Alva
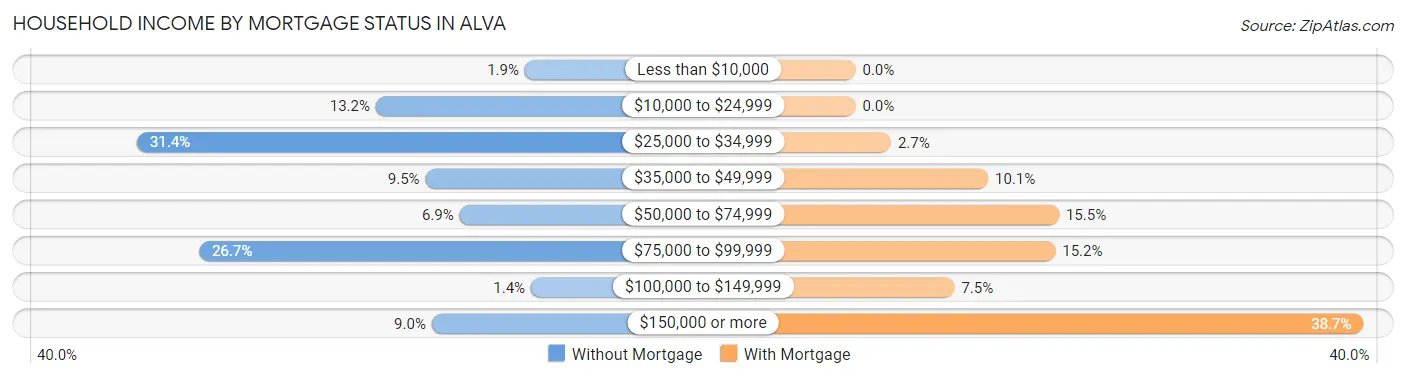
| Household Income | Without Mortgage | With Mortgage |
| Less than $10,000 | 8 (1.9%) | 0 (0.0%) |
| $10,000 to $24,999 | 56 (13.2%) | 0 (0.0%) |
| $25,000 to $34,999 | 133 (31.4%) | 19 (2.7%) |
| $35,000 to $49,999 | 40 (9.5%) | 71 (10.1%) |
| $50,000 to $74,999 | 29 (6.9%) | 109 (15.5%) |
| $75,000 to $99,999 | 113 (26.7%) | 107 (15.2%) |
| $100,000 to $149,999 | 6 (1.4%) | 53 (7.5%) |
| $150,000 or more | 38 (9.0%) | 272 (38.7%) |
| Total | 423 (100.0%) | 703 (100.0%) |
Property Value to Household Income Ratio in Alva
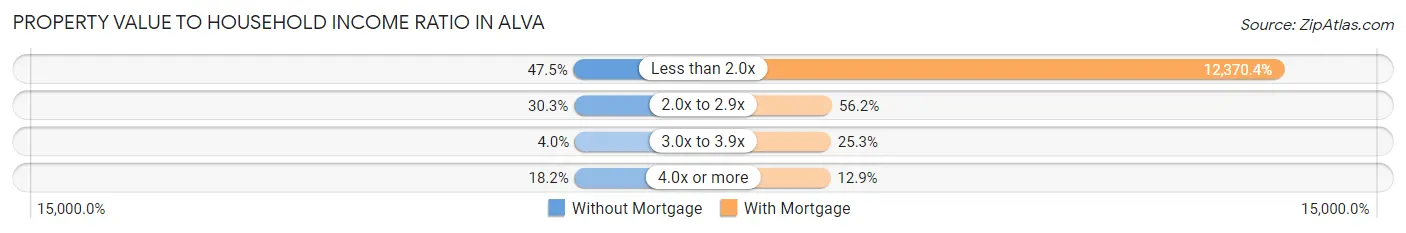
| Value-to-Income Ratio | Without Mortgage | With Mortgage |
| Less than 2.0x | 201 (47.5%) | 86,964 (12,370.4%) |
| 2.0x to 2.9x | 128 (30.3%) | 395 (56.2%) |
| 3.0x to 3.9x | 17 (4.0%) | 178 (25.3%) |
| 4.0x or more | 77 (18.2%) | 91 (12.9%) |
| Total | 423 (100.0%) | 703 (100.0%) |
Real Estate Taxes by Mortgage Status in Alva
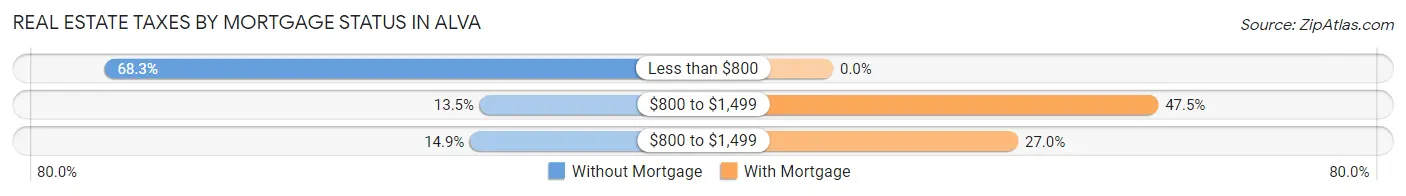
| Property Taxes | Without Mortgage | With Mortgage |
| Less than $800 | 289 (68.3%) | 0 (0.0%) |
| $800 to $1,499 | 57 (13.5%) | 334 (47.5%) |
| $800 to $1,499 | 63 (14.9%) | 190 (27.0%) |
| Total | 423 (100.0%) | 703 (100.0%) |
Health & Disability in Alva
Health Insurance Coverage by Age in Alva
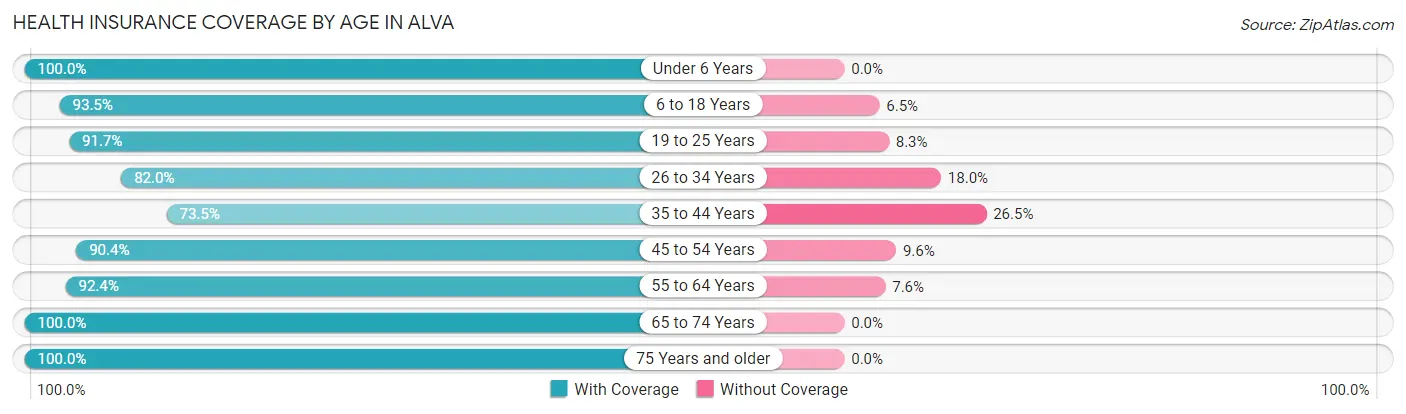
| Age Bracket | With Coverage | Without Coverage |
| Under 6 Years | 267 (100.0%) | 0 (0.0%) |
| 6 to 18 Years | 829 (93.5%) | 58 (6.5%) |
| 19 to 25 Years | 1,050 (91.7%) | 95 (8.3%) |
| 26 to 34 Years | 473 (82.0%) | 104 (18.0%) |
| 35 to 44 Years | 450 (73.5%) | 162 (26.5%) |
| 45 to 54 Years | 291 (90.4%) | 31 (9.6%) |
| 55 to 64 Years | 447 (92.4%) | 37 (7.6%) |
| 65 to 74 Years | 328 (100.0%) | 0 (0.0%) |
| 75 Years and older | 295 (100.0%) | 0 (0.0%) |
| Total | 4,430 (90.1%) | 487 (9.9%) |
Health Insurance Coverage by Citizenship Status in Alva
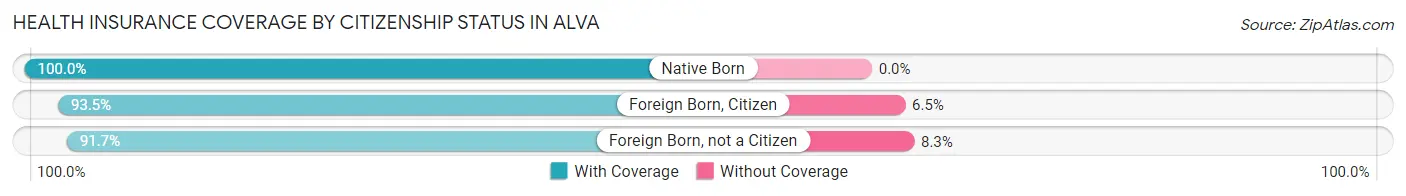
| Citizenship Status | With Coverage | Without Coverage |
| Native Born | 267 (100.0%) | 0 (0.0%) |
| Foreign Born, Citizen | 829 (93.5%) | 58 (6.5%) |
| Foreign Born, not a Citizen | 1,050 (91.7%) | 95 (8.3%) |
Health Insurance Coverage by Household Income in Alva
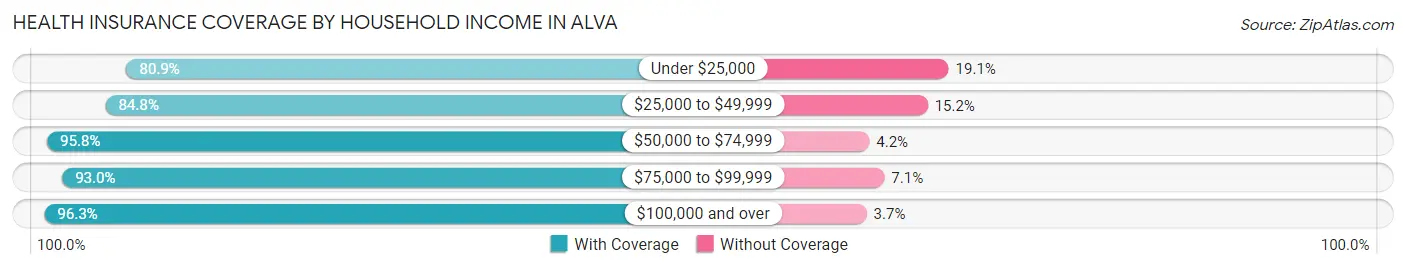
| Household Income | With Coverage | Without Coverage |
| Under $25,000 | 653 (80.9%) | 154 (19.1%) |
| $25,000 to $49,999 | 1,063 (84.8%) | 190 (15.2%) |
| $50,000 to $74,999 | 566 (95.8%) | 25 (4.2%) |
| $75,000 to $99,999 | 514 (92.9%) | 39 (7.0%) |
| $100,000 and over | 1,293 (96.3%) | 50 (3.7%) |
Public vs Private Health Insurance Coverage by Age in Alva
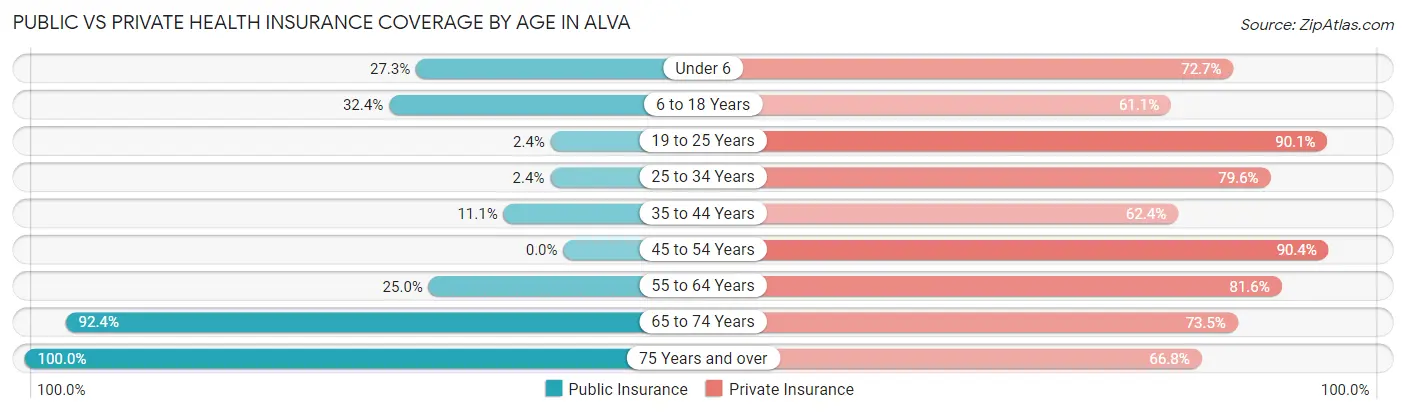
| Age Bracket | Public Insurance | Private Insurance |
| Under 6 | 73 (27.3%) | 194 (72.7%) |
| 6 to 18 Years | 287 (32.4%) | 542 (61.1%) |
| 19 to 25 Years | 27 (2.4%) | 1,032 (90.1%) |
| 25 to 34 Years | 14 (2.4%) | 459 (79.5%) |
| 35 to 44 Years | 68 (11.1%) | 382 (62.4%) |
| 45 to 54 Years | 0 (0.0%) | 291 (90.4%) |
| 55 to 64 Years | 121 (25.0%) | 395 (81.6%) |
| 65 to 74 Years | 303 (92.4%) | 241 (73.5%) |
| 75 Years and over | 295 (100.0%) | 197 (66.8%) |
| Total | 1,188 (24.2%) | 3,733 (75.9%) |
Disability Status by Sex by Age in Alva
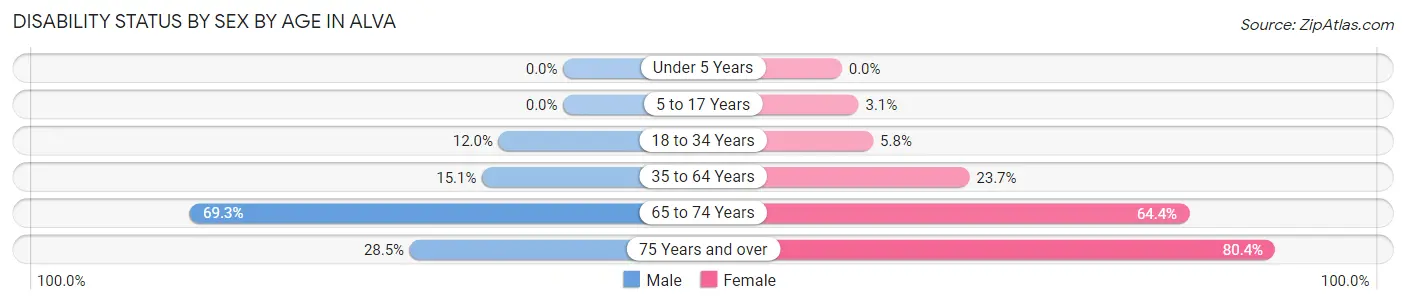
| Age Bracket | Male | Female |
| Under 5 Years | 0 (0.0%) | 0 (0.0%) |
| 5 to 17 Years | 0 (0.0%) | 12 (3.1%) |
| 18 to 34 Years | 112 (12.0%) | 54 (5.8%) |
| 35 to 64 Years | 99 (15.0%) | 180 (23.7%) |
| 65 to 74 Years | 124 (69.3%) | 96 (64.4%) |
| 75 Years and over | 39 (28.5%) | 127 (80.4%) |
Disability Class by Sex by Age in Alva
Disability Class: Hearing Difficulty
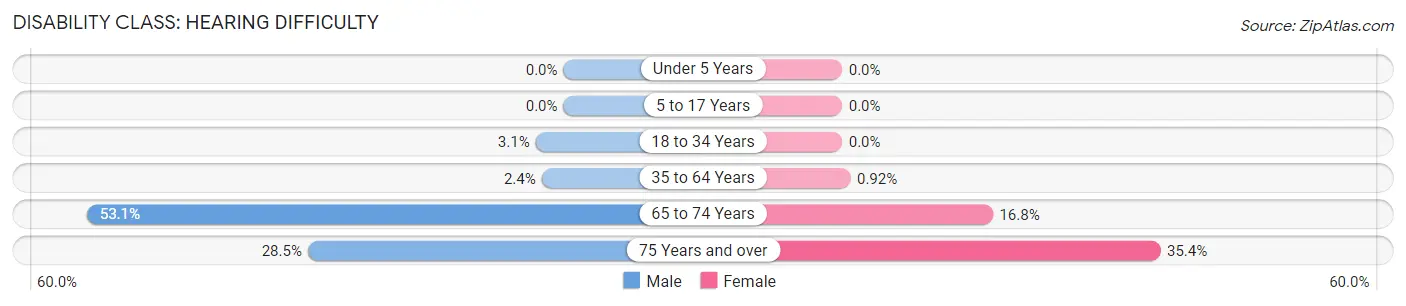
| Age Bracket | Male | Female |
| Under 5 Years | 0 (0.0%) | 0 (0.0%) |
| 5 to 17 Years | 0 (0.0%) | 0 (0.0%) |
| 18 to 34 Years | 29 (3.1%) | 0 (0.0%) |
| 35 to 64 Years | 16 (2.4%) | 7 (0.9%) |
| 65 to 74 Years | 95 (53.1%) | 25 (16.8%) |
| 75 Years and over | 39 (28.5%) | 56 (35.4%) |
Disability Class: Vision Difficulty
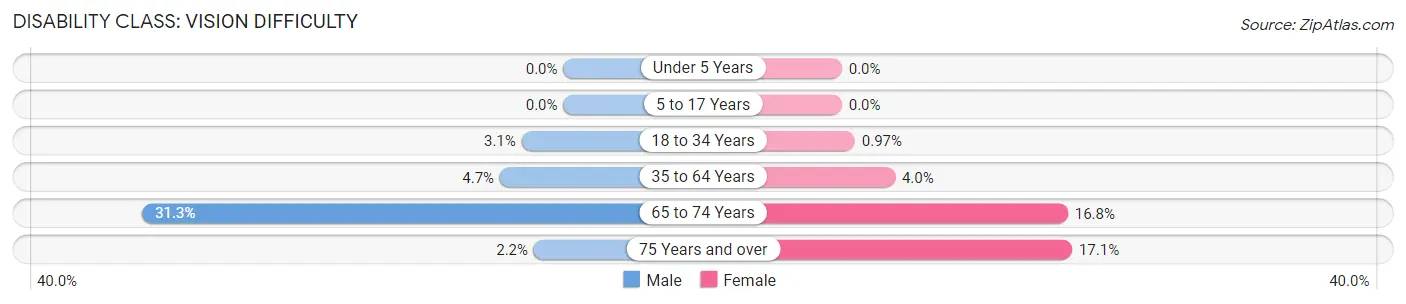
| Age Bracket | Male | Female |
| Under 5 Years | 0 (0.0%) | 0 (0.0%) |
| 5 to 17 Years | 0 (0.0%) | 0 (0.0%) |
| 18 to 34 Years | 29 (3.1%) | 9 (1.0%) |
| 35 to 64 Years | 31 (4.7%) | 30 (4.0%) |
| 65 to 74 Years | 56 (31.3%) | 25 (16.8%) |
| 75 Years and over | 3 (2.2%) | 27 (17.1%) |
Disability Class: Cognitive Difficulty
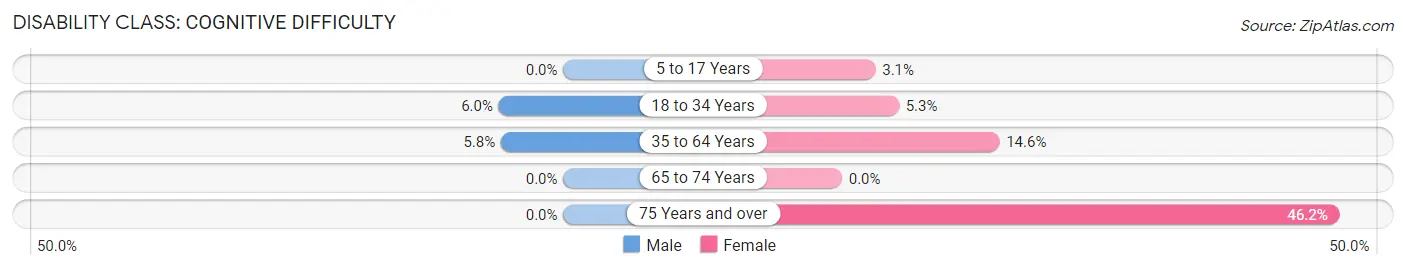
| Age Bracket | Male | Female |
| 5 to 17 Years | 0 (0.0%) | 12 (3.1%) |
| 18 to 34 Years | 56 (6.0%) | 49 (5.3%) |
| 35 to 64 Years | 38 (5.8%) | 111 (14.6%) |
| 65 to 74 Years | 0 (0.0%) | 0 (0.0%) |
| 75 Years and over | 0 (0.0%) | 73 (46.2%) |
Disability Class: Ambulatory Difficulty
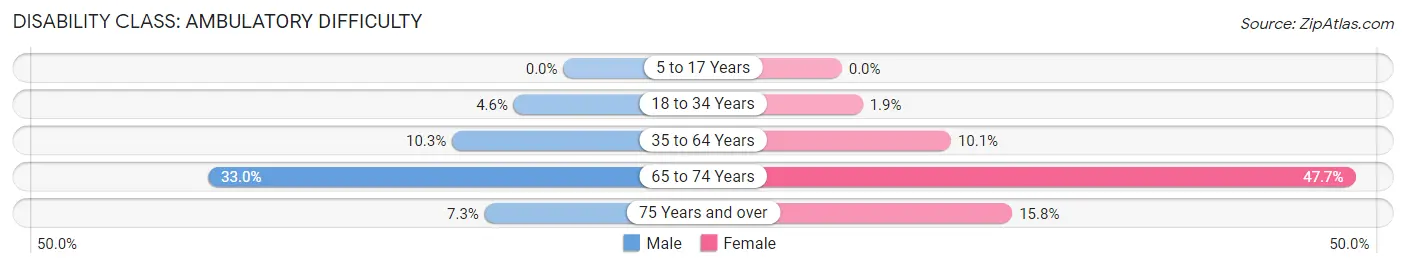
| Age Bracket | Male | Female |
| 5 to 17 Years | 0 (0.0%) | 0 (0.0%) |
| 18 to 34 Years | 43 (4.6%) | 18 (1.9%) |
| 35 to 64 Years | 68 (10.3%) | 77 (10.1%) |
| 65 to 74 Years | 59 (33.0%) | 71 (47.6%) |
| 75 Years and over | 10 (7.3%) | 25 (15.8%) |
Disability Class: Self-Care Difficulty
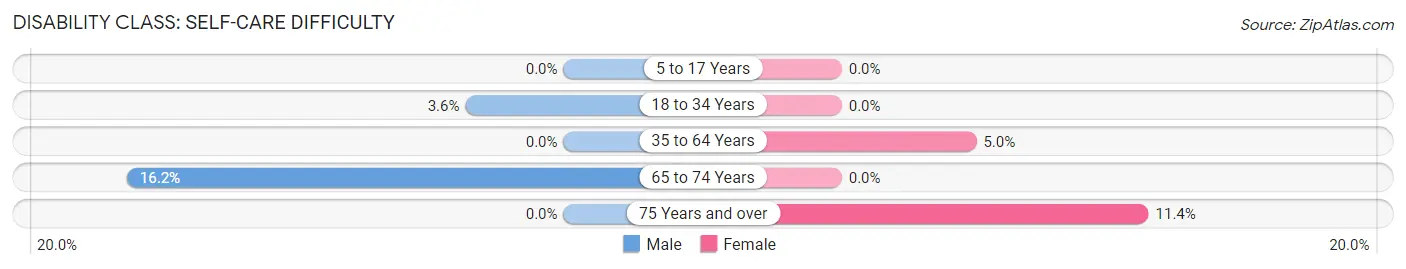
| Age Bracket | Male | Female |
| 5 to 17 Years | 0 (0.0%) | 0 (0.0%) |
| 18 to 34 Years | 34 (3.6%) | 0 (0.0%) |
| 35 to 64 Years | 0 (0.0%) | 38 (5.0%) |
| 65 to 74 Years | 29 (16.2%) | 0 (0.0%) |
| 75 Years and over | 0 (0.0%) | 18 (11.4%) |
Technology Access in Alva
Computing Device Access in Alva
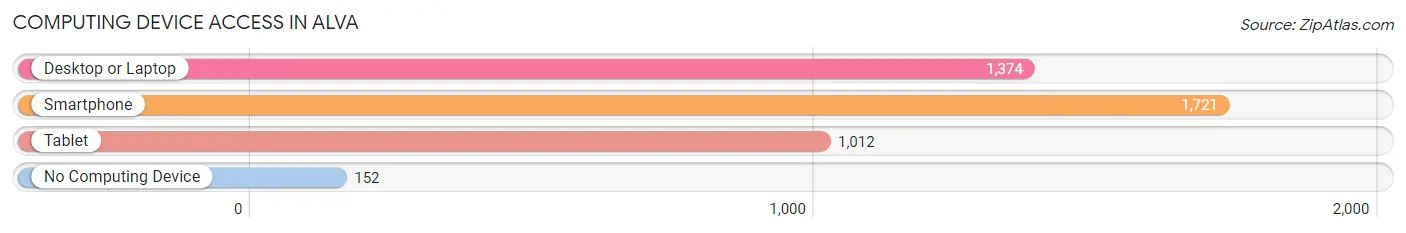
| Device Type | # Households | % Households |
| Desktop or Laptop | 1,374 | 70.3% |
| Smartphone | 1,721 | 88.0% |
| Tablet | 1,012 | 51.8% |
| No Computing Device | 152 | 7.8% |
| Total | 1,955 | 100.0% |
Internet Access in Alva
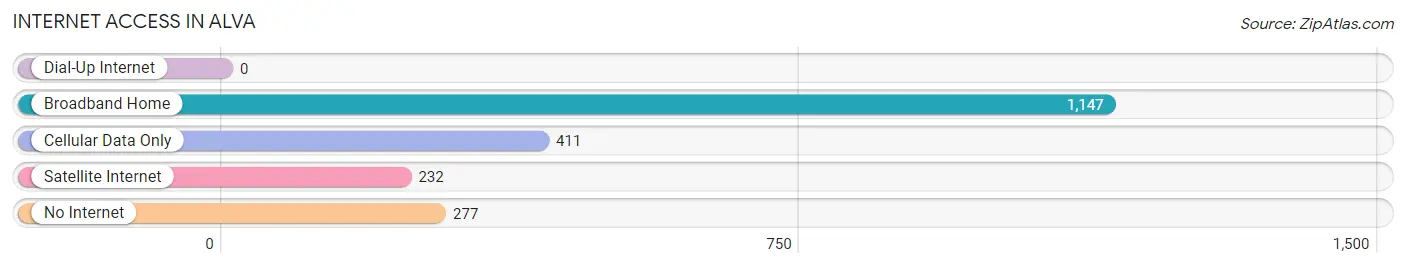
| Internet Type | # Households | % Households |
| Dial-Up Internet | 0 | 0.0% |
| Broadband Home | 1,147 | 58.7% |
| Cellular Data Only | 411 | 21.0% |
| Satellite Internet | 232 | 11.9% |
| No Internet | 277 | 14.2% |
| Total | 1,955 | 100.0% |
Alva Summary
Alva, Oklahoma is a small city located in the northwestern part of the state. It is the county seat of Woods County and is situated on the banks of the Salt Fork of the Arkansas River. The city has a population of approximately 5,000 people and is the largest city in Woods County.
Geography
Alva is located in the northwestern part of Oklahoma, approximately 100 miles northwest of Oklahoma City. It is situated on the banks of the Salt Fork of the Arkansas River, which is a tributary of the Arkansas River. The city is surrounded by rolling hills and prairies, and is located in the Red Bed Plains region of Oklahoma. The climate in Alva is semi-arid, with hot summers and cold winters.
History
Alva was founded in 1893 by the Cherokee Strip Land Run. The city was named after Alva Adams, the Governor of Colorado at the time. The city was incorporated in 1895 and quickly became a center of commerce and industry in the region. The city was home to several large businesses, including a flour mill, a cotton gin, and a brick factory.
In the early 1900s, Alva was a major stop on the Santa Fe Railroad. The city was also home to several educational institutions, including Northwestern State Normal School, which was established in 1897 and is now known as Northwestern Oklahoma State University.
Economy
Alva’s economy is largely based on agriculture and manufacturing. The city is home to several large agricultural operations, including wheat, corn, and soybean farms. The city is also home to several manufacturing companies, including a plastics plant, a furniture factory, and a metal fabrication plant.
The city is also home to Northwestern Oklahoma State University, which is a major employer in the area. The university provides educational opportunities to students from all over the region and is a major contributor to the local economy.
Demographics
As of the 2010 census, Alva had a population of 5,000 people. The racial makeup of the city was 95.2% White, 0.7% African American, 0.7% Native American, 0.3% Asian, 0.1% Pacific Islander, and 2.1% from other races. The median household income in Alva was $35,000, and the median family income was $41,000.
Conclusion
Alva, Oklahoma is a small city located in the northwestern part of the state. It is the county seat of Woods County and is situated on the banks of the Salt Fork of the Arkansas River. The city has a population of approximately 5,000 people and is the largest city in Woods County. The economy of Alva is largely based on agriculture and manufacturing, and the city is home to Northwestern Oklahoma State University. The racial makeup of the city is predominantly White, with a small percentage of African American, Native American, Asian, and Pacific Islander residents.
Common Questions
What is Per Capita Income in Alva?
Per Capita income in Alva is $28,218.
What is the Median Family Income in Alva?
Median Family Income in Alva is $81,091.
What is the Median Household income in Alva?
Median Household Income in Alva is $41,809.
What is Income or Wage Gap in Alva?
Income or Wage Gap in Alva is 32.2%.
Women in Alva earn 67.8 cents for every dollar earned by a man.
What is Inequality or Gini Index in Alva?
Inequality or Gini Index in Alva is 0.48.
What is the Total Population of Alva?
Total Population of Alva is 5,020.
What is the Total Male Population of Alva?
Total Male Population of Alva is 2,436.
What is the Total Female Population of Alva?
Total Female Population of Alva is 2,584.
What is the Ratio of Males per 100 Females in Alva?
There are 94.27 Males per 100 Females in Alva.
What is the Ratio of Females per 100 Males in Alva?
There are 106.08 Females per 100 Males in Alva.
What is the Median Population Age in Alva?
Median Population Age in Alva is 29.2 Years.
What is the Average Family Size in Alva
Average Family Size in Alva is 3.1 People.
What is the Average Household Size in Alva
Average Household Size in Alva is 2.3 People.
How Large is the Labor Force in Alva?
There are 2,678 People in the Labor Forcein in Alva.
What is the Percentage of People in the Labor Force in Alva?
66.0% of People are in the Labor Force in Alva.
What is the Unemployment Rate in Alva?
Unemployment Rate in Alva is 5.1%.