Park Hill, OK Map & Demographics
Park Hill Map
Park Hill Overview
$24,389
PER CAPITA INCOME
$54,646
AVG FAMILY INCOME
$44,420
AVG HOUSEHOLD INCOME
4.9%
WAGE / INCOME GAP [ % ]
95.1¢/ $1
WAGE / INCOME GAP [ $ ]
0.44
INEQUALITY / GINI INDEX
3,587
TOTAL POPULATION
1,742
MALE POPULATION
1,845
FEMALE POPULATION
94.42
MALES / 100 FEMALES
105.91
FEMALES / 100 MALES
25.9
MEDIAN AGE
3.6
AVG FAMILY SIZE
3.2
AVG HOUSEHOLD SIZE
1,644
LABOR FORCE [ PEOPLE ]
61.5%
PERCENT IN LABOR FORCE
3.7%
UNEMPLOYMENT RATE
Park Hill Zip Codes
Park Hill Area Codes
Income in Park Hill
Income Overview in Park Hill
Per Capita Income in Park Hill is $24,389, while median incomes of families and households are $54,646 and $44,420 respectively.
| Characteristic | Number | Measure |
| Per Capita Income | 3,587 | $24,389 |
| Median Family Income | 835 | $54,646 |
| Mean Family Income | 835 | $73,320 |
| Median Household Income | 1,062 | $44,420 |
| Mean Household Income | 1,062 | $65,703 |
| Income Deficit | 835 | $0 |
| Wage / Income Gap (%) | 3,587 | 4.92% |
| Wage / Income Gap ($) | 3,587 | 95.08¢ per $1 |
| Gini / Inequality Index | 3,587 | 0.44 |
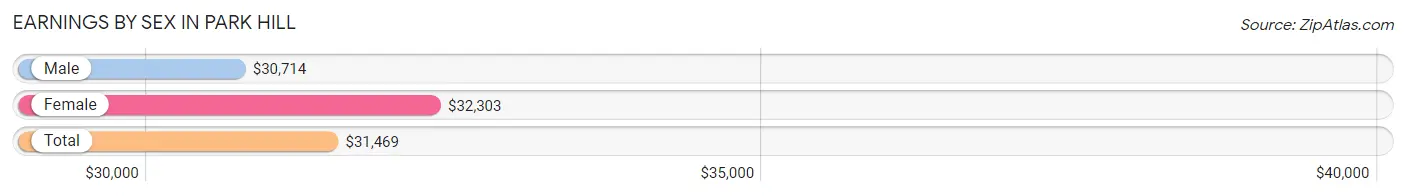
Earnings by Sex in Park Hill
Average Earnings in Park Hill are $31,469, $30,714 for men and $32,303 for women, a difference of 4.9%.
| Sex | Number | Average Earnings |
| Male | 808 (46.3%) | $30,714 |
| Female | 937 (53.7%) | $32,303 |
| Total | 1,745 (100.0%) | $31,469 |
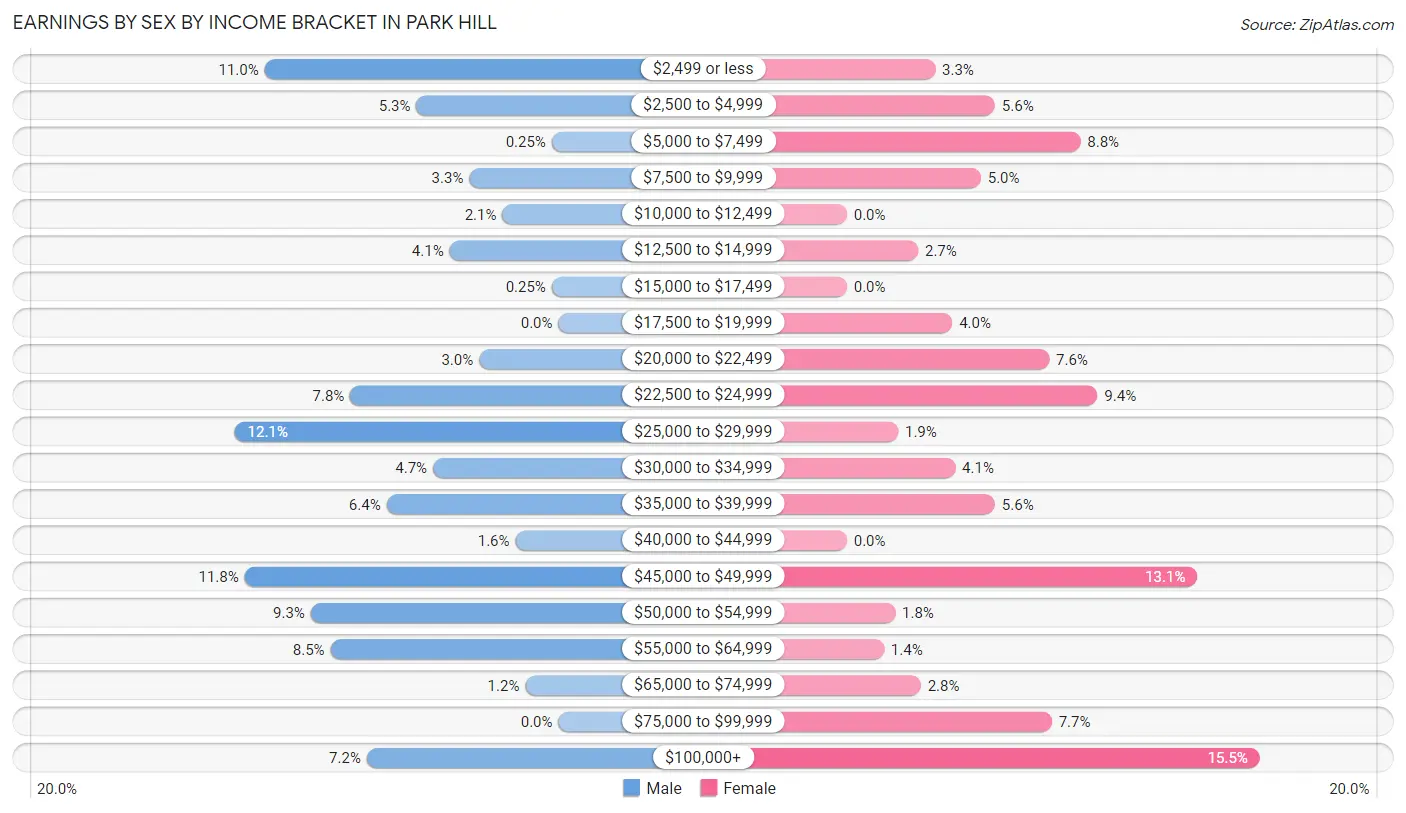
Earnings by Sex by Income Bracket in Park Hill
The most common earnings brackets in Park Hill are $25,000 to $29,999 for men (98 | 12.1%) and $100,000+ for women (145 | 15.5%).
| Income | Male | Female |
| $2,499 or less | 89 (11.0%) | 31 (3.3%) |
| $2,500 to $4,999 | 43 (5.3%) | 52 (5.6%) |
| $5,000 to $7,499 | 2 (0.3%) | 82 (8.7%) |
| $7,500 to $9,999 | 27 (3.3%) | 47 (5.0%) |
| $10,000 to $12,499 | 17 (2.1%) | 0 (0.0%) |
| $12,500 to $14,999 | 33 (4.1%) | 25 (2.7%) |
| $15,000 to $17,499 | 2 (0.3%) | 0 (0.0%) |
| $17,500 to $19,999 | 0 (0.0%) | 37 (4.0%) |
| $20,000 to $22,499 | 24 (3.0%) | 71 (7.6%) |
| $22,500 to $24,999 | 63 (7.8%) | 88 (9.4%) |
| $25,000 to $29,999 | 98 (12.1%) | 18 (1.9%) |
| $30,000 to $34,999 | 38 (4.7%) | 38 (4.1%) |
| $35,000 to $39,999 | 52 (6.4%) | 52 (5.6%) |
| $40,000 to $44,999 | 13 (1.6%) | 0 (0.0%) |
| $45,000 to $49,999 | 95 (11.8%) | 123 (13.1%) |
| $50,000 to $54,999 | 75 (9.3%) | 17 (1.8%) |
| $55,000 to $64,999 | 69 (8.5%) | 13 (1.4%) |
| $65,000 to $74,999 | 10 (1.2%) | 26 (2.8%) |
| $75,000 to $99,999 | 0 (0.0%) | 72 (7.7%) |
| $100,000+ | 58 (7.2%) | 145 (15.5%) |
| Total | 808 (100.0%) | 937 (100.0%) |
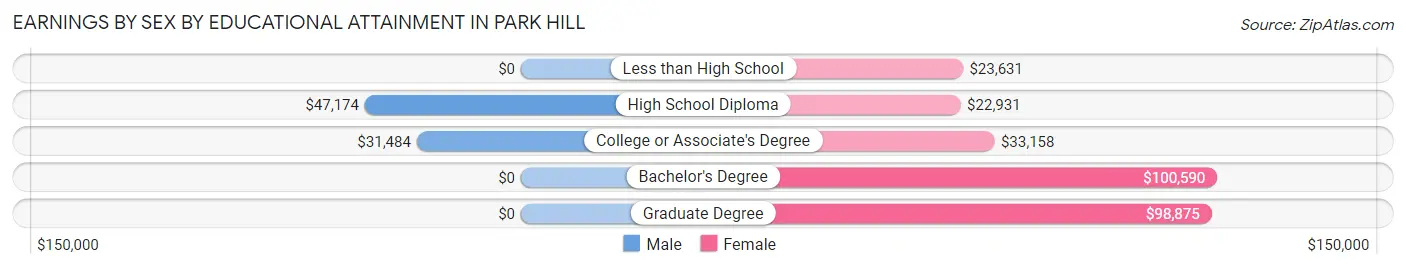
Earnings by Sex by Educational Attainment in Park Hill
Average earnings in Park Hill are $31,548 for men and $45,152 for women, a difference of 30.1%. Men with an educational attainment of high school diploma enjoy the highest average annual earnings of $47,174, while those with college or associate's degree education earn the least with $31,484. Women with an educational attainment of bachelor's degree earn the most with the average annual earnings of $100,590, while those with high school diploma education have the smallest earnings of $22,931.
| Educational Attainment | Male Income | Female Income |
| Less than High School | - | - |
| High School Diploma | $47,174 | $22,931 |
| College or Associate's Degree | $31,484 | $33,158 |
| Bachelor's Degree | - | - |
| Graduate Degree | - | - |
| Total | $31,548 | $45,152 |
Family Income in Park Hill
Family Income Brackets in Park Hill
According to the Park Hill family income data, there are 185 families falling into the $100,000 to $149,999 income range, which is the most common income bracket and makes up 22.2% of all families.
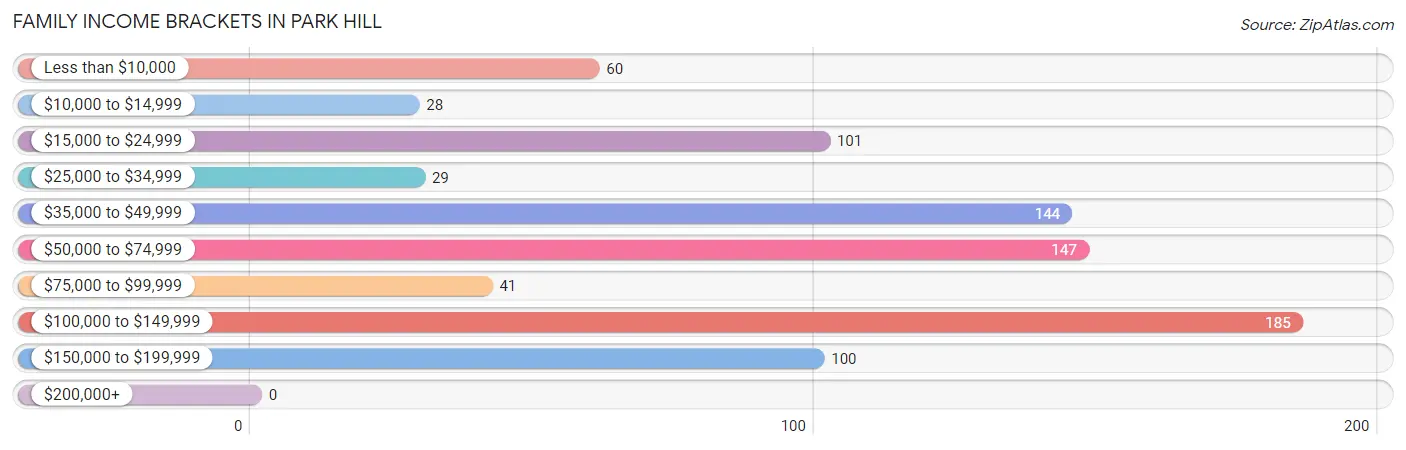
| Income Bracket | # Families | % Families |
| Less than $10,000 | 60 | 7.2% |
| $10,000 to $14,999 | 28 | 3.4% |
| $15,000 to $24,999 | 101 | 12.1% |
| $25,000 to $34,999 | 29 | 3.5% |
| $35,000 to $49,999 | 144 | 17.2% |
| $50,000 to $74,999 | 147 | 17.6% |
| $75,000 to $99,999 | 41 | 4.9% |
| $100,000 to $149,999 | 185 | 22.2% |
| $150,000 to $199,999 | 100 | 12.0% |
| $200,000+ | 0 | 0.0% |
Family Income by Famaliy Size in Park Hill
6-person families (62 | 7.4%) account for the highest median family income in Park Hill with $165,461 per family, while 6-person families (62 | 7.4%) have the highest median income of $27,577 per family member.
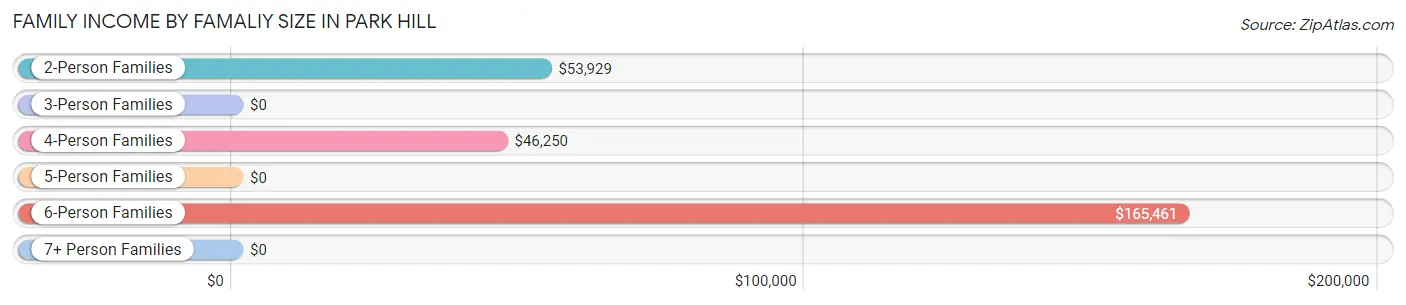
| Income Bracket | # Families | Median Income |
| 2-Person Families | 290 (34.7%) | $53,929 |
| 3-Person Families | 250 (29.9%) | $0 |
| 4-Person Families | 174 (20.8%) | $46,250 |
| 5-Person Families | 41 (4.9%) | $0 |
| 6-Person Families | 62 (7.4%) | $165,461 |
| 7+ Person Families | 18 (2.2%) | $0 |
| Total | 835 (100.0%) | $54,646 |
Family Income by Number of Earners in Park Hill
The median family income in Park Hill is $54,646, with families comprising 3+ earners (78) having the highest median family income of $116,810, while families with 1 earner (392) have the lowest median family income of $42,572, accounting for 9.3% and 46.9% of families, respectively.
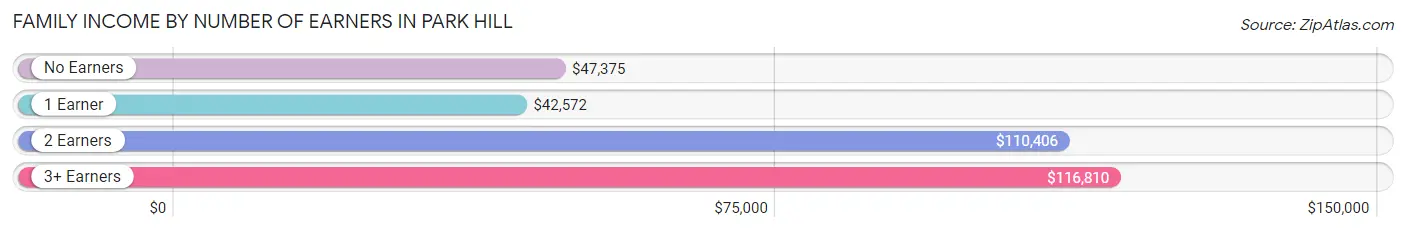
| Number of Earners | # Families | Median Income |
| No Earners | 70 (8.4%) | $47,375 |
| 1 Earner | 392 (46.9%) | $42,572 |
| 2 Earners | 295 (35.3%) | $110,406 |
| 3+ Earners | 78 (9.3%) | $116,810 |
| Total | 835 (100.0%) | $54,646 |
Household Income in Park Hill
Household Income Brackets in Park Hill
With 185 households falling in the category, the $100,000 to $149,999 income range is the most frequent in Park Hill, accounting for 17.4% of all households. In contrast, only 20 households (1.9%) fall into the $200,000+ income bracket, making it the least populous group.
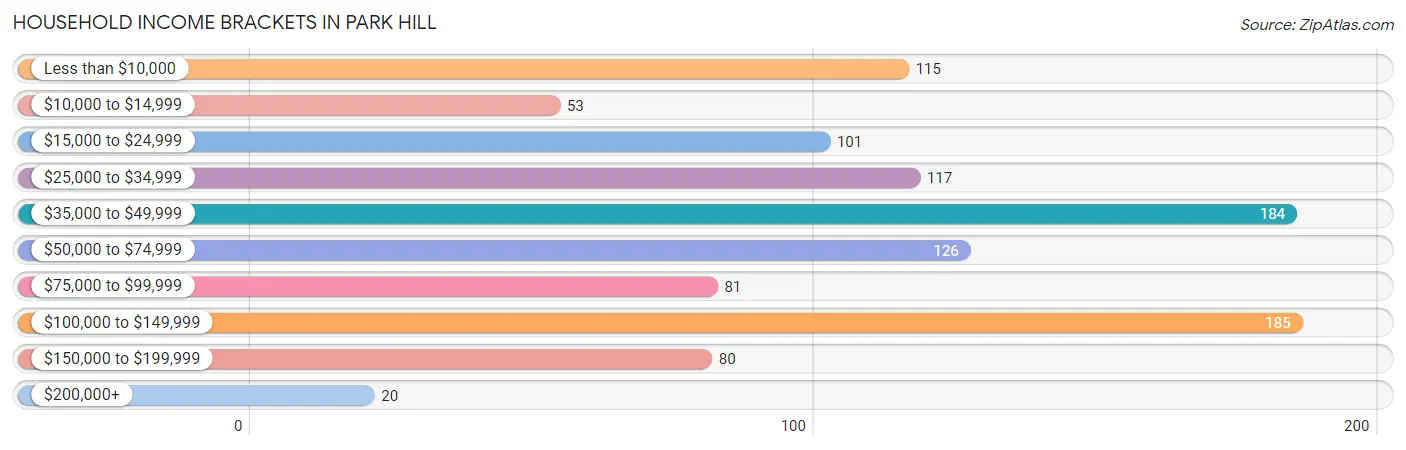
| Income Bracket | # Households | % Households |
| Less than $10,000 | 115 | 10.8% |
| $10,000 to $14,999 | 53 | 5.0% |
| $15,000 to $24,999 | 101 | 9.5% |
| $25,000 to $34,999 | 117 | 11.0% |
| $35,000 to $49,999 | 184 | 17.3% |
| $50,000 to $74,999 | 126 | 11.9% |
| $75,000 to $99,999 | 81 | 7.6% |
| $100,000 to $149,999 | 185 | 17.4% |
| $150,000 to $199,999 | 80 | 7.5% |
| $200,000+ | 20 | 1.9% |
Household Income by Householder Age in Park Hill
The median household income in Park Hill is $44,420, with the highest median household income of $92,917 found in the 45 to 64 years age bracket for the primary householder. A total of 264 households (24.9%) fall into this category. Meanwhile, the 15 to 24 years age bracket for the primary householder has the lowest median household income of $0, with 56 households (5.3%) in this group.
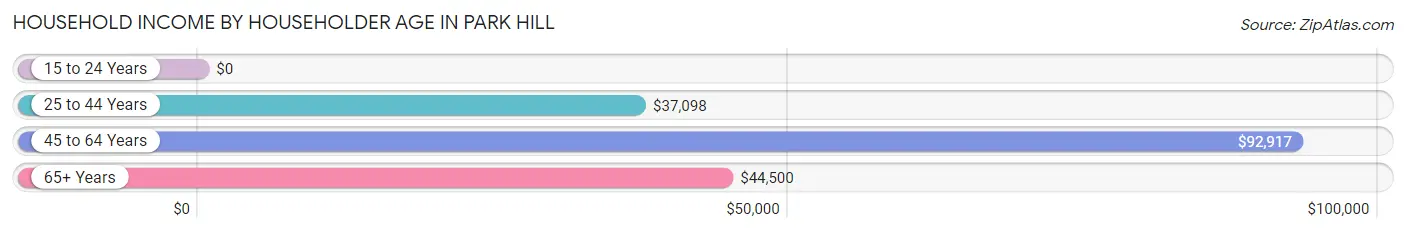
| Income Bracket | # Households | Median Income |
| 15 to 24 Years | 56 (5.3%) | $0 |
| 25 to 44 Years | 488 (46.0%) | $37,098 |
| 45 to 64 Years | 264 (24.9%) | $92,917 |
| 65+ Years | 254 (23.9%) | $44,500 |
| Total | 1,062 (100.0%) | $44,420 |
Poverty in Park Hill
Income Below Poverty by Sex and Age in Park Hill
With 34.0% poverty level for males and 26.1% for females among the residents of Park Hill, 5 year old males and 15 year old females are the most vulnerable to poverty, with 34 males (100.0%) and 6 females (66.7%) in their respective age groups living below the poverty level.
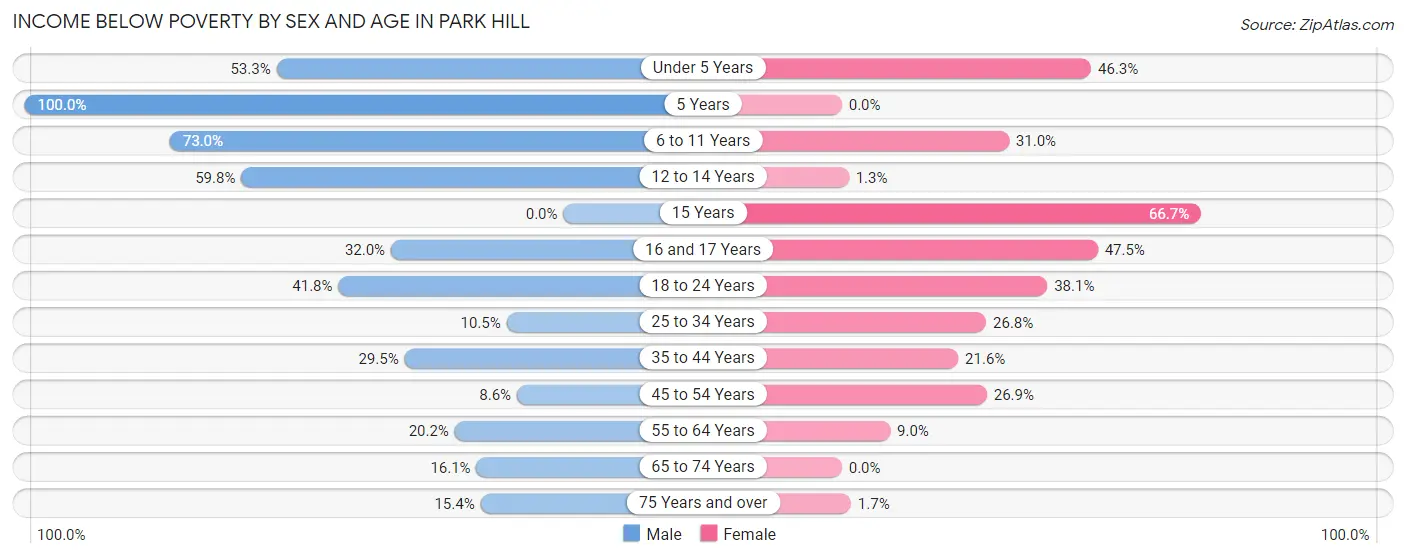
| Age Bracket | Male | Female |
| Under 5 Years | 90 (53.2%) | 87 (46.3%) |
| 5 Years | 34 (100.0%) | 0 (0.0%) |
| 6 to 11 Years | 84 (73.0%) | 58 (31.0%) |
| 12 to 14 Years | 58 (59.8%) | 1 (1.3%) |
| 15 Years | 0 (0.0%) | 6 (66.7%) |
| 16 and 17 Years | 8 (32.0%) | 19 (47.5%) |
| 18 to 24 Years | 157 (41.8%) | 98 (38.1%) |
| 25 to 34 Years | 31 (10.5%) | 135 (26.8%) |
| 35 to 44 Years | 69 (29.5%) | 35 (21.6%) |
| 45 to 54 Years | 5 (8.6%) | 28 (26.9%) |
| 55 to 64 Years | 24 (20.2%) | 12 (9.0%) |
| 65 to 74 Years | 30 (16.1%) | 0 (0.0%) |
| 75 Years and over | 2 (15.4%) | 1 (1.7%) |
| Total | 592 (34.0%) | 480 (26.1%) |
Income Above Poverty by Sex and Age in Park Hill
According to the poverty statistics in Park Hill, males aged 15 years and females aged 5 years are the age groups that are most secure financially, with 100.0% of males and 100.0% of females in these age groups living above the poverty line.
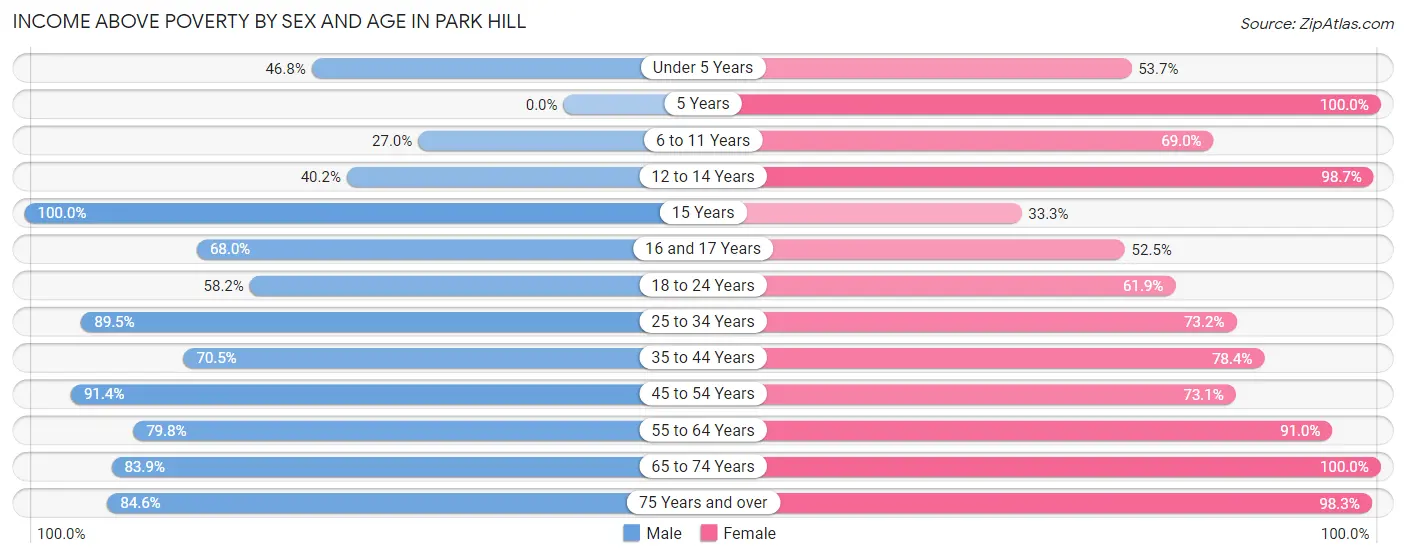
| Age Bracket | Male | Female |
| Under 5 Years | 79 (46.8%) | 101 (53.7%) |
| 5 Years | 0 (0.0%) | 12 (100.0%) |
| 6 to 11 Years | 31 (27.0%) | 129 (69.0%) |
| 12 to 14 Years | 39 (40.2%) | 77 (98.7%) |
| 15 Years | 22 (100.0%) | 3 (33.3%) |
| 16 and 17 Years | 17 (68.0%) | 21 (52.5%) |
| 18 to 24 Years | 219 (58.2%) | 159 (61.9%) |
| 25 to 34 Years | 263 (89.5%) | 369 (73.2%) |
| 35 to 44 Years | 165 (70.5%) | 127 (78.4%) |
| 45 to 54 Years | 53 (91.4%) | 76 (73.1%) |
| 55 to 64 Years | 95 (79.8%) | 122 (91.0%) |
| 65 to 74 Years | 156 (83.9%) | 107 (100.0%) |
| 75 Years and over | 11 (84.6%) | 58 (98.3%) |
| Total | 1,150 (66.0%) | 1,361 (73.9%) |
Income Below Poverty Among Married-Couple Families in Park Hill
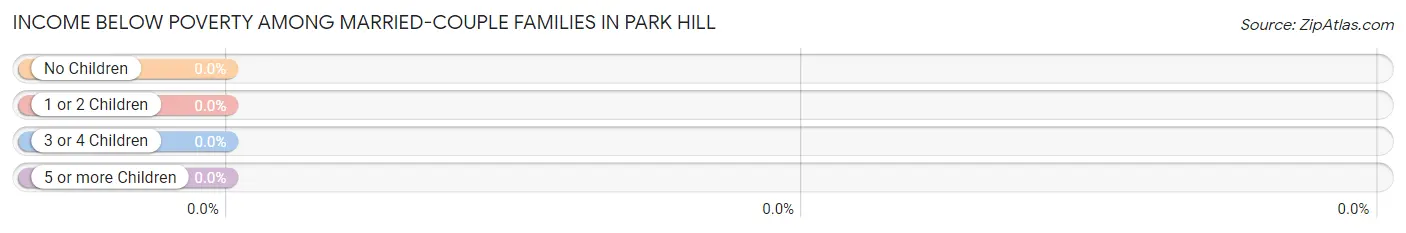
| Children | Above Poverty | Below Poverty |
| No Children | 257 (100.0%) | 0 (0.0%) |
| 1 or 2 Children | 109 (100.0%) | 0 (0.0%) |
| 3 or 4 Children | 80 (100.0%) | 0 (0.0%) |
| 5 or more Children | 0 (0.0%) | 0 (0.0%) |
| Total | 446 (100.0%) | 0 (0.0%) |
Income Below Poverty Among Single-Parent Households in Park Hill
According to the poverty data in Park Hill, 19.2% or 24 single-father households and 58.3% or 154 single-mother households are living below the poverty line. Among single-father households, those with 1 or 2 children have the highest poverty rate, with 24 households (30.0%) experiencing poverty. Likewise, among single-mother households, those with 1 or 2 children have the highest poverty rate, with 107 households (78.1%) falling below the poverty line.
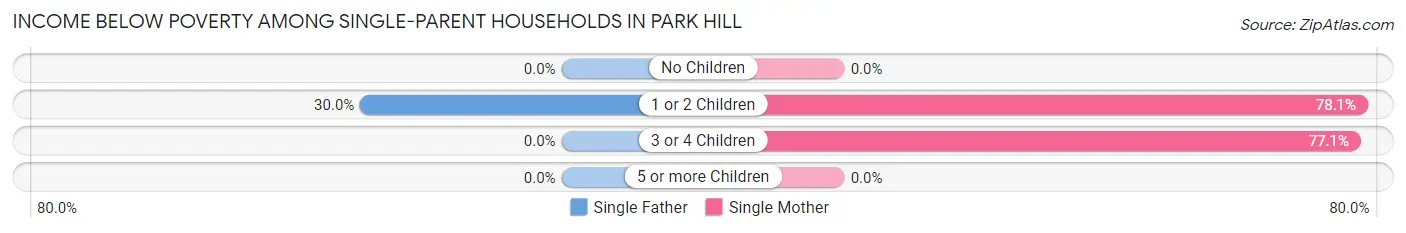
| Children | Single Father | Single Mother |
| No Children | 0 (0.0%) | 0 (0.0%) |
| 1 or 2 Children | 24 (30.0%) | 107 (78.1%) |
| 3 or 4 Children | 0 (0.0%) | 47 (77.0%) |
| 5 or more Children | 0 (0.0%) | 0 (0.0%) |
| Total | 24 (19.2%) | 154 (58.3%) |
Income Below Poverty Among Married-Couple vs Single-Parent Households in Park Hill
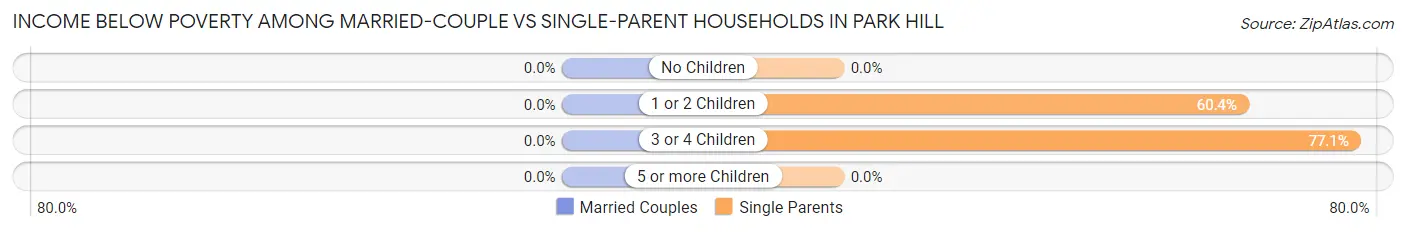
| Children | Married-Couple Families | Single-Parent Households |
| No Children | 0 (0.0%) | 0 (0.0%) |
| 1 or 2 Children | 0 (0.0%) | 131 (60.4%) |
| 3 or 4 Children | 0 (0.0%) | 47 (77.0%) |
| 5 or more Children | 0 (0.0%) | 0 (0.0%) |
| Total | 0 (0.0%) | 178 (45.8%) |
Race in Park Hill
The most populous races in Park Hill are White / Caucasian (1,687 | 47.0%), Native / Alaskan (1,228 | 34.2%), and Hispanic or Latino (637 | 17.8%).
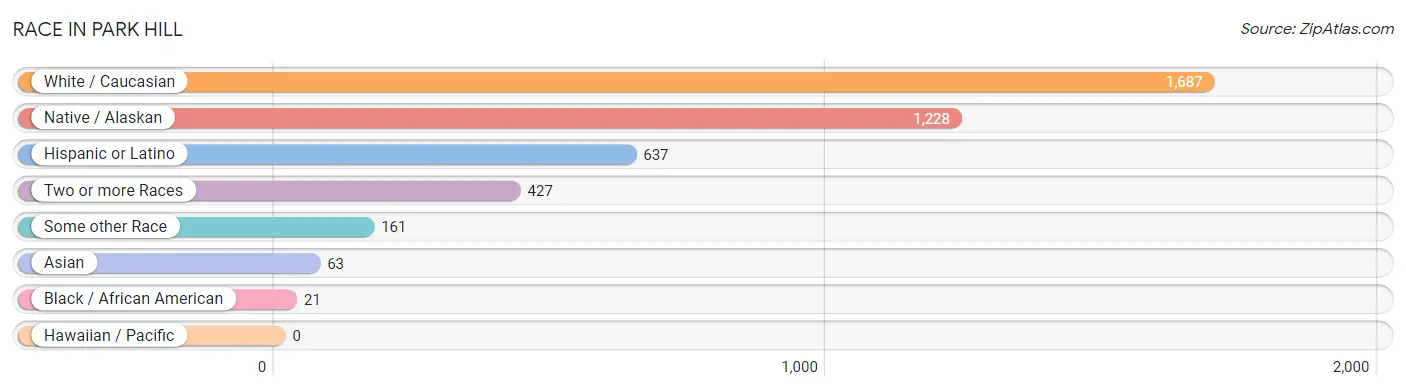
| Race | # Population | % Population |
| Asian | 63 | 1.8% |
| Black / African American | 21 | 0.6% |
| Hawaiian / Pacific | 0 | 0.0% |
| Hispanic or Latino | 637 | 17.8% |
| Native / Alaskan | 1,228 | 34.2% |
| White / Caucasian | 1,687 | 47.0% |
| Two or more Races | 427 | 11.9% |
| Some other Race | 161 | 4.5% |
| Total | 3,587 | 100.0% |
Ancestry in Park Hill
The most populous ancestries reported in Park Hill are Cherokee (1,378 | 38.4%), Mexican (528 | 14.7%), German (360 | 10.0%), American (276 | 7.7%), and Irish (273 | 7.6%), together accounting for 78.5% of all Park Hill residents.
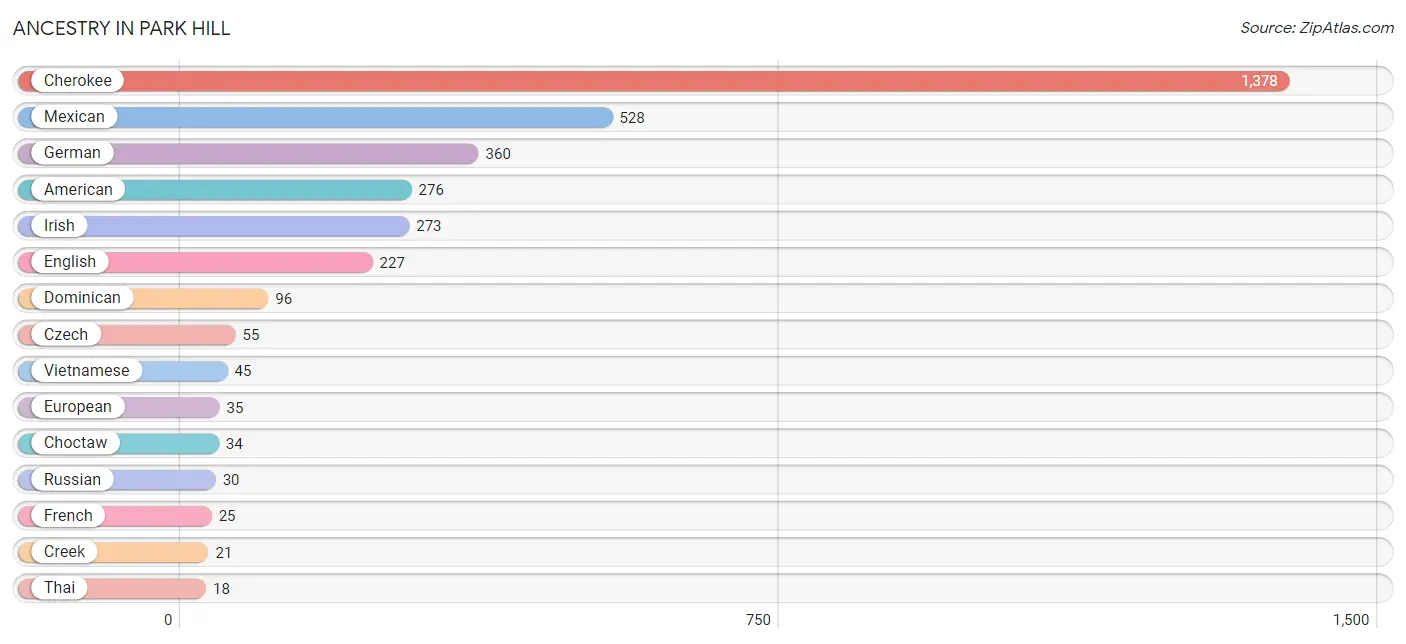
| Ancestry | # Population | % Population |
| Alsatian | 4 | 0.1% |
| American | 276 | 7.7% |
| Cherokee | 1,378 | 38.4% |
| Choctaw | 34 | 0.9% |
| Creek | 21 | 0.6% |
| Cuban | 4 | 0.1% |
| Czech | 55 | 1.5% |
| Delaware | 3 | 0.1% |
| Dominican | 96 | 2.7% |
| Dutch | 13 | 0.4% |
| Dutch West Indian | 6 | 0.2% |
| English | 227 | 6.3% |
| European | 35 | 1.0% |
| French | 25 | 0.7% |
| German | 360 | 10.0% |
| Hungarian | 5 | 0.1% |
| Irish | 273 | 7.6% |
| Italian | 11 | 0.3% |
| Kiowa | 13 | 0.4% |
| Lithuanian | 6 | 0.2% |
| Mexican | 528 | 14.7% |
| Polish | 6 | 0.2% |
| Russian | 30 | 0.8% |
| Scotch-Irish | 2 | 0.1% |
| Thai | 18 | 0.5% |
| Vietnamese | 45 | 1.3% | View All 26 Rows |
Immigrants in Park Hill
The most numerous immigrant groups reported in Park Hill came from Latin America (211 | 5.9%), Central America (144 | 4.0%), Mexico (144 | 4.0%), Caribbean (67 | 1.9%), and Dominican Republic (67 | 1.9%), together accounting for 17.6% of all Park Hill residents.
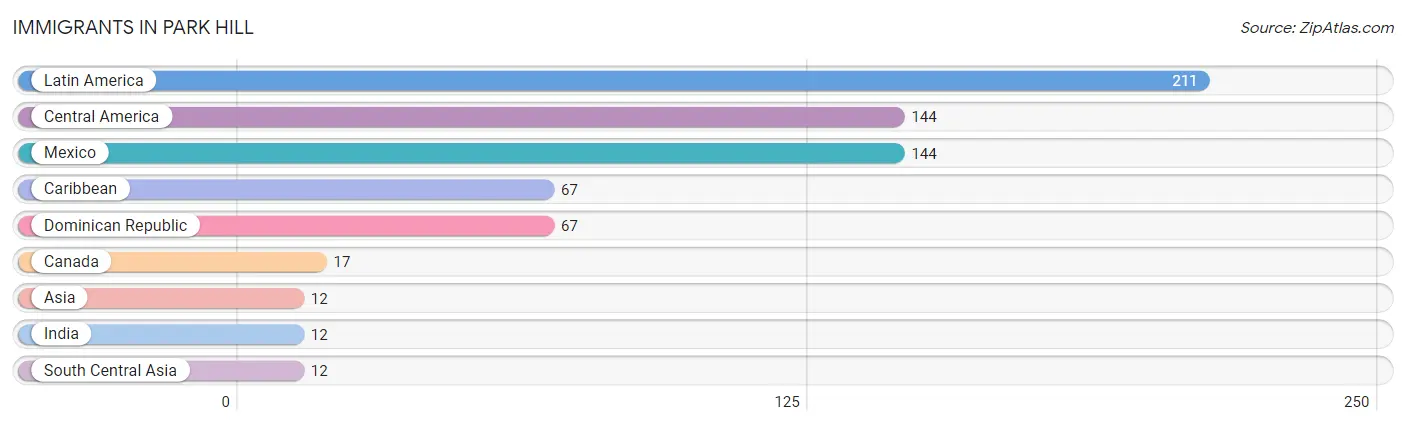
| Immigration Origin | # Population | % Population |
| Asia | 12 | 0.3% |
| Canada | 17 | 0.5% |
| Caribbean | 67 | 1.9% |
| Central America | 144 | 4.0% |
| Dominican Republic | 67 | 1.9% |
| India | 12 | 0.3% |
| Latin America | 211 | 5.9% |
| Mexico | 144 | 4.0% |
| South Central Asia | 12 | 0.3% | View All 9 Rows |
Sex and Age in Park Hill
Sex and Age in Park Hill
The most populous age groups in Park Hill are 20 to 24 Years (285 | 16.4%) for men and 25 to 29 Years (391 | 21.2%) for women.
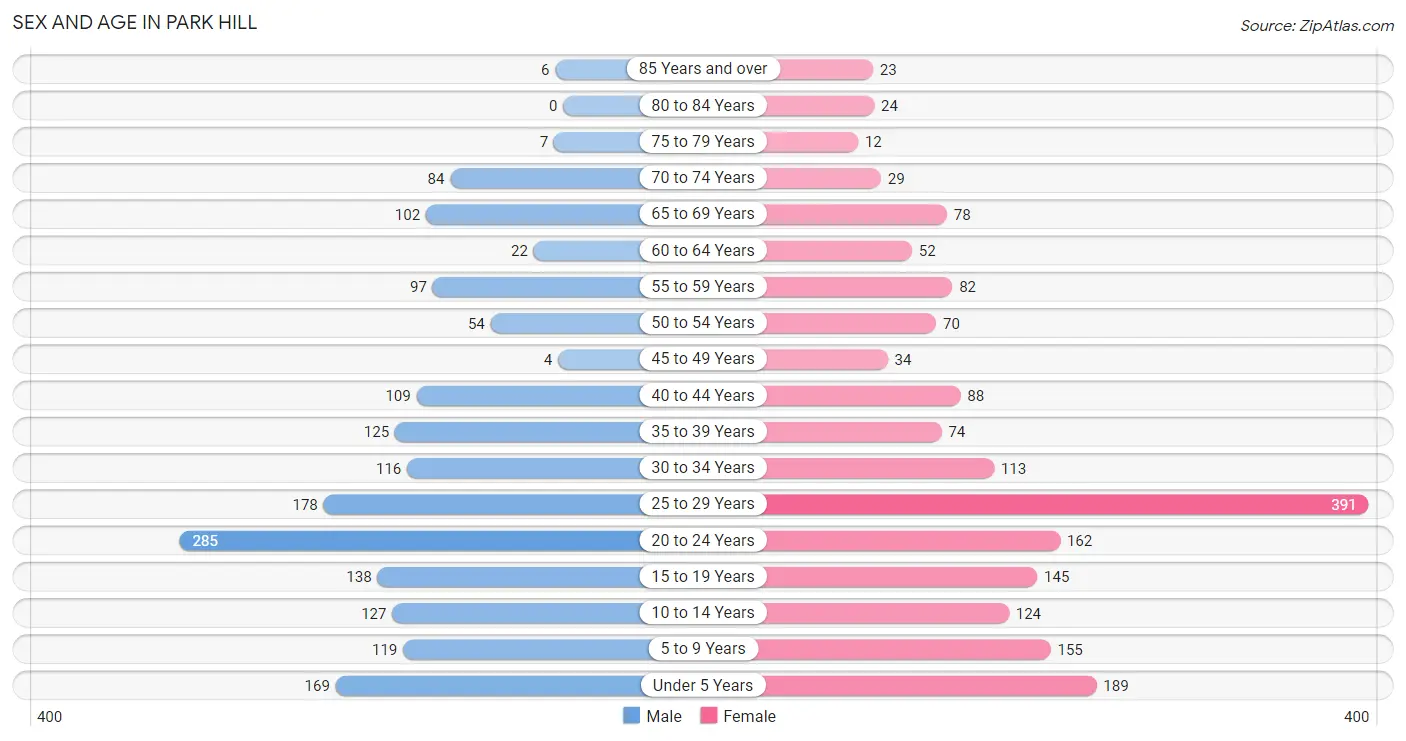
| Age Bracket | Male | Female |
| Under 5 Years | 169 (9.7%) | 189 (10.2%) |
| 5 to 9 Years | 119 (6.8%) | 155 (8.4%) |
| 10 to 14 Years | 127 (7.3%) | 124 (6.7%) |
| 15 to 19 Years | 138 (7.9%) | 145 (7.9%) |
| 20 to 24 Years | 285 (16.4%) | 162 (8.8%) |
| 25 to 29 Years | 178 (10.2%) | 391 (21.2%) |
| 30 to 34 Years | 116 (6.7%) | 113 (6.1%) |
| 35 to 39 Years | 125 (7.2%) | 74 (4.0%) |
| 40 to 44 Years | 109 (6.3%) | 88 (4.8%) |
| 45 to 49 Years | 4 (0.2%) | 34 (1.8%) |
| 50 to 54 Years | 54 (3.1%) | 70 (3.8%) |
| 55 to 59 Years | 97 (5.6%) | 82 (4.4%) |
| 60 to 64 Years | 22 (1.3%) | 52 (2.8%) |
| 65 to 69 Years | 102 (5.9%) | 78 (4.2%) |
| 70 to 74 Years | 84 (4.8%) | 29 (1.6%) |
| 75 to 79 Years | 7 (0.4%) | 12 (0.6%) |
| 80 to 84 Years | 0 (0.0%) | 24 (1.3%) |
| 85 Years and over | 6 (0.3%) | 23 (1.3%) |
| Total | 1,742 (100.0%) | 1,845 (100.0%) |
Families and Households in Park Hill
Median Family Size in Park Hill
The median family size in Park Hill is 3.60 persons per family, with single female/mother families (264 | 31.6%) accounting for the largest median family size of 4.16 persons per family. On the other hand, single male/father families (125 | 15.0%) represent the smallest median family size with 3.00 persons per family.
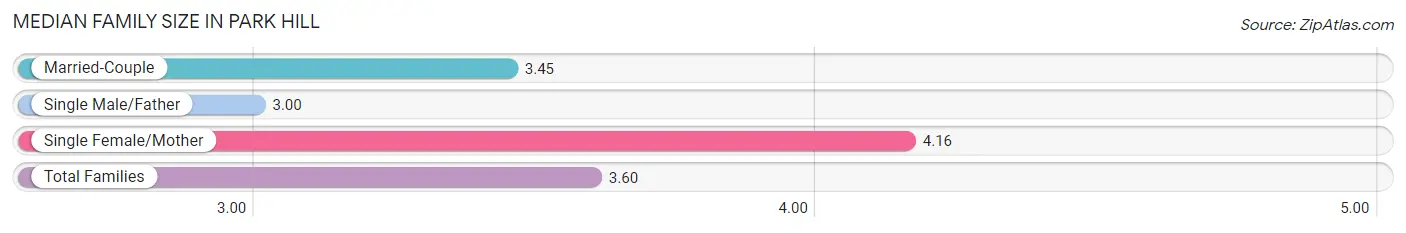
| Family Type | # Families | Family Size |
| Married-Couple | 446 (53.4%) | 3.45 |
| Single Male/Father | 125 (15.0%) | 3.00 |
| Single Female/Mother | 264 (31.6%) | 4.16 |
| Total Families | 835 (100.0%) | 3.60 |
Median Household Size in Park Hill
The median household size in Park Hill is 3.22 persons per household, with single female/mother households (264 | 24.9%) accounting for the largest median household size of 4.26 persons per household. non-family households (227 | 21.4%) represent the smallest median household size with 1.15 persons per household.
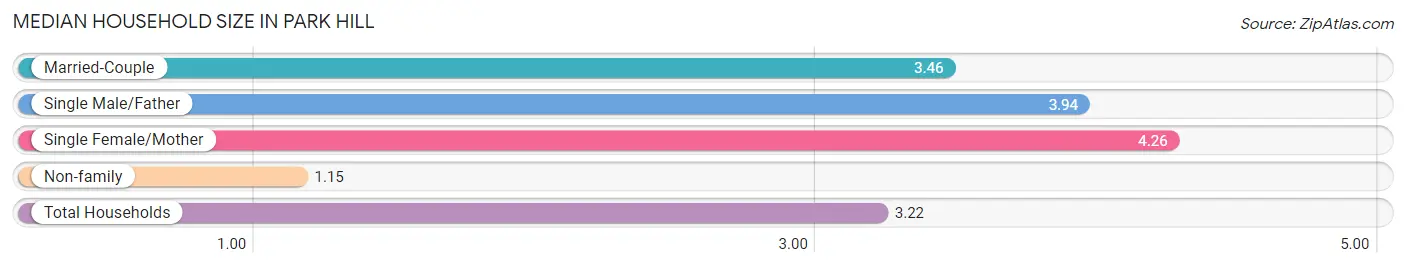
| Household Type | # Households | Household Size |
| Married-Couple | 446 (42.0%) | 3.46 |
| Single Male/Father | 125 (11.8%) | 3.94 |
| Single Female/Mother | 264 (24.9%) | 4.26 |
| Non-family | 227 (21.4%) | 1.15 |
| Total Households | 1,062 (100.0%) | 3.22 |
Household Size by Marriage Status in Park Hill
Out of a total of 1,062 households in Park Hill, 835 (78.6%) are family households, while 227 (21.4%) are nonfamily households. The most numerous type of family households are 2-person households, comprising 269, and the most common type of nonfamily households are 1-person households, comprising 193.
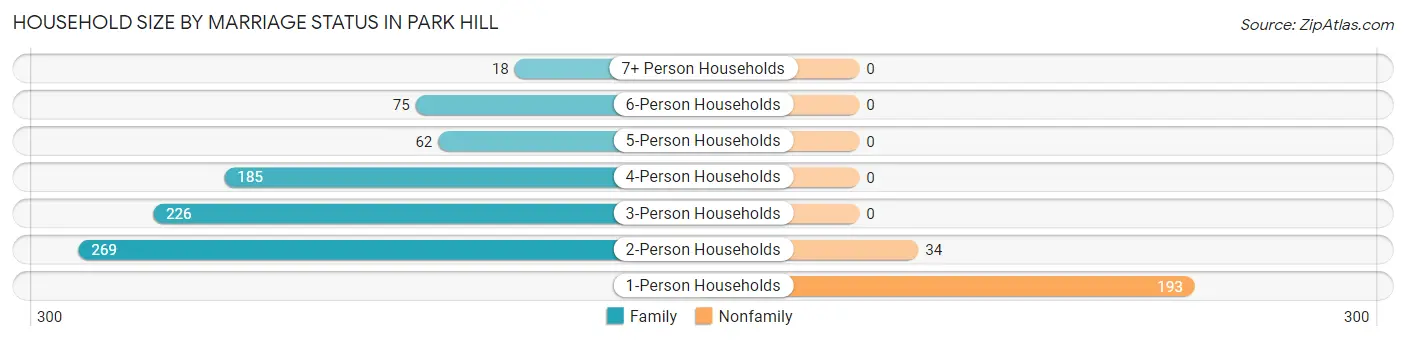
| Household Size | Family Households | Nonfamily Households |
| 1-Person Households | - | 193 (18.2%) |
| 2-Person Households | 269 (25.3%) | 34 (3.2%) |
| 3-Person Households | 226 (21.3%) | 0 (0.0%) |
| 4-Person Households | 185 (17.4%) | 0 (0.0%) |
| 5-Person Households | 62 (5.8%) | 0 (0.0%) |
| 6-Person Households | 75 (7.1%) | 0 (0.0%) |
| 7+ Person Households | 18 (1.7%) | 0 (0.0%) |
| Total | 835 (78.6%) | 227 (21.4%) |
Female Fertility in Park Hill
Fertility by Age in Park Hill
Average fertility rate in Park Hill is 122.0 births per 1,000 women. Women in the age bracket of 20 to 34 years have the highest fertility rate with 146.0 births per 1,000 women. Women in the age bracket of 20 to 34 years acount for 75.8% of all women with births.
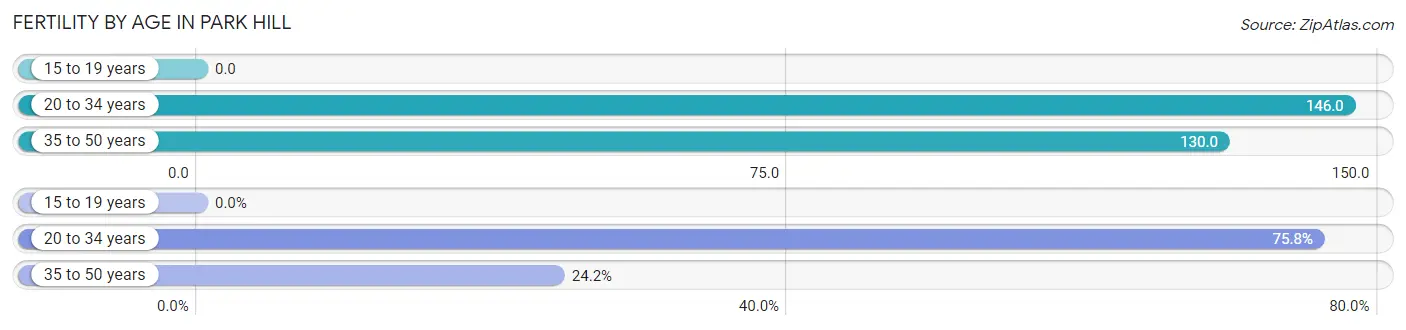
| Age Bracket | Women with Births | Births / 1,000 Women |
| 15 to 19 years | 0 (0.0%) | 0.0 |
| 20 to 34 years | 97 (75.8%) | 146.0 |
| 35 to 50 years | 31 (24.2%) | 130.0 |
| Total | 128 (100.0%) | 122.0 |
Fertility by Age by Marriage Status in Park Hill
28.9% of women with births (128) in Park Hill are married. The highest percentage of unmarried women with births falls into 20 to 34 years age bracket with 93.8% of them unmarried at the time of birth, while the lowest percentage of unmarried women with births belong to 35 to 50 years age bracket with 0.0% of them unmarried.
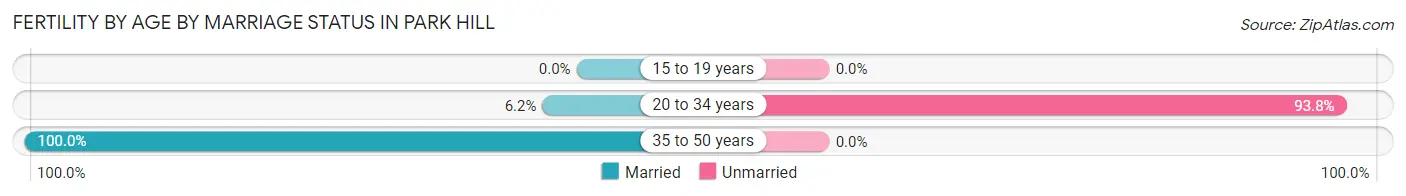
| Age Bracket | Married | Unmarried |
| 15 to 19 years | 0 (0.0%) | 0 (0.0%) |
| 20 to 34 years | 6 (6.2%) | 91 (93.8%) |
| 35 to 50 years | 31 (100.0%) | 0 (0.0%) |
| Total | 37 (28.9%) | 91 (71.1%) |
Fertility by Education in Park Hill
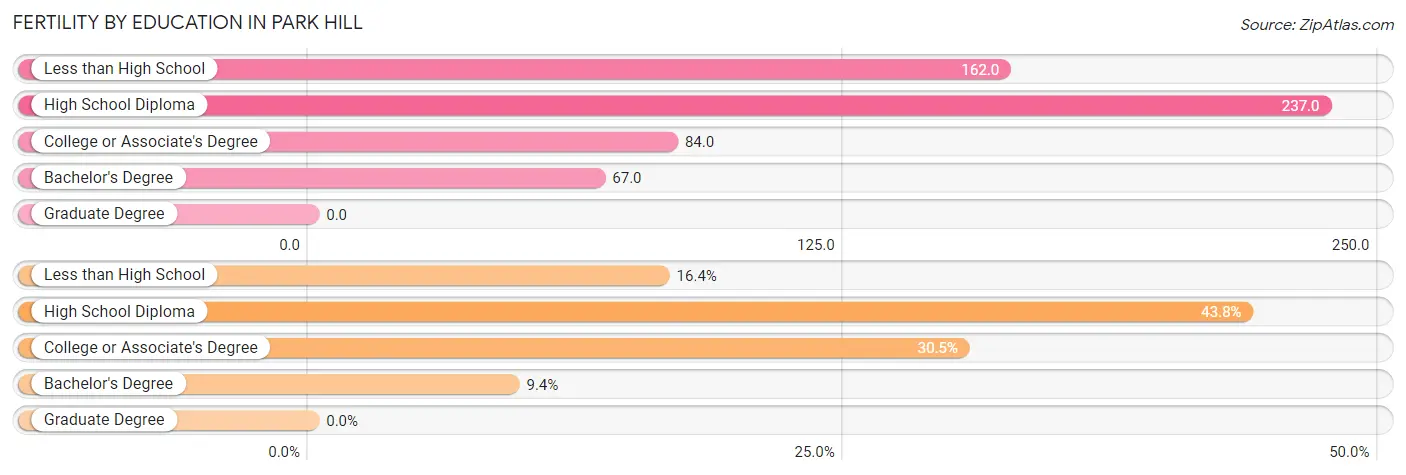
| Educational Attainment | Women with Births | Births / 1,000 Women |
| Less than High School | 21 (16.4%) | 162.0 |
| High School Diploma | 56 (43.8%) | 237.0 |
| College or Associate's Degree | 39 (30.5%) | 84.0 |
| Bachelor's Degree | 12 (9.4%) | 67.0 |
| Graduate Degree | 0 (0.0%) | 0.0 |
| Total | 128 (100.0%) | 122.0 |
Fertility by Education by Marriage Status in Park Hill
71.1% of women with births in Park Hill are unmarried. Women with the educational attainment of bachelor's degree are most likely to be married with 100.0% of them married at childbirth, while women with the educational attainment of less than high school are least likely to be married with 100.0% of them unmarried at childbirth.
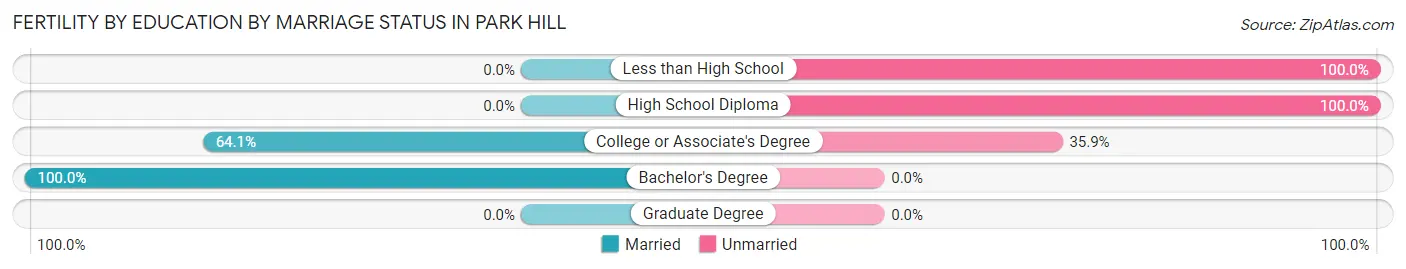
| Educational Attainment | Married | Unmarried |
| Less than High School | 0 (0.0%) | 21 (100.0%) |
| High School Diploma | 0 (0.0%) | 56 (100.0%) |
| College or Associate's Degree | 25 (64.1%) | 14 (35.9%) |
| Bachelor's Degree | 12 (100.0%) | 0 (0.0%) |
| Graduate Degree | 0 (0.0%) | 0 (0.0%) |
| Total | 37 (28.9%) | 91 (71.1%) |
Employment Characteristics in Park Hill
Employment by Class of Employer in Park Hill
Among the 1,565 employed individuals in Park Hill, private company employees (1,003 | 64.1%), not-for-profit organizations (296 | 18.9%), and state government employees (103 | 6.6%) make up the most common classes of employment.
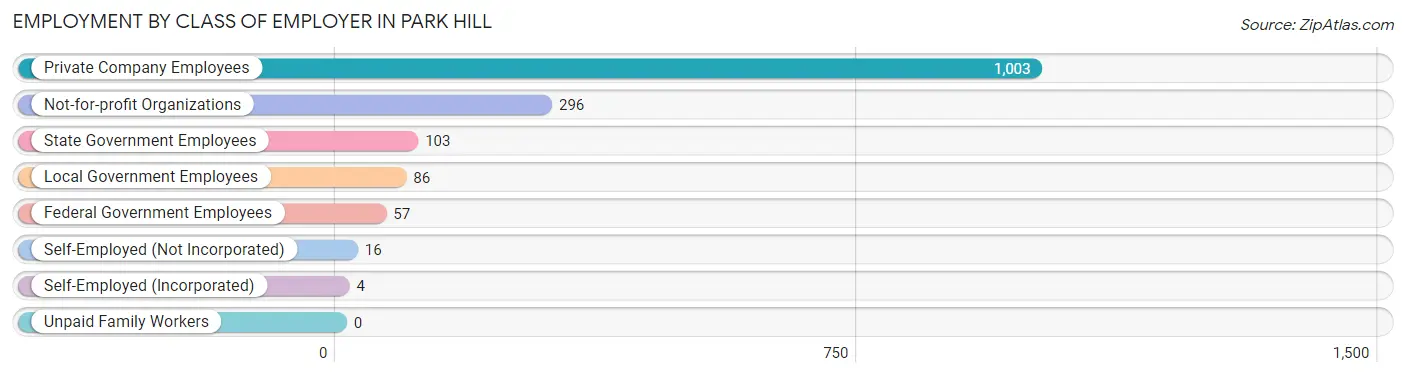
| Employer Class | # Employees | % Employees |
| Private Company Employees | 1,003 | 64.1% |
| Self-Employed (Incorporated) | 4 | 0.3% |
| Self-Employed (Not Incorporated) | 16 | 1.0% |
| Not-for-profit Organizations | 296 | 18.9% |
| Local Government Employees | 86 | 5.5% |
| State Government Employees | 103 | 6.6% |
| Federal Government Employees | 57 | 3.6% |
| Unpaid Family Workers | 0 | 0.0% |
| Total | 1,565 | 100.0% |
Employment Status by Age in Park Hill
According to the labor force statistics for Park Hill, out of the total population over 16 years of age (2,673), 61.5% or 1,644 individuals are in the labor force, with 3.7% or 61 of them unemployed. The age group with the highest labor force participation rate is 25 to 29 years, with 88.2% or 502 individuals in the labor force. Within the labor force, the 16 to 19 years age range has the highest percentage of unemployed individuals, with 23.9% or 21 of them being unemployed.
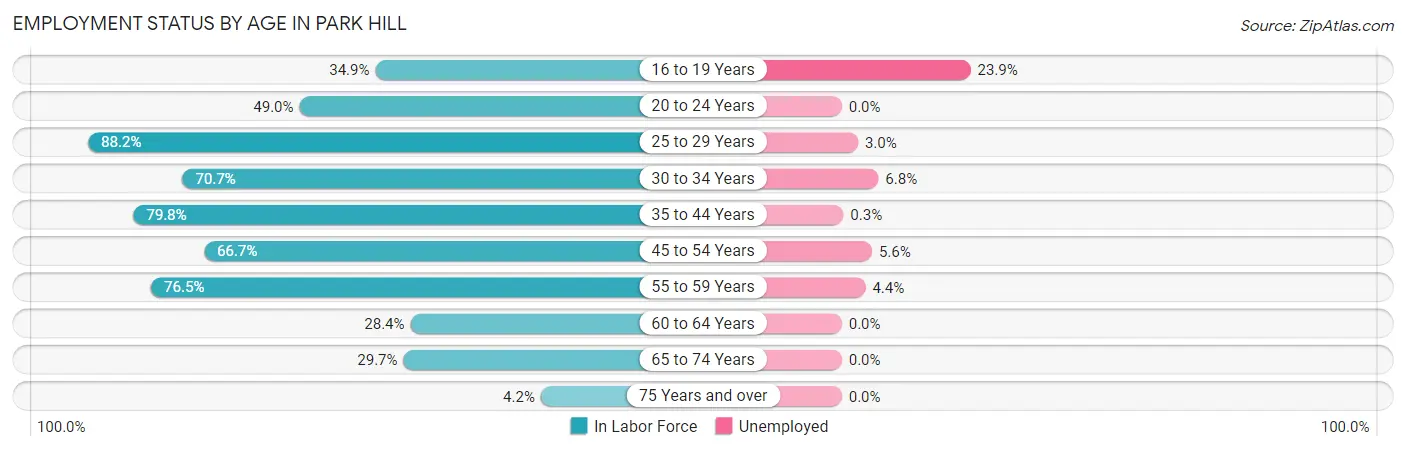
| Age Bracket | In Labor Force | Unemployed |
| 16 to 19 Years | 88 (34.9%) | 21 (23.9%) |
| 20 to 24 Years | 219 (49.0%) | 0 (0.0%) |
| 25 to 29 Years | 502 (88.2%) | 15 (3.0%) |
| 30 to 34 Years | 162 (70.7%) | 11 (6.8%) |
| 35 to 44 Years | 316 (79.8%) | 1 (0.3%) |
| 45 to 54 Years | 108 (66.7%) | 6 (5.6%) |
| 55 to 59 Years | 137 (76.5%) | 6 (4.4%) |
| 60 to 64 Years | 21 (28.4%) | 0 (0.0%) |
| 65 to 74 Years | 87 (29.7%) | 0 (0.0%) |
| 75 Years and over | 3 (4.2%) | 0 (0.0%) |
| Total | 1,644 (61.5%) | 61 (3.7%) |
Employment Status by Educational Attainment in Park Hill
According to labor force statistics for Park Hill, 77.4% of individuals (1,245) out of the total population between 25 and 64 years of age (1,609) are in the labor force, with 3.1% or 39 of them being unemployed. The group with the highest labor force participation rate are those with the educational attainment of less than high school, with 93.5% or 86 individuals in the labor force. Within the labor force, individuals with less than high school education have the highest percentage of unemployment, with 7.0% or 6 of them being unemployed.
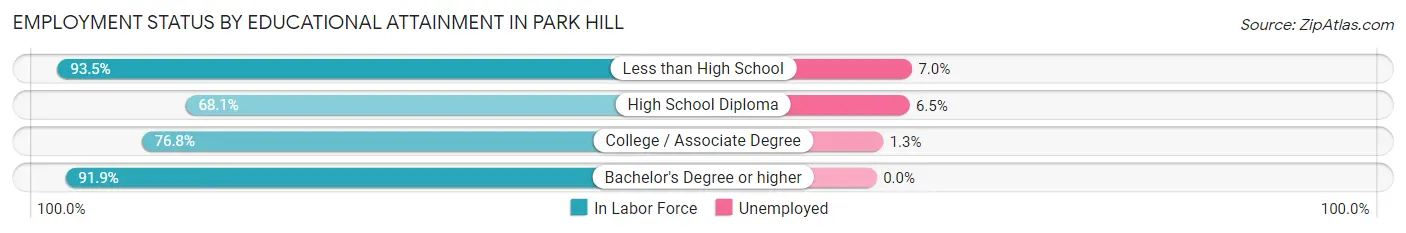
| Educational Attainment | In Labor Force | Unemployed |
| Less than High School | 86 (93.5%) | 6 (7.0%) |
| High School Diploma | 418 (68.1%) | 40 (6.5%) |
| College / Associate Degree | 447 (76.8%) | 8 (1.3%) |
| Bachelor's Degree or higher | 295 (91.9%) | 0 (0.0%) |
| Total | 1,245 (77.4%) | 50 (3.1%) |
Employment Occupations by Sex in Park Hill
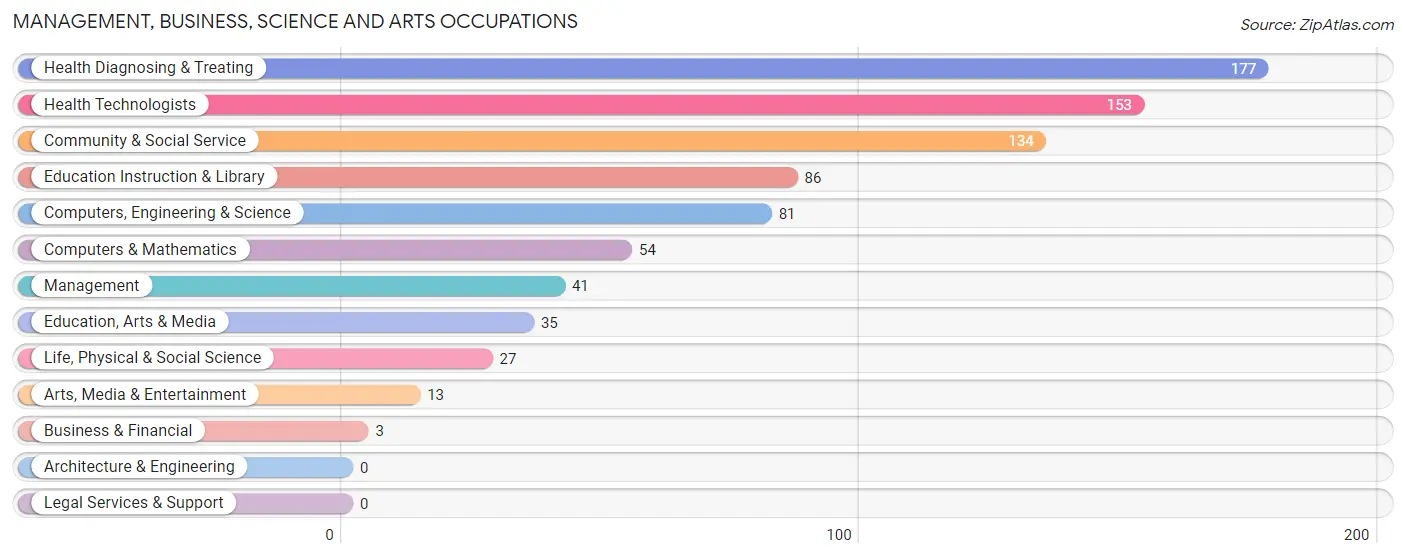
Management, Business, Science and Arts Occupations
The most common Management, Business, Science and Arts occupations in Park Hill are Health Diagnosing & Treating (177 | 11.2%), Health Technologists (153 | 9.7%), Community & Social Service (134 | 8.5%), Education Instruction & Library (86 | 5.4%), and Computers, Engineering & Science (81 | 5.1%).
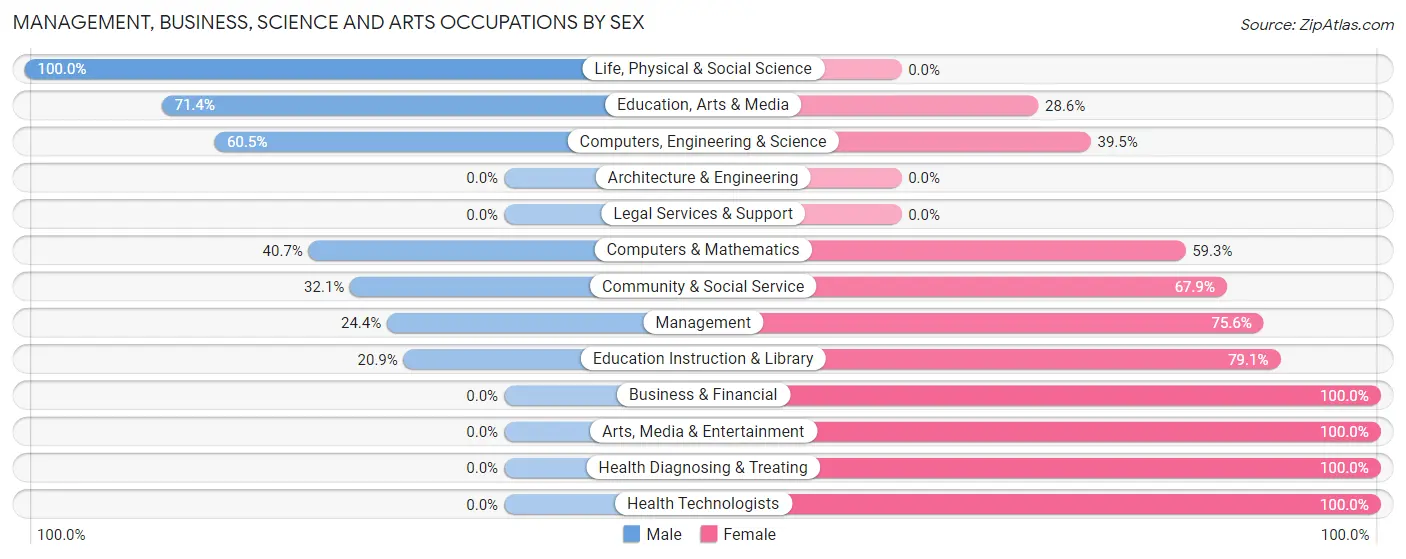
Management, Business, Science and Arts Occupations by Sex
Within the Management, Business, Science and Arts occupations in Park Hill, the most male-oriented occupations are Life, Physical & Social Science (100.0%), Education, Arts & Media (71.4%), and Computers, Engineering & Science (60.5%), while the most female-oriented occupations are Business & Financial (100.0%), Arts, Media & Entertainment (100.0%), and Health Diagnosing & Treating (100.0%).
| Occupation | Male | Female |
| Management | 10 (24.4%) | 31 (75.6%) |
| Business & Financial | 0 (0.0%) | 3 (100.0%) |
| Computers, Engineering & Science | 49 (60.5%) | 32 (39.5%) |
| Computers & Mathematics | 22 (40.7%) | 32 (59.3%) |
| Architecture & Engineering | 0 (0.0%) | 0 (0.0%) |
| Life, Physical & Social Science | 27 (100.0%) | 0 (0.0%) |
| Community & Social Service | 43 (32.1%) | 91 (67.9%) |
| Education, Arts & Media | 25 (71.4%) | 10 (28.6%) |
| Legal Services & Support | 0 (0.0%) | 0 (0.0%) |
| Education Instruction & Library | 18 (20.9%) | 68 (79.1%) |
| Arts, Media & Entertainment | 0 (0.0%) | 13 (100.0%) |
| Health Diagnosing & Treating | 0 (0.0%) | 177 (100.0%) |
| Health Technologists | 0 (0.0%) | 153 (100.0%) |
| Total (Category) | 102 (23.4%) | 334 (76.6%) |
| Total (Overall) | 753 (47.6%) | 830 (52.4%) |
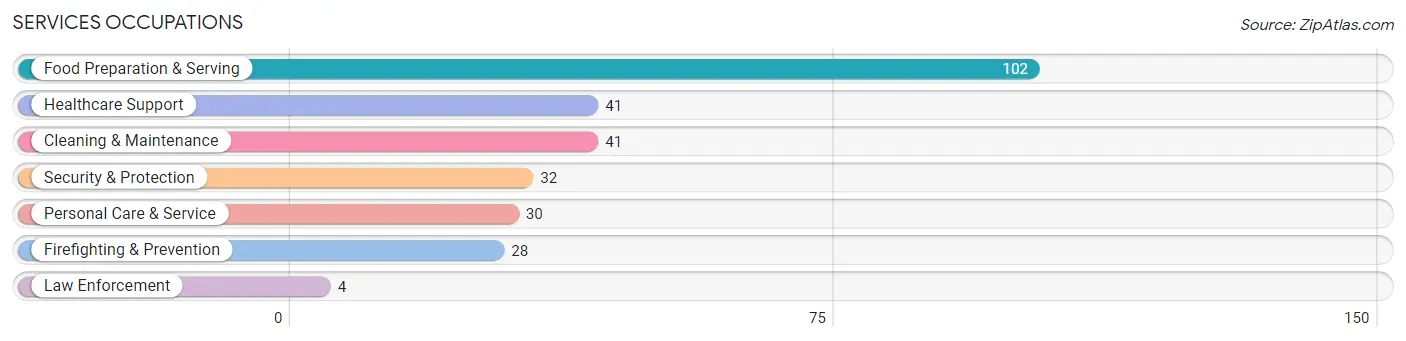
Services Occupations
The most common Services occupations in Park Hill are Food Preparation & Serving (102 | 6.4%), Healthcare Support (41 | 2.6%), Cleaning & Maintenance (41 | 2.6%), Security & Protection (32 | 2.0%), and Personal Care & Service (30 | 1.9%).
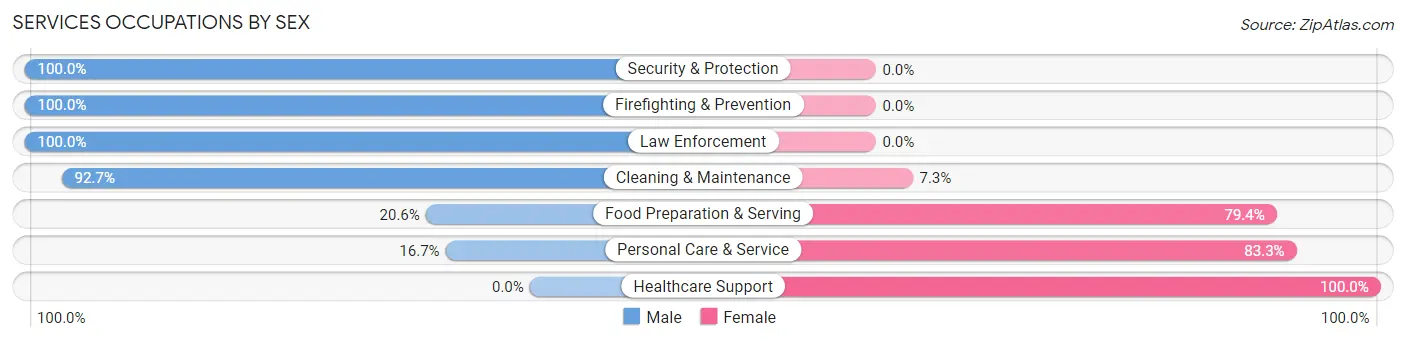
Services Occupations by Sex
Within the Services occupations in Park Hill, the most male-oriented occupations are Security & Protection (100.0%), Firefighting & Prevention (100.0%), and Law Enforcement (100.0%), while the most female-oriented occupations are Healthcare Support (100.0%), Personal Care & Service (83.3%), and Food Preparation & Serving (79.4%).
| Occupation | Male | Female |
| Healthcare Support | 0 (0.0%) | 41 (100.0%) |
| Security & Protection | 32 (100.0%) | 0 (0.0%) |
| Firefighting & Prevention | 28 (100.0%) | 0 (0.0%) |
| Law Enforcement | 4 (100.0%) | 0 (0.0%) |
| Food Preparation & Serving | 21 (20.6%) | 81 (79.4%) |
| Cleaning & Maintenance | 38 (92.7%) | 3 (7.3%) |
| Personal Care & Service | 5 (16.7%) | 25 (83.3%) |
| Total (Category) | 96 (39.0%) | 150 (61.0%) |
| Total (Overall) | 753 (47.6%) | 830 (52.4%) |
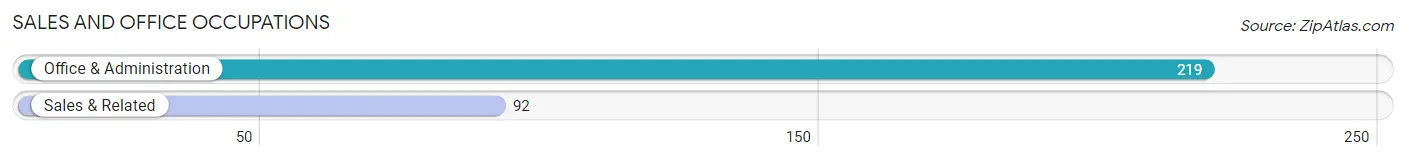
Sales and Office Occupations
The most common Sales and Office occupations in Park Hill are Office & Administration (219 | 13.8%), and Sales & Related (92 | 5.8%).
Sales and Office Occupations by Sex
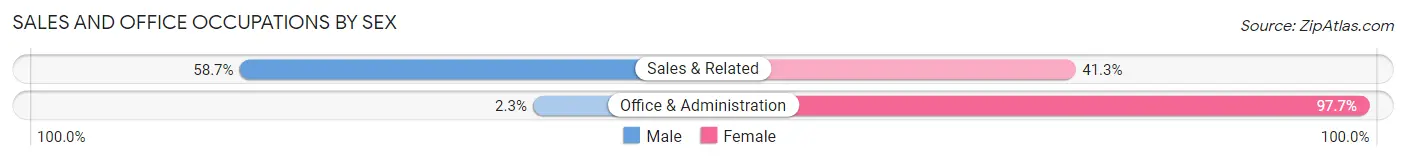
| Occupation | Male | Female |
| Sales & Related | 54 (58.7%) | 38 (41.3%) |
| Office & Administration | 5 (2.3%) | 214 (97.7%) |
| Total (Category) | 59 (19.0%) | 252 (81.0%) |
| Total (Overall) | 753 (47.6%) | 830 (52.4%) |
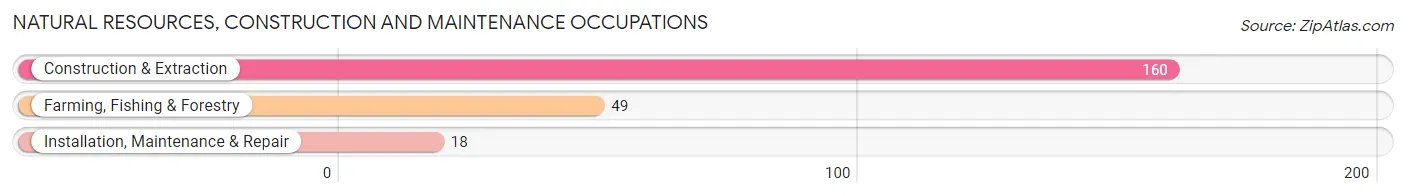
Natural Resources, Construction and Maintenance Occupations
The most common Natural Resources, Construction and Maintenance occupations in Park Hill are Construction & Extraction (160 | 10.1%), Farming, Fishing & Forestry (49 | 3.1%), and Installation, Maintenance & Repair (18 | 1.1%).
Natural Resources, Construction and Maintenance Occupations by Sex
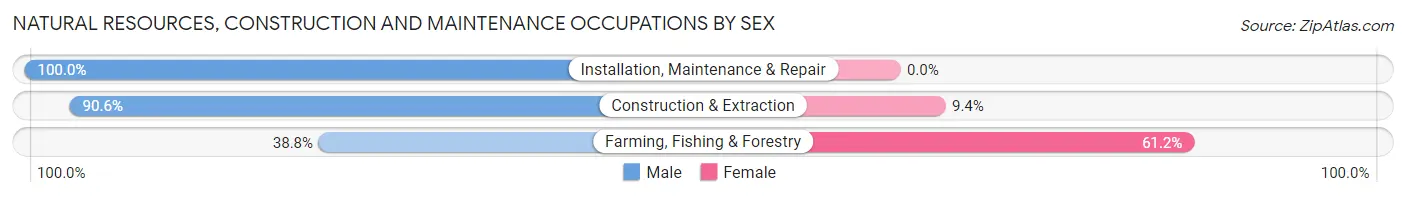
| Occupation | Male | Female |
| Farming, Fishing & Forestry | 19 (38.8%) | 30 (61.2%) |
| Construction & Extraction | 145 (90.6%) | 15 (9.4%) |
| Installation, Maintenance & Repair | 18 (100.0%) | 0 (0.0%) |
| Total (Category) | 182 (80.2%) | 45 (19.8%) |
| Total (Overall) | 753 (47.6%) | 830 (52.4%) |
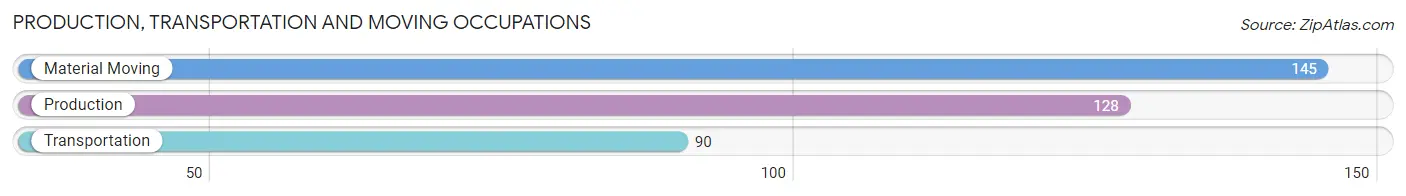
Production, Transportation and Moving Occupations
The most common Production, Transportation and Moving occupations in Park Hill are Material Moving (145 | 9.2%), Production (128 | 8.1%), and Transportation (90 | 5.7%).
Production, Transportation and Moving Occupations by Sex
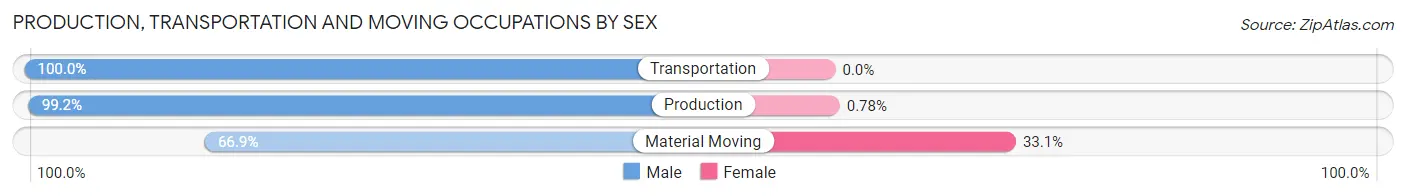
| Occupation | Male | Female |
| Production | 127 (99.2%) | 1 (0.8%) |
| Transportation | 90 (100.0%) | 0 (0.0%) |
| Material Moving | 97 (66.9%) | 48 (33.1%) |
| Total (Category) | 314 (86.5%) | 49 (13.5%) |
| Total (Overall) | 753 (47.6%) | 830 (52.4%) |
Employment Industries by Sex in Park Hill
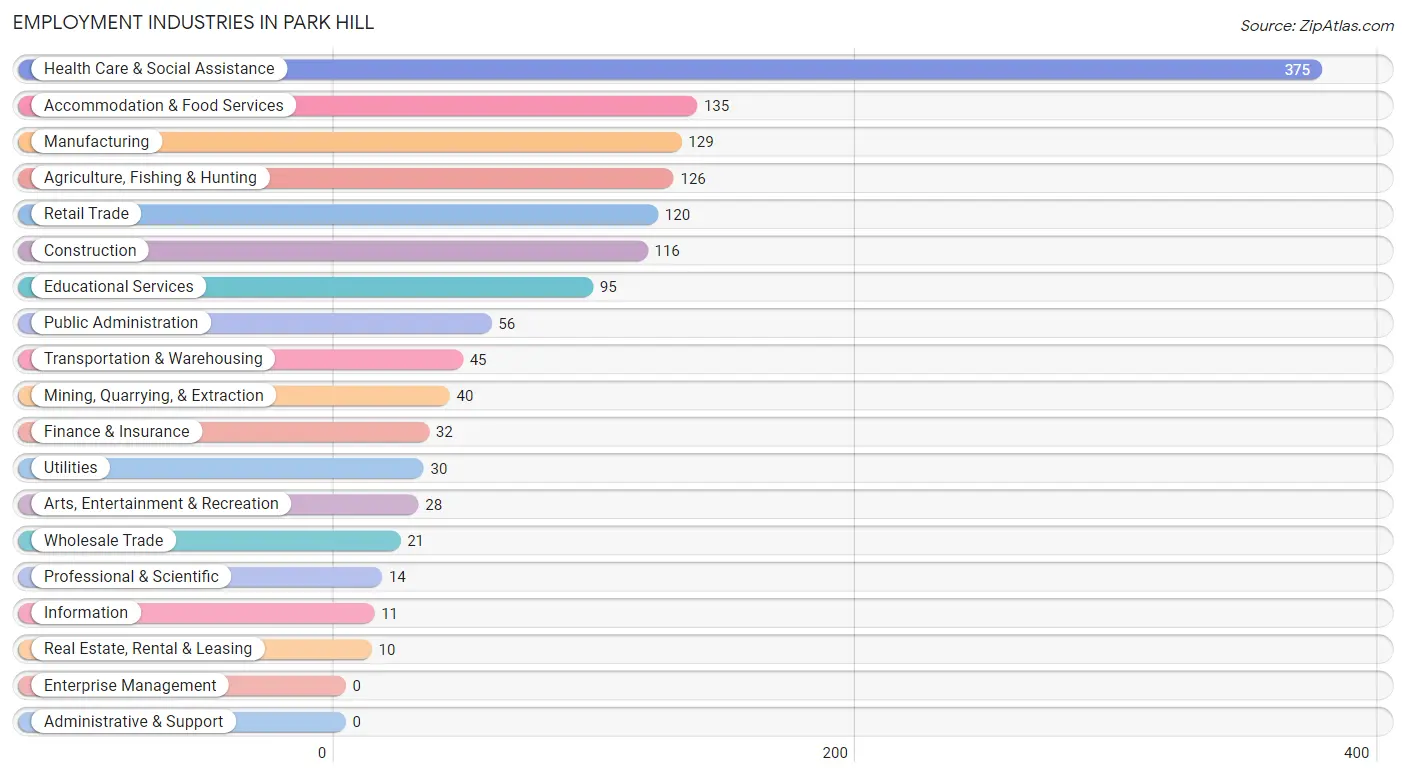
Employment Industries in Park Hill
The major employment industries in Park Hill include Health Care & Social Assistance (375 | 23.7%), Accommodation & Food Services (135 | 8.5%), Manufacturing (129 | 8.2%), Agriculture, Fishing & Hunting (126 | 8.0%), and Retail Trade (120 | 7.6%).
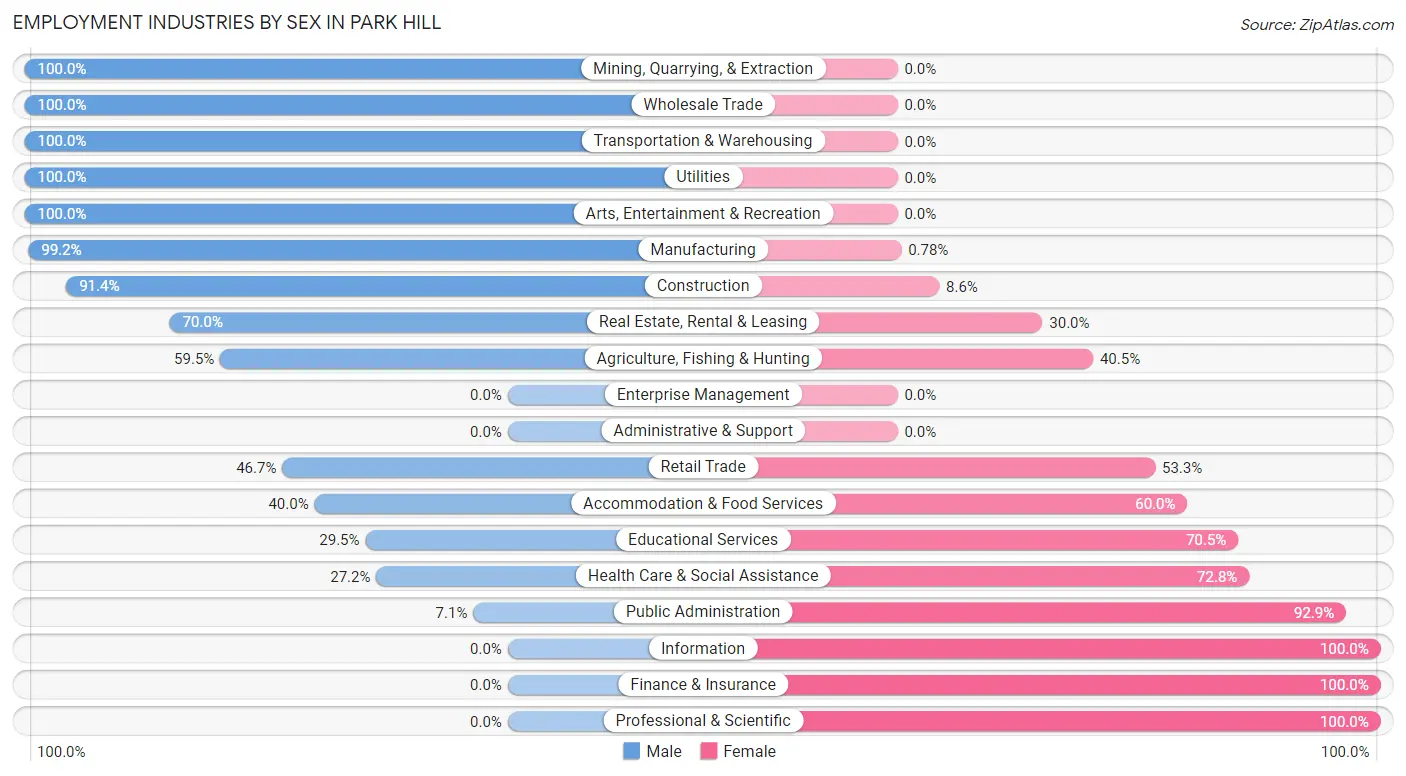
Employment Industries by Sex in Park Hill
The Park Hill industries that see more men than women are Mining, Quarrying, & Extraction (100.0%), Wholesale Trade (100.0%), and Transportation & Warehousing (100.0%), whereas the industries that tend to have a higher number of women are Information (100.0%), Finance & Insurance (100.0%), and Professional & Scientific (100.0%).
| Industry | Male | Female |
| Agriculture, Fishing & Hunting | 75 (59.5%) | 51 (40.5%) |
| Mining, Quarrying, & Extraction | 40 (100.0%) | 0 (0.0%) |
| Construction | 106 (91.4%) | 10 (8.6%) |
| Manufacturing | 128 (99.2%) | 1 (0.8%) |
| Wholesale Trade | 21 (100.0%) | 0 (0.0%) |
| Retail Trade | 56 (46.7%) | 64 (53.3%) |
| Transportation & Warehousing | 45 (100.0%) | 0 (0.0%) |
| Utilities | 30 (100.0%) | 0 (0.0%) |
| Information | 0 (0.0%) | 11 (100.0%) |
| Finance & Insurance | 0 (0.0%) | 32 (100.0%) |
| Real Estate, Rental & Leasing | 7 (70.0%) | 3 (30.0%) |
| Professional & Scientific | 0 (0.0%) | 14 (100.0%) |
| Enterprise Management | 0 (0.0%) | 0 (0.0%) |
| Administrative & Support | 0 (0.0%) | 0 (0.0%) |
| Educational Services | 28 (29.5%) | 67 (70.5%) |
| Health Care & Social Assistance | 102 (27.2%) | 273 (72.8%) |
| Arts, Entertainment & Recreation | 28 (100.0%) | 0 (0.0%) |
| Accommodation & Food Services | 54 (40.0%) | 81 (60.0%) |
| Public Administration | 4 (7.1%) | 52 (92.9%) |
| Total | 753 (47.6%) | 830 (52.4%) |
Education in Park Hill
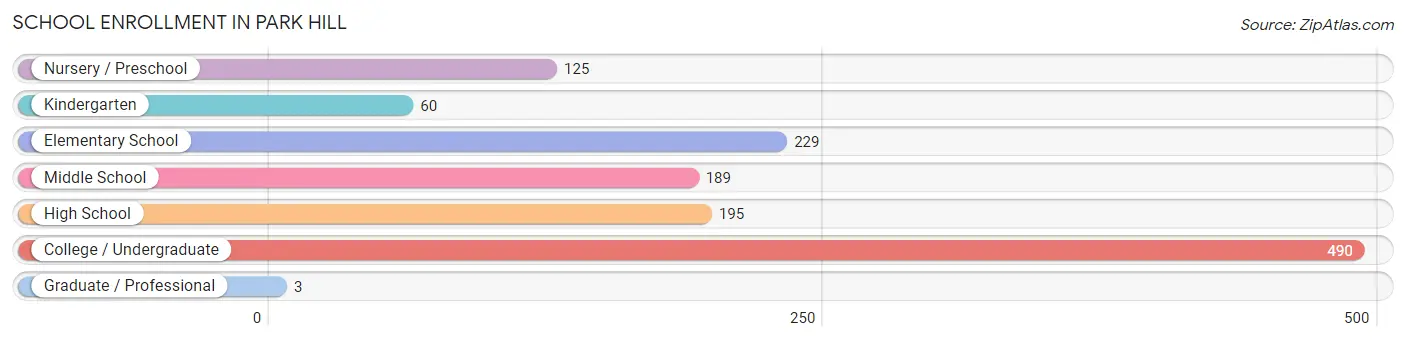
School Enrollment in Park Hill
The most common levels of schooling among the 1,291 students in Park Hill are college / undergraduate (490 | 38.0%), elementary school (229 | 17.7%), and high school (195 | 15.1%).
| School Level | # Students | % Students |
| Nursery / Preschool | 125 | 9.7% |
| Kindergarten | 60 | 4.6% |
| Elementary School | 229 | 17.7% |
| Middle School | 189 | 14.6% |
| High School | 195 | 15.1% |
| College / Undergraduate | 490 | 38.0% |
| Graduate / Professional | 3 | 0.2% |
| Total | 1,291 | 100.0% |
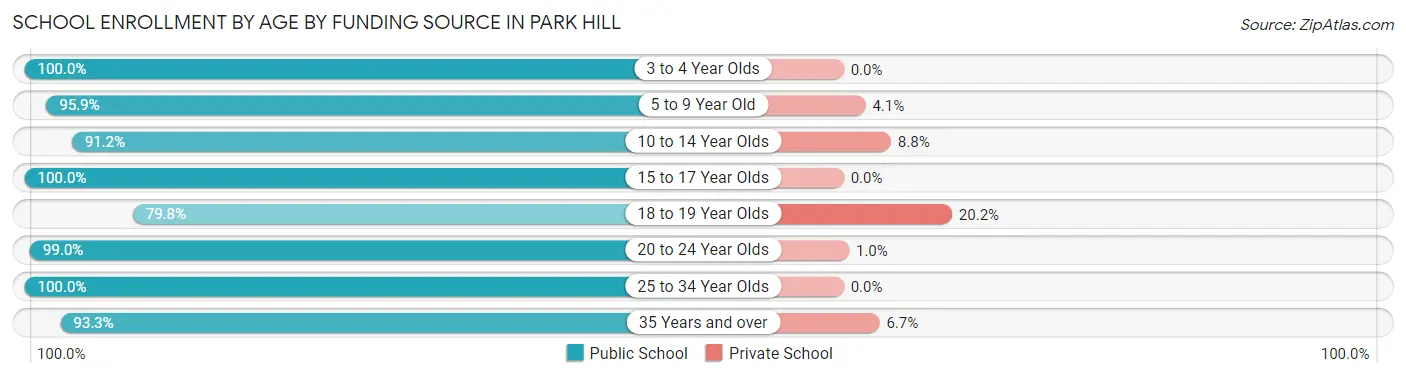
School Enrollment by Age by Funding Source in Park Hill
Out of a total of 1,291 students who are enrolled in schools in Park Hill, 66 (5.1%) attend a private institution, while the remaining 1,225 (94.9%) are enrolled in public schools. The age group of 18 to 19 year olds has the highest likelihood of being enrolled in private schools, with 26 (20.2% in the age bracket) enrolled. Conversely, the age group of 3 to 4 year olds has the lowest likelihood of being enrolled in a private school, with 119 (100.0% in the age bracket) attending a public institution.
| Age Bracket | Public School | Private School |
| 3 to 4 Year Olds | 119 (100.0%) | 0 (0.0%) |
| 5 to 9 Year Old | 260 (95.9%) | 11 (4.1%) |
| 10 to 14 Year Olds | 228 (91.2%) | 22 (8.8%) |
| 15 to 17 Year Olds | 95 (100.0%) | 0 (0.0%) |
| 18 to 19 Year Olds | 103 (79.8%) | 26 (20.2%) |
| 20 to 24 Year Olds | 199 (99.0%) | 2 (1.0%) |
| 25 to 34 Year Olds | 151 (100.0%) | 0 (0.0%) |
| 35 Years and over | 70 (93.3%) | 5 (6.7%) |
| Total | 1,225 (94.9%) | 66 (5.1%) |
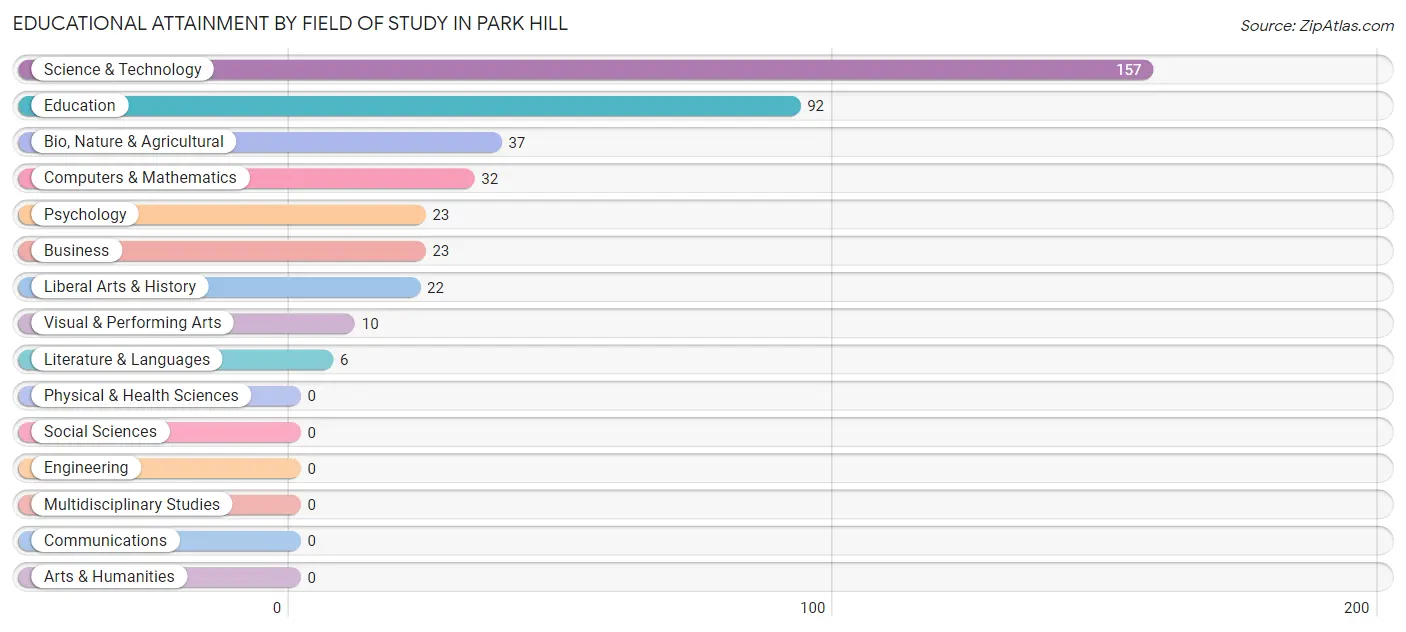
Educational Attainment by Field of Study in Park Hill
Science & technology (157 | 39.1%), education (92 | 22.9%), bio, nature & agricultural (37 | 9.2%), computers & mathematics (32 | 8.0%), and psychology (23 | 5.7%) are the most common fields of study among 402 individuals in Park Hill who have obtained a bachelor's degree or higher.
| Field of Study | # Graduates | % Graduates |
| Computers & Mathematics | 32 | 8.0% |
| Bio, Nature & Agricultural | 37 | 9.2% |
| Physical & Health Sciences | 0 | 0.0% |
| Psychology | 23 | 5.7% |
| Social Sciences | 0 | 0.0% |
| Engineering | 0 | 0.0% |
| Multidisciplinary Studies | 0 | 0.0% |
| Science & Technology | 157 | 39.1% |
| Business | 23 | 5.7% |
| Education | 92 | 22.9% |
| Literature & Languages | 6 | 1.5% |
| Liberal Arts & History | 22 | 5.5% |
| Visual & Performing Arts | 10 | 2.5% |
| Communications | 0 | 0.0% |
| Arts & Humanities | 0 | 0.0% |
| Total | 402 | 100.0% |
Transportation & Commute in Park Hill
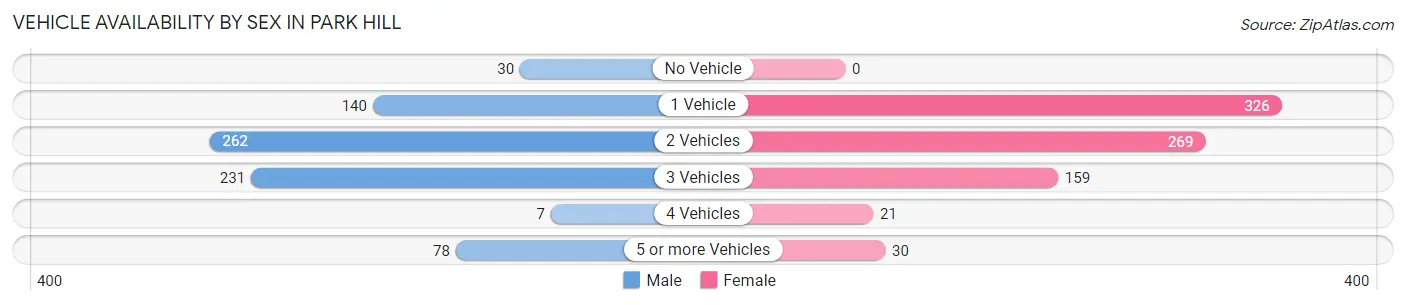
Vehicle Availability by Sex in Park Hill
The most prevalent vehicle ownership categories in Park Hill are males with 2 vehicles (262, accounting for 35.0%) and females with 2 vehicles (269, making up 32.6%).
| Vehicles Available | Male | Female |
| No Vehicle | 30 (4.0%) | 0 (0.0%) |
| 1 Vehicle | 140 (18.7%) | 326 (40.5%) |
| 2 Vehicles | 262 (35.0%) | 269 (33.4%) |
| 3 Vehicles | 231 (30.9%) | 159 (19.8%) |
| 4 Vehicles | 7 (0.9%) | 21 (2.6%) |
| 5 or more Vehicles | 78 (10.4%) | 30 (3.7%) |
| Total | 748 (100.0%) | 805 (100.0%) |
Commute Time in Park Hill
The most frequently occuring commute durations in Park Hill are 15 to 19 minutes (356 commuters, 25.6%), 10 to 14 minutes (260 commuters, 18.7%), and 5 to 9 minutes (254 commuters, 18.3%).
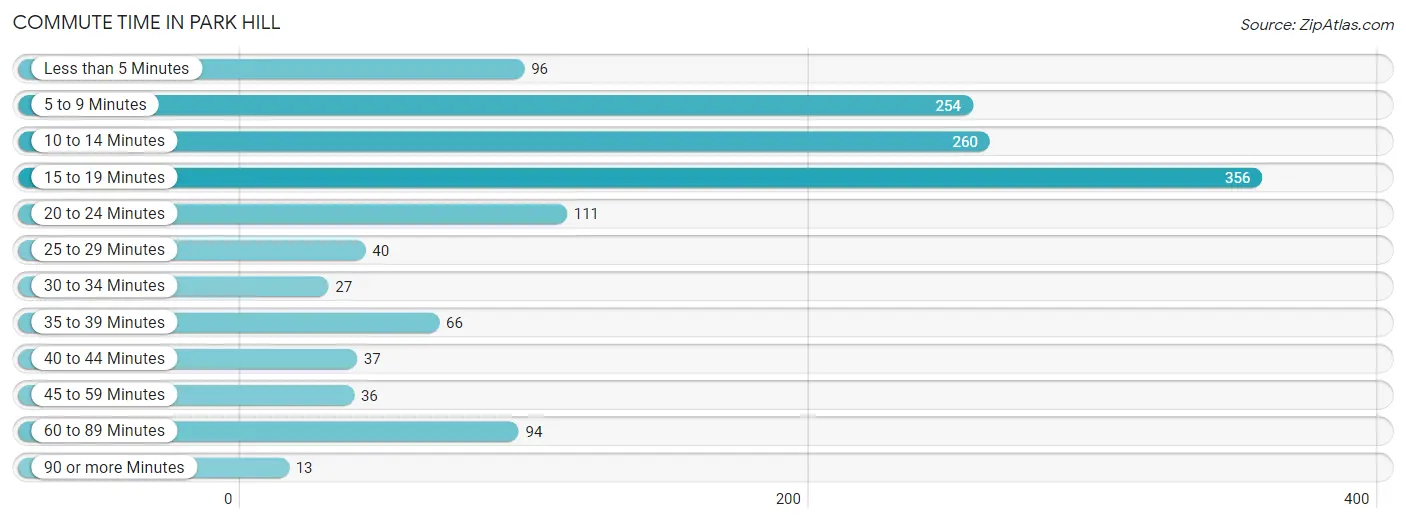
| Commute Time | # Commuters | % Commuters |
| Less than 5 Minutes | 96 | 6.9% |
| 5 to 9 Minutes | 254 | 18.3% |
| 10 to 14 Minutes | 260 | 18.7% |
| 15 to 19 Minutes | 356 | 25.6% |
| 20 to 24 Minutes | 111 | 8.0% |
| 25 to 29 Minutes | 40 | 2.9% |
| 30 to 34 Minutes | 27 | 1.9% |
| 35 to 39 Minutes | 66 | 4.8% |
| 40 to 44 Minutes | 37 | 2.7% |
| 45 to 59 Minutes | 36 | 2.6% |
| 60 to 89 Minutes | 94 | 6.8% |
| 90 or more Minutes | 13 | 0.9% |
Commute Time by Sex in Park Hill
The most common commute times in Park Hill are 5 to 9 minutes (136 commuters, 18.6%) for males and 15 to 19 minutes (268 commuters, 40.7%) for females.
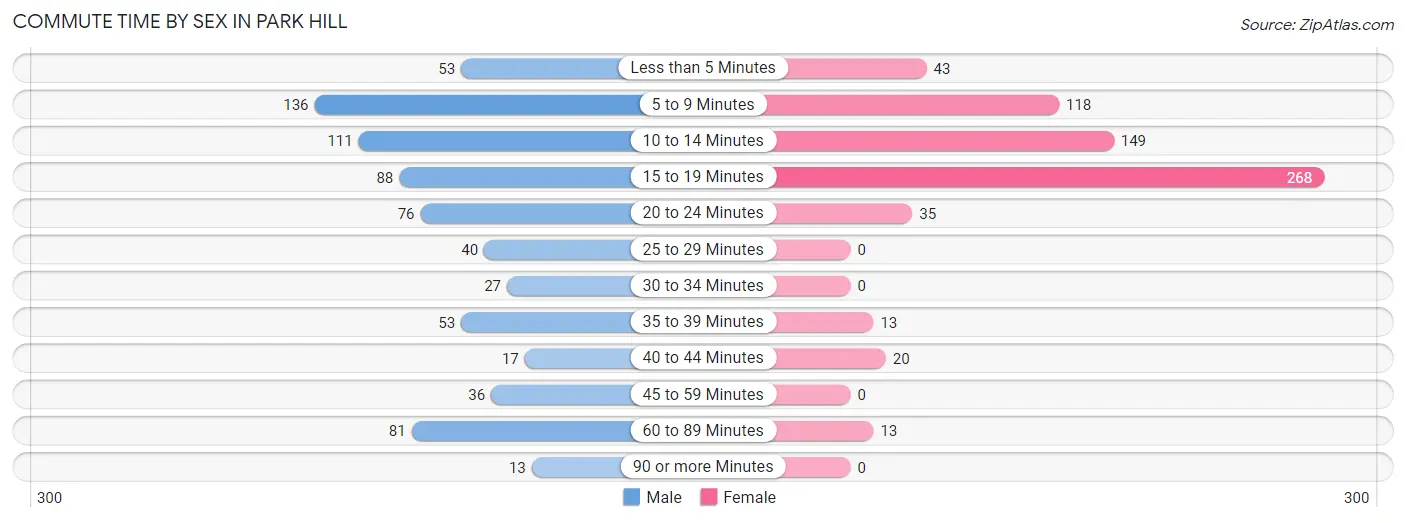
| Commute Time | Male | Female |
| Less than 5 Minutes | 53 (7.2%) | 43 (6.5%) |
| 5 to 9 Minutes | 136 (18.6%) | 118 (17.9%) |
| 10 to 14 Minutes | 111 (15.2%) | 149 (22.6%) |
| 15 to 19 Minutes | 88 (12.0%) | 268 (40.7%) |
| 20 to 24 Minutes | 76 (10.4%) | 35 (5.3%) |
| 25 to 29 Minutes | 40 (5.5%) | 0 (0.0%) |
| 30 to 34 Minutes | 27 (3.7%) | 0 (0.0%) |
| 35 to 39 Minutes | 53 (7.2%) | 13 (2.0%) |
| 40 to 44 Minutes | 17 (2.3%) | 20 (3.0%) |
| 45 to 59 Minutes | 36 (4.9%) | 0 (0.0%) |
| 60 to 89 Minutes | 81 (11.1%) | 13 (2.0%) |
| 90 or more Minutes | 13 (1.8%) | 0 (0.0%) |
Time of Departure to Work by Sex in Park Hill
The most frequent times of departure to work in Park Hill are 7:30 AM to 7:59 AM (148, 20.3%) for males and 6:30 AM to 6:59 AM (151, 22.9%) for females.
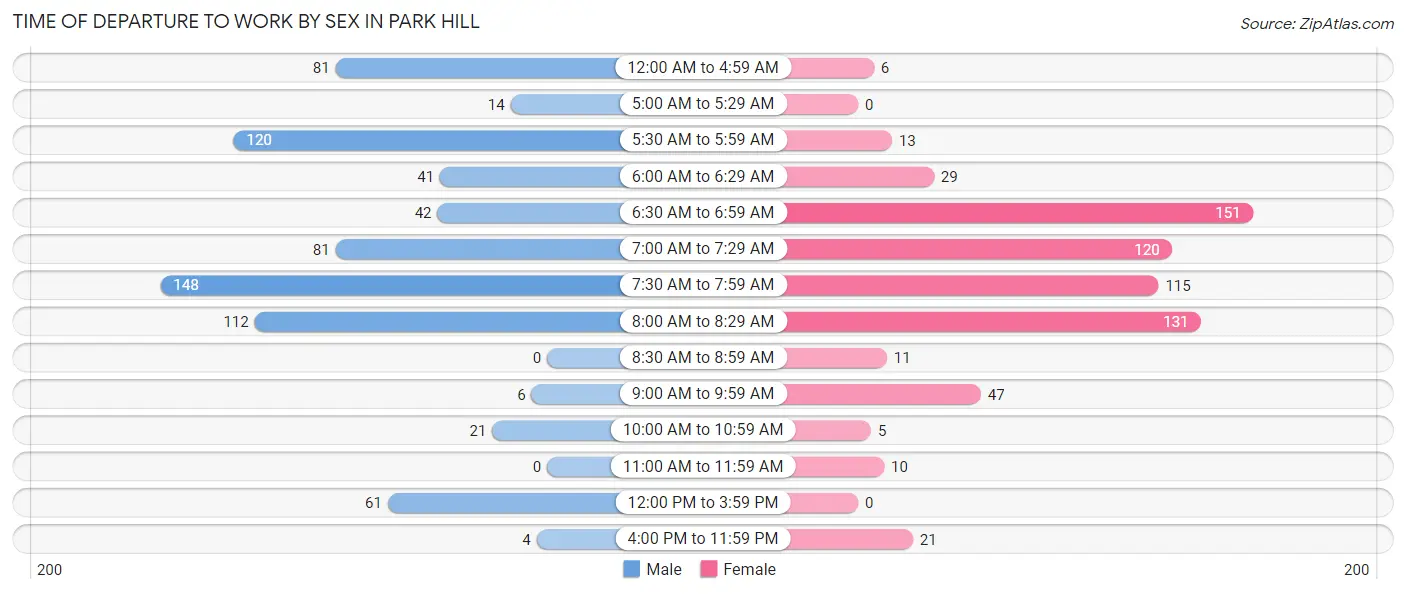
| Time of Departure | Male | Female |
| 12:00 AM to 4:59 AM | 81 (11.1%) | 6 (0.9%) |
| 5:00 AM to 5:29 AM | 14 (1.9%) | 0 (0.0%) |
| 5:30 AM to 5:59 AM | 120 (16.4%) | 13 (2.0%) |
| 6:00 AM to 6:29 AM | 41 (5.6%) | 29 (4.4%) |
| 6:30 AM to 6:59 AM | 42 (5.8%) | 151 (22.9%) |
| 7:00 AM to 7:29 AM | 81 (11.1%) | 120 (18.2%) |
| 7:30 AM to 7:59 AM | 148 (20.3%) | 115 (17.4%) |
| 8:00 AM to 8:29 AM | 112 (15.3%) | 131 (19.9%) |
| 8:30 AM to 8:59 AM | 0 (0.0%) | 11 (1.7%) |
| 9:00 AM to 9:59 AM | 6 (0.8%) | 47 (7.1%) |
| 10:00 AM to 10:59 AM | 21 (2.9%) | 5 (0.8%) |
| 11:00 AM to 11:59 AM | 0 (0.0%) | 10 (1.5%) |
| 12:00 PM to 3:59 PM | 61 (8.3%) | 0 (0.0%) |
| 4:00 PM to 11:59 PM | 4 (0.5%) | 21 (3.2%) |
| Total | 731 (100.0%) | 659 (100.0%) |
Housing Occupancy in Park Hill
Occupancy by Ownership in Park Hill
Of the total 1,062 dwellings in Park Hill, owner-occupied units account for 671 (63.2%), while renter-occupied units make up 391 (36.8%).
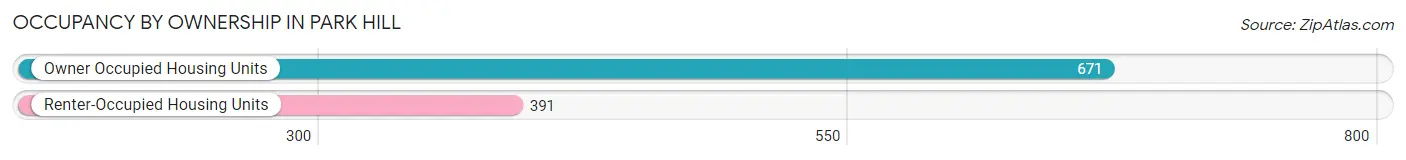
| Occupancy | # Housing Units | % Housing Units |
| Owner Occupied Housing Units | 671 | 63.2% |
| Renter-Occupied Housing Units | 391 | 36.8% |
| Total Occupied Housing Units | 1,062 | 100.0% |
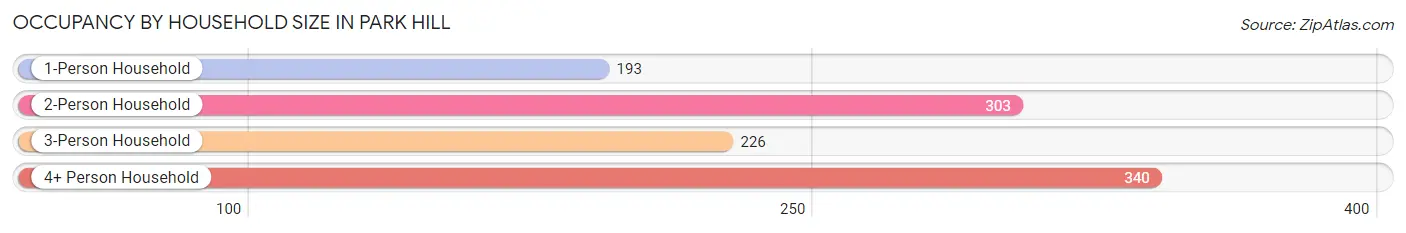
Occupancy by Household Size in Park Hill
| Household Size | # Housing Units | % Housing Units |
| 1-Person Household | 193 | 18.2% |
| 2-Person Household | 303 | 28.5% |
| 3-Person Household | 226 | 21.3% |
| 4+ Person Household | 340 | 32.0% |
| Total Housing Units | 1,062 | 100.0% |
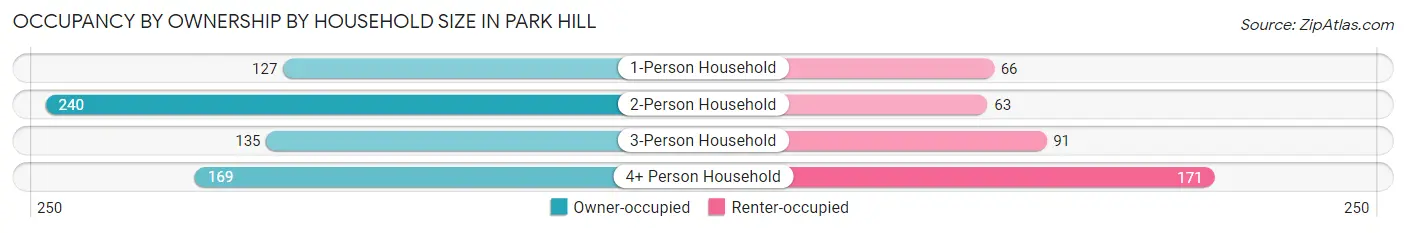
Occupancy by Ownership by Household Size in Park Hill
| Household Size | Owner-occupied | Renter-occupied |
| 1-Person Household | 127 (65.8%) | 66 (34.2%) |
| 2-Person Household | 240 (79.2%) | 63 (20.8%) |
| 3-Person Household | 135 (59.7%) | 91 (40.3%) |
| 4+ Person Household | 169 (49.7%) | 171 (50.3%) |
| Total Housing Units | 671 (63.2%) | 391 (36.8%) |
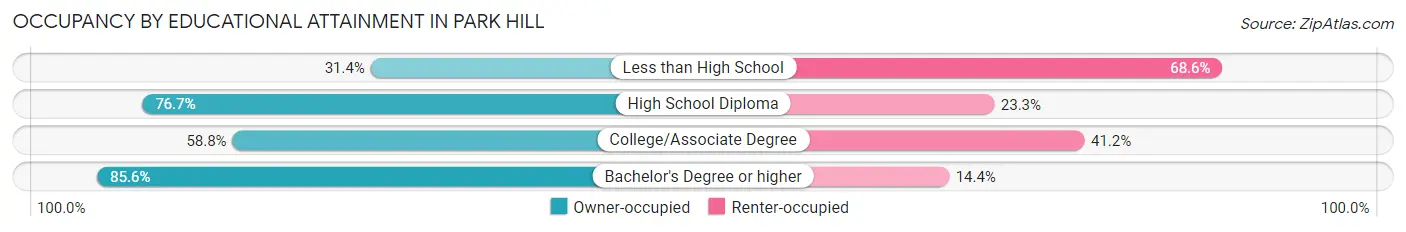
Occupancy by Educational Attainment in Park Hill
| Household Size | Owner-occupied | Renter-occupied |
| Less than High School | 59 (31.4%) | 129 (68.6%) |
| High School Diploma | 253 (76.7%) | 77 (23.3%) |
| College/Associate Degree | 234 (58.8%) | 164 (41.2%) |
| Bachelor's Degree or higher | 125 (85.6%) | 21 (14.4%) |
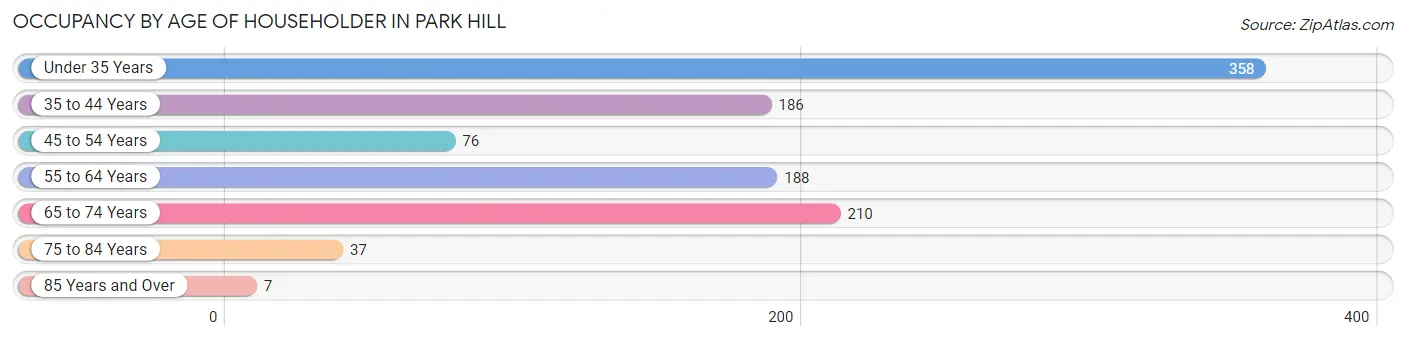
Occupancy by Age of Householder in Park Hill
| Age Bracket | # Households | % Households |
| Under 35 Years | 358 | 33.7% |
| 35 to 44 Years | 186 | 17.5% |
| 45 to 54 Years | 76 | 7.2% |
| 55 to 64 Years | 188 | 17.7% |
| 65 to 74 Years | 210 | 19.8% |
| 75 to 84 Years | 37 | 3.5% |
| 85 Years and Over | 7 | 0.7% |
| Total | 1,062 | 100.0% |
Housing Finances in Park Hill
Median Income by Occupancy in Park Hill
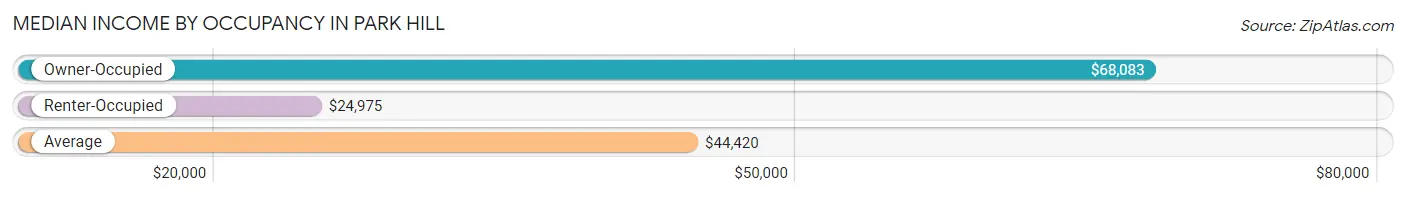
| Occupancy Type | # Households | Median Income |
| Owner-Occupied | 671 (63.2%) | $68,083 |
| Renter-Occupied | 391 (36.8%) | $24,975 |
| Average | 1,062 (100.0%) | $44,420 |
Occupancy by Householder Income Bracket in Park Hill
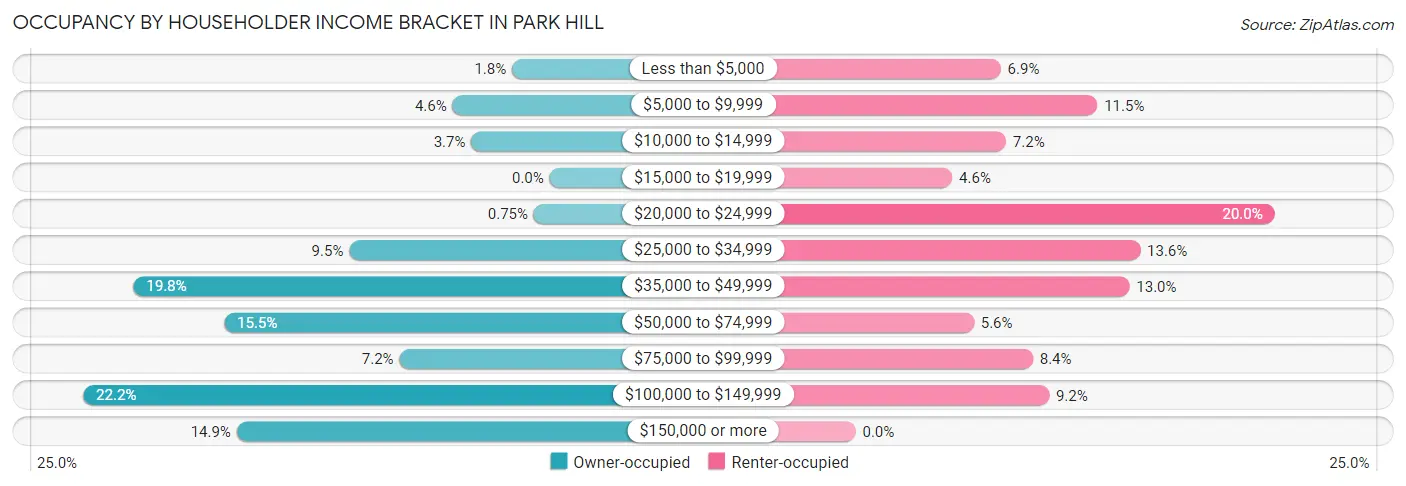
| Income Bracket | Owner-occupied | Renter-occupied |
| Less than $5,000 | 12 (1.8%) | 27 (6.9%) |
| $5,000 to $9,999 | 31 (4.6%) | 45 (11.5%) |
| $10,000 to $14,999 | 25 (3.7%) | 28 (7.2%) |
| $15,000 to $19,999 | 0 (0.0%) | 18 (4.6%) |
| $20,000 to $24,999 | 5 (0.7%) | 78 (20.0%) |
| $25,000 to $34,999 | 64 (9.5%) | 53 (13.6%) |
| $35,000 to $49,999 | 133 (19.8%) | 51 (13.0%) |
| $50,000 to $74,999 | 104 (15.5%) | 22 (5.6%) |
| $75,000 to $99,999 | 48 (7.1%) | 33 (8.4%) |
| $100,000 to $149,999 | 149 (22.2%) | 36 (9.2%) |
| $150,000 or more | 100 (14.9%) | 0 (0.0%) |
| Total | 671 (100.0%) | 391 (100.0%) |
Monthly Housing Cost Tiers in Park Hill
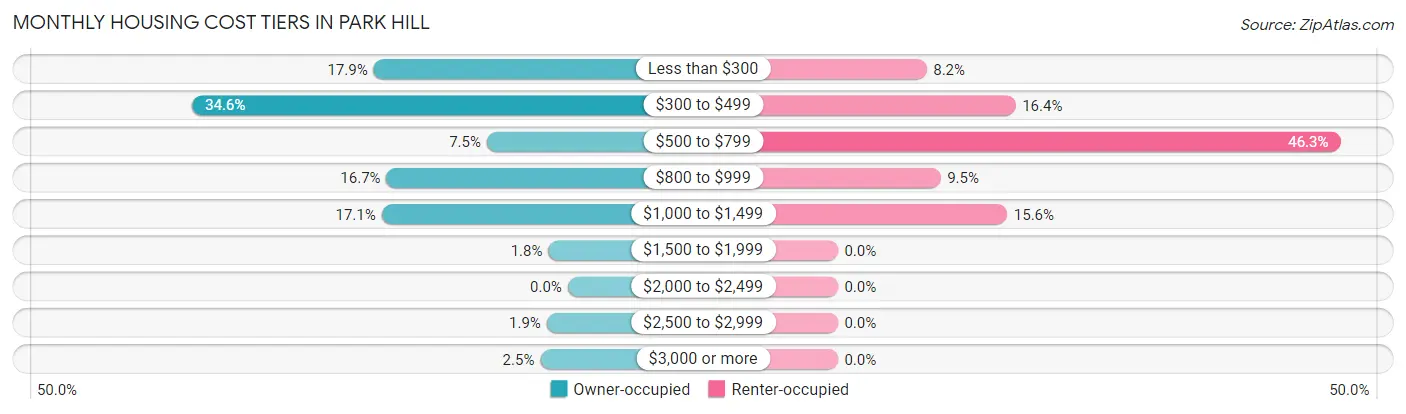
| Monthly Cost | Owner-occupied | Renter-occupied |
| Less than $300 | 120 (17.9%) | 32 (8.2%) |
| $300 to $499 | 232 (34.6%) | 64 (16.4%) |
| $500 to $799 | 50 (7.4%) | 181 (46.3%) |
| $800 to $999 | 112 (16.7%) | 37 (9.5%) |
| $1,000 to $1,499 | 115 (17.1%) | 61 (15.6%) |
| $1,500 to $1,999 | 12 (1.8%) | 0 (0.0%) |
| $2,000 to $2,499 | 0 (0.0%) | 0 (0.0%) |
| $2,500 to $2,999 | 13 (1.9%) | 0 (0.0%) |
| $3,000 or more | 17 (2.5%) | 0 (0.0%) |
| Total | 671 (100.0%) | 391 (100.0%) |
Physical Housing Characteristics in Park Hill
Housing Structures in Park Hill
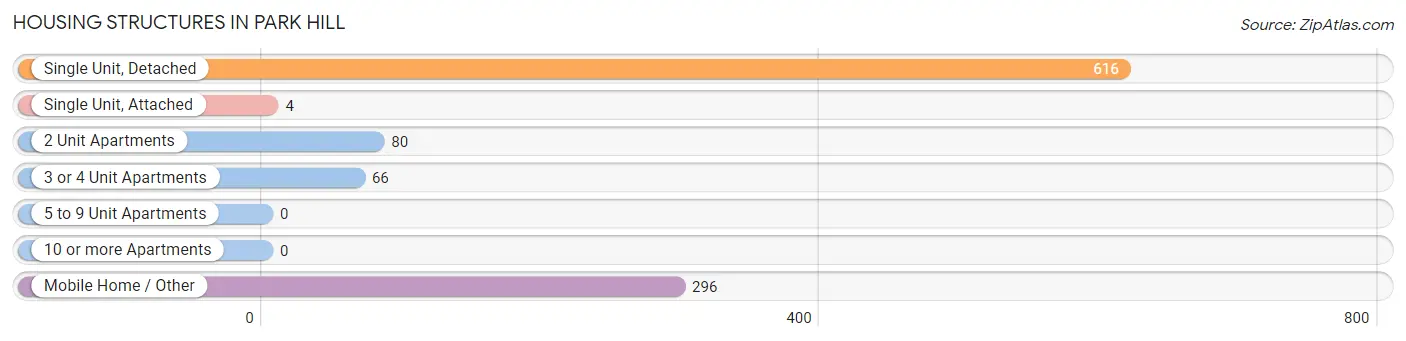
| Structure Type | # Housing Units | % Housing Units |
| Single Unit, Detached | 616 | 58.0% |
| Single Unit, Attached | 4 | 0.4% |
| 2 Unit Apartments | 80 | 7.5% |
| 3 or 4 Unit Apartments | 66 | 6.2% |
| 5 to 9 Unit Apartments | 0 | 0.0% |
| 10 or more Apartments | 0 | 0.0% |
| Mobile Home / Other | 296 | 27.9% |
| Total | 1,062 | 100.0% |
Housing Structures by Occupancy in Park Hill
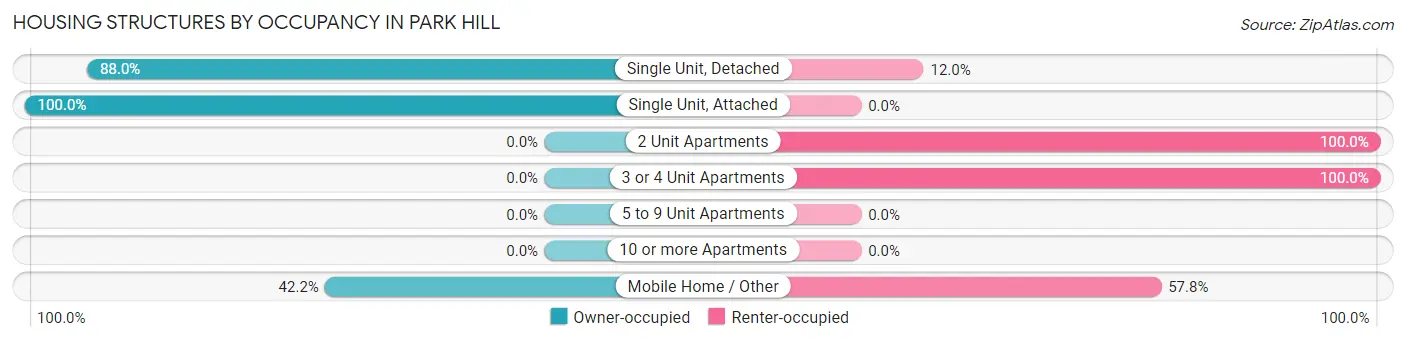
| Structure Type | Owner-occupied | Renter-occupied |
| Single Unit, Detached | 542 (88.0%) | 74 (12.0%) |
| Single Unit, Attached | 4 (100.0%) | 0 (0.0%) |
| 2 Unit Apartments | 0 (0.0%) | 80 (100.0%) |
| 3 or 4 Unit Apartments | 0 (0.0%) | 66 (100.0%) |
| 5 to 9 Unit Apartments | 0 (0.0%) | 0 (0.0%) |
| 10 or more Apartments | 0 (0.0%) | 0 (0.0%) |
| Mobile Home / Other | 125 (42.2%) | 171 (57.8%) |
| Total | 671 (63.2%) | 391 (36.8%) |
Housing Structures by Number of Rooms in Park Hill
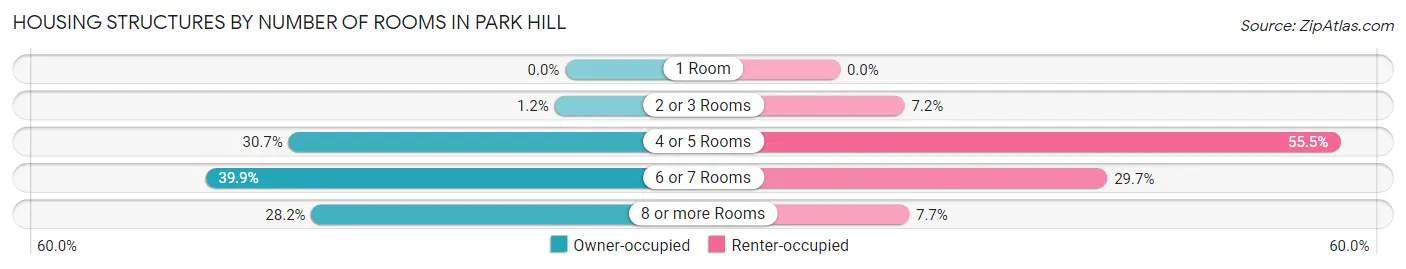
| Number of Rooms | Owner-occupied | Renter-occupied |
| 1 Room | 0 (0.0%) | 0 (0.0%) |
| 2 or 3 Rooms | 8 (1.2%) | 28 (7.2%) |
| 4 or 5 Rooms | 206 (30.7%) | 217 (55.5%) |
| 6 or 7 Rooms | 268 (39.9%) | 116 (29.7%) |
| 8 or more Rooms | 189 (28.2%) | 30 (7.7%) |
| Total | 671 (100.0%) | 391 (100.0%) |
Housing Structure by Heating Type in Park Hill
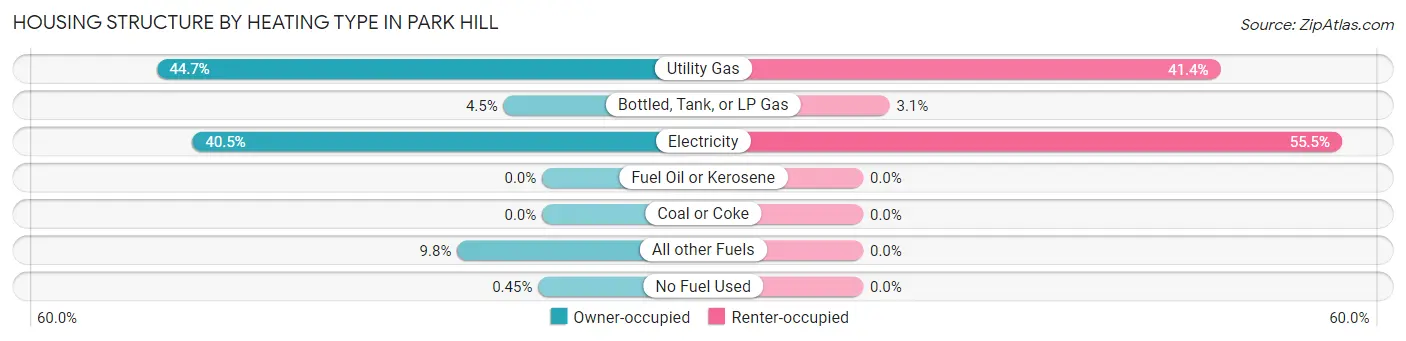
| Heating Type | Owner-occupied | Renter-occupied |
| Utility Gas | 300 (44.7%) | 162 (41.4%) |
| Bottled, Tank, or LP Gas | 30 (4.5%) | 12 (3.1%) |
| Electricity | 272 (40.5%) | 217 (55.5%) |
| Fuel Oil or Kerosene | 0 (0.0%) | 0 (0.0%) |
| Coal or Coke | 0 (0.0%) | 0 (0.0%) |
| All other Fuels | 66 (9.8%) | 0 (0.0%) |
| No Fuel Used | 3 (0.4%) | 0 (0.0%) |
| Total | 671 (100.0%) | 391 (100.0%) |
Household Vehicle Usage in Park Hill
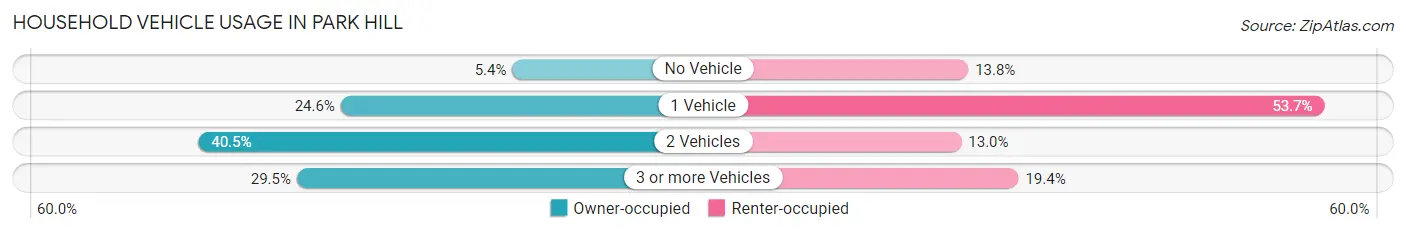
| Vehicles per Household | Owner-occupied | Renter-occupied |
| No Vehicle | 36 (5.4%) | 54 (13.8%) |
| 1 Vehicle | 165 (24.6%) | 210 (53.7%) |
| 2 Vehicles | 272 (40.5%) | 51 (13.0%) |
| 3 or more Vehicles | 198 (29.5%) | 76 (19.4%) |
| Total | 671 (100.0%) | 391 (100.0%) |
Real Estate & Mortgages in Park Hill
Real Estate and Mortgage Overview in Park Hill
| Characteristic | Without Mortgage | With Mortgage |
| Housing Units | 375 | 296 |
| Median Property Value | $105,700 | $154,300 |
| Median Household Income | $57,578 | $79 |
| Monthly Housing Costs | $346 | $17 |
| Real Estate Taxes | $552 | $27 |
Property Value by Mortgage Status in Park Hill
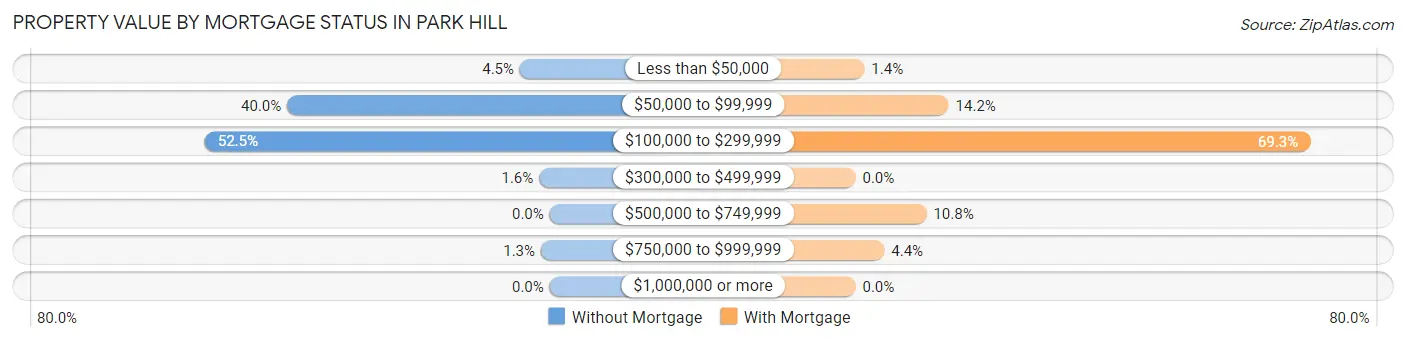
| Property Value | Without Mortgage | With Mortgage |
| Less than $50,000 | 17 (4.5%) | 4 (1.3%) |
| $50,000 to $99,999 | 150 (40.0%) | 42 (14.2%) |
| $100,000 to $299,999 | 197 (52.5%) | 205 (69.3%) |
| $300,000 to $499,999 | 6 (1.6%) | 0 (0.0%) |
| $500,000 to $749,999 | 0 (0.0%) | 32 (10.8%) |
| $750,000 to $999,999 | 5 (1.3%) | 13 (4.4%) |
| $1,000,000 or more | 0 (0.0%) | 0 (0.0%) |
| Total | 375 (100.0%) | 296 (100.0%) |
Household Income by Mortgage Status in Park Hill
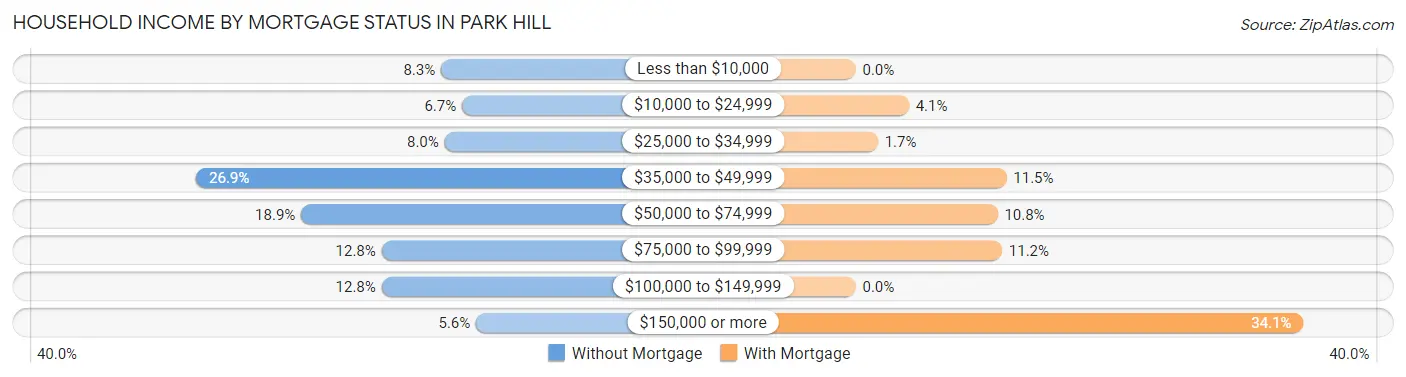
| Household Income | Without Mortgage | With Mortgage |
| Less than $10,000 | 31 (8.3%) | 0 (0.0%) |
| $10,000 to $24,999 | 25 (6.7%) | 12 (4.1%) |
| $25,000 to $34,999 | 30 (8.0%) | 5 (1.7%) |
| $35,000 to $49,999 | 101 (26.9%) | 34 (11.5%) |
| $50,000 to $74,999 | 71 (18.9%) | 32 (10.8%) |
| $75,000 to $99,999 | 48 (12.8%) | 33 (11.2%) |
| $100,000 to $149,999 | 48 (12.8%) | 0 (0.0%) |
| $150,000 or more | 21 (5.6%) | 101 (34.1%) |
| Total | 375 (100.0%) | 296 (100.0%) |
Property Value to Household Income Ratio in Park Hill
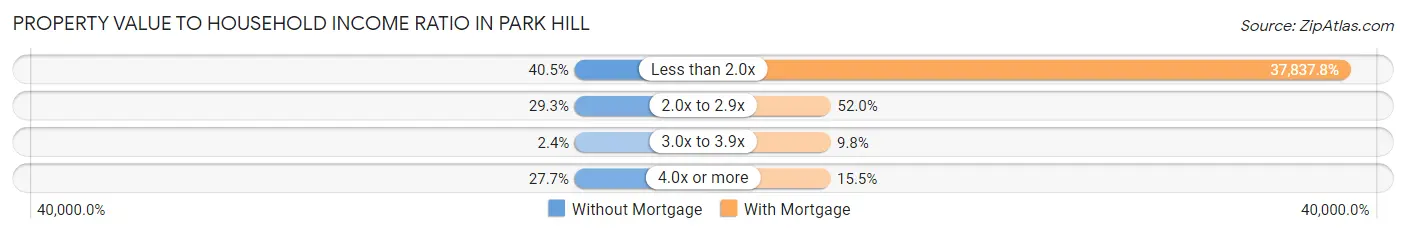
| Value-to-Income Ratio | Without Mortgage | With Mortgage |
| Less than 2.0x | 152 (40.5%) | 112,000 (37,837.8%) |
| 2.0x to 2.9x | 110 (29.3%) | 154 (52.0%) |
| 3.0x to 3.9x | 9 (2.4%) | 29 (9.8%) |
| 4.0x or more | 104 (27.7%) | 46 (15.5%) |
| Total | 375 (100.0%) | 296 (100.0%) |
Real Estate Taxes by Mortgage Status in Park Hill
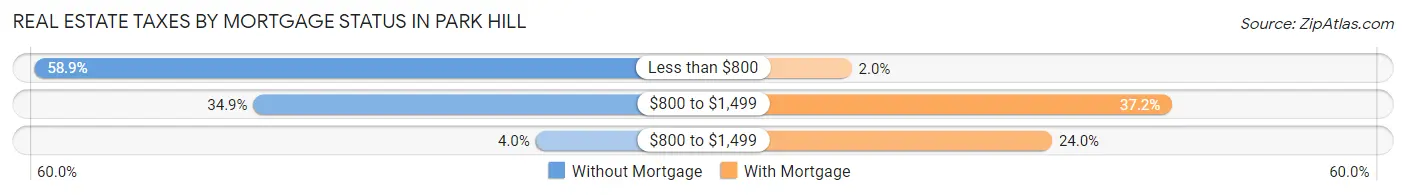
| Property Taxes | Without Mortgage | With Mortgage |
| Less than $800 | 221 (58.9%) | 6 (2.0%) |
| $800 to $1,499 | 131 (34.9%) | 110 (37.2%) |
| $800 to $1,499 | 15 (4.0%) | 71 (24.0%) |
| Total | 375 (100.0%) | 296 (100.0%) |
Health & Disability in Park Hill
Health Insurance Coverage by Age in Park Hill
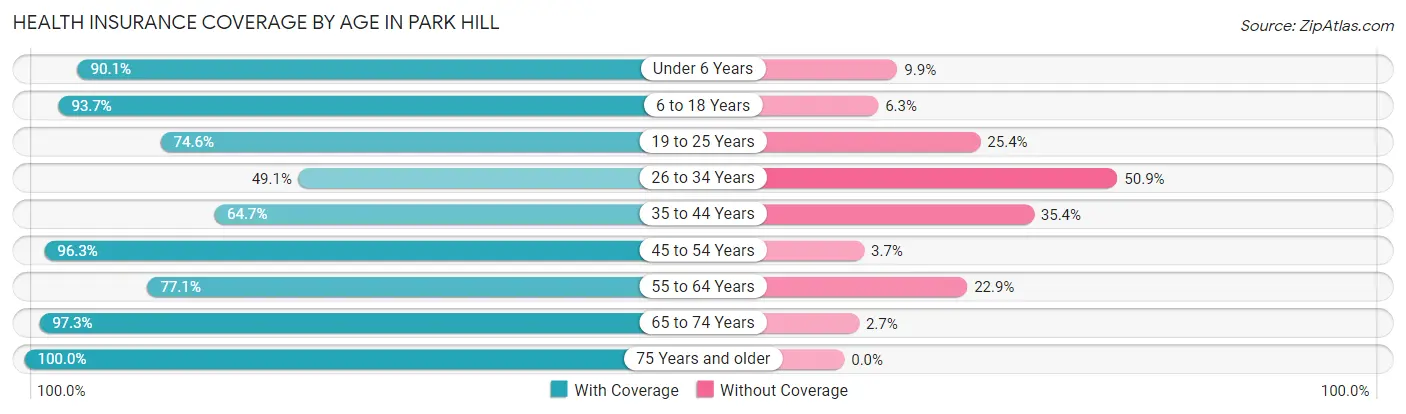
| Age Bracket | With Coverage | Without Coverage |
| Under 6 Years | 364 (90.1%) | 40 (9.9%) |
| 6 to 18 Years | 593 (93.7%) | 40 (6.3%) |
| 19 to 25 Years | 585 (74.6%) | 199 (25.4%) |
| 26 to 34 Years | 289 (49.1%) | 300 (50.9%) |
| 35 to 44 Years | 256 (64.6%) | 140 (35.3%) |
| 45 to 54 Years | 156 (96.3%) | 6 (3.7%) |
| 55 to 64 Years | 195 (77.1%) | 58 (22.9%) |
| 65 to 74 Years | 285 (97.3%) | 8 (2.7%) |
| 75 Years and older | 72 (100.0%) | 0 (0.0%) |
| Total | 2,795 (77.9%) | 791 (22.1%) |
Health Insurance Coverage by Citizenship Status in Park Hill
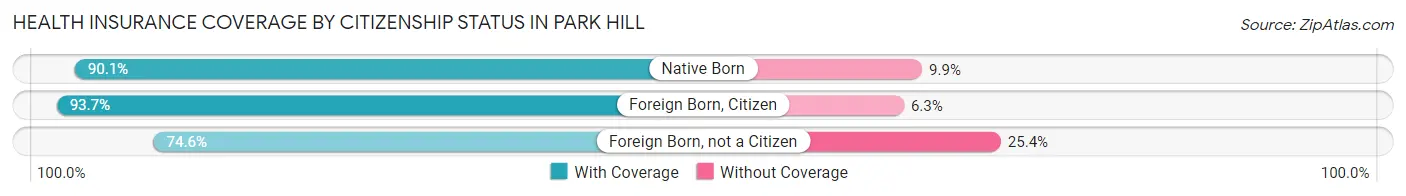
| Citizenship Status | With Coverage | Without Coverage |
| Native Born | 364 (90.1%) | 40 (9.9%) |
| Foreign Born, Citizen | 593 (93.7%) | 40 (6.3%) |
| Foreign Born, not a Citizen | 585 (74.6%) | 199 (25.4%) |
Health Insurance Coverage by Household Income in Park Hill
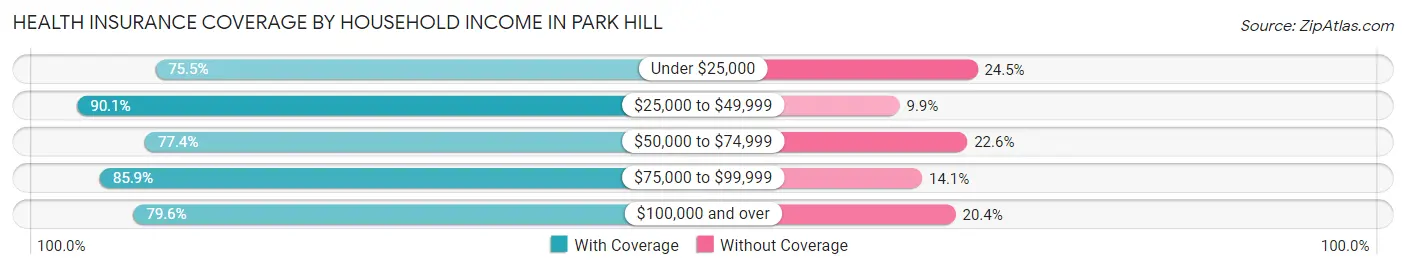
| Household Income | With Coverage | Without Coverage |
| Under $25,000 | 654 (75.5%) | 212 (24.5%) |
| $25,000 to $49,999 | 511 (90.1%) | 56 (9.9%) |
| $50,000 to $74,999 | 422 (77.4%) | 123 (22.6%) |
| $75,000 to $99,999 | 280 (85.9%) | 46 (14.1%) |
| $100,000 and over | 891 (79.6%) | 228 (20.4%) |
Public vs Private Health Insurance Coverage by Age in Park Hill
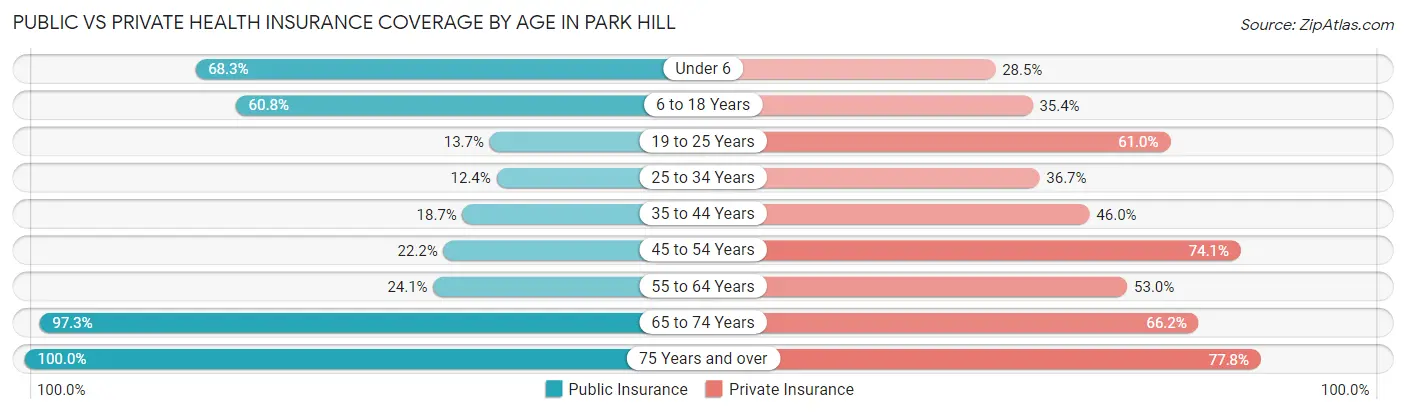
| Age Bracket | Public Insurance | Private Insurance |
| Under 6 | 276 (68.3%) | 115 (28.5%) |
| 6 to 18 Years | 385 (60.8%) | 224 (35.4%) |
| 19 to 25 Years | 107 (13.7%) | 478 (61.0%) |
| 25 to 34 Years | 73 (12.4%) | 216 (36.7%) |
| 35 to 44 Years | 74 (18.7%) | 182 (46.0%) |
| 45 to 54 Years | 36 (22.2%) | 120 (74.1%) |
| 55 to 64 Years | 61 (24.1%) | 134 (53.0%) |
| 65 to 74 Years | 285 (97.3%) | 194 (66.2%) |
| 75 Years and over | 72 (100.0%) | 56 (77.8%) |
| Total | 1,369 (38.2%) | 1,719 (47.9%) |
Disability Status by Sex by Age in Park Hill
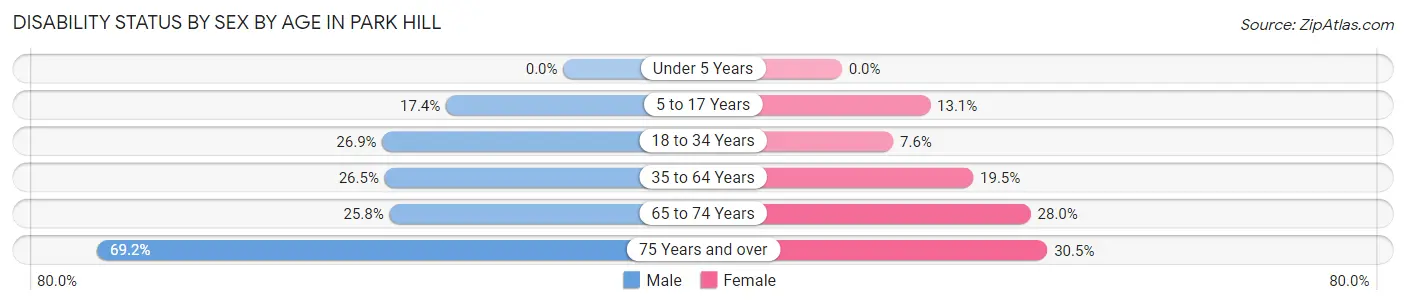
| Age Bracket | Male | Female |
| Under 5 Years | 0 (0.0%) | 0 (0.0%) |
| 5 to 17 Years | 51 (17.4%) | 43 (13.1%) |
| 18 to 34 Years | 180 (26.9%) | 58 (7.6%) |
| 35 to 64 Years | 109 (26.5%) | 78 (19.5%) |
| 65 to 74 Years | 48 (25.8%) | 30 (28.0%) |
| 75 Years and over | 9 (69.2%) | 18 (30.5%) |
Disability Class by Sex by Age in Park Hill
Disability Class: Hearing Difficulty
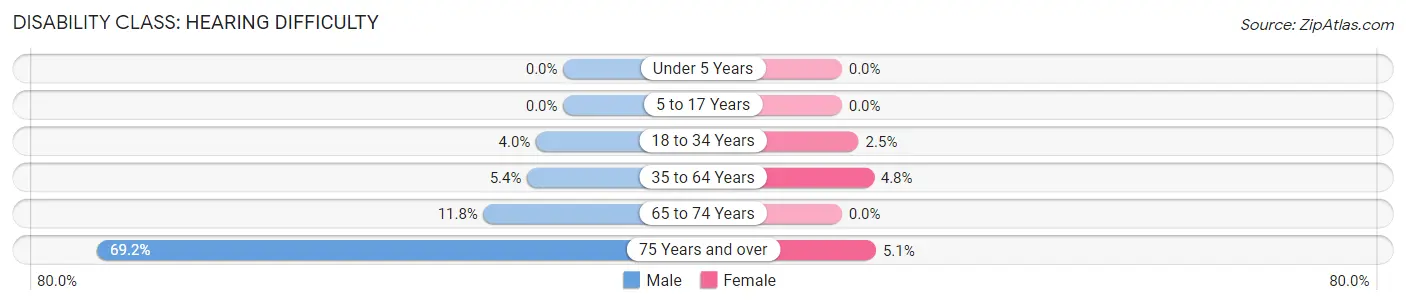
| Age Bracket | Male | Female |
| Under 5 Years | 0 (0.0%) | 0 (0.0%) |
| 5 to 17 Years | 0 (0.0%) | 0 (0.0%) |
| 18 to 34 Years | 27 (4.0%) | 19 (2.5%) |
| 35 to 64 Years | 22 (5.3%) | 19 (4.8%) |
| 65 to 74 Years | 22 (11.8%) | 0 (0.0%) |
| 75 Years and over | 9 (69.2%) | 3 (5.1%) |
Disability Class: Vision Difficulty
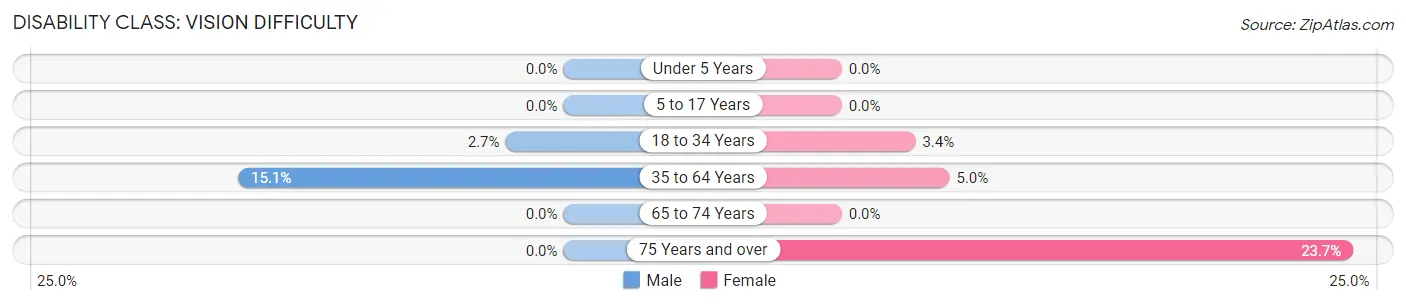
| Age Bracket | Male | Female |
| Under 5 Years | 0 (0.0%) | 0 (0.0%) |
| 5 to 17 Years | 0 (0.0%) | 0 (0.0%) |
| 18 to 34 Years | 18 (2.7%) | 26 (3.4%) |
| 35 to 64 Years | 62 (15.1%) | 20 (5.0%) |
| 65 to 74 Years | 0 (0.0%) | 0 (0.0%) |
| 75 Years and over | 0 (0.0%) | 14 (23.7%) |
Disability Class: Cognitive Difficulty
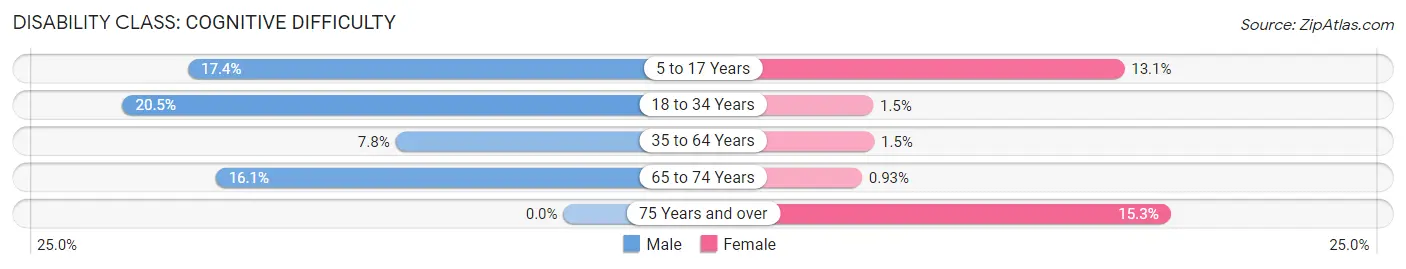
| Age Bracket | Male | Female |
| 5 to 17 Years | 51 (17.4%) | 43 (13.1%) |
| 18 to 34 Years | 137 (20.4%) | 11 (1.5%) |
| 35 to 64 Years | 32 (7.8%) | 6 (1.5%) |
| 65 to 74 Years | 30 (16.1%) | 1 (0.9%) |
| 75 Years and over | 0 (0.0%) | 9 (15.2%) |
Disability Class: Ambulatory Difficulty
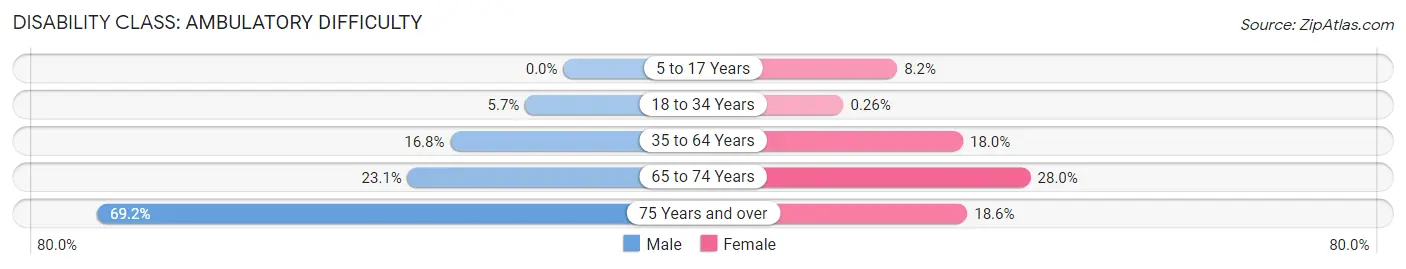
| Age Bracket | Male | Female |
| 5 to 17 Years | 0 (0.0%) | 27 (8.2%) |
| 18 to 34 Years | 38 (5.7%) | 2 (0.3%) |
| 35 to 64 Years | 69 (16.8%) | 72 (18.0%) |
| 65 to 74 Years | 43 (23.1%) | 30 (28.0%) |
| 75 Years and over | 9 (69.2%) | 11 (18.6%) |
Disability Class: Self-Care Difficulty
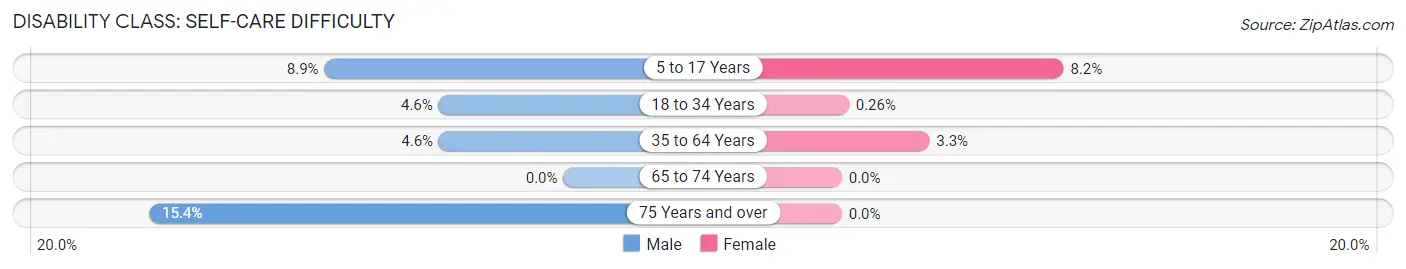
| Age Bracket | Male | Female |
| 5 to 17 Years | 26 (8.9%) | 27 (8.2%) |
| 18 to 34 Years | 31 (4.6%) | 2 (0.3%) |
| 35 to 64 Years | 19 (4.6%) | 13 (3.3%) |
| 65 to 74 Years | 0 (0.0%) | 0 (0.0%) |
| 75 Years and over | 2 (15.4%) | 0 (0.0%) |
Technology Access in Park Hill
Computing Device Access in Park Hill
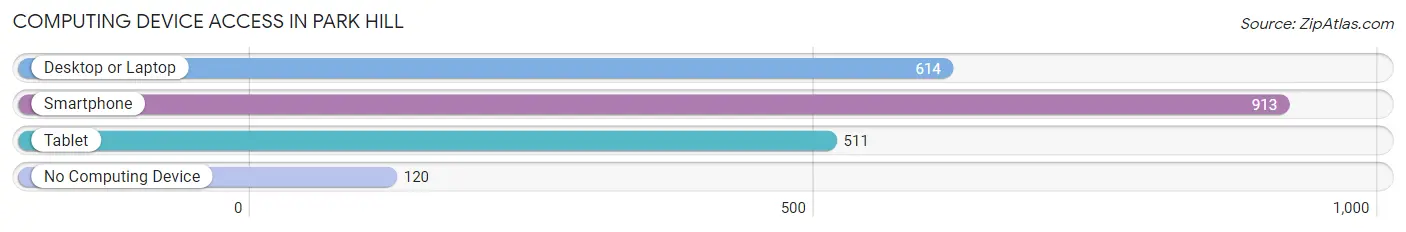
| Device Type | # Households | % Households |
| Desktop or Laptop | 614 | 57.8% |
| Smartphone | 913 | 86.0% |
| Tablet | 511 | 48.1% |
| No Computing Device | 120 | 11.3% |
| Total | 1,062 | 100.0% |
Internet Access in Park Hill
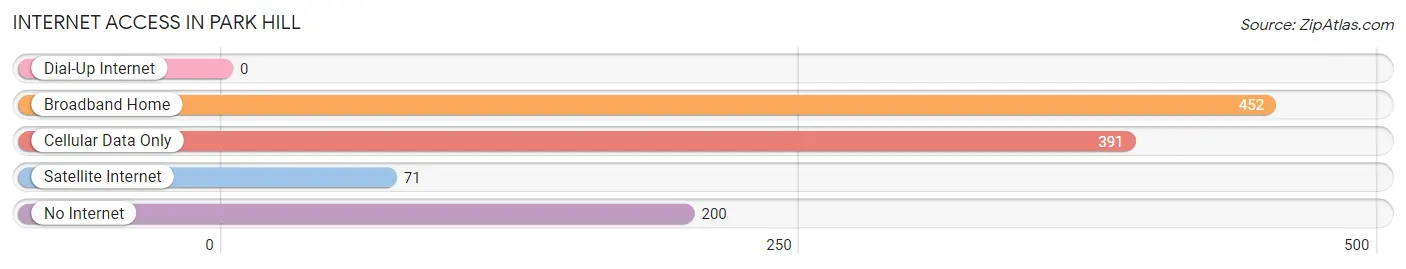
| Internet Type | # Households | % Households |
| Dial-Up Internet | 0 | 0.0% |
| Broadband Home | 452 | 42.6% |
| Cellular Data Only | 391 | 36.8% |
| Satellite Internet | 71 | 6.7% |
| No Internet | 200 | 18.8% |
| Total | 1,062 | 100.0% |
Park Hill Summary
Hill Park, Oklahoma is a small town located in the northeastern part of the state. It is situated in the foothills of the Ozark Mountains and is part of the Cherokee Nation. The town was founded in 1887 and has a population of approximately 1,000 people.
History
Hill Park, Oklahoma was founded in 1887 by a group of settlers from Arkansas. The town was named after the nearby hill, which was used as a lookout point by the settlers. The town was originally a farming community, but soon became a center for timber and coal mining. The town was also home to a number of small businesses, including a general store, a blacksmith shop, and a hotel.
In the early 1900s, Hill Park experienced a period of growth and prosperity. The town was home to a number of churches, schools, and businesses. The town also had a railroad station, which allowed for the transportation of goods and people.
In the 1920s, the town began to decline due to the Great Depression. Many of the businesses closed and the population decreased. The town was also affected by the Dust Bowl, which caused many of the farmers to leave the area.
In the 1950s, the town began to experience a resurgence. The coal and timber industries began to pick up again and the population began to increase. The town also experienced a period of growth in the 1970s and 1980s, when the town was home to a number of small businesses and industries.
Geography
Hill Park, Oklahoma is located in the northeastern part of the state. It is situated in the foothills of the Ozark Mountains and is part of the Cherokee Nation. The town is located on the banks of the Arkansas River and is surrounded by rolling hills and forests. The town is located approximately 30 miles from Tulsa and is accessible by highway.
Economy
The economy of Hill Park, Oklahoma is largely based on agriculture and timber. The town is home to a number of small farms and ranches, which produce a variety of crops, including corn, soybeans, and wheat. The town is also home to a number of timber companies, which harvest and process timber for use in construction and other industries.
The town is also home to a number of small businesses, including restaurants, stores, and service providers. The town is also home to a number of manufacturing companies, which produce a variety of products, including furniture, clothing, and electronics.
Demographics
As of the 2010 census, Hill Park, Oklahoma had a population of 1,000 people. The town is predominantly white, with approximately 95% of the population being white. The town is also home to a small Hispanic population, with approximately 5% of the population being Hispanic. The town is also home to a small Native American population, with approximately 1% of the population being Native American. The median household income in Hill Park, Oklahoma is approximately $35,000.
Common Questions
What is Per Capita Income in Park Hill?
Per Capita income in Park Hill is $24,389.
What is the Median Family Income in Park Hill?
Median Family Income in Park Hill is $54,646.
What is the Median Household income in Park Hill?
Median Household Income in Park Hill is $44,420.
What is Income or Wage Gap in Park Hill?
Income or Wage Gap in Park Hill is 4.9%.
Women in Park Hill earn 95.1 cents for every dollar earned by a man.
What is Inequality or Gini Index in Park Hill?
Inequality or Gini Index in Park Hill is 0.44.
What is the Total Population of Park Hill?
Total Population of Park Hill is 3,587.
What is the Total Male Population of Park Hill?
Total Male Population of Park Hill is 1,742.
What is the Total Female Population of Park Hill?
Total Female Population of Park Hill is 1,845.
What is the Ratio of Males per 100 Females in Park Hill?
There are 94.42 Males per 100 Females in Park Hill.
What is the Ratio of Females per 100 Males in Park Hill?
There are 105.91 Females per 100 Males in Park Hill.
What is the Median Population Age in Park Hill?
Median Population Age in Park Hill is 25.9 Years.
What is the Average Family Size in Park Hill
Average Family Size in Park Hill is 3.6 People.
What is the Average Household Size in Park Hill
Average Household Size in Park Hill is 3.2 People.
How Large is the Labor Force in Park Hill?
There are 1,644 People in the Labor Forcein in Park Hill.
What is the Percentage of People in the Labor Force in Park Hill?
61.5% of People are in the Labor Force in Park Hill.
What is the Unemployment Rate in Park Hill?
Unemployment Rate in Park Hill is 3.7%.