Chelsea, OK Map & Demographics
Chelsea Map
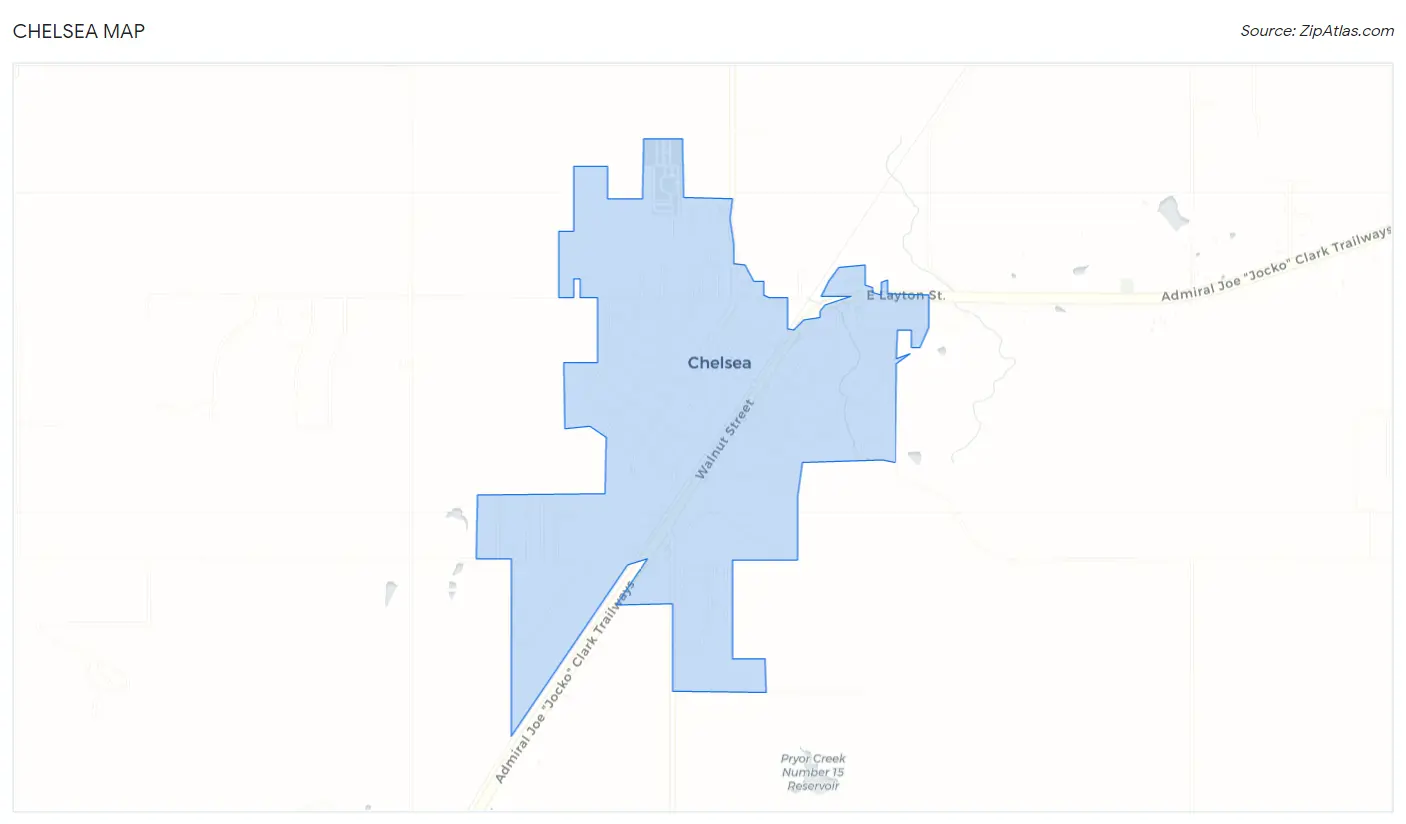
Chelsea Overview
$19,658
PER CAPITA INCOME
$49,000
AVG FAMILY INCOME
$39,961
AVG HOUSEHOLD INCOME
54.1%
WAGE / INCOME GAP [ % ]
45.9¢/ $1
WAGE / INCOME GAP [ $ ]
$13,004
FAMILY INCOME DEFICIT
0.45
INEQUALITY / GINI INDEX
1,914
TOTAL POPULATION
855
MALE POPULATION
1,059
FEMALE POPULATION
80.74
MALES / 100 FEMALES
123.86
FEMALES / 100 MALES
32.0
MEDIAN AGE
3.1
AVG FAMILY SIZE
2.6
AVG HOUSEHOLD SIZE
896
LABOR FORCE [ PEOPLE ]
59.6%
PERCENT IN LABOR FORCE
12.1%
UNEMPLOYMENT RATE
Chelsea Zip Codes
Chelsea Area Codes
Income in Chelsea
Income Overview in Chelsea
Per Capita Income in Chelsea is $19,658, while median incomes of families and households are $49,000 and $39,961 respectively.
| Characteristic | Number | Measure |
| Per Capita Income | 1,914 | $19,658 |
| Median Family Income | 494 | $49,000 |
| Mean Family Income | 494 | $57,207 |
| Median Household Income | 743 | $39,961 |
| Mean Household Income | 743 | $48,552 |
| Income Deficit | 494 | $13,004 |
| Wage / Income Gap (%) | 1,914 | 54.09% |
| Wage / Income Gap ($) | 1,914 | 45.91¢ per $1 |
| Gini / Inequality Index | 1,914 | 0.45 |
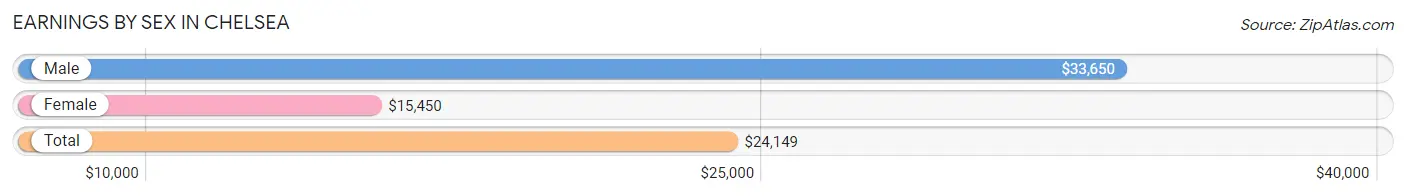
Earnings by Sex in Chelsea
Average Earnings in Chelsea are $24,149, $33,650 for men and $15,450 for women, a difference of 54.1%.
| Sex | Number | Average Earnings |
| Male | 437 (46.8%) | $33,650 |
| Female | 497 (53.2%) | $15,450 |
| Total | 934 (100.0%) | $24,149 |
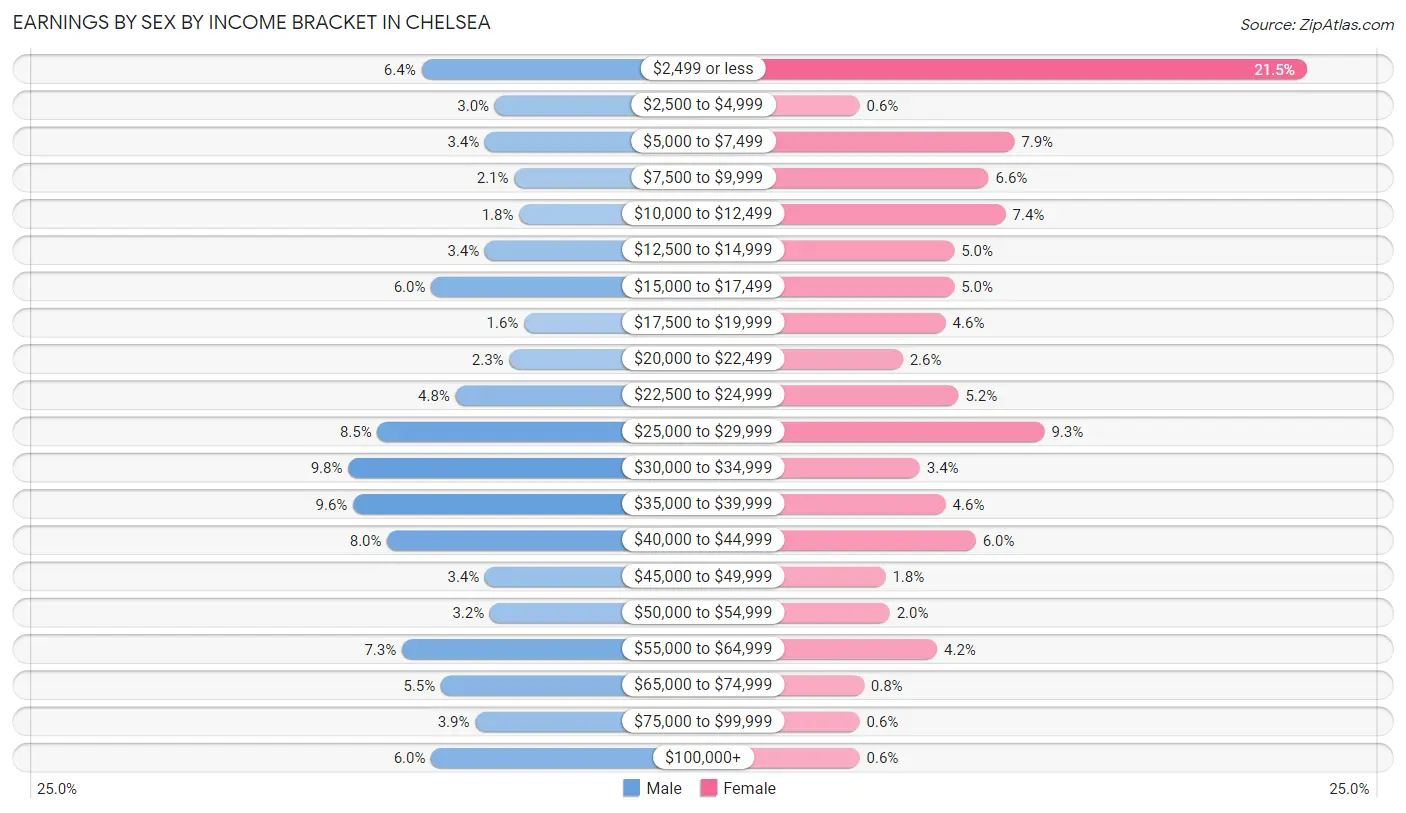
Earnings by Sex by Income Bracket in Chelsea
The most common earnings brackets in Chelsea are $30,000 to $34,999 for men (43 | 9.8%) and $2,499 or less for women (107 | 21.5%).
| Income | Male | Female |
| $2,499 or less | 28 (6.4%) | 107 (21.5%) |
| $2,500 to $4,999 | 13 (3.0%) | 3 (0.6%) |
| $5,000 to $7,499 | 15 (3.4%) | 39 (7.9%) |
| $7,500 to $9,999 | 9 (2.1%) | 33 (6.6%) |
| $10,000 to $12,499 | 8 (1.8%) | 37 (7.4%) |
| $12,500 to $14,999 | 15 (3.4%) | 25 (5.0%) |
| $15,000 to $17,499 | 26 (5.9%) | 25 (5.0%) |
| $17,500 to $19,999 | 7 (1.6%) | 23 (4.6%) |
| $20,000 to $22,499 | 10 (2.3%) | 13 (2.6%) |
| $22,500 to $24,999 | 21 (4.8%) | 26 (5.2%) |
| $25,000 to $29,999 | 37 (8.5%) | 46 (9.3%) |
| $30,000 to $34,999 | 43 (9.8%) | 17 (3.4%) |
| $35,000 to $39,999 | 42 (9.6%) | 23 (4.6%) |
| $40,000 to $44,999 | 35 (8.0%) | 30 (6.0%) |
| $45,000 to $49,999 | 15 (3.4%) | 9 (1.8%) |
| $50,000 to $54,999 | 14 (3.2%) | 10 (2.0%) |
| $55,000 to $64,999 | 32 (7.3%) | 21 (4.2%) |
| $65,000 to $74,999 | 24 (5.5%) | 4 (0.8%) |
| $75,000 to $99,999 | 17 (3.9%) | 3 (0.6%) |
| $100,000+ | 26 (5.9%) | 3 (0.6%) |
| Total | 437 (100.0%) | 497 (100.0%) |
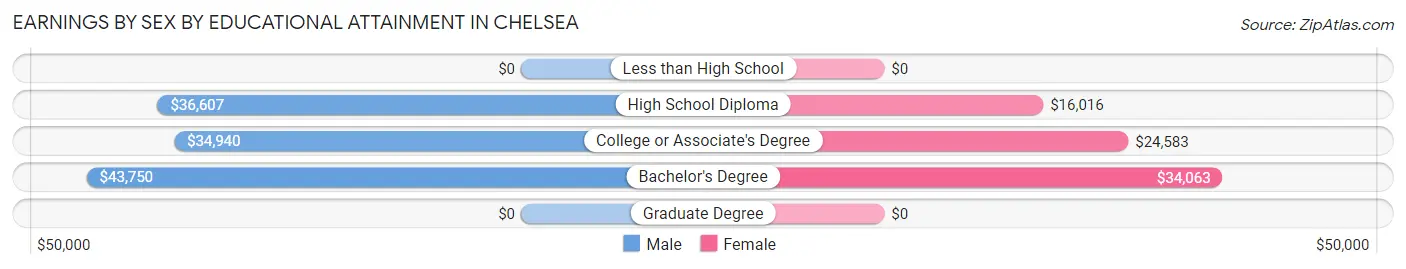
Earnings by Sex by Educational Attainment in Chelsea
Average earnings in Chelsea are $37,798 for men and $18,261 for women, a difference of 51.7%. Men with an educational attainment of bachelor's degree enjoy the highest average annual earnings of $43,750, while those with college or associate's degree education earn the least with $34,940. Women with an educational attainment of bachelor's degree earn the most with the average annual earnings of $34,063, while those with high school diploma education have the smallest earnings of $16,016.
| Educational Attainment | Male Income | Female Income |
| Less than High School | - | - |
| High School Diploma | $36,607 | $16,016 |
| College or Associate's Degree | $34,940 | $24,583 |
| Bachelor's Degree | $43,750 | $34,063 |
| Graduate Degree | - | - |
| Total | $37,798 | $18,261 |
Family Income in Chelsea
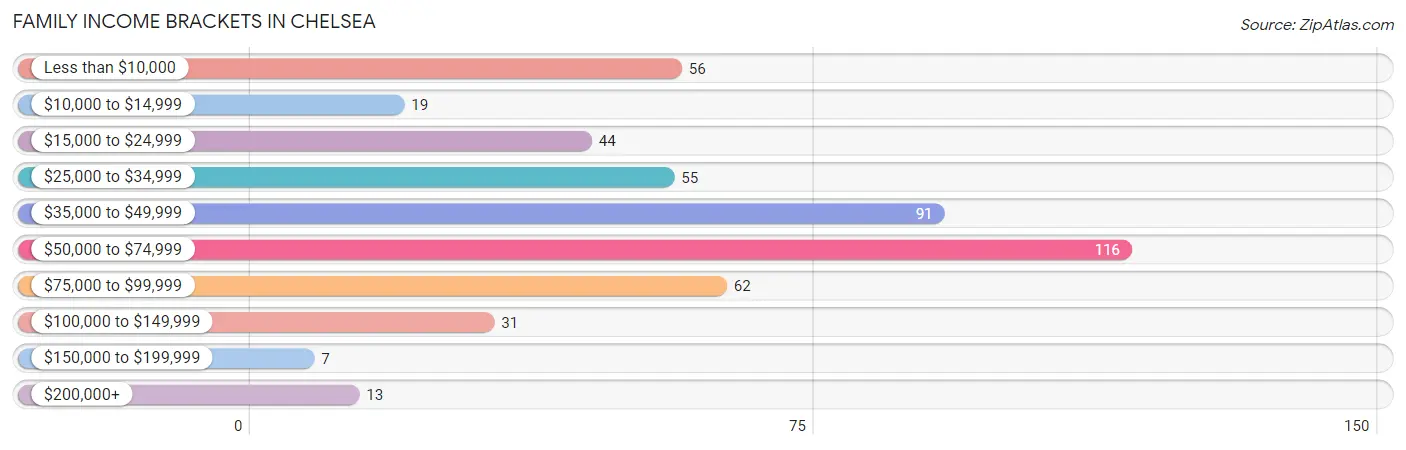
Family Income Brackets in Chelsea
According to the Chelsea family income data, there are 116 families falling into the $50,000 to $74,999 income range, which is the most common income bracket and makes up 23.5% of all families. Conversely, the $150,000 to $199,999 income bracket is the least frequent group with only 7 families (1.4%) belonging to this category.
| Income Bracket | # Families | % Families |
| Less than $10,000 | 56 | 11.3% |
| $10,000 to $14,999 | 19 | 3.8% |
| $15,000 to $24,999 | 44 | 8.9% |
| $25,000 to $34,999 | 55 | 11.1% |
| $35,000 to $49,999 | 91 | 18.4% |
| $50,000 to $74,999 | 116 | 23.5% |
| $75,000 to $99,999 | 62 | 12.6% |
| $100,000 to $149,999 | 31 | 6.3% |
| $150,000 to $199,999 | 7 | 1.4% |
| $200,000+ | 13 | 2.6% |
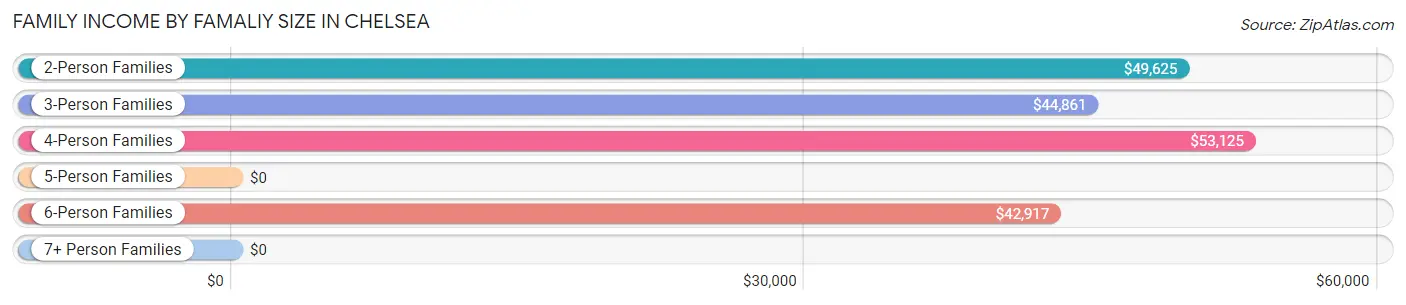
Family Income by Famaliy Size in Chelsea
4-person families (104 | 21.0%) account for the highest median family income in Chelsea with $53,125 per family, while 2-person families (212 | 42.9%) have the highest median income of $24,812 per family member.
| Income Bracket | # Families | Median Income |
| 2-Person Families | 212 (42.9%) | $49,625 |
| 3-Person Families | 133 (26.9%) | $44,861 |
| 4-Person Families | 104 (21.0%) | $53,125 |
| 5-Person Families | 27 (5.5%) | $0 |
| 6-Person Families | 18 (3.6%) | $42,917 |
| 7+ Person Families | 0 (0.0%) | $0 |
| Total | 494 (100.0%) | $49,000 |
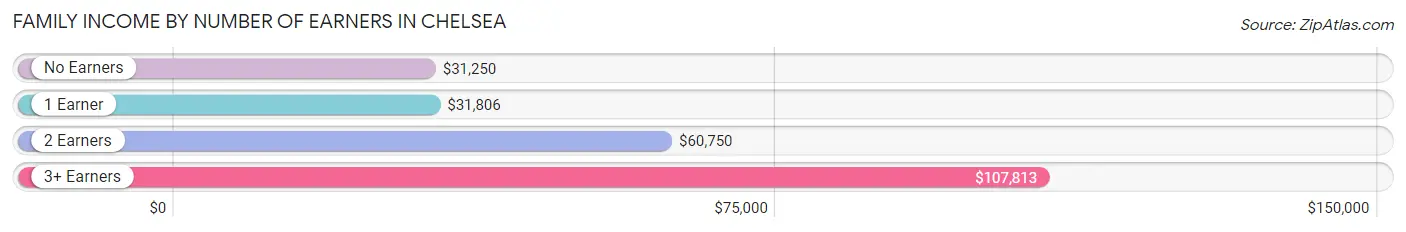
Family Income by Number of Earners in Chelsea
The median family income in Chelsea is $49,000, with families comprising 3+ earners (33) having the highest median family income of $107,813, while families with no earners (84) have the lowest median family income of $31,250, accounting for 6.7% and 17.0% of families, respectively.
| Number of Earners | # Families | Median Income |
| No Earners | 84 (17.0%) | $31,250 |
| 1 Earner | 195 (39.5%) | $31,806 |
| 2 Earners | 182 (36.8%) | $60,750 |
| 3+ Earners | 33 (6.7%) | $107,813 |
| Total | 494 (100.0%) | $49,000 |
Household Income in Chelsea
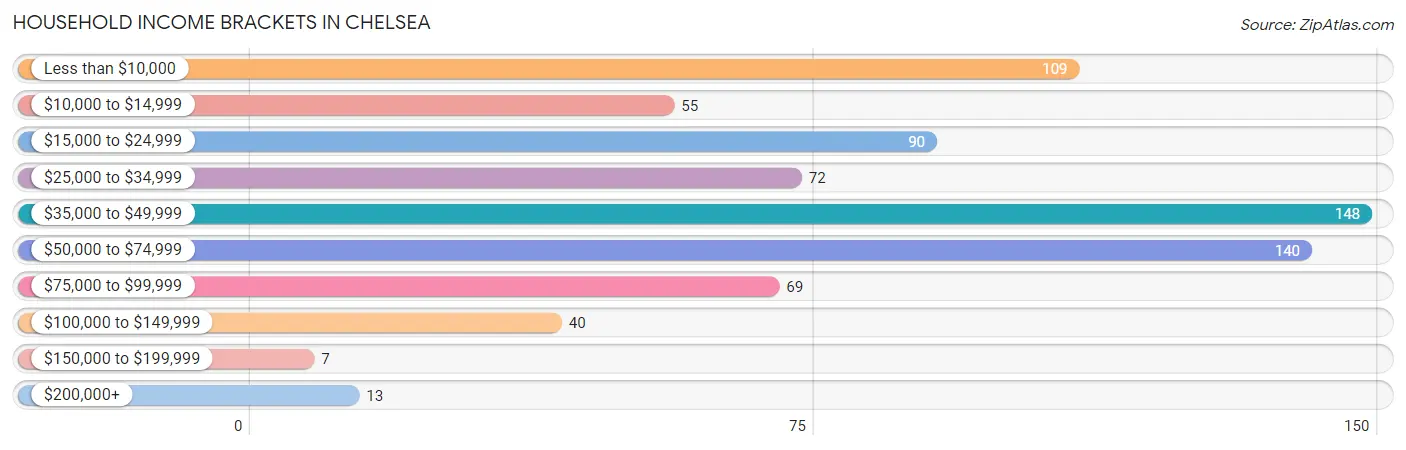
Household Income Brackets in Chelsea
With 148 households falling in the category, the $35,000 to $49,999 income range is the most frequent in Chelsea, accounting for 19.9% of all households. In contrast, only 7 households (0.9%) fall into the $150,000 to $199,999 income bracket, making it the least populous group.
| Income Bracket | # Households | % Households |
| Less than $10,000 | 109 | 14.7% |
| $10,000 to $14,999 | 55 | 7.4% |
| $15,000 to $24,999 | 90 | 12.1% |
| $25,000 to $34,999 | 72 | 9.7% |
| $35,000 to $49,999 | 148 | 19.9% |
| $50,000 to $74,999 | 140 | 18.8% |
| $75,000 to $99,999 | 69 | 9.3% |
| $100,000 to $149,999 | 40 | 5.4% |
| $150,000 to $199,999 | 7 | 0.9% |
| $200,000+ | 13 | 1.7% |
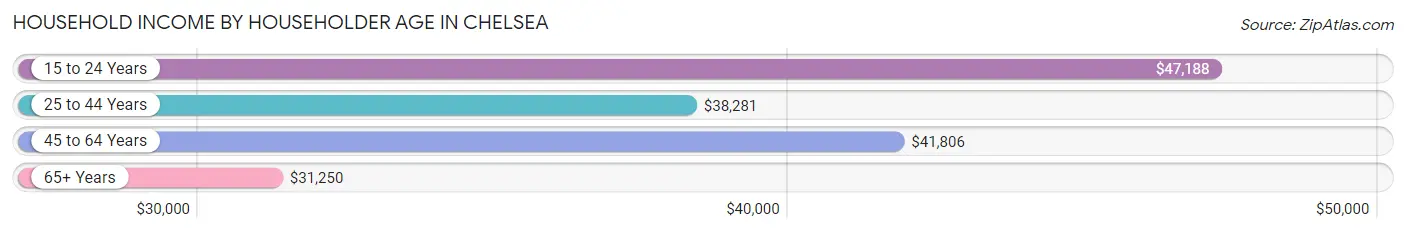
Household Income by Householder Age in Chelsea
The median household income in Chelsea is $39,961, with the highest median household income of $47,188 found in the 15 to 24 years age bracket for the primary householder. A total of 39 households (5.2%) fall into this category. Meanwhile, the 65+ years age bracket for the primary householder has the lowest median household income of $31,250, with 166 households (22.3%) in this group.
| Income Bracket | # Households | Median Income |
| 15 to 24 Years | 39 (5.2%) | $47,188 |
| 25 to 44 Years | 261 (35.1%) | $38,281 |
| 45 to 64 Years | 277 (37.3%) | $41,806 |
| 65+ Years | 166 (22.3%) | $31,250 |
| Total | 743 (100.0%) | $39,961 |
Poverty in Chelsea
Income Below Poverty by Sex and Age in Chelsea
With 25.0% poverty level for males and 30.2% for females among the residents of Chelsea, 6 to 11 year old males and 5 year old females are the most vulnerable to poverty, with 58 males (77.3%) and 9 females (47.4%) in their respective age groups living below the poverty level.
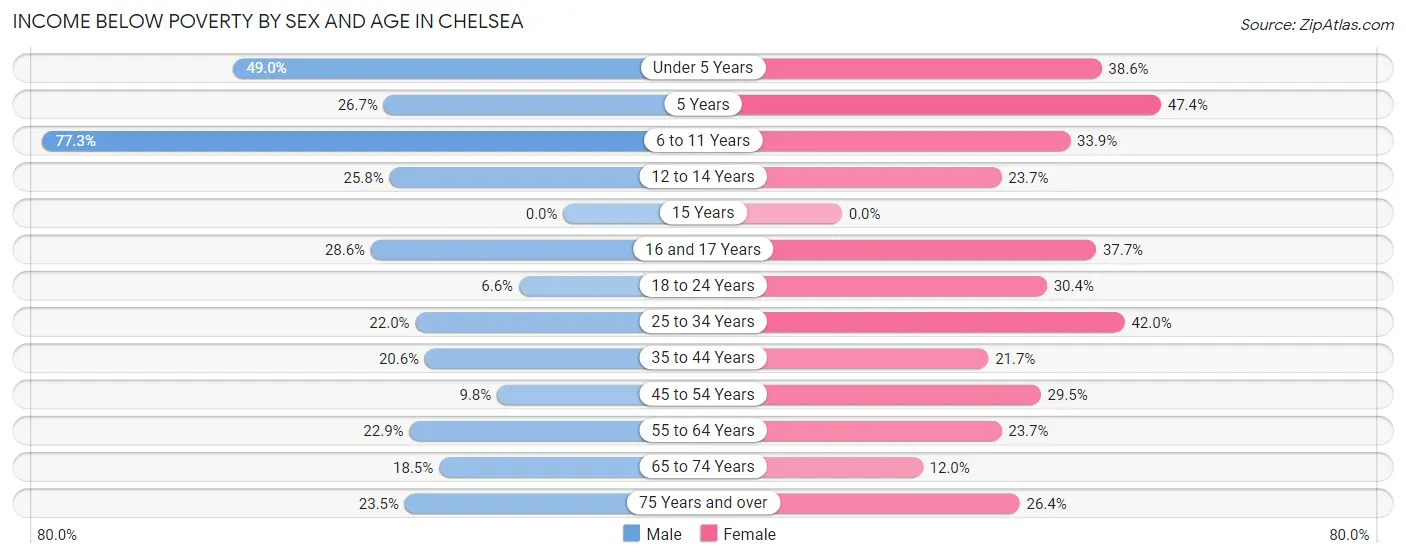
| Age Bracket | Male | Female |
| Under 5 Years | 24 (49.0%) | 32 (38.6%) |
| 5 Years | 4 (26.7%) | 9 (47.4%) |
| 6 to 11 Years | 58 (77.3%) | 20 (33.9%) |
| 12 to 14 Years | 8 (25.8%) | 9 (23.7%) |
| 15 Years | 0 (0.0%) | 0 (0.0%) |
| 16 and 17 Years | 10 (28.6%) | 20 (37.7%) |
| 18 to 24 Years | 6 (6.6%) | 42 (30.4%) |
| 25 to 34 Years | 29 (22.0%) | 68 (42.0%) |
| 35 to 44 Years | 15 (20.5%) | 25 (21.7%) |
| 45 to 54 Years | 12 (9.8%) | 31 (29.5%) |
| 55 to 64 Years | 24 (22.9%) | 36 (23.7%) |
| 65 to 74 Years | 12 (18.5%) | 6 (12.0%) |
| 75 Years and over | 8 (23.5%) | 19 (26.4%) |
| Total | 210 (25.0%) | 317 (30.2%) |
Income Above Poverty by Sex and Age in Chelsea
According to the poverty statistics in Chelsea, males aged 15 years and females aged 15 years are the age groups that are most secure financially, with 100.0% of males and 100.0% of females in these age groups living above the poverty line.
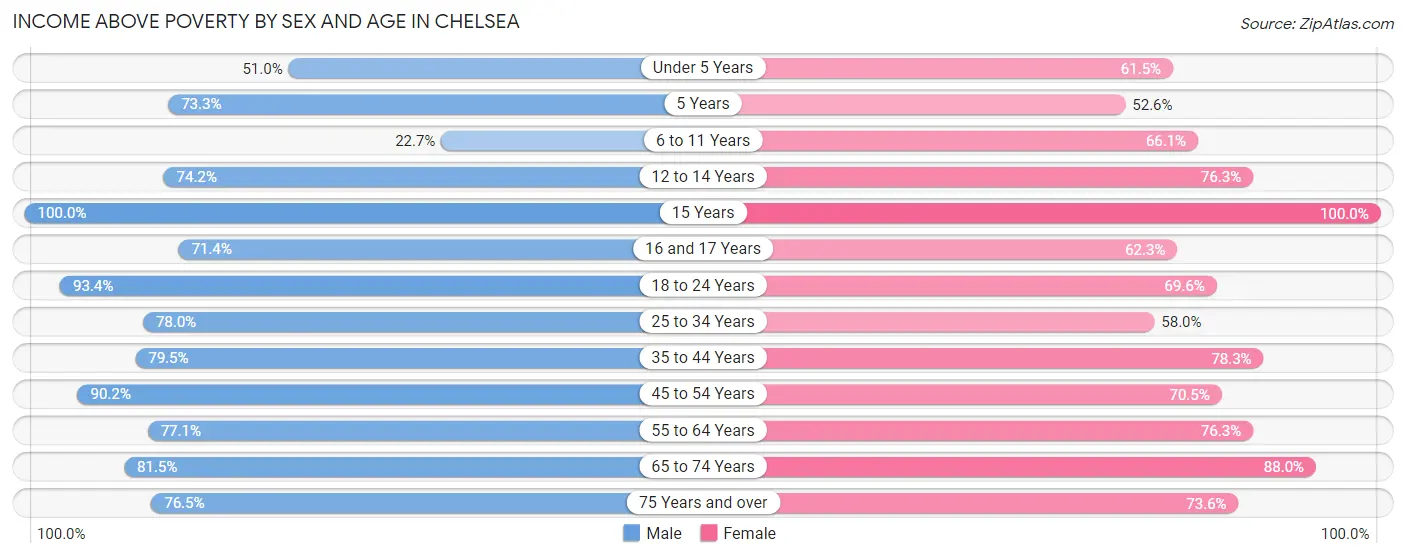
| Age Bracket | Male | Female |
| Under 5 Years | 25 (51.0%) | 51 (61.5%) |
| 5 Years | 11 (73.3%) | 10 (52.6%) |
| 6 to 11 Years | 17 (22.7%) | 39 (66.1%) |
| 12 to 14 Years | 23 (74.2%) | 29 (76.3%) |
| 15 Years | 13 (100.0%) | 4 (100.0%) |
| 16 and 17 Years | 25 (71.4%) | 33 (62.3%) |
| 18 to 24 Years | 85 (93.4%) | 96 (69.6%) |
| 25 to 34 Years | 103 (78.0%) | 94 (58.0%) |
| 35 to 44 Years | 58 (79.4%) | 90 (78.3%) |
| 45 to 54 Years | 110 (90.2%) | 74 (70.5%) |
| 55 to 64 Years | 81 (77.1%) | 116 (76.3%) |
| 65 to 74 Years | 53 (81.5%) | 44 (88.0%) |
| 75 Years and over | 26 (76.5%) | 53 (73.6%) |
| Total | 630 (75.0%) | 733 (69.8%) |
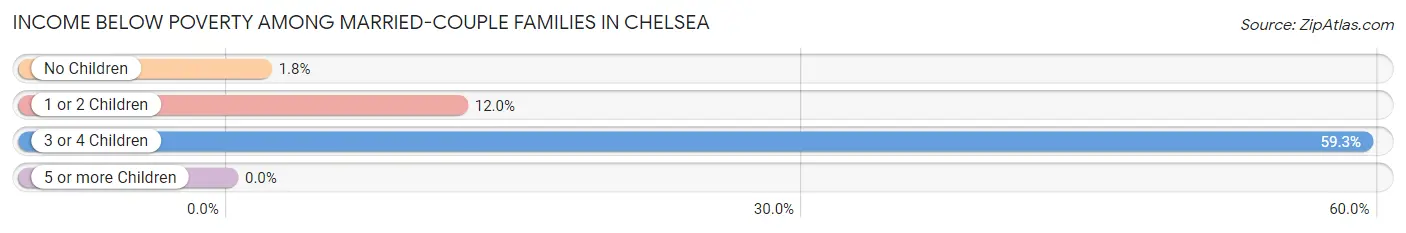
Income Below Poverty Among Married-Couple Families in Chelsea
The poverty statistics for married-couple families in Chelsea show that 10.4% or 31 of the total 297 families live below the poverty line. Families with 3 or 4 children have the highest poverty rate of 59.3%, comprising of 16 families. On the other hand, families with no children have the lowest poverty rate of 1.8%, which includes 3 families.
| Children | Above Poverty | Below Poverty |
| No Children | 167 (98.2%) | 3 (1.8%) |
| 1 or 2 Children | 88 (88.0%) | 12 (12.0%) |
| 3 or 4 Children | 11 (40.7%) | 16 (59.3%) |
| 5 or more Children | 0 (0.0%) | 0 (0.0%) |
| Total | 266 (89.6%) | 31 (10.4%) |
Income Below Poverty Among Single-Parent Households in Chelsea
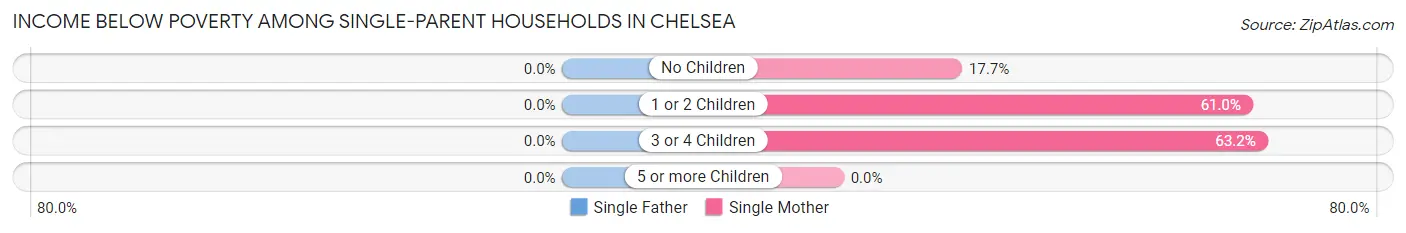
| Children | Single Father | Single Mother |
| No Children | 0 (0.0%) | 6 (17.6%) |
| 1 or 2 Children | 0 (0.0%) | 64 (61.0%) |
| 3 or 4 Children | 0 (0.0%) | 12 (63.2%) |
| 5 or more Children | 0 (0.0%) | 0 (0.0%) |
| Total | 0 (0.0%) | 82 (51.9%) |
Income Below Poverty Among Married-Couple vs Single-Parent Households in Chelsea
The poverty data for Chelsea shows that 31 of the married-couple family households (10.4%) and 82 of the single-parent households (41.6%) are living below the poverty level. Within the married-couple family households, those with 3 or 4 children have the highest poverty rate, with 16 households (59.3%) falling below the poverty line. Among the single-parent households, those with 3 or 4 children have the highest poverty rate, with 12 household (57.1%) living below poverty.
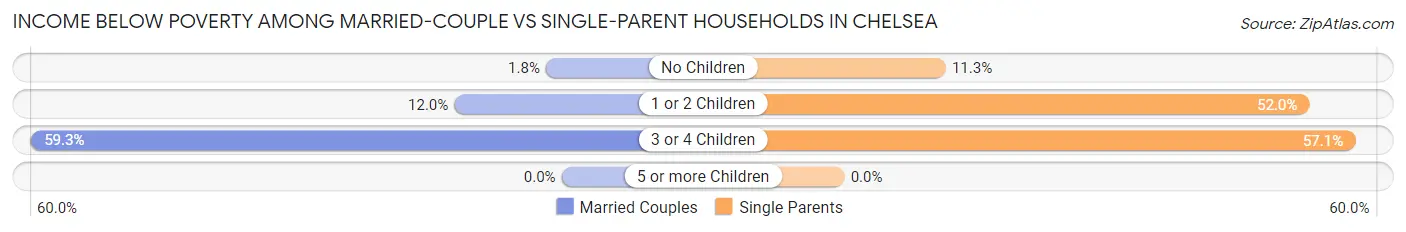
| Children | Married-Couple Families | Single-Parent Households |
| No Children | 3 (1.8%) | 6 (11.3%) |
| 1 or 2 Children | 12 (12.0%) | 64 (52.0%) |
| 3 or 4 Children | 16 (59.3%) | 12 (57.1%) |
| 5 or more Children | 0 (0.0%) | 0 (0.0%) |
| Total | 31 (10.4%) | 82 (41.6%) |
Race in Chelsea
The most populous races in Chelsea are White / Caucasian (1,158 | 60.5%), Native / Alaskan (462 | 24.1%), and Two or more Races (277 | 14.5%).
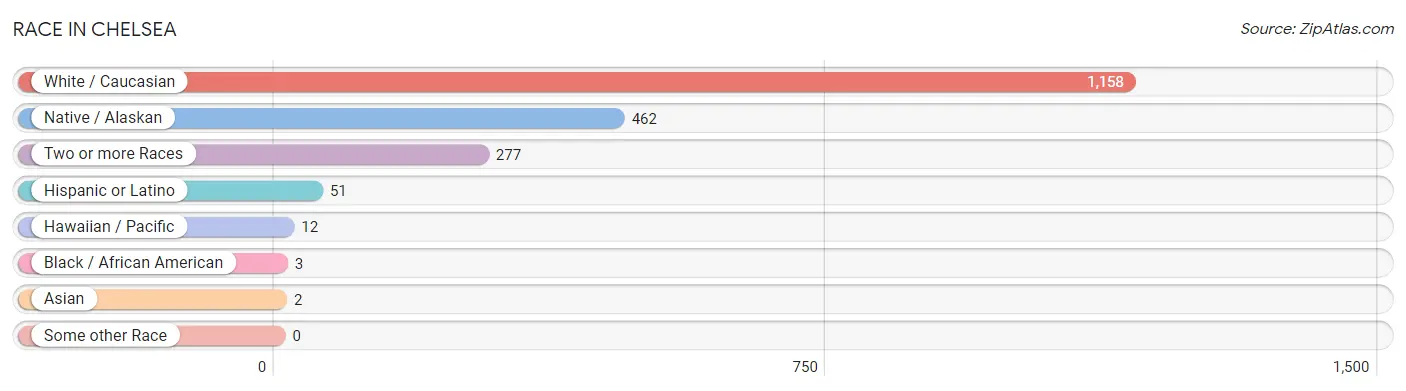
| Race | # Population | % Population |
| Asian | 2 | 0.1% |
| Black / African American | 3 | 0.2% |
| Hawaiian / Pacific | 12 | 0.6% |
| Hispanic or Latino | 51 | 2.7% |
| Native / Alaskan | 462 | 24.1% |
| White / Caucasian | 1,158 | 60.5% |
| Two or more Races | 277 | 14.5% |
| Some other Race | 0 | 0.0% |
| Total | 1,914 | 100.0% |
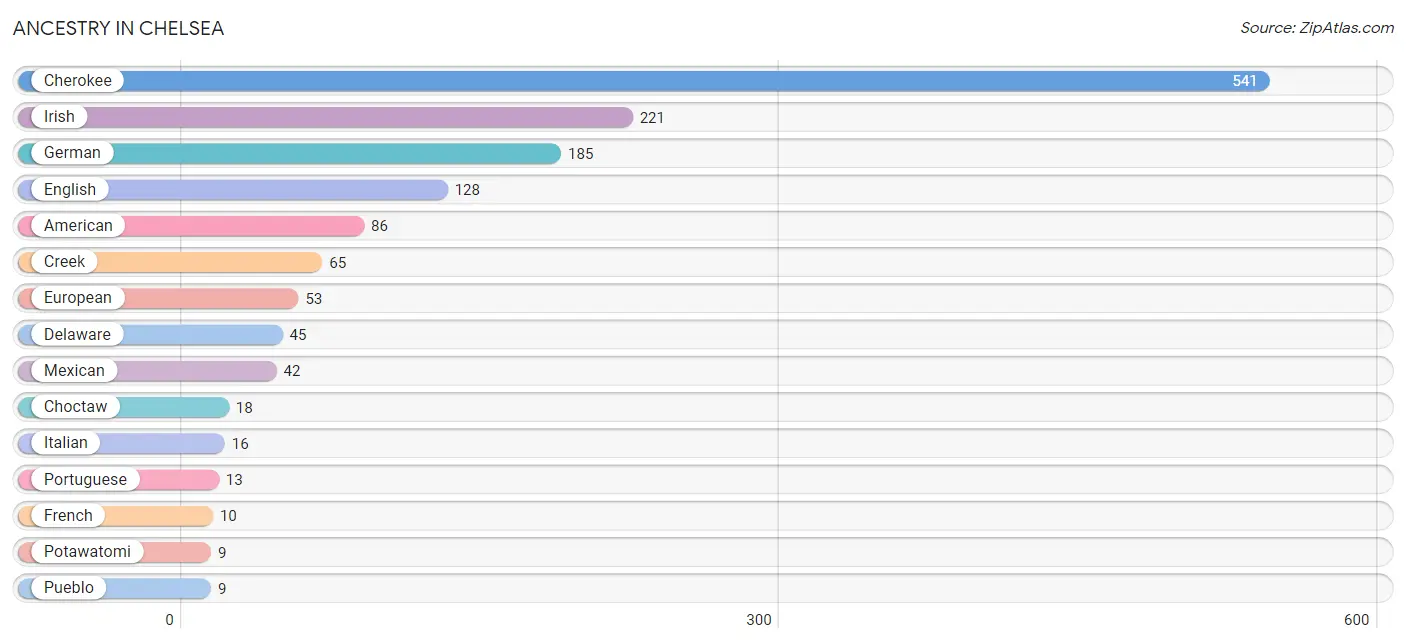
Ancestry in Chelsea
The most populous ancestries reported in Chelsea are Cherokee (541 | 28.3%), Irish (221 | 11.6%), German (185 | 9.7%), English (128 | 6.7%), and American (86 | 4.5%), together accounting for 60.7% of all Chelsea residents.
| Ancestry | # Population | % Population |
| Alaska Native | 5 | 0.3% |
| American | 86 | 4.5% |
| Bhutanese | 2 | 0.1% |
| Burmese | 5 | 0.3% |
| Canadian | 4 | 0.2% |
| Cherokee | 541 | 28.3% |
| Chickasaw | 7 | 0.4% |
| Chippewa | 4 | 0.2% |
| Choctaw | 18 | 0.9% |
| Creek | 65 | 3.4% |
| Danish | 5 | 0.3% |
| Delaware | 45 | 2.4% |
| Dutch | 7 | 0.4% |
| Eastern European | 5 | 0.3% |
| English | 128 | 6.7% |
| European | 53 | 2.8% |
| French | 10 | 0.5% |
| French American Indian | 4 | 0.2% |
| German | 185 | 9.7% |
| Guamanian / Chamorro | 6 | 0.3% |
| Irish | 221 | 11.6% |
| Italian | 16 | 0.8% |
| Kiowa | 3 | 0.2% |
| Korean | 4 | 0.2% |
| Mexican | 42 | 2.2% |
| Native Hawaiian | 6 | 0.3% |
| Polish | 2 | 0.1% |
| Portuguese | 13 | 0.7% |
| Potawatomi | 9 | 0.5% |
| Pueblo | 9 | 0.5% |
| Puerto Rican | 9 | 0.5% |
| Scotch-Irish | 6 | 0.3% |
| Scottish | 9 | 0.5% |
| Swedish | 7 | 0.4% |
| Swiss | 7 | 0.4% |
| Welsh | 8 | 0.4% | View All 36 Rows |
Immigrants in Chelsea
The most numerous immigrant groups reported in Chelsea came from , and Canada (4 | 0.2%), together accounting for 0.2% of all Chelsea residents.

| Immigration Origin | # Population | % Population |
| Canada | 4 | 0.2% | View All 1 Rows |
Sex and Age in Chelsea
Sex and Age in Chelsea
The most populous age groups in Chelsea are 5 to 9 Years (89 | 10.4%) for men and 15 to 19 Years (99 | 9.3%) for women.
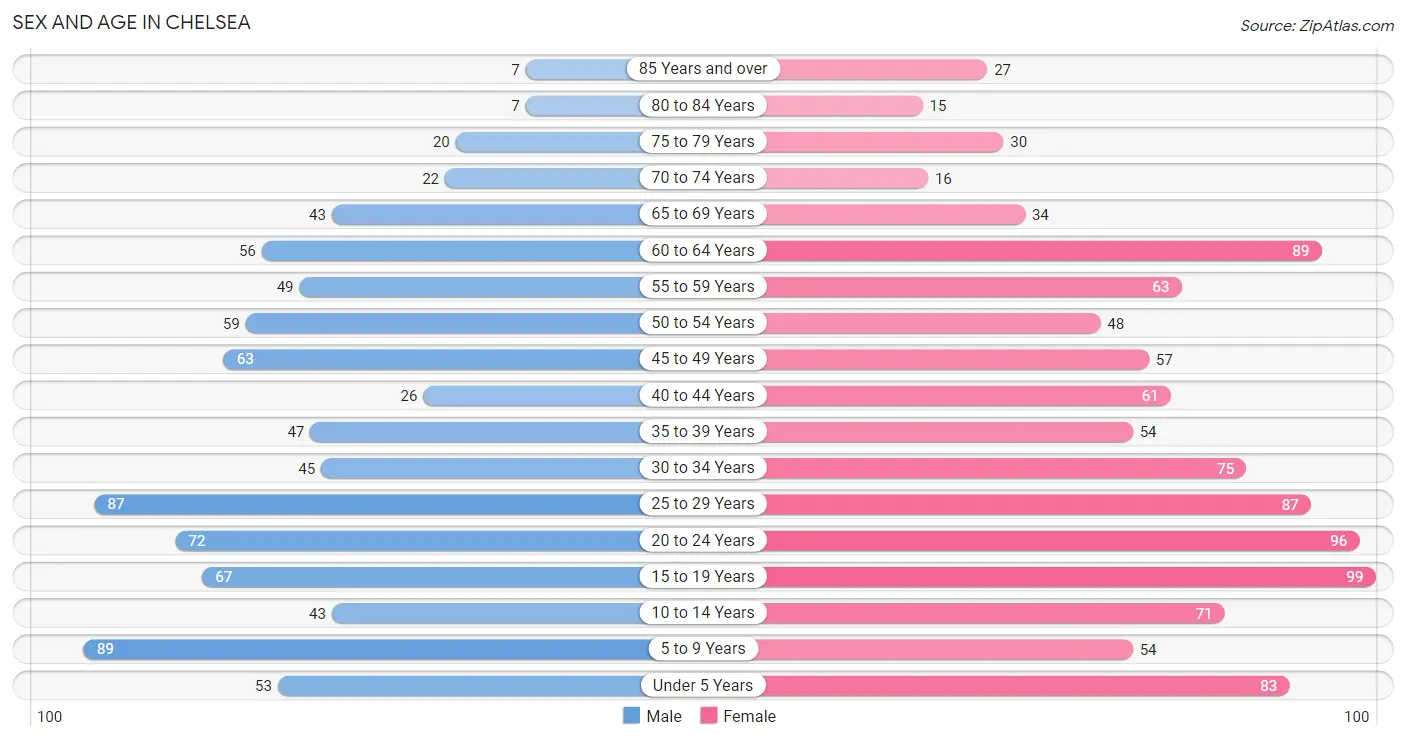
| Age Bracket | Male | Female |
| Under 5 Years | 53 (6.2%) | 83 (7.8%) |
| 5 to 9 Years | 89 (10.4%) | 54 (5.1%) |
| 10 to 14 Years | 43 (5.0%) | 71 (6.7%) |
| 15 to 19 Years | 67 (7.8%) | 99 (9.3%) |
| 20 to 24 Years | 72 (8.4%) | 96 (9.1%) |
| 25 to 29 Years | 87 (10.2%) | 87 (8.2%) |
| 30 to 34 Years | 45 (5.3%) | 75 (7.1%) |
| 35 to 39 Years | 47 (5.5%) | 54 (5.1%) |
| 40 to 44 Years | 26 (3.0%) | 61 (5.8%) |
| 45 to 49 Years | 63 (7.4%) | 57 (5.4%) |
| 50 to 54 Years | 59 (6.9%) | 48 (4.5%) |
| 55 to 59 Years | 49 (5.7%) | 63 (5.9%) |
| 60 to 64 Years | 56 (6.6%) | 89 (8.4%) |
| 65 to 69 Years | 43 (5.0%) | 34 (3.2%) |
| 70 to 74 Years | 22 (2.6%) | 16 (1.5%) |
| 75 to 79 Years | 20 (2.3%) | 30 (2.8%) |
| 80 to 84 Years | 7 (0.8%) | 15 (1.4%) |
| 85 Years and over | 7 (0.8%) | 27 (2.5%) |
| Total | 855 (100.0%) | 1,059 (100.0%) |
Families and Households in Chelsea
Median Family Size in Chelsea
The median family size in Chelsea is 3.09 persons per family, with married-couple families (297 | 60.1%) accounting for the largest median family size of 3.2 persons per family. On the other hand, single male/father families (39 | 7.9%) represent the smallest median family size with 2.69 persons per family.
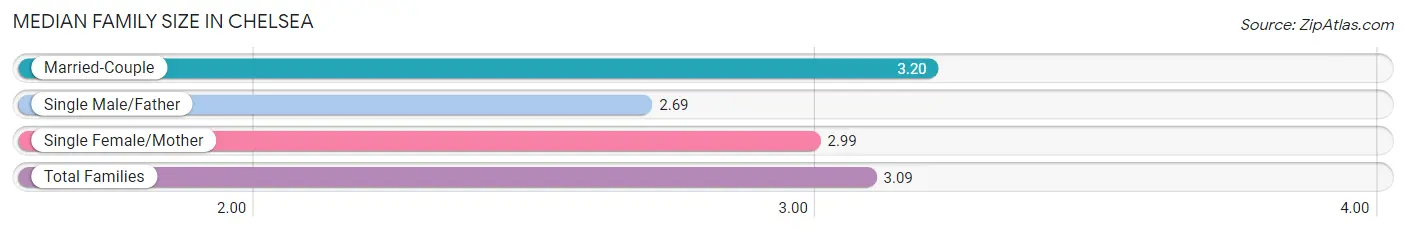
| Family Type | # Families | Family Size |
| Married-Couple | 297 (60.1%) | 3.20 |
| Single Male/Father | 39 (7.9%) | 2.69 |
| Single Female/Mother | 158 (32.0%) | 2.99 |
| Total Families | 494 (100.0%) | 3.09 |
Median Household Size in Chelsea
The median household size in Chelsea is 2.58 persons per household, with single male/father households (39 | 5.2%) accounting for the largest median household size of 3.44 persons per household. non-family households (249 | 33.5%) represent the smallest median household size with 1.09 persons per household.
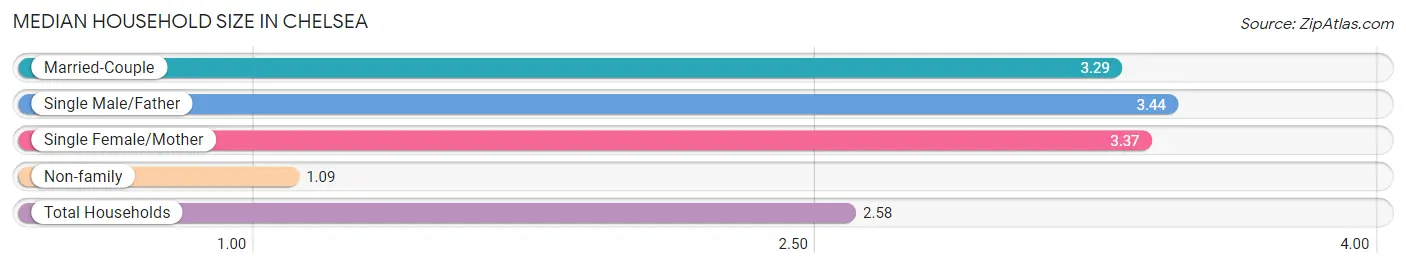
| Household Type | # Households | Household Size |
| Married-Couple | 297 (40.0%) | 3.29 |
| Single Male/Father | 39 (5.2%) | 3.44 |
| Single Female/Mother | 158 (21.3%) | 3.37 |
| Non-family | 249 (33.5%) | 1.09 |
| Total Households | 743 (100.0%) | 2.58 |
Household Size by Marriage Status in Chelsea
Out of a total of 743 households in Chelsea, 494 (66.5%) are family households, while 249 (33.5%) are nonfamily households. The most numerous type of family households are 2-person households, comprising 190, and the most common type of nonfamily households are 1-person households, comprising 218.
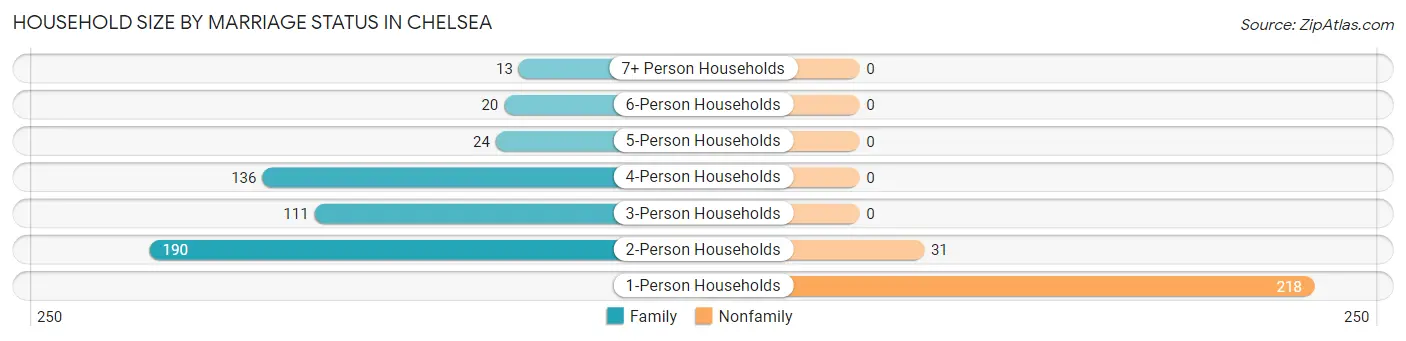
| Household Size | Family Households | Nonfamily Households |
| 1-Person Households | - | 218 (29.3%) |
| 2-Person Households | 190 (25.6%) | 31 (4.2%) |
| 3-Person Households | 111 (14.9%) | 0 (0.0%) |
| 4-Person Households | 136 (18.3%) | 0 (0.0%) |
| 5-Person Households | 24 (3.2%) | 0 (0.0%) |
| 6-Person Households | 20 (2.7%) | 0 (0.0%) |
| 7+ Person Households | 13 (1.8%) | 0 (0.0%) |
| Total | 494 (66.5%) | 249 (33.5%) |
Female Fertility in Chelsea
Fertility by Age in Chelsea
Average fertility rate in Chelsea is 47.0 births per 1,000 women. Women in the age bracket of 20 to 34 years have the highest fertility rate with 97.0 births per 1,000 women. Women in the age bracket of 20 to 34 years acount for 100.0% of all women with births.
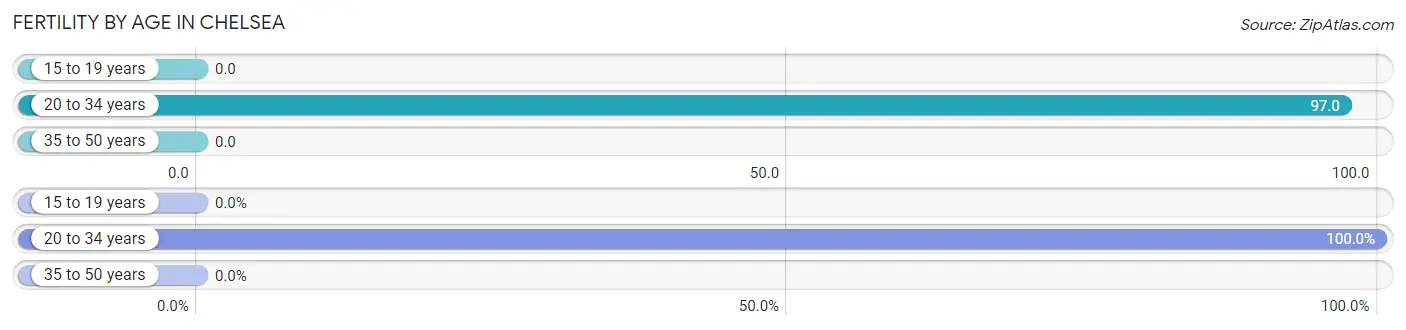
| Age Bracket | Women with Births | Births / 1,000 Women |
| 15 to 19 years | 0 (0.0%) | 0.0 |
| 20 to 34 years | 25 (100.0%) | 97.0 |
| 35 to 50 years | 0 (0.0%) | 0.0 |
| Total | 25 (100.0%) | 47.0 |
Fertility by Age by Marriage Status in Chelsea
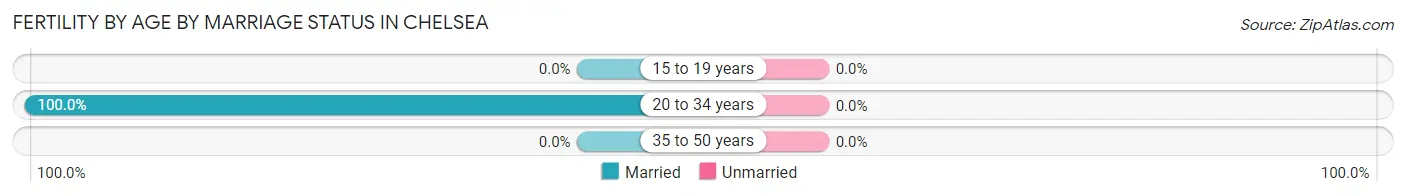
| Age Bracket | Married | Unmarried |
| 15 to 19 years | 0 (0.0%) | 0 (0.0%) |
| 20 to 34 years | 25 (100.0%) | 0 (0.0%) |
| 35 to 50 years | 0 (0.0%) | 0 (0.0%) |
| Total | 25 (100.0%) | 0 (0.0%) |
Fertility by Education in Chelsea
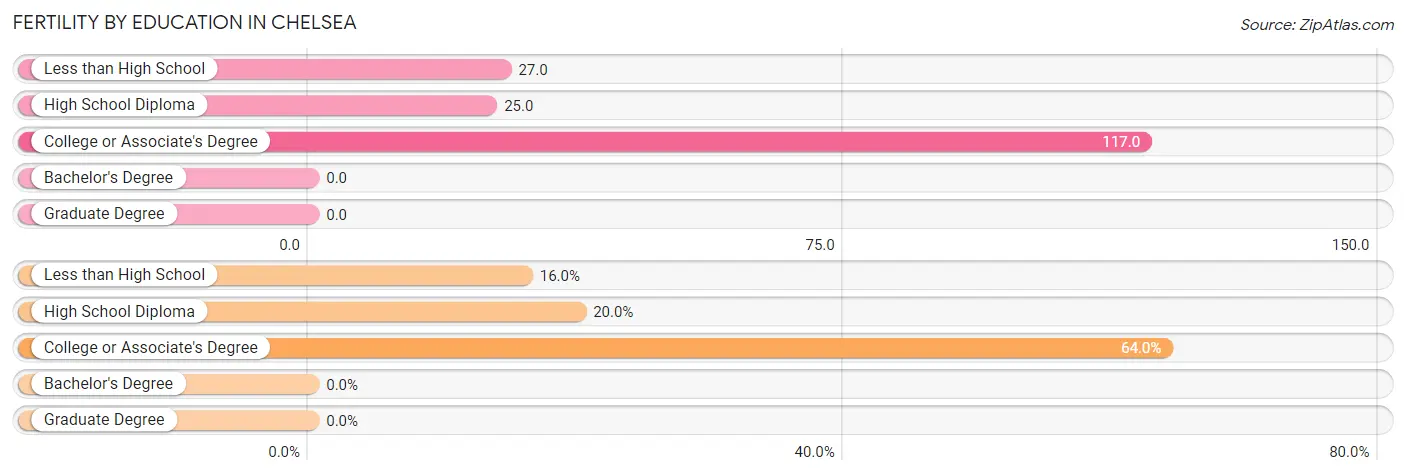
| Educational Attainment | Women with Births | Births / 1,000 Women |
| Less than High School | 4 (16.0%) | 27.0 |
| High School Diploma | 5 (20.0%) | 25.0 |
| College or Associate's Degree | 16 (64.0%) | 117.0 |
| Bachelor's Degree | 0 (0.0%) | 0.0 |
| Graduate Degree | 0 (0.0%) | 0.0 |
| Total | 25 (100.0%) | 47.0 |
Fertility by Education by Marriage Status in Chelsea
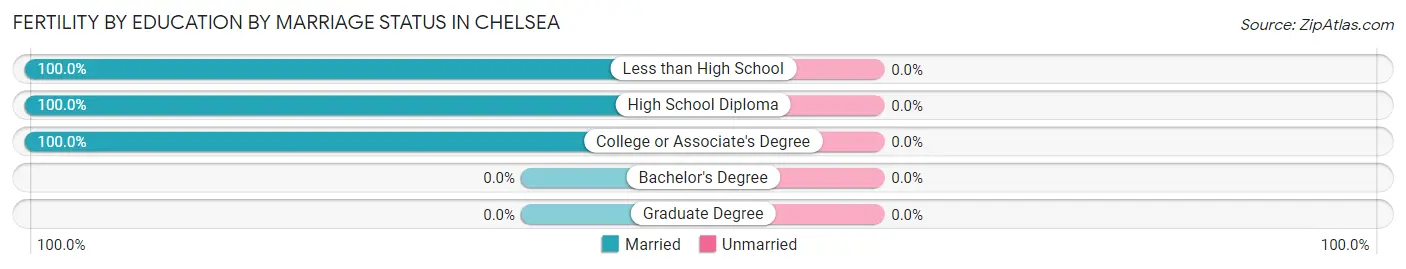
| Educational Attainment | Married | Unmarried |
| Less than High School | 4 (100.0%) | 0 (0.0%) |
| High School Diploma | 5 (100.0%) | 0 (0.0%) |
| College or Associate's Degree | 16 (100.0%) | 0 (0.0%) |
| Bachelor's Degree | 0 (0.0%) | 0 (0.0%) |
| Graduate Degree | 0 (0.0%) | 0 (0.0%) |
| Total | 25 (100.0%) | 0 (0.0%) |
Employment Characteristics in Chelsea
Employment by Class of Employer in Chelsea
Among the 788 employed individuals in Chelsea, private company employees (578 | 73.4%), self-employed (not incorporated) (84 | 10.7%), and local government employees (57 | 7.2%) make up the most common classes of employment.
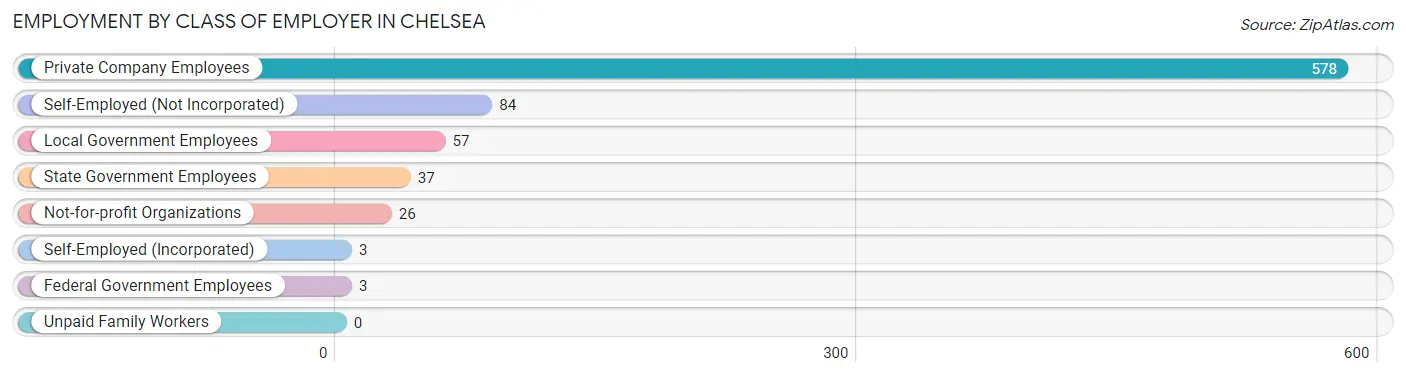
| Employer Class | # Employees | % Employees |
| Private Company Employees | 578 | 73.4% |
| Self-Employed (Incorporated) | 3 | 0.4% |
| Self-Employed (Not Incorporated) | 84 | 10.7% |
| Not-for-profit Organizations | 26 | 3.3% |
| Local Government Employees | 57 | 7.2% |
| State Government Employees | 37 | 4.7% |
| Federal Government Employees | 3 | 0.4% |
| Unpaid Family Workers | 0 | 0.0% |
| Total | 788 | 100.0% |
Employment Status by Age in Chelsea
According to the labor force statistics for Chelsea, out of the total population over 16 years of age (1,504), 59.6% or 896 individuals are in the labor force, with 12.1% or 108 of them unemployed. The age group with the highest labor force participation rate is 30 to 34 years, with 87.5% or 105 individuals in the labor force. Within the labor force, the 20 to 24 years age range has the highest percentage of unemployed individuals, with 28.1% or 34 of them being unemployed.
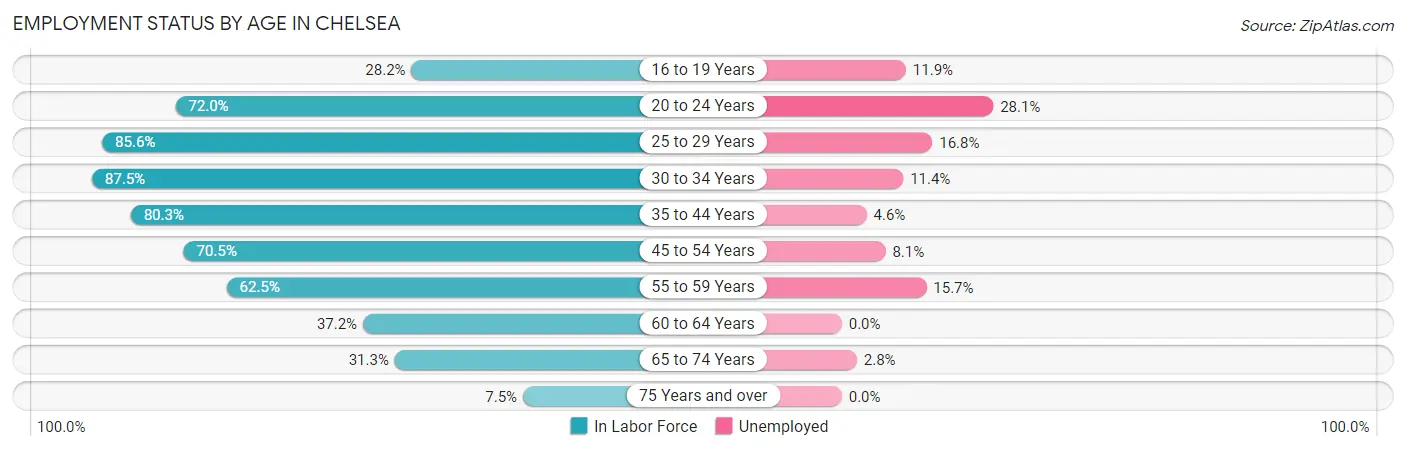
| Age Bracket | In Labor Force | Unemployed |
| 16 to 19 Years | 42 (28.2%) | 5 (11.9%) |
| 20 to 24 Years | 121 (72.0%) | 34 (28.1%) |
| 25 to 29 Years | 149 (85.6%) | 25 (16.8%) |
| 30 to 34 Years | 105 (87.5%) | 12 (11.4%) |
| 35 to 44 Years | 151 (80.3%) | 7 (4.6%) |
| 45 to 54 Years | 160 (70.5%) | 13 (8.1%) |
| 55 to 59 Years | 70 (62.5%) | 11 (15.7%) |
| 60 to 64 Years | 54 (37.2%) | 0 (0.0%) |
| 65 to 74 Years | 36 (31.3%) | 1 (2.8%) |
| 75 Years and over | 8 (7.5%) | 0 (0.0%) |
| Total | 896 (59.6%) | 108 (12.1%) |
Employment Status by Educational Attainment in Chelsea
According to labor force statistics for Chelsea, 71.3% of individuals (689) out of the total population between 25 and 64 years of age (966) are in the labor force, with 9.9% or 68 of them being unemployed. The group with the highest labor force participation rate are those with the educational attainment of bachelor's degree or higher, with 77.9% or 81 individuals in the labor force. Within the labor force, individuals with less than high school education have the highest percentage of unemployment, with 20.9% or 23 of them being unemployed.
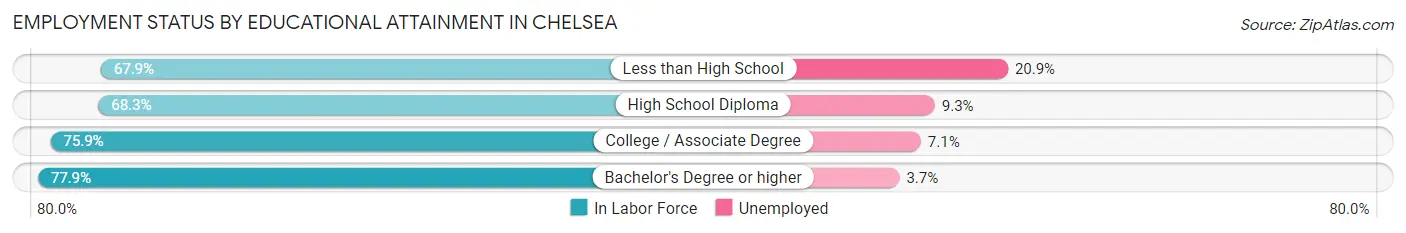
| Educational Attainment | In Labor Force | Unemployed |
| Less than High School | 110 (67.9%) | 34 (20.9%) |
| High School Diploma | 300 (68.3%) | 41 (9.3%) |
| College / Associate Degree | 198 (75.9%) | 19 (7.1%) |
| Bachelor's Degree or higher | 81 (77.9%) | 4 (3.7%) |
| Total | 689 (71.3%) | 96 (9.9%) |
Employment Occupations by Sex in Chelsea
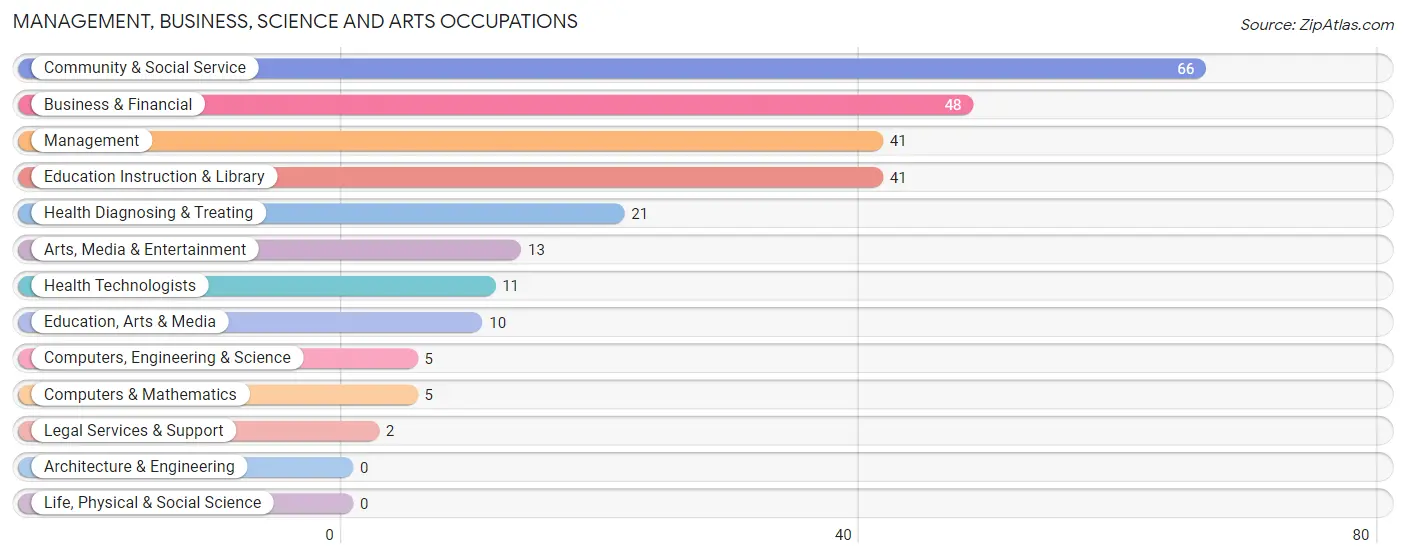
Management, Business, Science and Arts Occupations
The most common Management, Business, Science and Arts occupations in Chelsea are Community & Social Service (66 | 8.4%), Business & Financial (48 | 6.1%), Management (41 | 5.2%), Education Instruction & Library (41 | 5.2%), and Health Diagnosing & Treating (21 | 2.7%).
Management, Business, Science and Arts Occupations by Sex
Within the Management, Business, Science and Arts occupations in Chelsea, the most male-oriented occupations are Management (56.1%), Business & Financial (35.4%), and Education Instruction & Library (12.2%), while the most female-oriented occupations are Computers, Engineering & Science (100.0%), Computers & Mathematics (100.0%), and Education, Arts & Media (100.0%).
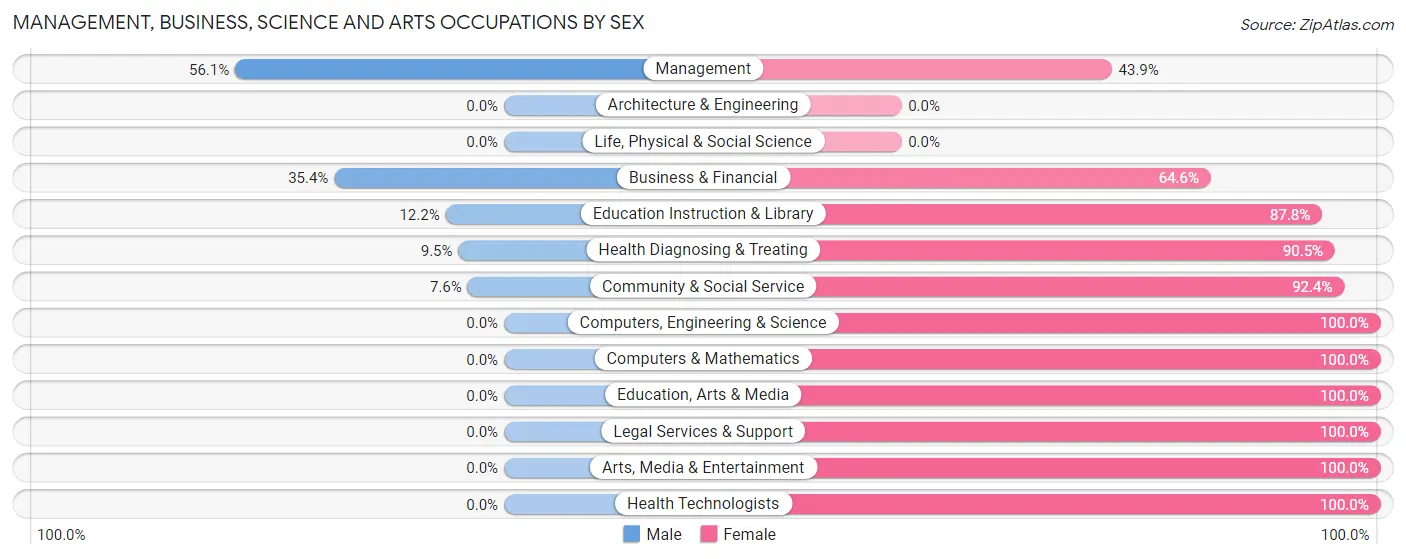
| Occupation | Male | Female |
| Management | 23 (56.1%) | 18 (43.9%) |
| Business & Financial | 17 (35.4%) | 31 (64.6%) |
| Computers, Engineering & Science | 0 (0.0%) | 5 (100.0%) |
| Computers & Mathematics | 0 (0.0%) | 5 (100.0%) |
| Architecture & Engineering | 0 (0.0%) | 0 (0.0%) |
| Life, Physical & Social Science | 0 (0.0%) | 0 (0.0%) |
| Community & Social Service | 5 (7.6%) | 61 (92.4%) |
| Education, Arts & Media | 0 (0.0%) | 10 (100.0%) |
| Legal Services & Support | 0 (0.0%) | 2 (100.0%) |
| Education Instruction & Library | 5 (12.2%) | 36 (87.8%) |
| Arts, Media & Entertainment | 0 (0.0%) | 13 (100.0%) |
| Health Diagnosing & Treating | 2 (9.5%) | 19 (90.5%) |
| Health Technologists | 0 (0.0%) | 11 (100.0%) |
| Total (Category) | 47 (26.0%) | 134 (74.0%) |
| Total (Overall) | 388 (49.2%) | 400 (50.8%) |
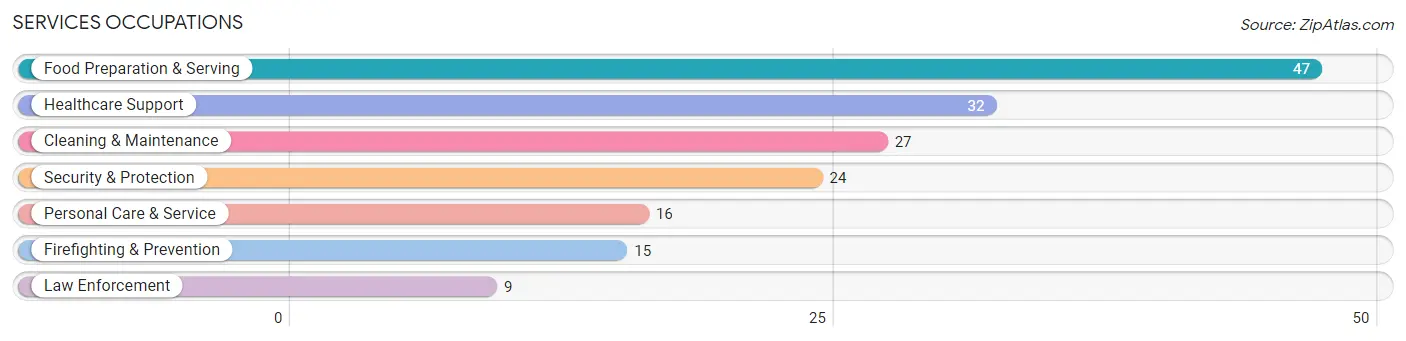
Services Occupations
The most common Services occupations in Chelsea are Food Preparation & Serving (47 | 6.0%), Healthcare Support (32 | 4.1%), Cleaning & Maintenance (27 | 3.4%), Security & Protection (24 | 3.0%), and Personal Care & Service (16 | 2.0%).
Services Occupations by Sex
Within the Services occupations in Chelsea, the most male-oriented occupations are Law Enforcement (100.0%), Security & Protection (79.2%), and Firefighting & Prevention (66.7%), while the most female-oriented occupations are Healthcare Support (100.0%), Food Preparation & Serving (83.0%), and Personal Care & Service (62.5%).
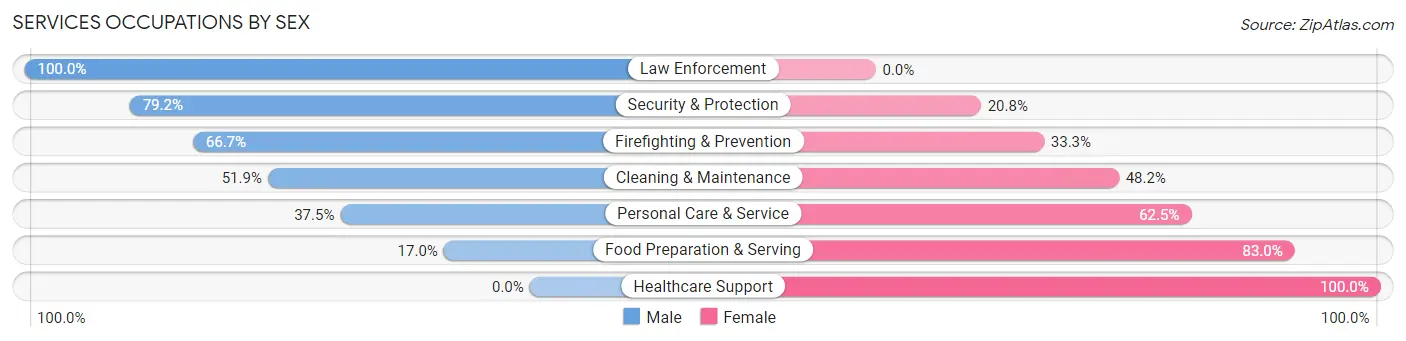
| Occupation | Male | Female |
| Healthcare Support | 0 (0.0%) | 32 (100.0%) |
| Security & Protection | 19 (79.2%) | 5 (20.8%) |
| Firefighting & Prevention | 10 (66.7%) | 5 (33.3%) |
| Law Enforcement | 9 (100.0%) | 0 (0.0%) |
| Food Preparation & Serving | 8 (17.0%) | 39 (83.0%) |
| Cleaning & Maintenance | 14 (51.8%) | 13 (48.1%) |
| Personal Care & Service | 6 (37.5%) | 10 (62.5%) |
| Total (Category) | 47 (32.2%) | 99 (67.8%) |
| Total (Overall) | 388 (49.2%) | 400 (50.8%) |
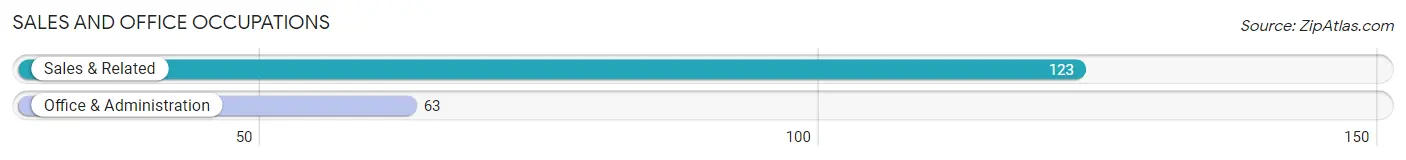
Sales and Office Occupations
The most common Sales and Office occupations in Chelsea are Sales & Related (123 | 15.6%), and Office & Administration (63 | 8.0%).
Sales and Office Occupations by Sex
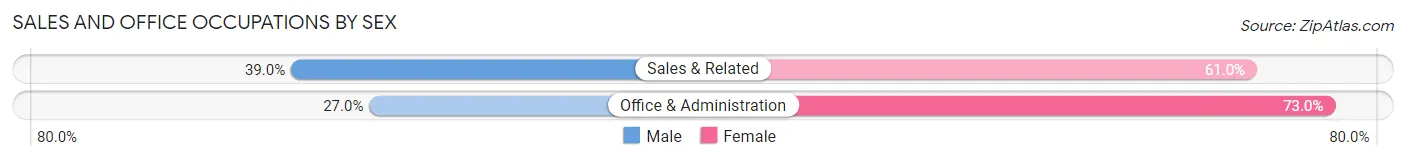
| Occupation | Male | Female |
| Sales & Related | 48 (39.0%) | 75 (61.0%) |
| Office & Administration | 17 (27.0%) | 46 (73.0%) |
| Total (Category) | 65 (34.9%) | 121 (65.0%) |
| Total (Overall) | 388 (49.2%) | 400 (50.8%) |
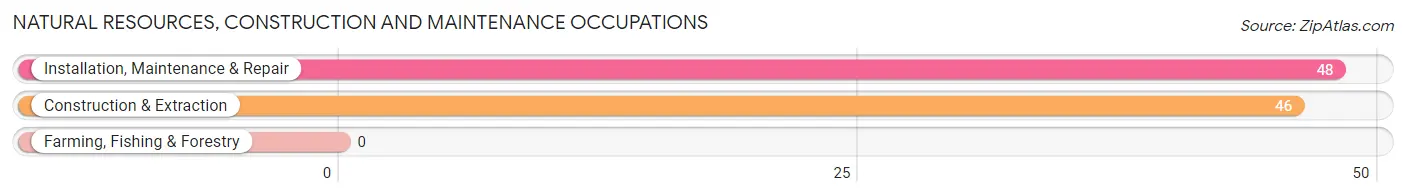
Natural Resources, Construction and Maintenance Occupations
The most common Natural Resources, Construction and Maintenance occupations in Chelsea are Installation, Maintenance & Repair (48 | 6.1%), and Construction & Extraction (46 | 5.8%).
Natural Resources, Construction and Maintenance Occupations by Sex
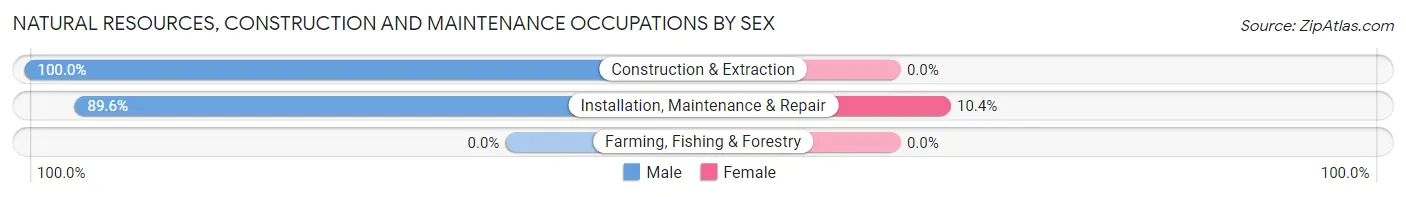
| Occupation | Male | Female |
| Farming, Fishing & Forestry | 0 (0.0%) | 0 (0.0%) |
| Construction & Extraction | 46 (100.0%) | 0 (0.0%) |
| Installation, Maintenance & Repair | 43 (89.6%) | 5 (10.4%) |
| Total (Category) | 89 (94.7%) | 5 (5.3%) |
| Total (Overall) | 388 (49.2%) | 400 (50.8%) |
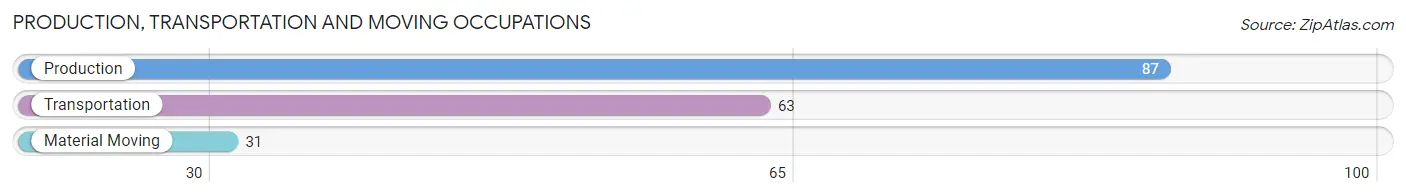
Production, Transportation and Moving Occupations
The most common Production, Transportation and Moving occupations in Chelsea are Production (87 | 11.0%), Transportation (63 | 8.0%), and Material Moving (31 | 3.9%).
Production, Transportation and Moving Occupations by Sex
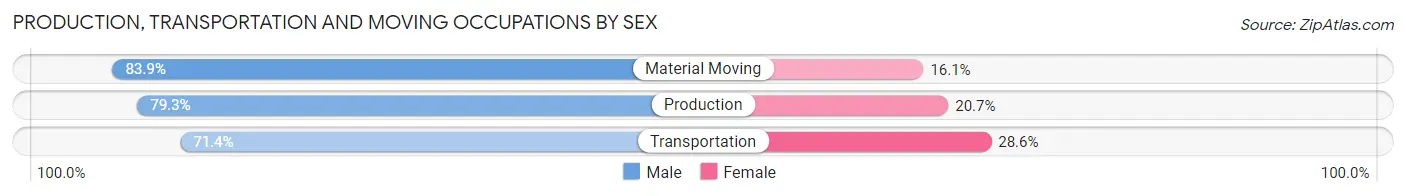
| Occupation | Male | Female |
| Production | 69 (79.3%) | 18 (20.7%) |
| Transportation | 45 (71.4%) | 18 (28.6%) |
| Material Moving | 26 (83.9%) | 5 (16.1%) |
| Total (Category) | 140 (77.3%) | 41 (22.7%) |
| Total (Overall) | 388 (49.2%) | 400 (50.8%) |
Employment Industries by Sex in Chelsea
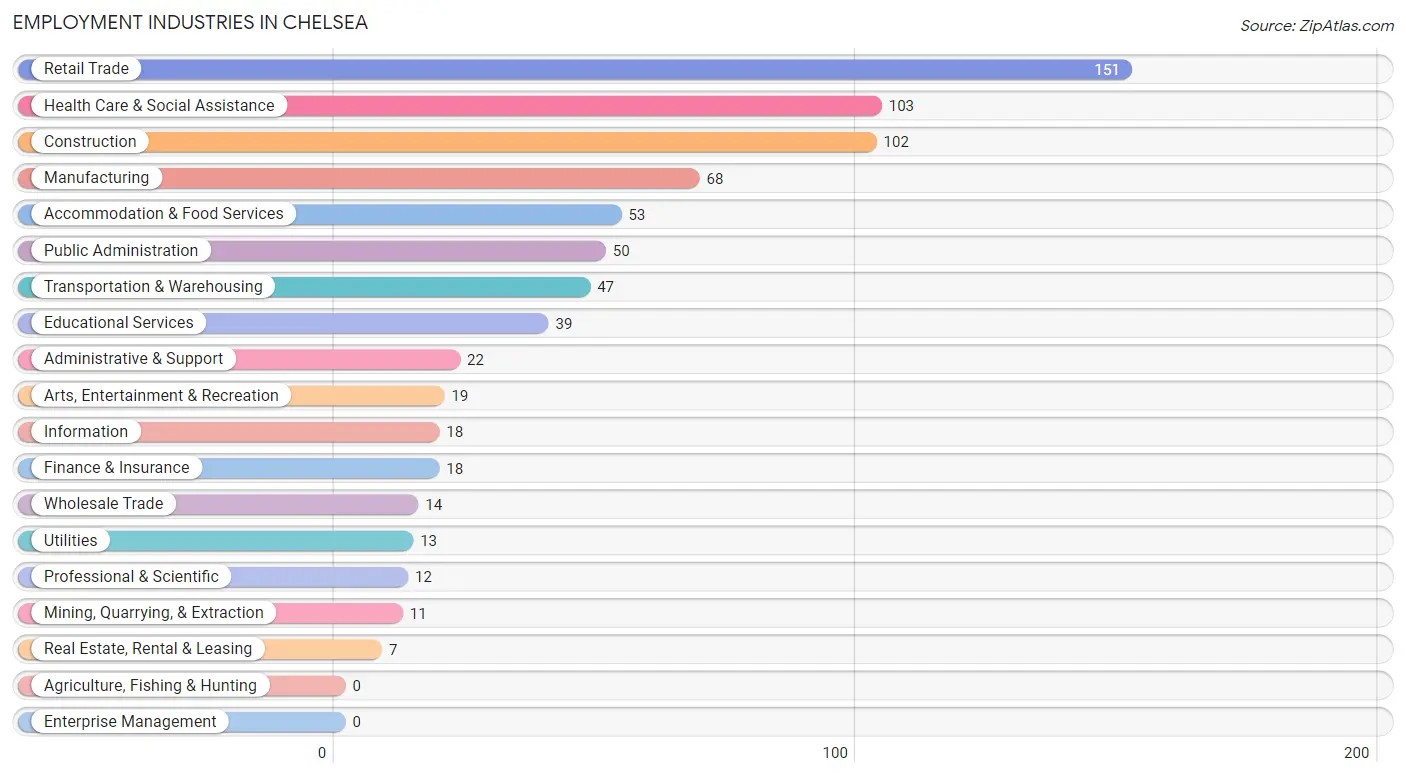
Employment Industries in Chelsea
The major employment industries in Chelsea include Retail Trade (151 | 19.2%), Health Care & Social Assistance (103 | 13.1%), Construction (102 | 12.9%), Manufacturing (68 | 8.6%), and Accommodation & Food Services (53 | 6.7%).
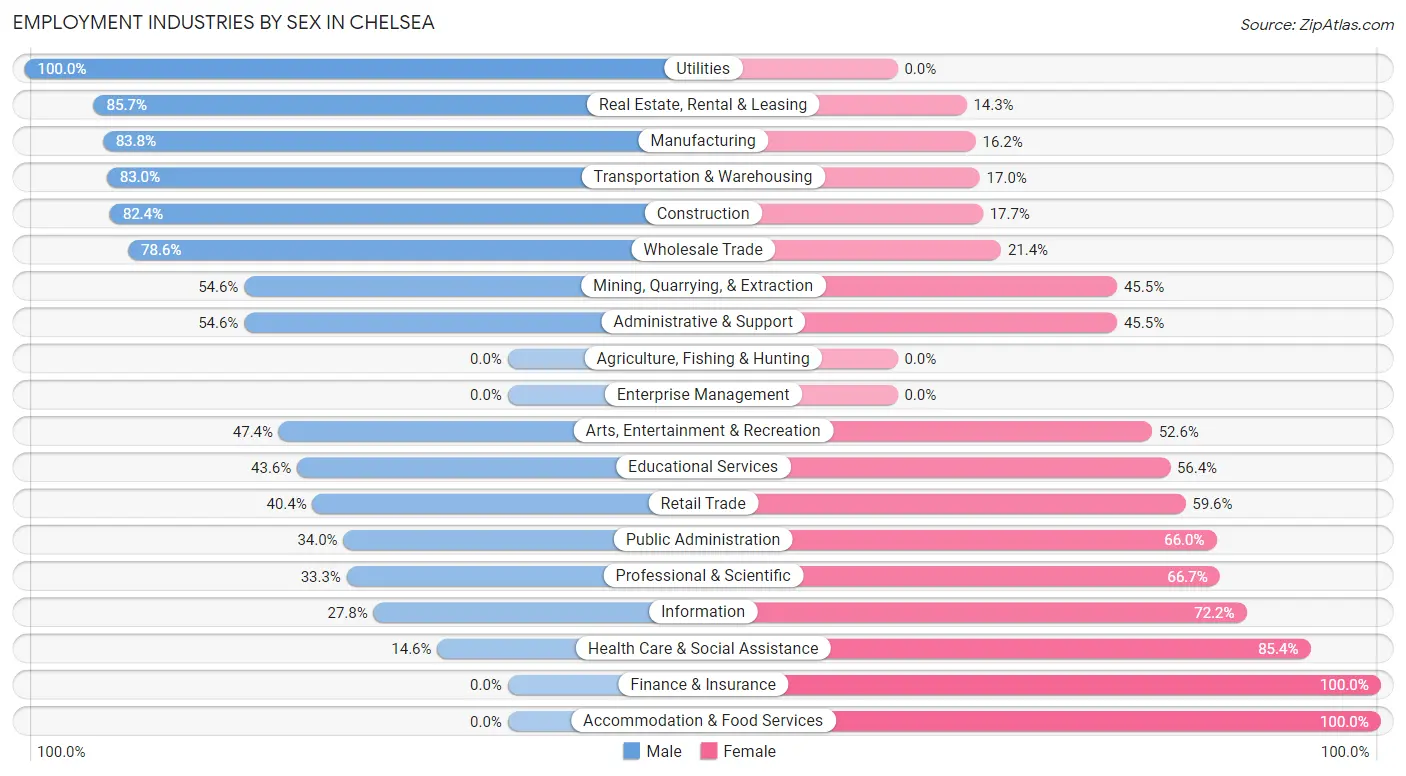
Employment Industries by Sex in Chelsea
The Chelsea industries that see more men than women are Utilities (100.0%), Real Estate, Rental & Leasing (85.7%), and Manufacturing (83.8%), whereas the industries that tend to have a higher number of women are Finance & Insurance (100.0%), Accommodation & Food Services (100.0%), and Health Care & Social Assistance (85.4%).
| Industry | Male | Female |
| Agriculture, Fishing & Hunting | 0 (0.0%) | 0 (0.0%) |
| Mining, Quarrying, & Extraction | 6 (54.5%) | 5 (45.5%) |
| Construction | 84 (82.4%) | 18 (17.6%) |
| Manufacturing | 57 (83.8%) | 11 (16.2%) |
| Wholesale Trade | 11 (78.6%) | 3 (21.4%) |
| Retail Trade | 61 (40.4%) | 90 (59.6%) |
| Transportation & Warehousing | 39 (83.0%) | 8 (17.0%) |
| Utilities | 13 (100.0%) | 0 (0.0%) |
| Information | 5 (27.8%) | 13 (72.2%) |
| Finance & Insurance | 0 (0.0%) | 18 (100.0%) |
| Real Estate, Rental & Leasing | 6 (85.7%) | 1 (14.3%) |
| Professional & Scientific | 4 (33.3%) | 8 (66.7%) |
| Enterprise Management | 0 (0.0%) | 0 (0.0%) |
| Administrative & Support | 12 (54.5%) | 10 (45.5%) |
| Educational Services | 17 (43.6%) | 22 (56.4%) |
| Health Care & Social Assistance | 15 (14.6%) | 88 (85.4%) |
| Arts, Entertainment & Recreation | 9 (47.4%) | 10 (52.6%) |
| Accommodation & Food Services | 0 (0.0%) | 53 (100.0%) |
| Public Administration | 17 (34.0%) | 33 (66.0%) |
| Total | 388 (49.2%) | 400 (50.8%) |
Education in Chelsea
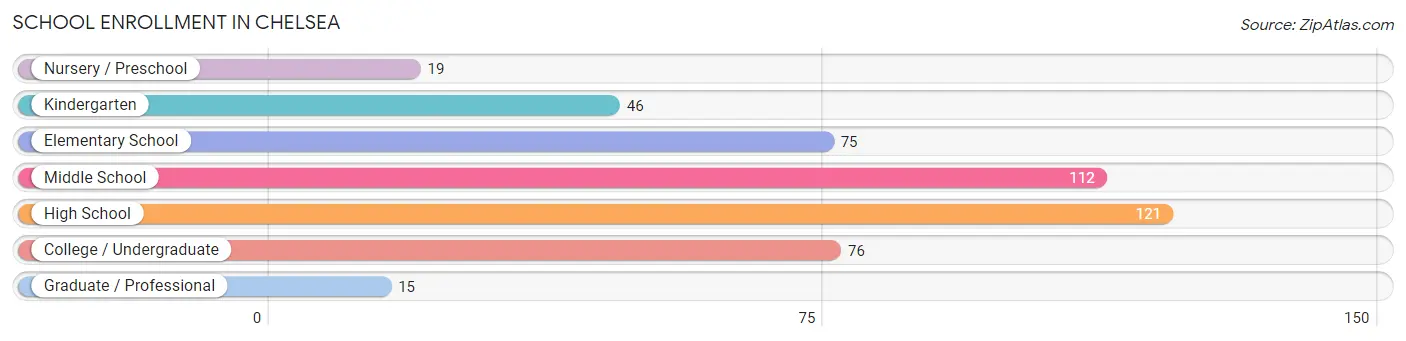
School Enrollment in Chelsea
The most common levels of schooling among the 464 students in Chelsea are high school (121 | 26.1%), middle school (112 | 24.1%), and college / undergraduate (76 | 16.4%).
| School Level | # Students | % Students |
| Nursery / Preschool | 19 | 4.1% |
| Kindergarten | 46 | 9.9% |
| Elementary School | 75 | 16.2% |
| Middle School | 112 | 24.1% |
| High School | 121 | 26.1% |
| College / Undergraduate | 76 | 16.4% |
| Graduate / Professional | 15 | 3.2% |
| Total | 464 | 100.0% |
School Enrollment by Age by Funding Source in Chelsea
Out of a total of 464 students who are enrolled in schools in Chelsea, 55 (11.9%) attend a private institution, while the remaining 409 (88.1%) are enrolled in public schools. The age group of 35 years and over has the highest likelihood of being enrolled in private schools, with 12 (70.6% in the age bracket) enrolled. Conversely, the age group of 3 to 4 year olds has the lowest likelihood of being enrolled in a private school, with 11 (100.0% in the age bracket) attending a public institution.
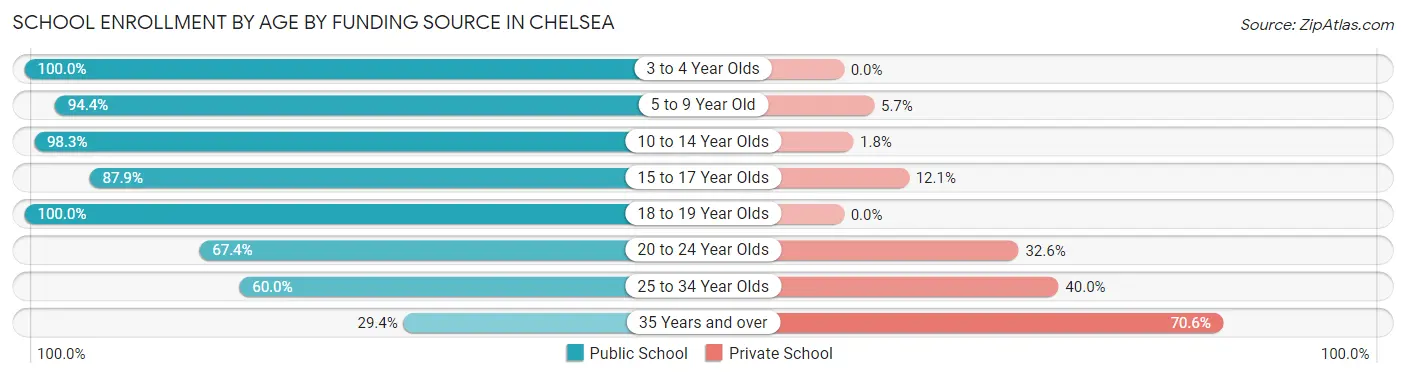
| Age Bracket | Public School | Private School |
| 3 to 4 Year Olds | 11 (100.0%) | 0 (0.0%) |
| 5 to 9 Year Old | 117 (94.4%) | 7 (5.7%) |
| 10 to 14 Year Olds | 112 (98.3%) | 2 (1.8%) |
| 15 to 17 Year Olds | 87 (87.9%) | 12 (12.1%) |
| 18 to 19 Year Olds | 36 (100.0%) | 0 (0.0%) |
| 20 to 24 Year Olds | 29 (67.4%) | 14 (32.6%) |
| 25 to 34 Year Olds | 12 (60.0%) | 8 (40.0%) |
| 35 Years and over | 5 (29.4%) | 12 (70.6%) |
| Total | 409 (88.1%) | 55 (11.9%) |
Educational Attainment by Field of Study in Chelsea
Business (31 | 23.8%), science & technology (24 | 18.5%), physical & health sciences (12 | 9.2%), arts & humanities (12 | 9.2%), and education (11 | 8.5%) are the most common fields of study among 130 individuals in Chelsea who have obtained a bachelor's degree or higher.
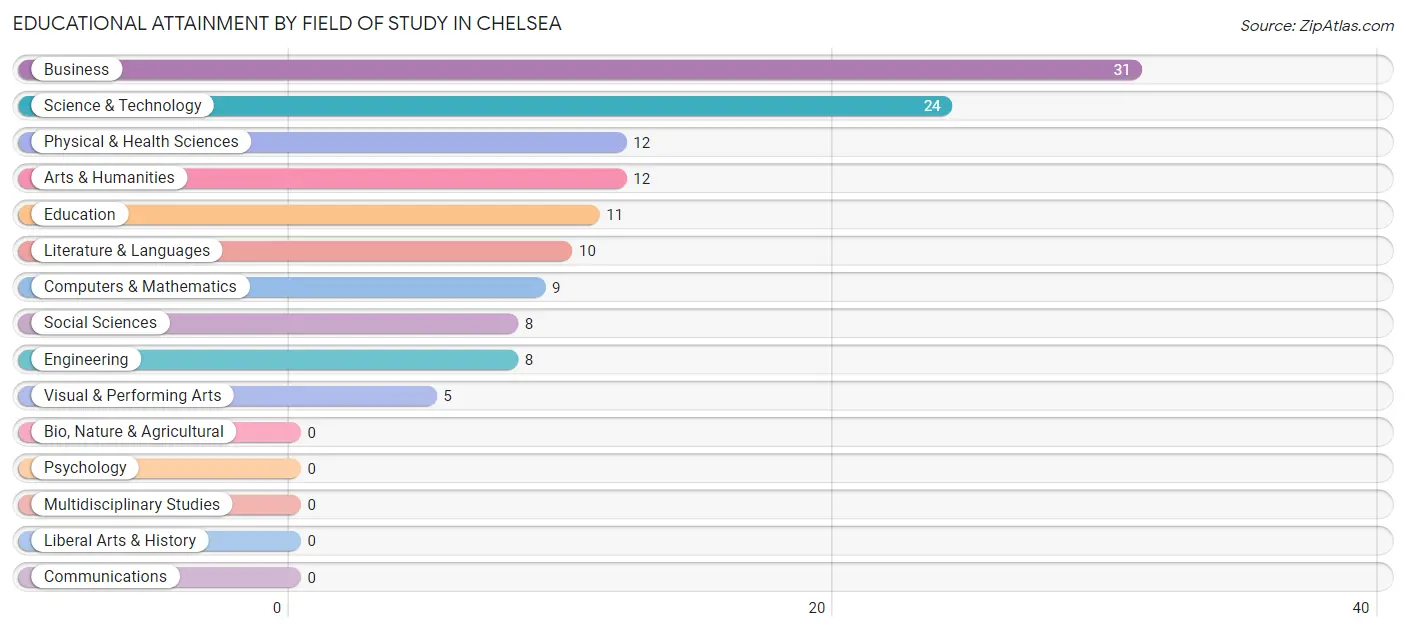
| Field of Study | # Graduates | % Graduates |
| Computers & Mathematics | 9 | 6.9% |
| Bio, Nature & Agricultural | 0 | 0.0% |
| Physical & Health Sciences | 12 | 9.2% |
| Psychology | 0 | 0.0% |
| Social Sciences | 8 | 6.1% |
| Engineering | 8 | 6.1% |
| Multidisciplinary Studies | 0 | 0.0% |
| Science & Technology | 24 | 18.5% |
| Business | 31 | 23.8% |
| Education | 11 | 8.5% |
| Literature & Languages | 10 | 7.7% |
| Liberal Arts & History | 0 | 0.0% |
| Visual & Performing Arts | 5 | 3.8% |
| Communications | 0 | 0.0% |
| Arts & Humanities | 12 | 9.2% |
| Total | 130 | 100.0% |
Transportation & Commute in Chelsea
Vehicle Availability by Sex in Chelsea
The most prevalent vehicle ownership categories in Chelsea are males with 2 vehicles (160, accounting for 41.2%) and females with 2 vehicles (162, making up 40.0%).
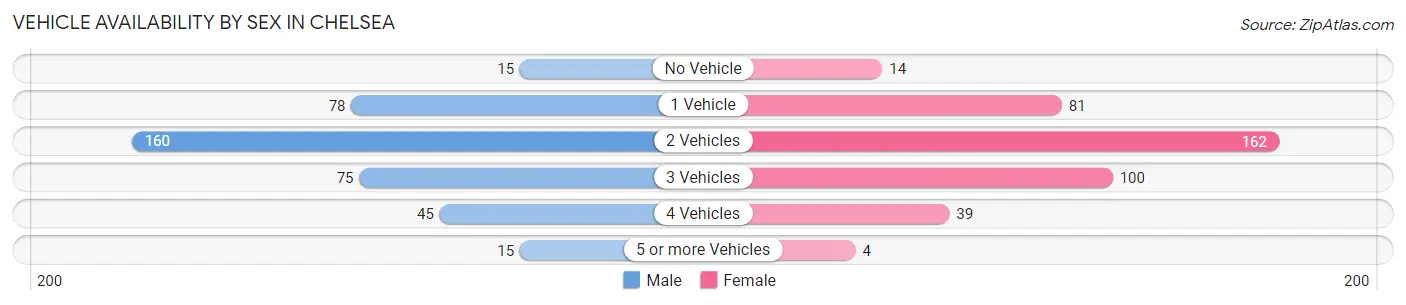
| Vehicles Available | Male | Female |
| No Vehicle | 15 (3.9%) | 14 (3.5%) |
| 1 Vehicle | 78 (20.1%) | 81 (20.3%) |
| 2 Vehicles | 160 (41.2%) | 162 (40.5%) |
| 3 Vehicles | 75 (19.3%) | 100 (25.0%) |
| 4 Vehicles | 45 (11.6%) | 39 (9.8%) |
| 5 or more Vehicles | 15 (3.9%) | 4 (1.0%) |
| Total | 388 (100.0%) | 400 (100.0%) |
Commute Time in Chelsea
The most frequently occuring commute durations in Chelsea are 20 to 24 minutes (147 commuters, 19.2%), 30 to 34 minutes (146 commuters, 19.1%), and 5 to 9 minutes (85 commuters, 11.1%).
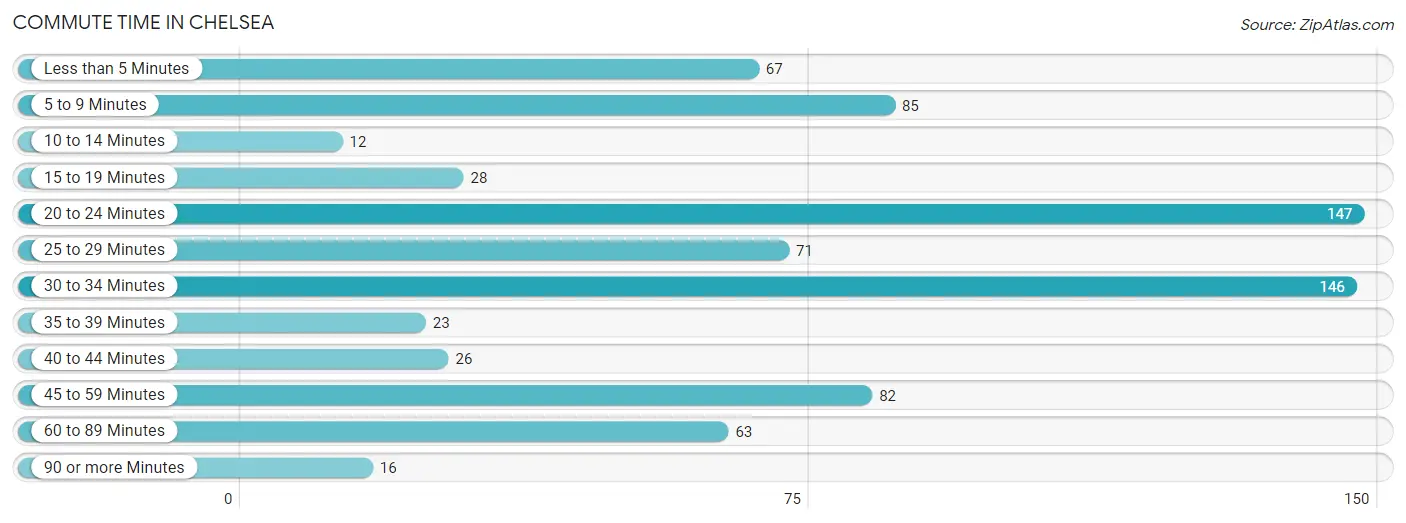
| Commute Time | # Commuters | % Commuters |
| Less than 5 Minutes | 67 | 8.7% |
| 5 to 9 Minutes | 85 | 11.1% |
| 10 to 14 Minutes | 12 | 1.6% |
| 15 to 19 Minutes | 28 | 3.7% |
| 20 to 24 Minutes | 147 | 19.2% |
| 25 to 29 Minutes | 71 | 9.3% |
| 30 to 34 Minutes | 146 | 19.1% |
| 35 to 39 Minutes | 23 | 3.0% |
| 40 to 44 Minutes | 26 | 3.4% |
| 45 to 59 Minutes | 82 | 10.7% |
| 60 to 89 Minutes | 63 | 8.2% |
| 90 or more Minutes | 16 | 2.1% |
Commute Time by Sex in Chelsea
The most common commute times in Chelsea are 30 to 34 minutes (68 commuters, 17.7%) for males and 20 to 24 minutes (85 commuters, 22.3%) for females.
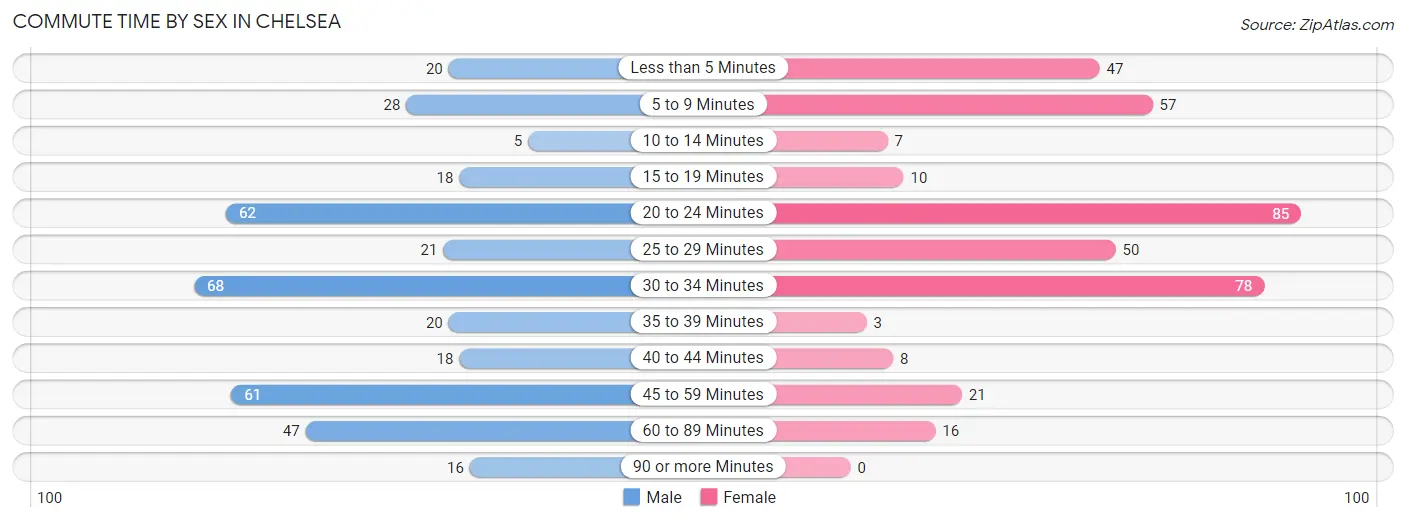
| Commute Time | Male | Female |
| Less than 5 Minutes | 20 (5.2%) | 47 (12.3%) |
| 5 to 9 Minutes | 28 (7.3%) | 57 (14.9%) |
| 10 to 14 Minutes | 5 (1.3%) | 7 (1.8%) |
| 15 to 19 Minutes | 18 (4.7%) | 10 (2.6%) |
| 20 to 24 Minutes | 62 (16.2%) | 85 (22.3%) |
| 25 to 29 Minutes | 21 (5.5%) | 50 (13.1%) |
| 30 to 34 Minutes | 68 (17.7%) | 78 (20.4%) |
| 35 to 39 Minutes | 20 (5.2%) | 3 (0.8%) |
| 40 to 44 Minutes | 18 (4.7%) | 8 (2.1%) |
| 45 to 59 Minutes | 61 (15.9%) | 21 (5.5%) |
| 60 to 89 Minutes | 47 (12.2%) | 16 (4.2%) |
| 90 or more Minutes | 16 (4.2%) | 0 (0.0%) |
Time of Departure to Work by Sex in Chelsea
The most frequent times of departure to work in Chelsea are 6:00 AM to 6:29 AM (71, 18.5%) for males and 12:00 PM to 3:59 PM (53, 13.9%) for females.
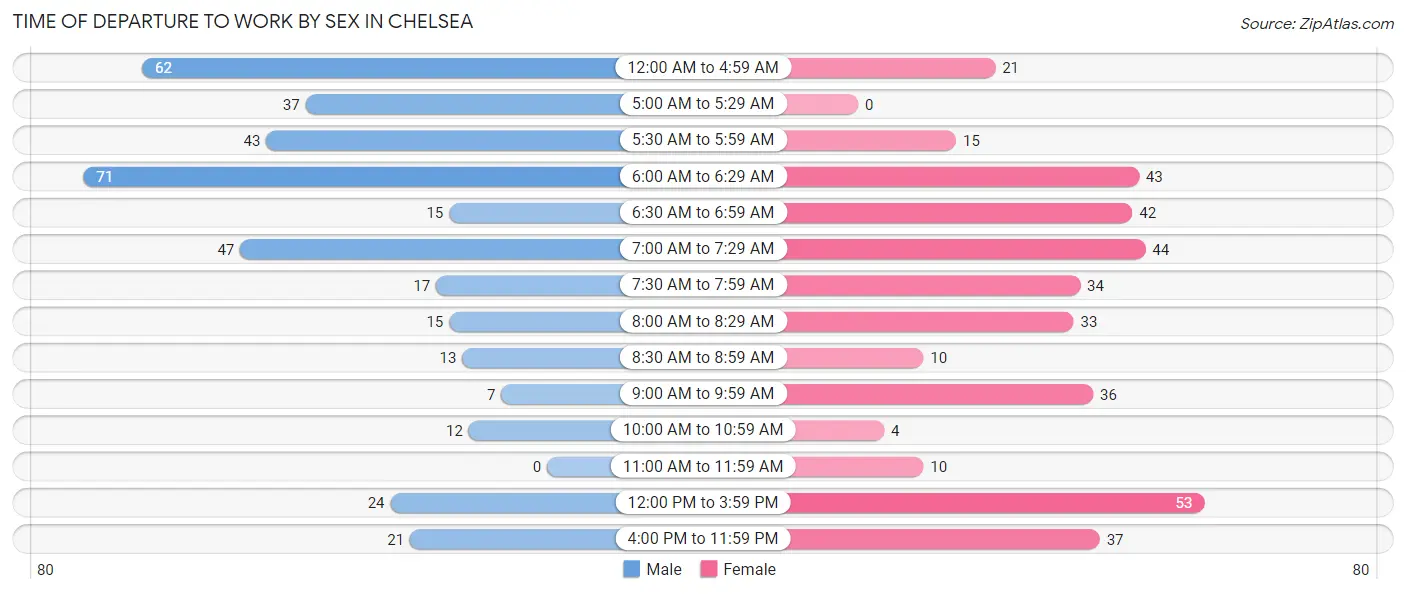
| Time of Departure | Male | Female |
| 12:00 AM to 4:59 AM | 62 (16.2%) | 21 (5.5%) |
| 5:00 AM to 5:29 AM | 37 (9.6%) | 0 (0.0%) |
| 5:30 AM to 5:59 AM | 43 (11.2%) | 15 (3.9%) |
| 6:00 AM to 6:29 AM | 71 (18.5%) | 43 (11.3%) |
| 6:30 AM to 6:59 AM | 15 (3.9%) | 42 (11.0%) |
| 7:00 AM to 7:29 AM | 47 (12.2%) | 44 (11.5%) |
| 7:30 AM to 7:59 AM | 17 (4.4%) | 34 (8.9%) |
| 8:00 AM to 8:29 AM | 15 (3.9%) | 33 (8.6%) |
| 8:30 AM to 8:59 AM | 13 (3.4%) | 10 (2.6%) |
| 9:00 AM to 9:59 AM | 7 (1.8%) | 36 (9.4%) |
| 10:00 AM to 10:59 AM | 12 (3.1%) | 4 (1.1%) |
| 11:00 AM to 11:59 AM | 0 (0.0%) | 10 (2.6%) |
| 12:00 PM to 3:59 PM | 24 (6.2%) | 53 (13.9%) |
| 4:00 PM to 11:59 PM | 21 (5.5%) | 37 (9.7%) |
| Total | 384 (100.0%) | 382 (100.0%) |
Housing Occupancy in Chelsea
Occupancy by Ownership in Chelsea
Of the total 743 dwellings in Chelsea, owner-occupied units account for 434 (58.4%), while renter-occupied units make up 309 (41.6%).
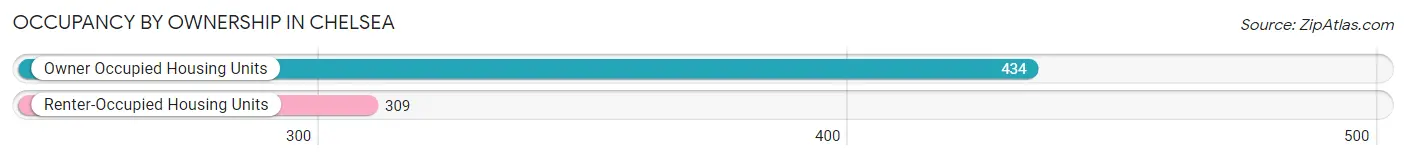
| Occupancy | # Housing Units | % Housing Units |
| Owner Occupied Housing Units | 434 | 58.4% |
| Renter-Occupied Housing Units | 309 | 41.6% |
| Total Occupied Housing Units | 743 | 100.0% |
Occupancy by Household Size in Chelsea
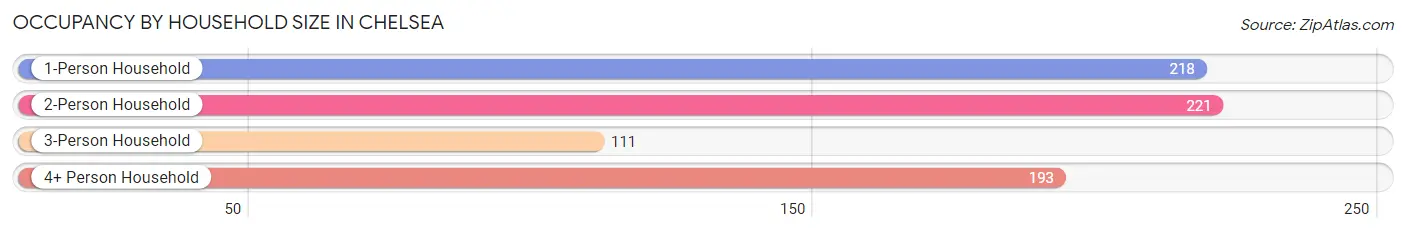
| Household Size | # Housing Units | % Housing Units |
| 1-Person Household | 218 | 29.3% |
| 2-Person Household | 221 | 29.7% |
| 3-Person Household | 111 | 14.9% |
| 4+ Person Household | 193 | 26.0% |
| Total Housing Units | 743 | 100.0% |
Occupancy by Ownership by Household Size in Chelsea
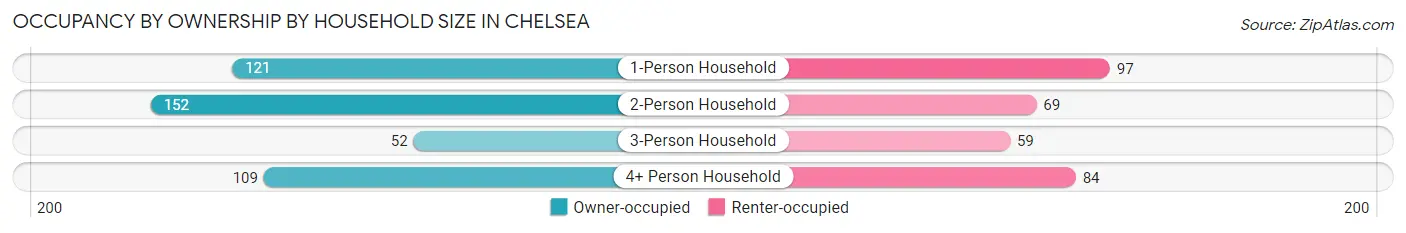
| Household Size | Owner-occupied | Renter-occupied |
| 1-Person Household | 121 (55.5%) | 97 (44.5%) |
| 2-Person Household | 152 (68.8%) | 69 (31.2%) |
| 3-Person Household | 52 (46.9%) | 59 (53.1%) |
| 4+ Person Household | 109 (56.5%) | 84 (43.5%) |
| Total Housing Units | 434 (58.4%) | 309 (41.6%) |
Occupancy by Educational Attainment in Chelsea
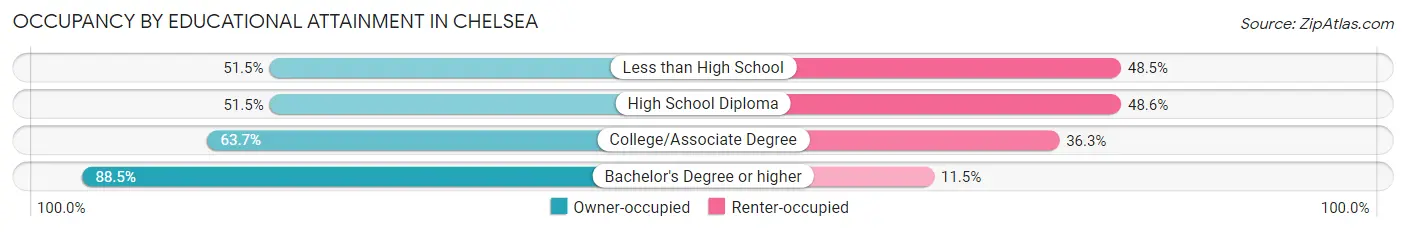
| Household Size | Owner-occupied | Renter-occupied |
| Less than High School | 69 (51.5%) | 65 (48.5%) |
| High School Diploma | 160 (51.4%) | 151 (48.5%) |
| College/Associate Degree | 151 (63.7%) | 86 (36.3%) |
| Bachelor's Degree or higher | 54 (88.5%) | 7 (11.5%) |
Occupancy by Age of Householder in Chelsea
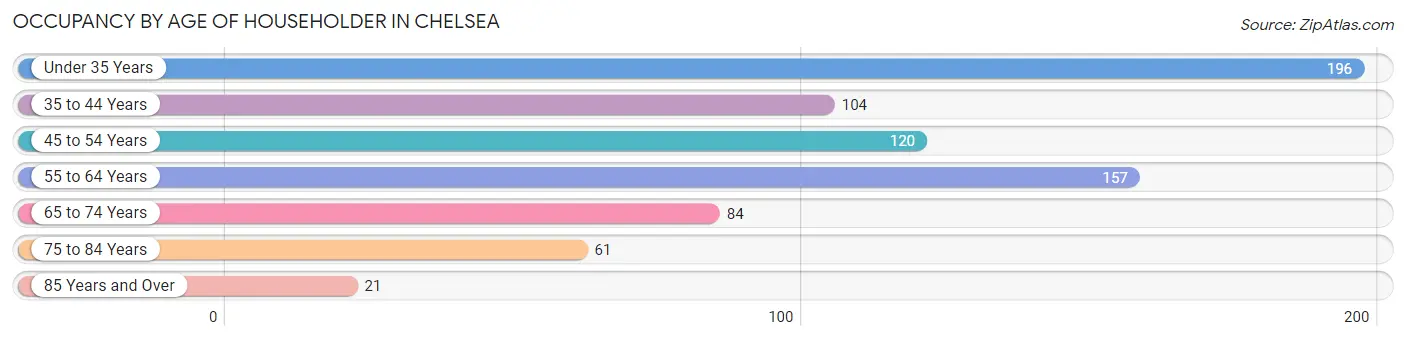
| Age Bracket | # Households | % Households |
| Under 35 Years | 196 | 26.4% |
| 35 to 44 Years | 104 | 14.0% |
| 45 to 54 Years | 120 | 16.2% |
| 55 to 64 Years | 157 | 21.1% |
| 65 to 74 Years | 84 | 11.3% |
| 75 to 84 Years | 61 | 8.2% |
| 85 Years and Over | 21 | 2.8% |
| Total | 743 | 100.0% |
Housing Finances in Chelsea
Median Income by Occupancy in Chelsea
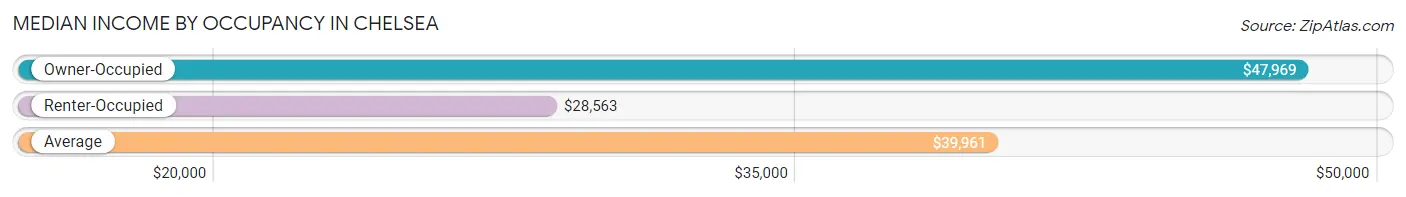
| Occupancy Type | # Households | Median Income |
| Owner-Occupied | 434 (58.4%) | $47,969 |
| Renter-Occupied | 309 (41.6%) | $28,563 |
| Average | 743 (100.0%) | $39,961 |
Occupancy by Householder Income Bracket in Chelsea
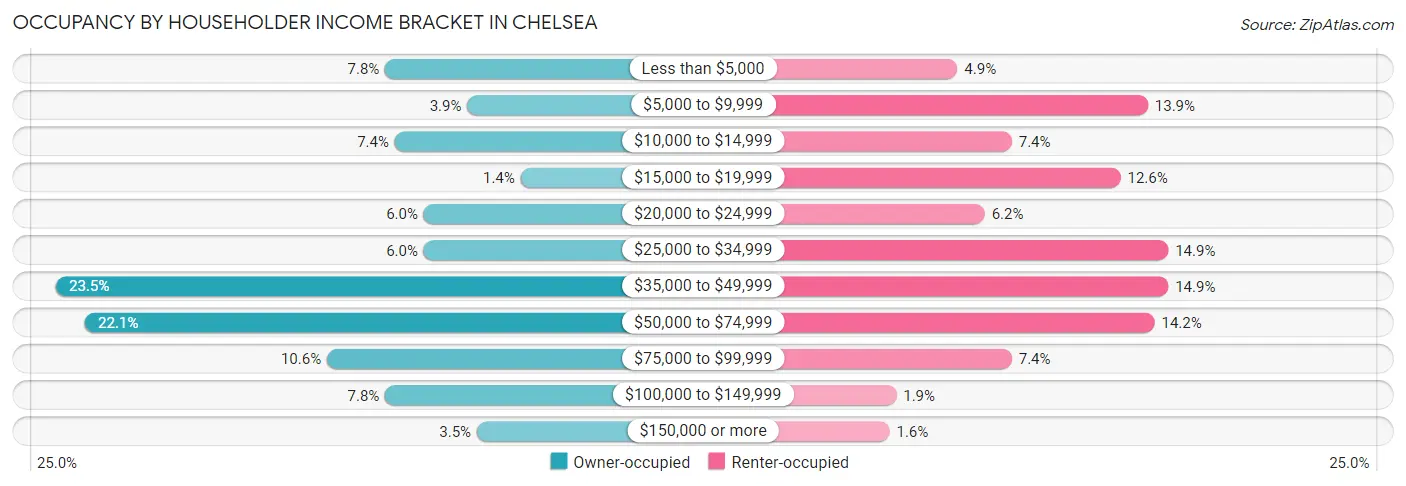
| Income Bracket | Owner-occupied | Renter-occupied |
| Less than $5,000 | 34 (7.8%) | 15 (4.9%) |
| $5,000 to $9,999 | 17 (3.9%) | 43 (13.9%) |
| $10,000 to $14,999 | 32 (7.4%) | 23 (7.4%) |
| $15,000 to $19,999 | 6 (1.4%) | 39 (12.6%) |
| $20,000 to $24,999 | 26 (6.0%) | 19 (6.1%) |
| $25,000 to $34,999 | 26 (6.0%) | 46 (14.9%) |
| $35,000 to $49,999 | 102 (23.5%) | 46 (14.9%) |
| $50,000 to $74,999 | 96 (22.1%) | 44 (14.2%) |
| $75,000 to $99,999 | 46 (10.6%) | 23 (7.4%) |
| $100,000 to $149,999 | 34 (7.8%) | 6 (1.9%) |
| $150,000 or more | 15 (3.5%) | 5 (1.6%) |
| Total | 434 (100.0%) | 309 (100.0%) |
Monthly Housing Cost Tiers in Chelsea
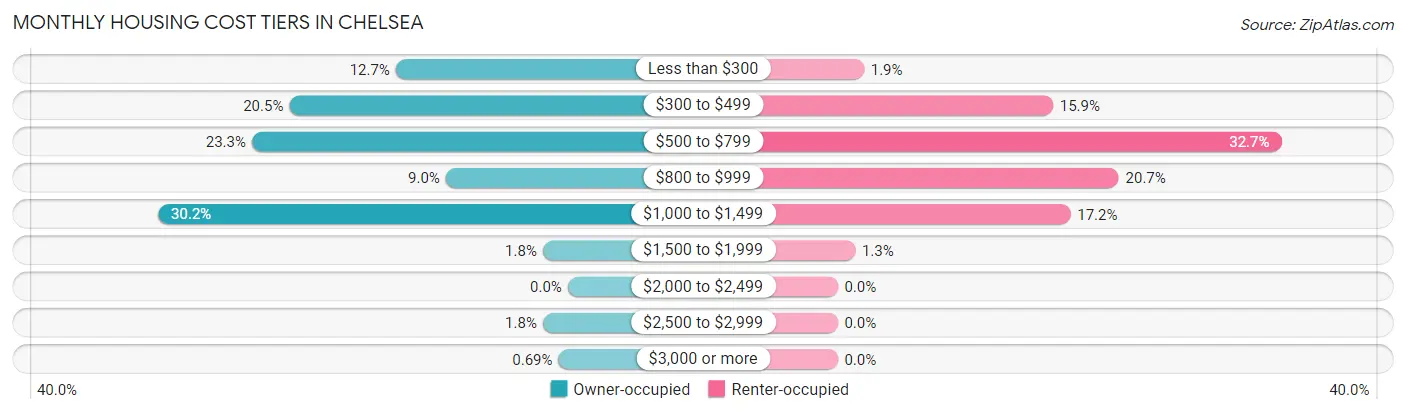
| Monthly Cost | Owner-occupied | Renter-occupied |
| Less than $300 | 55 (12.7%) | 6 (1.9%) |
| $300 to $499 | 89 (20.5%) | 49 (15.9%) |
| $500 to $799 | 101 (23.3%) | 101 (32.7%) |
| $800 to $999 | 39 (9.0%) | 64 (20.7%) |
| $1,000 to $1,499 | 131 (30.2%) | 53 (17.2%) |
| $1,500 to $1,999 | 8 (1.8%) | 4 (1.3%) |
| $2,000 to $2,499 | 0 (0.0%) | 0 (0.0%) |
| $2,500 to $2,999 | 8 (1.8%) | 0 (0.0%) |
| $3,000 or more | 3 (0.7%) | 0 (0.0%) |
| Total | 434 (100.0%) | 309 (100.0%) |
Physical Housing Characteristics in Chelsea
Housing Structures in Chelsea
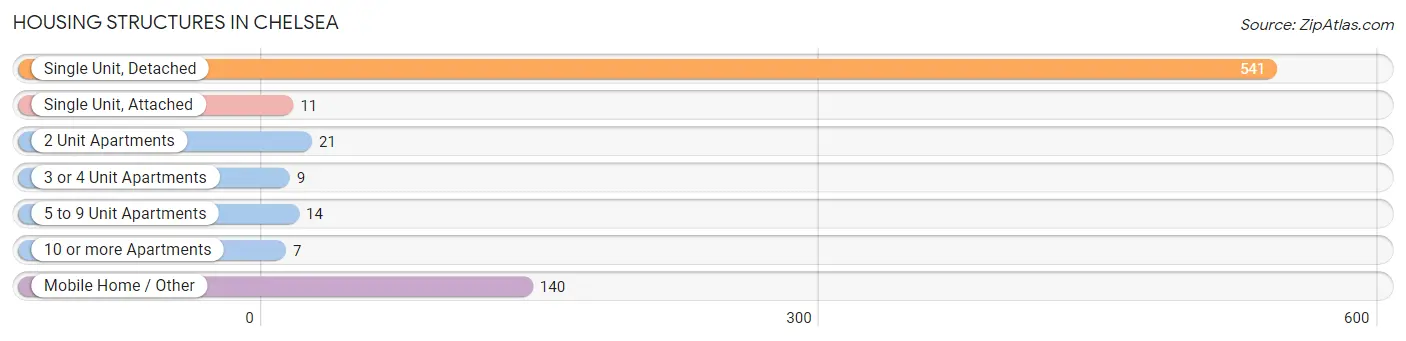
| Structure Type | # Housing Units | % Housing Units |
| Single Unit, Detached | 541 | 72.8% |
| Single Unit, Attached | 11 | 1.5% |
| 2 Unit Apartments | 21 | 2.8% |
| 3 or 4 Unit Apartments | 9 | 1.2% |
| 5 to 9 Unit Apartments | 14 | 1.9% |
| 10 or more Apartments | 7 | 0.9% |
| Mobile Home / Other | 140 | 18.8% |
| Total | 743 | 100.0% |
Housing Structures by Occupancy in Chelsea
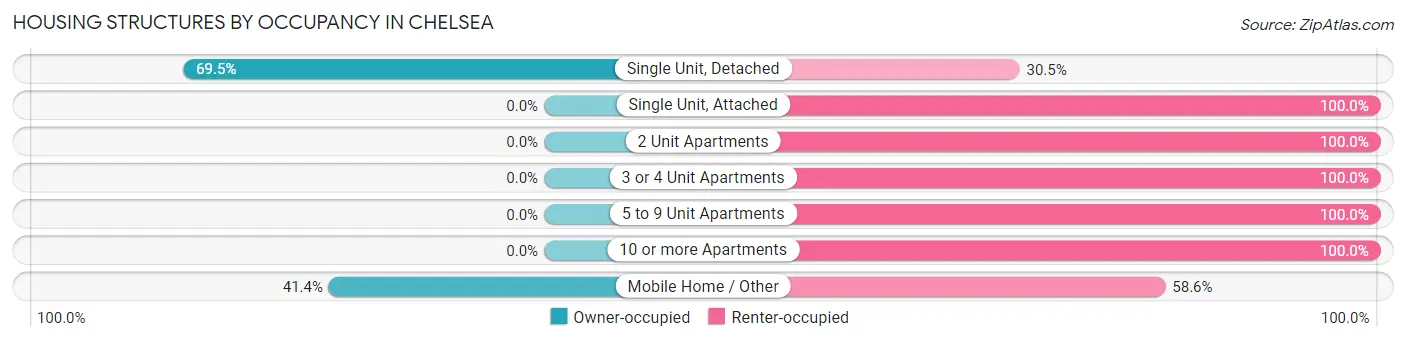
| Structure Type | Owner-occupied | Renter-occupied |
| Single Unit, Detached | 376 (69.5%) | 165 (30.5%) |
| Single Unit, Attached | 0 (0.0%) | 11 (100.0%) |
| 2 Unit Apartments | 0 (0.0%) | 21 (100.0%) |
| 3 or 4 Unit Apartments | 0 (0.0%) | 9 (100.0%) |
| 5 to 9 Unit Apartments | 0 (0.0%) | 14 (100.0%) |
| 10 or more Apartments | 0 (0.0%) | 7 (100.0%) |
| Mobile Home / Other | 58 (41.4%) | 82 (58.6%) |
| Total | 434 (58.4%) | 309 (41.6%) |
Housing Structures by Number of Rooms in Chelsea
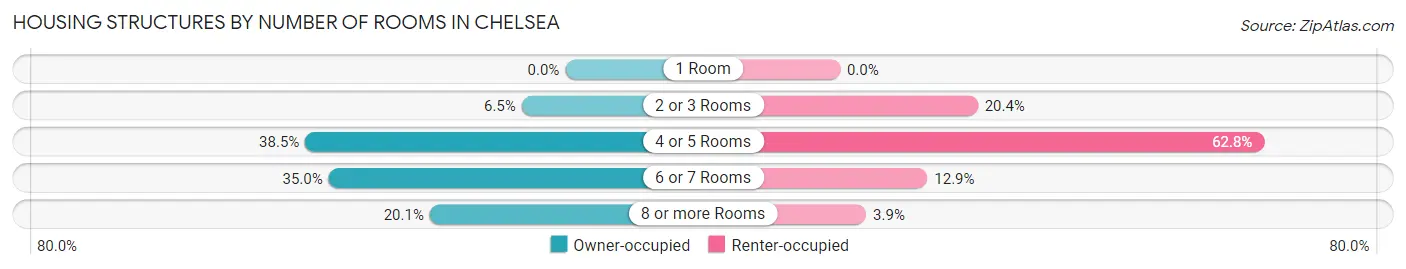
| Number of Rooms | Owner-occupied | Renter-occupied |
| 1 Room | 0 (0.0%) | 0 (0.0%) |
| 2 or 3 Rooms | 28 (6.5%) | 63 (20.4%) |
| 4 or 5 Rooms | 167 (38.5%) | 194 (62.8%) |
| 6 or 7 Rooms | 152 (35.0%) | 40 (12.9%) |
| 8 or more Rooms | 87 (20.1%) | 12 (3.9%) |
| Total | 434 (100.0%) | 309 (100.0%) |
Housing Structure by Heating Type in Chelsea
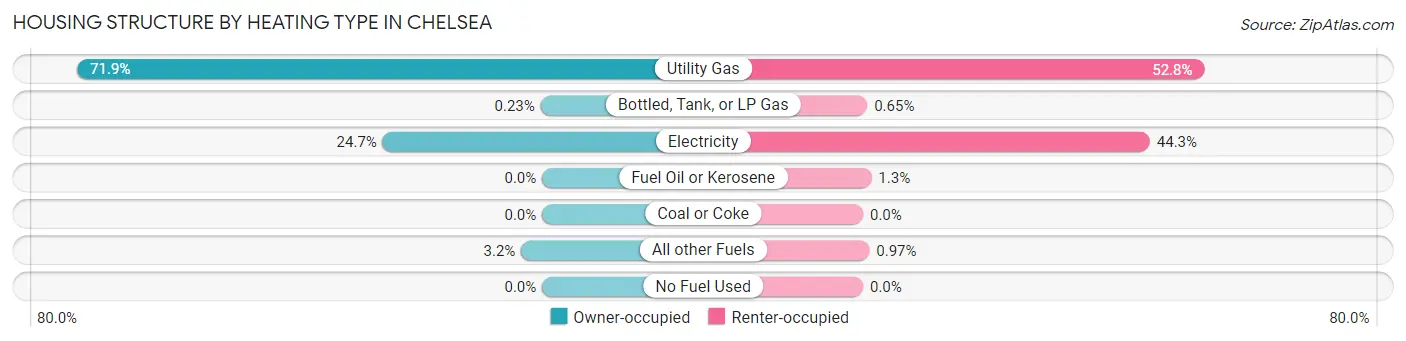
| Heating Type | Owner-occupied | Renter-occupied |
| Utility Gas | 312 (71.9%) | 163 (52.7%) |
| Bottled, Tank, or LP Gas | 1 (0.2%) | 2 (0.6%) |
| Electricity | 107 (24.6%) | 137 (44.3%) |
| Fuel Oil or Kerosene | 0 (0.0%) | 4 (1.3%) |
| Coal or Coke | 0 (0.0%) | 0 (0.0%) |
| All other Fuels | 14 (3.2%) | 3 (1.0%) |
| No Fuel Used | 0 (0.0%) | 0 (0.0%) |
| Total | 434 (100.0%) | 309 (100.0%) |
Household Vehicle Usage in Chelsea
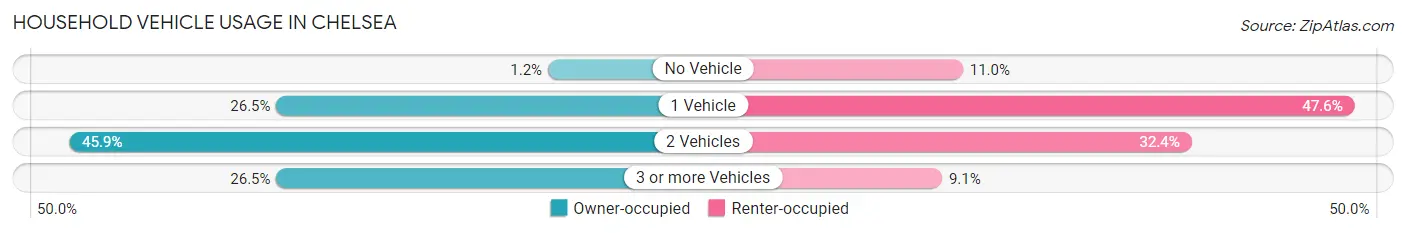
| Vehicles per Household | Owner-occupied | Renter-occupied |
| No Vehicle | 5 (1.1%) | 34 (11.0%) |
| 1 Vehicle | 115 (26.5%) | 147 (47.6%) |
| 2 Vehicles | 199 (45.9%) | 100 (32.4%) |
| 3 or more Vehicles | 115 (26.5%) | 28 (9.1%) |
| Total | 434 (100.0%) | 309 (100.0%) |
Real Estate & Mortgages in Chelsea
Real Estate and Mortgage Overview in Chelsea
| Characteristic | Without Mortgage | With Mortgage |
| Housing Units | 196 | 238 |
| Median Property Value | $72,100 | $98,800 |
| Median Household Income | $40,000 | $1 |
| Monthly Housing Costs | $375 | $3 |
| Real Estate Taxes | $452 | $27 |
Property Value by Mortgage Status in Chelsea
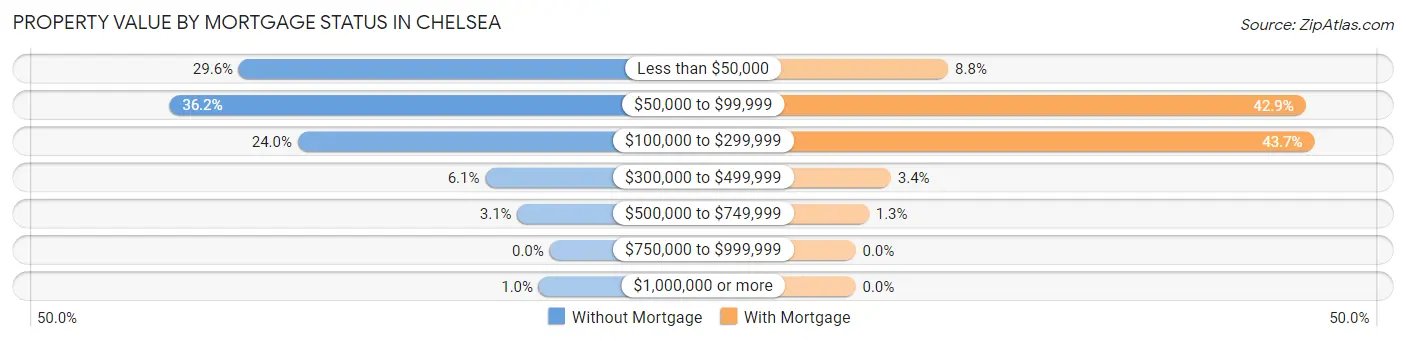
| Property Value | Without Mortgage | With Mortgage |
| Less than $50,000 | 58 (29.6%) | 21 (8.8%) |
| $50,000 to $99,999 | 71 (36.2%) | 102 (42.9%) |
| $100,000 to $299,999 | 47 (24.0%) | 104 (43.7%) |
| $300,000 to $499,999 | 12 (6.1%) | 8 (3.4%) |
| $500,000 to $749,999 | 6 (3.1%) | 3 (1.3%) |
| $750,000 to $999,999 | 0 (0.0%) | 0 (0.0%) |
| $1,000,000 or more | 2 (1.0%) | 0 (0.0%) |
| Total | 196 (100.0%) | 238 (100.0%) |
Household Income by Mortgage Status in Chelsea
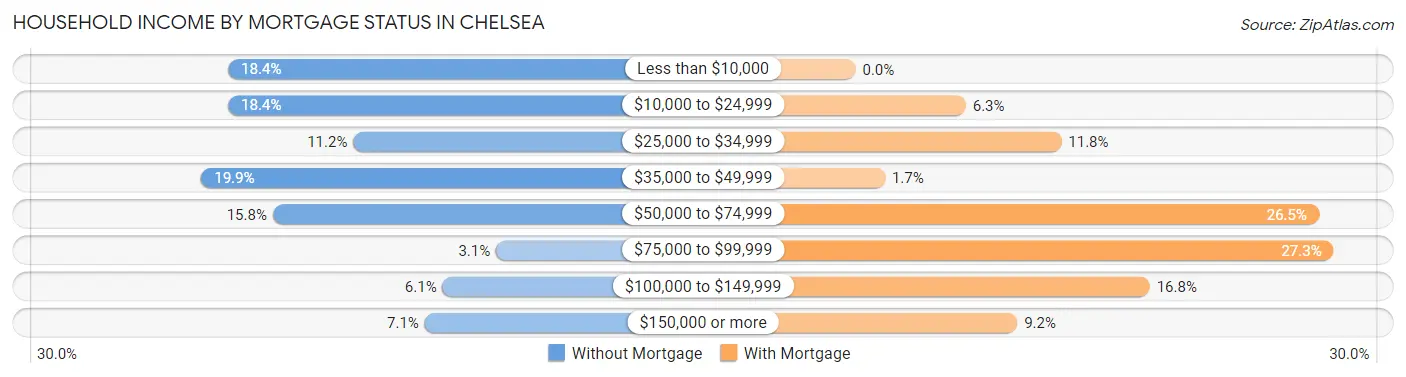
| Household Income | Without Mortgage | With Mortgage |
| Less than $10,000 | 36 (18.4%) | 0 (0.0%) |
| $10,000 to $24,999 | 36 (18.4%) | 15 (6.3%) |
| $25,000 to $34,999 | 22 (11.2%) | 28 (11.8%) |
| $35,000 to $49,999 | 39 (19.9%) | 4 (1.7%) |
| $50,000 to $74,999 | 31 (15.8%) | 63 (26.5%) |
| $75,000 to $99,999 | 6 (3.1%) | 65 (27.3%) |
| $100,000 to $149,999 | 12 (6.1%) | 40 (16.8%) |
| $150,000 or more | 14 (7.1%) | 22 (9.2%) |
| Total | 196 (100.0%) | 238 (100.0%) |
Property Value to Household Income Ratio in Chelsea
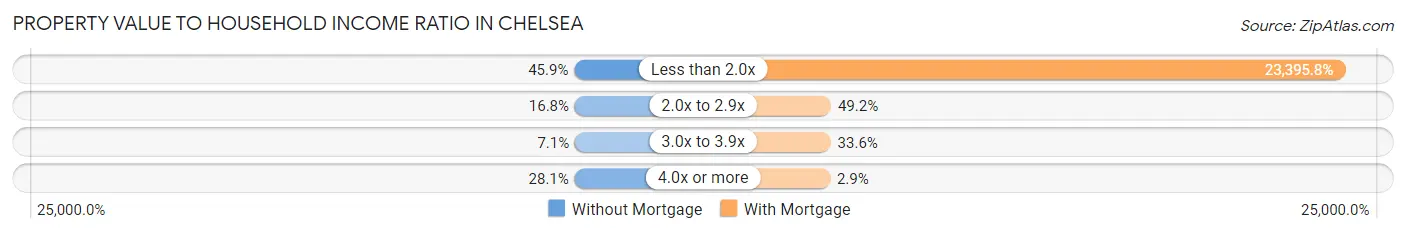
| Value-to-Income Ratio | Without Mortgage | With Mortgage |
| Less than 2.0x | 90 (45.9%) | 55,682 (23,395.8%) |
| 2.0x to 2.9x | 33 (16.8%) | 117 (49.2%) |
| 3.0x to 3.9x | 14 (7.1%) | 80 (33.6%) |
| 4.0x or more | 55 (28.1%) | 7 (2.9%) |
| Total | 196 (100.0%) | 238 (100.0%) |
Real Estate Taxes by Mortgage Status in Chelsea
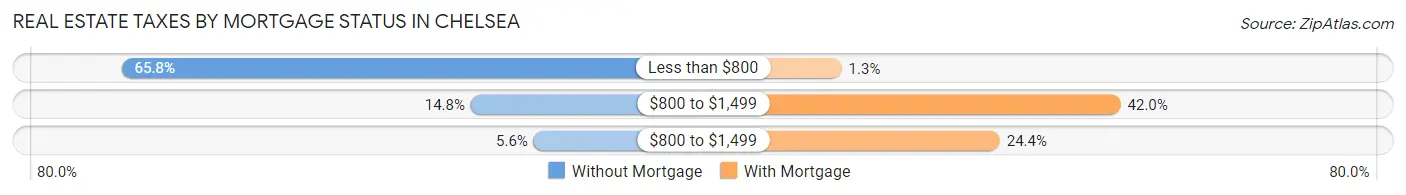
| Property Taxes | Without Mortgage | With Mortgage |
| Less than $800 | 129 (65.8%) | 3 (1.3%) |
| $800 to $1,499 | 29 (14.8%) | 100 (42.0%) |
| $800 to $1,499 | 11 (5.6%) | 58 (24.4%) |
| Total | 196 (100.0%) | 238 (100.0%) |
Health & Disability in Chelsea
Health Insurance Coverage by Age in Chelsea
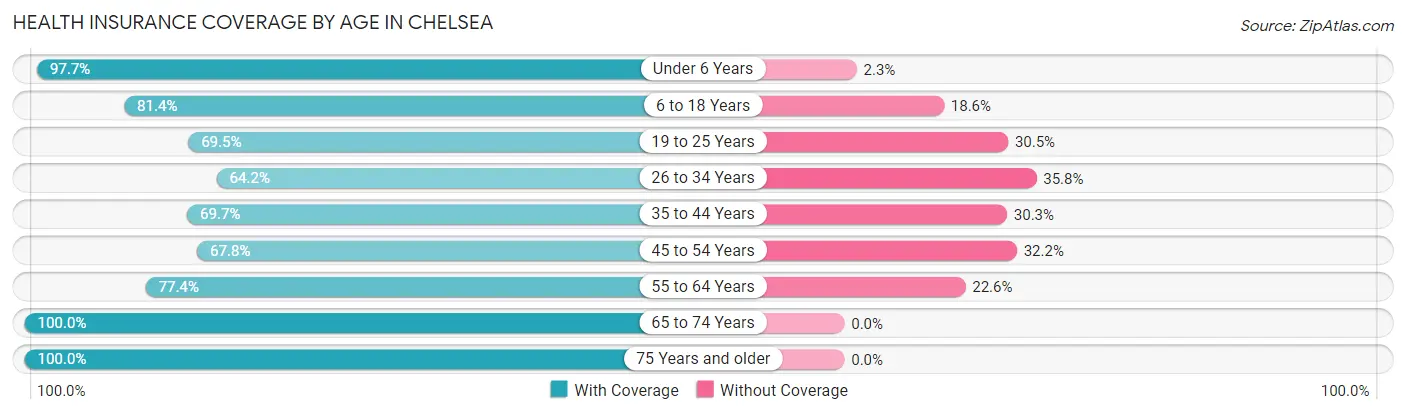
| Age Bracket | With Coverage | Without Coverage |
| Under 6 Years | 170 (97.7%) | 4 (2.3%) |
| 6 to 18 Years | 307 (81.4%) | 70 (18.6%) |
| 19 to 25 Years | 148 (69.5%) | 65 (30.5%) |
| 26 to 34 Years | 165 (64.2%) | 92 (35.8%) |
| 35 to 44 Years | 131 (69.7%) | 57 (30.3%) |
| 45 to 54 Years | 154 (67.8%) | 73 (32.2%) |
| 55 to 64 Years | 199 (77.4%) | 58 (22.6%) |
| 65 to 74 Years | 115 (100.0%) | 0 (0.0%) |
| 75 Years and older | 106 (100.0%) | 0 (0.0%) |
| Total | 1,495 (78.1%) | 419 (21.9%) |
Health Insurance Coverage by Citizenship Status in Chelsea
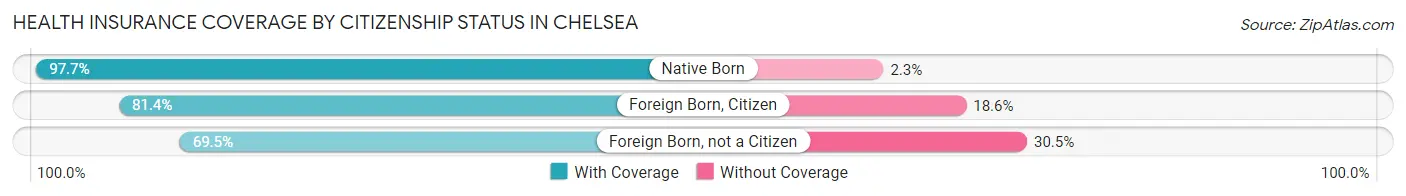
| Citizenship Status | With Coverage | Without Coverage |
| Native Born | 170 (97.7%) | 4 (2.3%) |
| Foreign Born, Citizen | 307 (81.4%) | 70 (18.6%) |
| Foreign Born, not a Citizen | 148 (69.5%) | 65 (30.5%) |
Health Insurance Coverage by Household Income in Chelsea
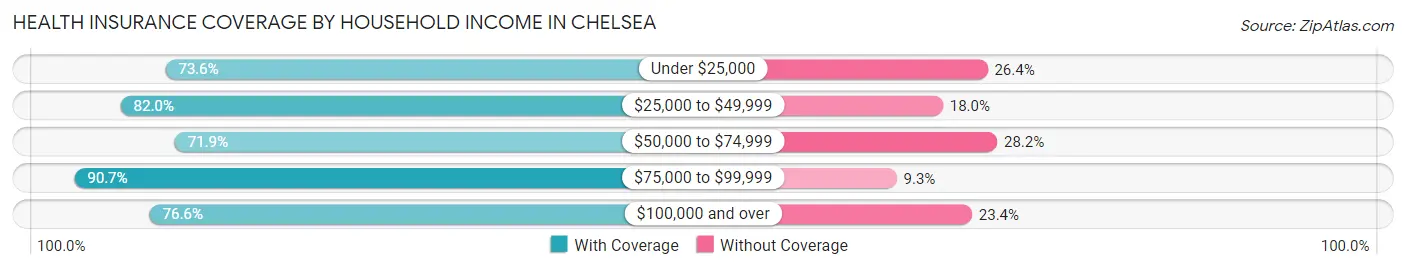
| Household Income | With Coverage | Without Coverage |
| Under $25,000 | 352 (73.6%) | 126 (26.4%) |
| $25,000 to $49,999 | 465 (82.0%) | 102 (18.0%) |
| $50,000 to $74,999 | 291 (71.9%) | 114 (28.1%) |
| $75,000 to $99,999 | 204 (90.7%) | 21 (9.3%) |
| $100,000 and over | 183 (76.6%) | 56 (23.4%) |
Public vs Private Health Insurance Coverage by Age in Chelsea
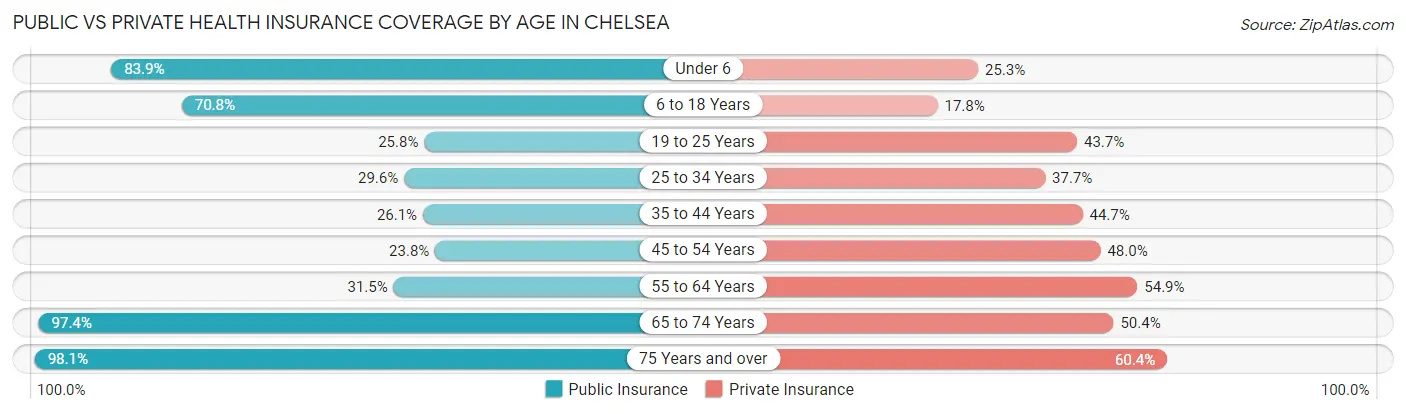
| Age Bracket | Public Insurance | Private Insurance |
| Under 6 | 146 (83.9%) | 44 (25.3%) |
| 6 to 18 Years | 267 (70.8%) | 67 (17.8%) |
| 19 to 25 Years | 55 (25.8%) | 93 (43.7%) |
| 25 to 34 Years | 76 (29.6%) | 97 (37.7%) |
| 35 to 44 Years | 49 (26.1%) | 84 (44.7%) |
| 45 to 54 Years | 54 (23.8%) | 109 (48.0%) |
| 55 to 64 Years | 81 (31.5%) | 141 (54.9%) |
| 65 to 74 Years | 112 (97.4%) | 58 (50.4%) |
| 75 Years and over | 104 (98.1%) | 64 (60.4%) |
| Total | 944 (49.3%) | 757 (39.6%) |
Disability Status by Sex by Age in Chelsea
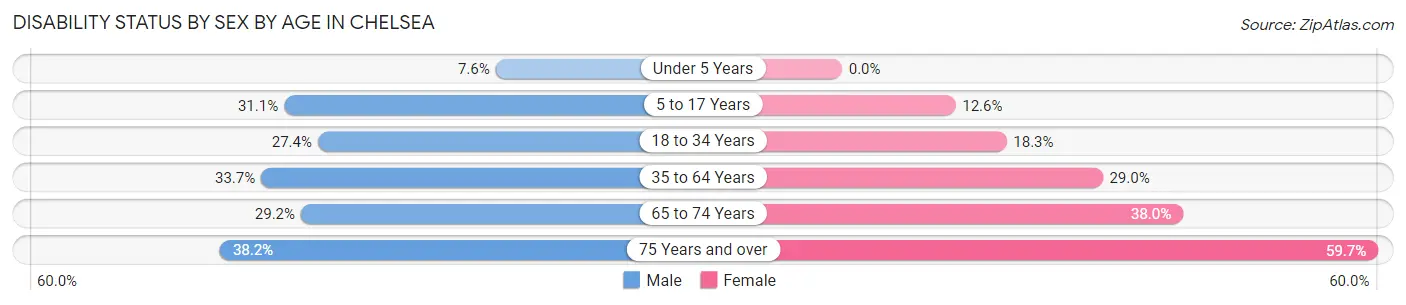
| Age Bracket | Male | Female |
| Under 5 Years | 4 (7.5%) | 0 (0.0%) |
| 5 to 17 Years | 56 (31.1%) | 23 (12.6%) |
| 18 to 34 Years | 61 (27.4%) | 55 (18.3%) |
| 35 to 64 Years | 101 (33.7%) | 108 (29.0%) |
| 65 to 74 Years | 19 (29.2%) | 19 (38.0%) |
| 75 Years and over | 13 (38.2%) | 43 (59.7%) |
Disability Class by Sex by Age in Chelsea
Disability Class: Hearing Difficulty
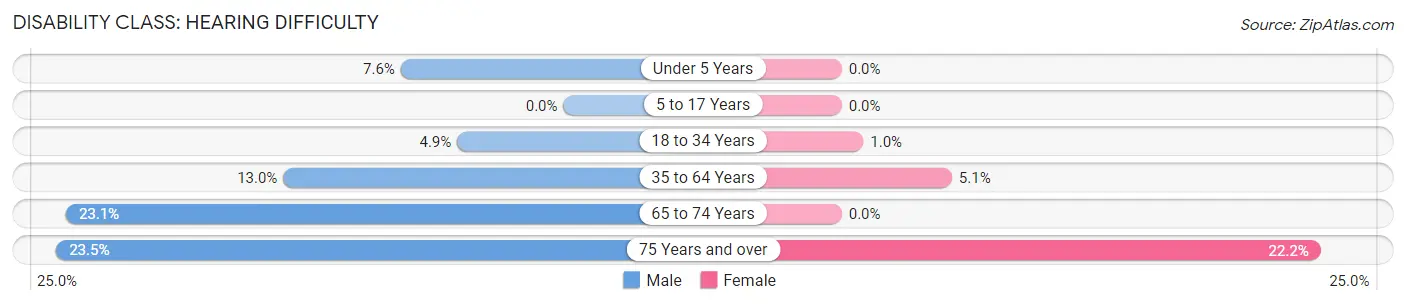
| Age Bracket | Male | Female |
| Under 5 Years | 4 (7.5%) | 0 (0.0%) |
| 5 to 17 Years | 0 (0.0%) | 0 (0.0%) |
| 18 to 34 Years | 11 (4.9%) | 3 (1.0%) |
| 35 to 64 Years | 39 (13.0%) | 19 (5.1%) |
| 65 to 74 Years | 15 (23.1%) | 0 (0.0%) |
| 75 Years and over | 8 (23.5%) | 16 (22.2%) |
Disability Class: Vision Difficulty
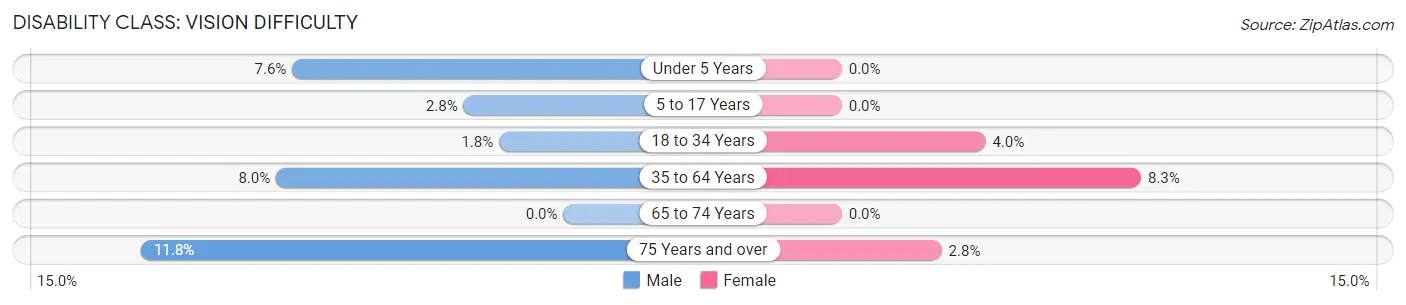
| Age Bracket | Male | Female |
| Under 5 Years | 4 (7.5%) | 0 (0.0%) |
| 5 to 17 Years | 5 (2.8%) | 0 (0.0%) |
| 18 to 34 Years | 4 (1.8%) | 12 (4.0%) |
| 35 to 64 Years | 24 (8.0%) | 31 (8.3%) |
| 65 to 74 Years | 0 (0.0%) | 0 (0.0%) |
| 75 Years and over | 4 (11.8%) | 2 (2.8%) |
Disability Class: Cognitive Difficulty
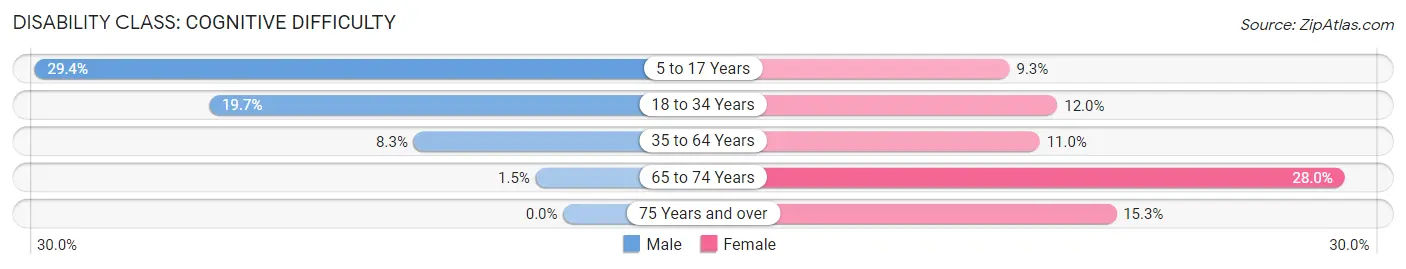
| Age Bracket | Male | Female |
| 5 to 17 Years | 53 (29.4%) | 17 (9.3%) |
| 18 to 34 Years | 44 (19.7%) | 36 (12.0%) |
| 35 to 64 Years | 25 (8.3%) | 41 (11.0%) |
| 65 to 74 Years | 1 (1.5%) | 14 (28.0%) |
| 75 Years and over | 0 (0.0%) | 11 (15.3%) |
Disability Class: Ambulatory Difficulty
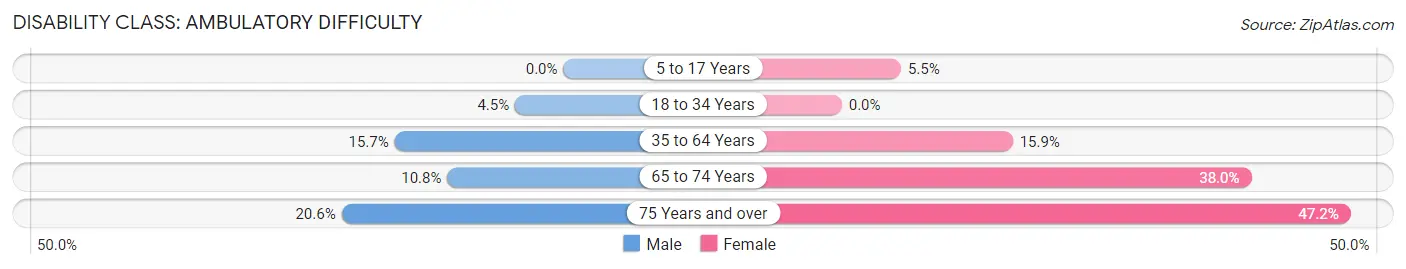
| Age Bracket | Male | Female |
| 5 to 17 Years | 0 (0.0%) | 10 (5.5%) |
| 18 to 34 Years | 10 (4.5%) | 0 (0.0%) |
| 35 to 64 Years | 47 (15.7%) | 59 (15.9%) |
| 65 to 74 Years | 7 (10.8%) | 19 (38.0%) |
| 75 Years and over | 7 (20.6%) | 34 (47.2%) |
Disability Class: Self-Care Difficulty
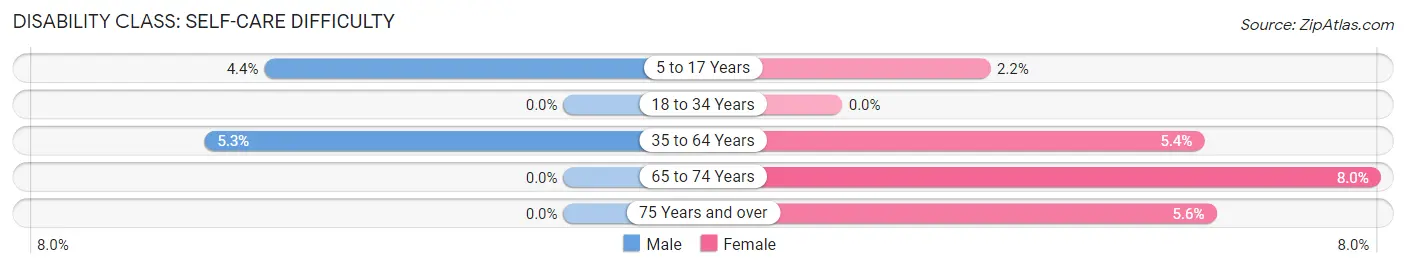
| Age Bracket | Male | Female |
| 5 to 17 Years | 8 (4.4%) | 4 (2.2%) |
| 18 to 34 Years | 0 (0.0%) | 0 (0.0%) |
| 35 to 64 Years | 16 (5.3%) | 20 (5.4%) |
| 65 to 74 Years | 0 (0.0%) | 4 (8.0%) |
| 75 Years and over | 0 (0.0%) | 4 (5.6%) |
Technology Access in Chelsea
Computing Device Access in Chelsea
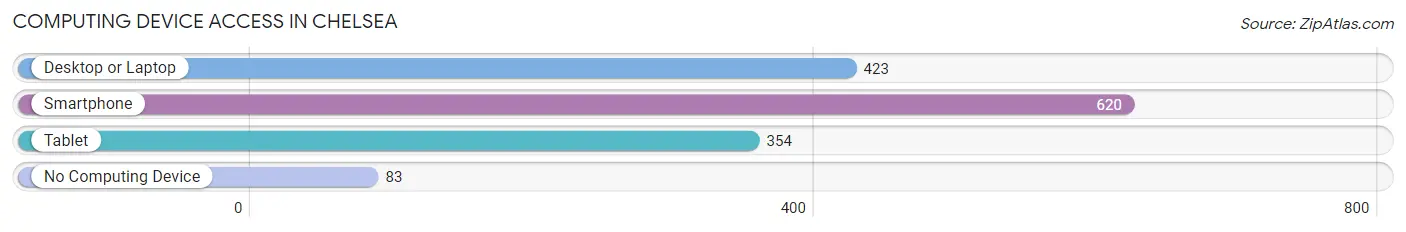
| Device Type | # Households | % Households |
| Desktop or Laptop | 423 | 56.9% |
| Smartphone | 620 | 83.5% |
| Tablet | 354 | 47.6% |
| No Computing Device | 83 | 11.2% |
| Total | 743 | 100.0% |
Internet Access in Chelsea
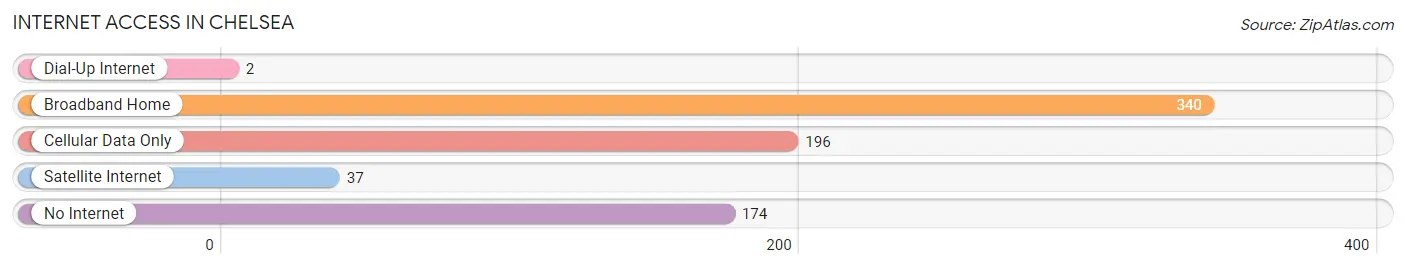
| Internet Type | # Households | % Households |
| Dial-Up Internet | 2 | 0.3% |
| Broadband Home | 340 | 45.8% |
| Cellular Data Only | 196 | 26.4% |
| Satellite Internet | 37 | 5.0% |
| No Internet | 174 | 23.4% |
| Total | 743 | 100.0% |
Chelsea Summary
Chelsea is a small town located in Rogers County, Oklahoma. It is situated in the northeastern part of the state, about 25 miles east of Tulsa. The town was founded in 1891 and was named after the daughter of one of the original settlers. Chelsea has a population of approximately 2,500 people and is part of the Tulsa Metropolitan Statistical Area.
Geography
Chelsea is located in the northeastern part of Oklahoma, in Rogers County. It is situated about 25 miles east of Tulsa and is part of the Tulsa Metropolitan Statistical Area. The town is located in the Ozark Plateau region of the state, which is characterized by rolling hills and wooded areas. The town is situated on the banks of the Verdigris River, which flows through the area. The climate in Chelsea is humid subtropical, with hot summers and mild winters.
Economy
The economy of Chelsea is largely based on agriculture and manufacturing. The town is home to several large agricultural operations, including cattle and poultry farms. The town is also home to several manufacturing companies, including a plastics factory and a metal fabrication plant. The town is also home to several small businesses, including restaurants, retail stores, and service providers.
Demographics
As of the 2010 census, the population of Chelsea was 2,500. The racial makeup of the town was 95.2% White, 0.8% African American, 0.4% Native American, 0.4% Asian, 0.1% Pacific Islander, and 2.1% from other races. The median household income in Chelsea was $37,500, and the median family income was $45,000. The per capita income in Chelsea was $18,000.
Conclusion
Chelsea is a small town located in Rogers County, Oklahoma. It is situated in the northeastern part of the state, about 25 miles east of Tulsa. The town was founded in 1891 and was named after the daughter of one of the original settlers. Chelsea has a population of approximately 2,500 people and is part of the Tulsa Metropolitan Statistical Area. The economy of Chelsea is largely based on agriculture and manufacturing, and the town is home to several small businesses. The racial makeup of the town is predominantly White, with a small percentage of African American, Native American, Asian, and Pacific Islander residents. The median household income in Chelsea is $37,500, and the per capita income is $18,000.
Common Questions
What is Per Capita Income in Chelsea?
Per Capita income in Chelsea is $19,658.
What is the Median Family Income in Chelsea?
Median Family Income in Chelsea is $49,000.
What is the Median Household income in Chelsea?
Median Household Income in Chelsea is $39,961.
What is Income or Wage Gap in Chelsea?
Income or Wage Gap in Chelsea is 54.1%.
Women in Chelsea earn 45.9 cents for every dollar earned by a man.
What is Family Income Deficit in Chelsea?
Family Income Deficit in Chelsea is $13,004.
Families that are below poverty line in Chelsea earn $13,004 less on average than the poverty threshold level.
What is Inequality or Gini Index in Chelsea?
Inequality or Gini Index in Chelsea is 0.45.
What is the Total Population of Chelsea?
Total Population of Chelsea is 1,914.
What is the Total Male Population of Chelsea?
Total Male Population of Chelsea is 855.
What is the Total Female Population of Chelsea?
Total Female Population of Chelsea is 1,059.
What is the Ratio of Males per 100 Females in Chelsea?
There are 80.74 Males per 100 Females in Chelsea.
What is the Ratio of Females per 100 Males in Chelsea?
There are 123.86 Females per 100 Males in Chelsea.
What is the Median Population Age in Chelsea?
Median Population Age in Chelsea is 32.0 Years.
What is the Average Family Size in Chelsea
Average Family Size in Chelsea is 3.1 People.
What is the Average Household Size in Chelsea
Average Household Size in Chelsea is 2.6 People.
How Large is the Labor Force in Chelsea?
There are 896 People in the Labor Forcein in Chelsea.
What is the Percentage of People in the Labor Force in Chelsea?
59.6% of People are in the Labor Force in Chelsea.
What is the Unemployment Rate in Chelsea?
Unemployment Rate in Chelsea is 12.1%.