Ringwood, OK Map & Demographics
Ringwood Map
Ringwood Overview
$19,648
PER CAPITA INCOME
$42,708
AVG FAMILY INCOME
$40,000
AVG HOUSEHOLD INCOME
73.9%
WAGE / INCOME GAP [ % ]
26.1¢/ $1
WAGE / INCOME GAP [ $ ]
0.43
INEQUALITY / GINI INDEX
532
TOTAL POPULATION
253
MALE POPULATION
279
FEMALE POPULATION
90.68
MALES / 100 FEMALES
110.28
FEMALES / 100 MALES
32.6
MEDIAN AGE
3.1
AVG FAMILY SIZE
2.7
AVG HOUSEHOLD SIZE
197
LABOR FORCE [ PEOPLE ]
51.4%
PERCENT IN LABOR FORCE
Ringwood Zip Codes
Ringwood Area Codes
Income in Ringwood
Income Overview in Ringwood
Per Capita Income in Ringwood is $19,648, while median incomes of families and households are $42,708 and $40,000 respectively.
| Characteristic | Number | Measure |
| Per Capita Income | 532 | $19,648 |
| Median Family Income | 157 | $42,708 |
| Mean Family Income | 157 | $55,306 |
| Median Household Income | 200 | $40,000 |
| Mean Household Income | 200 | $50,974 |
| Income Deficit | 157 | $0 |
| Wage / Income Gap (%) | 532 | 73.90% |
| Wage / Income Gap ($) | 532 | 26.10¢ per $1 |
| Gini / Inequality Index | 532 | 0.43 |
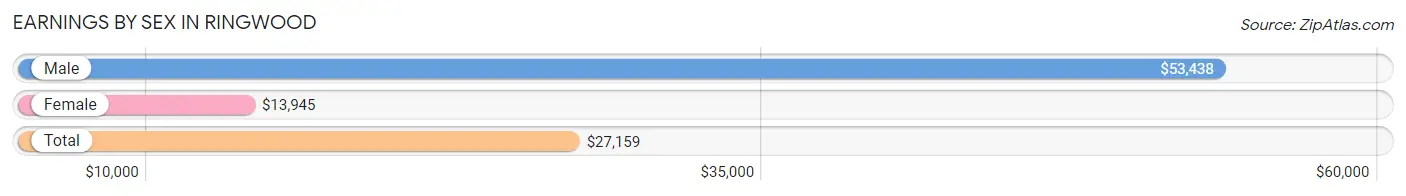
Earnings by Sex in Ringwood
Average Earnings in Ringwood are $27,159, $53,438 for men and $13,945 for women, a difference of 73.9%.
| Sex | Number | Average Earnings |
| Male | 118 (50.6%) | $53,438 |
| Female | 115 (49.4%) | $13,945 |
| Total | 233 (100.0%) | $27,159 |
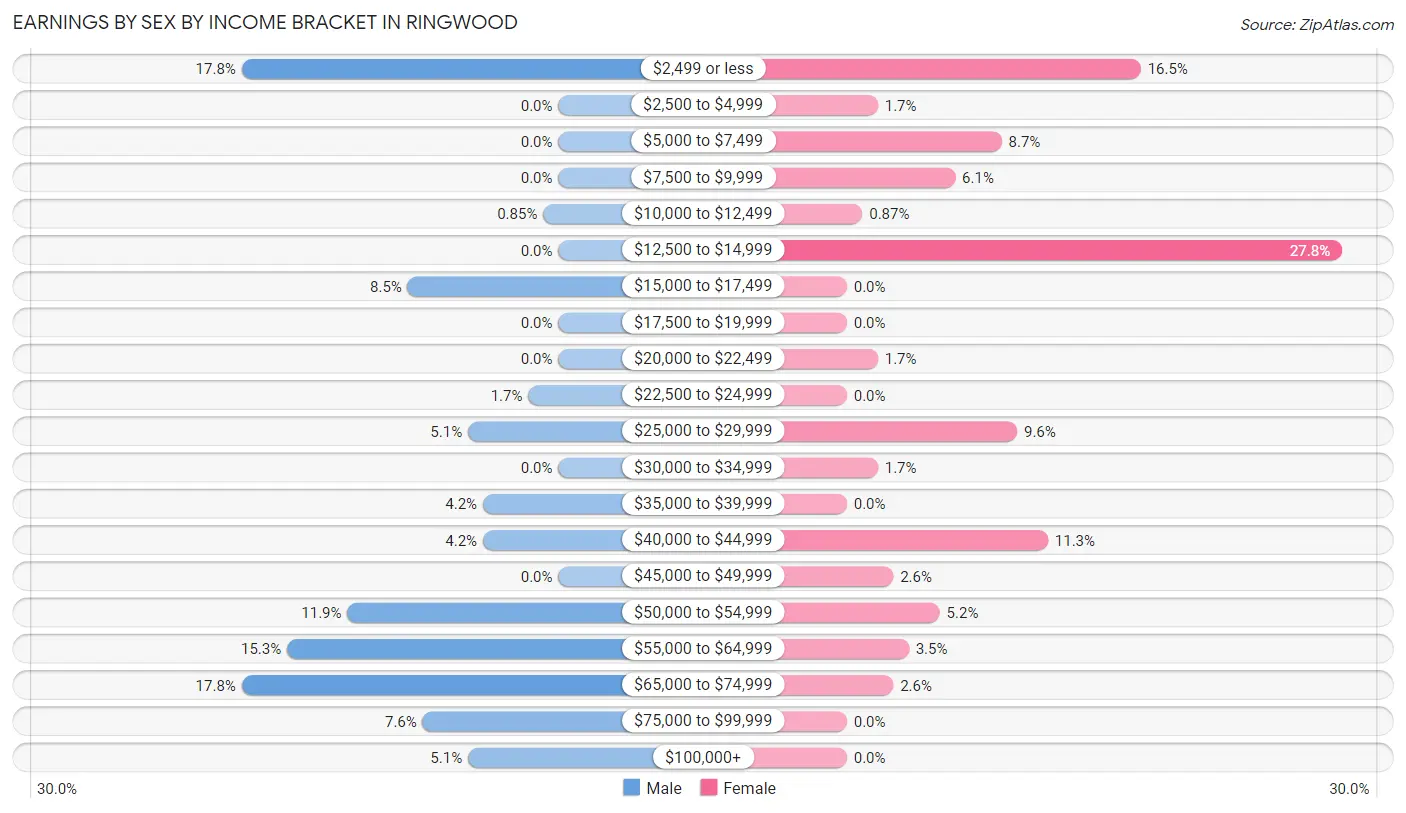
Earnings by Sex by Income Bracket in Ringwood
The most common earnings brackets in Ringwood are $2,499 or less for men (21 | 17.8%) and $12,500 to $14,999 for women (32 | 27.8%).
| Income | Male | Female |
| $2,499 or less | 21 (17.8%) | 19 (16.5%) |
| $2,500 to $4,999 | 0 (0.0%) | 2 (1.7%) |
| $5,000 to $7,499 | 0 (0.0%) | 10 (8.7%) |
| $7,500 to $9,999 | 0 (0.0%) | 7 (6.1%) |
| $10,000 to $12,499 | 1 (0.9%) | 1 (0.9%) |
| $12,500 to $14,999 | 0 (0.0%) | 32 (27.8%) |
| $15,000 to $17,499 | 10 (8.5%) | 0 (0.0%) |
| $17,500 to $19,999 | 0 (0.0%) | 0 (0.0%) |
| $20,000 to $22,499 | 0 (0.0%) | 2 (1.7%) |
| $22,500 to $24,999 | 2 (1.7%) | 0 (0.0%) |
| $25,000 to $29,999 | 6 (5.1%) | 11 (9.6%) |
| $30,000 to $34,999 | 0 (0.0%) | 2 (1.7%) |
| $35,000 to $39,999 | 5 (4.2%) | 0 (0.0%) |
| $40,000 to $44,999 | 5 (4.2%) | 13 (11.3%) |
| $45,000 to $49,999 | 0 (0.0%) | 3 (2.6%) |
| $50,000 to $54,999 | 14 (11.9%) | 6 (5.2%) |
| $55,000 to $64,999 | 18 (15.2%) | 4 (3.5%) |
| $65,000 to $74,999 | 21 (17.8%) | 3 (2.6%) |
| $75,000 to $99,999 | 9 (7.6%) | 0 (0.0%) |
| $100,000+ | 6 (5.1%) | 0 (0.0%) |
| Total | 118 (100.0%) | 115 (100.0%) |
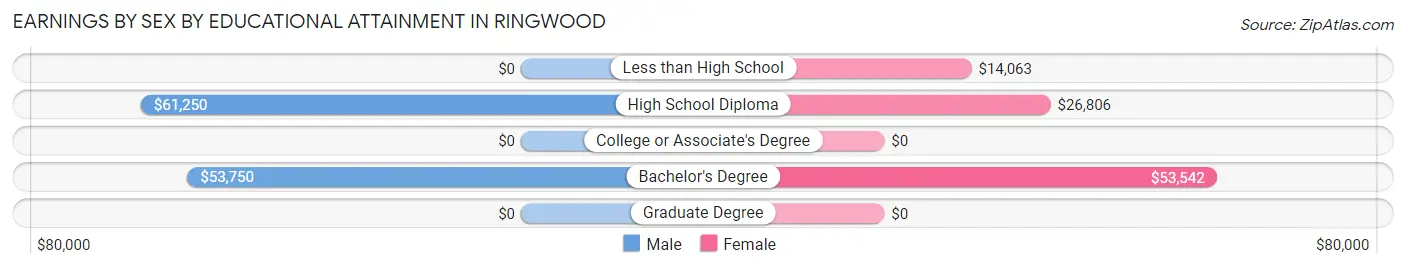
Earnings by Sex by Educational Attainment in Ringwood
| Educational Attainment | Male Income | Female Income |
| Less than High School | - | - |
| High School Diploma | $61,250 | $26,806 |
| College or Associate's Degree | - | - |
| Bachelor's Degree | $53,750 | $53,542 |
| Graduate Degree | - | - |
| Total | $53,333 | $0 |
Family Income in Ringwood
Family Income Brackets in Ringwood
According to the Ringwood family income data, there are 50 families falling into the $15,000 to $24,999 income range, which is the most common income bracket and makes up 31.9% of all families.
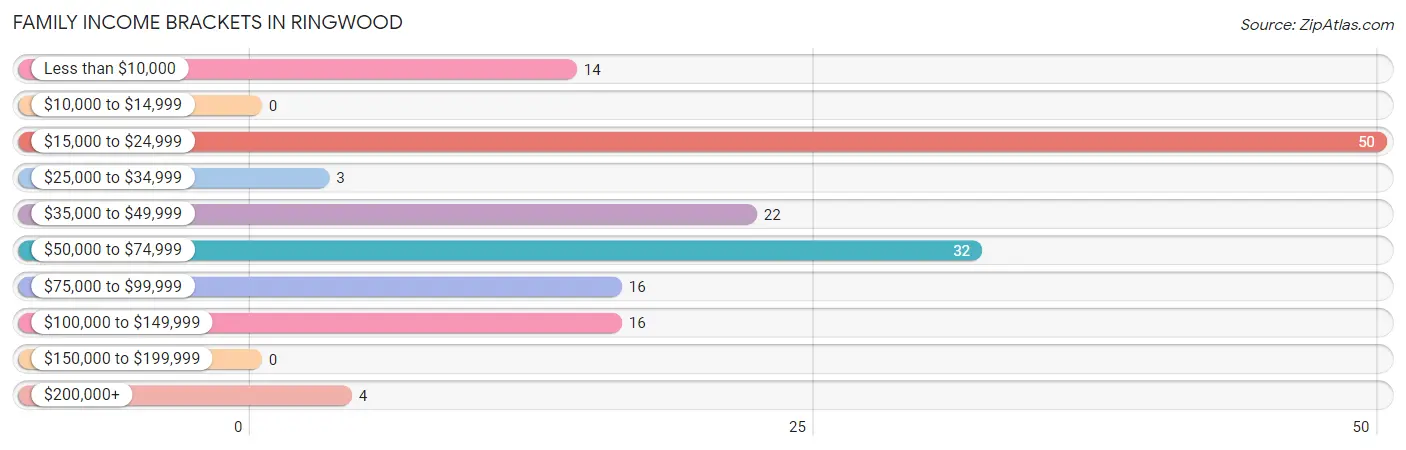
| Income Bracket | # Families | % Families |
| Less than $10,000 | 14 | 8.9% |
| $10,000 to $14,999 | 0 | 0.0% |
| $15,000 to $24,999 | 50 | 31.8% |
| $25,000 to $34,999 | 3 | 1.9% |
| $35,000 to $49,999 | 22 | 14.0% |
| $50,000 to $74,999 | 32 | 20.4% |
| $75,000 to $99,999 | 16 | 10.2% |
| $100,000 to $149,999 | 16 | 10.2% |
| $150,000 to $199,999 | 0 | 0.0% |
| $200,000+ | 4 | 2.5% |
Family Income by Famaliy Size in Ringwood
4-person families (52 | 33.1%) account for the highest median family income in Ringwood with $66,563 per family, while 2-person families (35 | 22.3%) have the highest median income of $24,688 per family member.
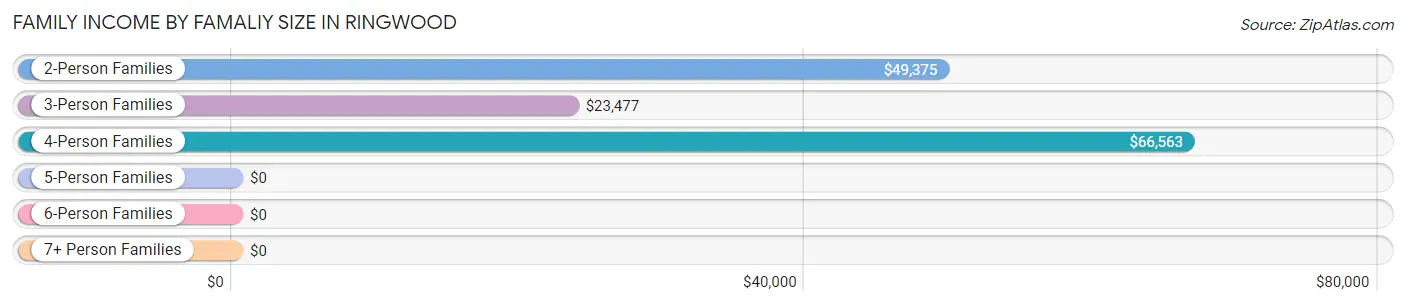
| Income Bracket | # Families | Median Income |
| 2-Person Families | 35 (22.3%) | $49,375 |
| 3-Person Families | 61 (38.9%) | $23,477 |
| 4-Person Families | 52 (33.1%) | $66,563 |
| 5-Person Families | 3 (1.9%) | $0 |
| 6-Person Families | 6 (3.8%) | $0 |
| 7+ Person Families | 0 (0.0%) | $0 |
| Total | 157 (100.0%) | $42,708 |
Family Income by Number of Earners in Ringwood
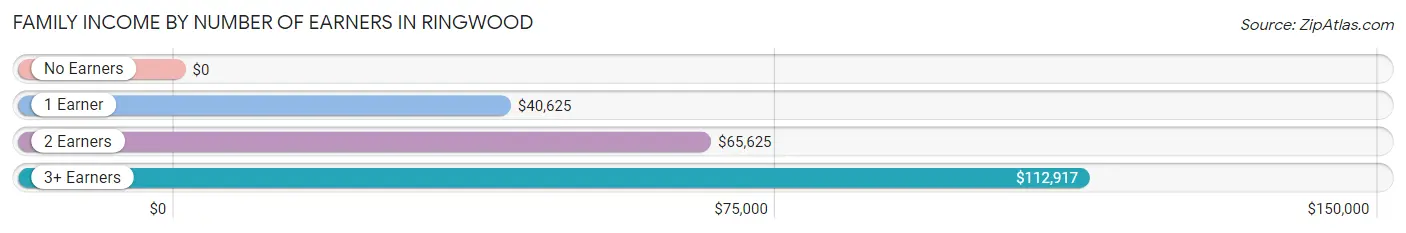
| Number of Earners | # Families | Median Income |
| No Earners | 38 (24.2%) | $0 |
| 1 Earner | 33 (21.0%) | $40,625 |
| 2 Earners | 76 (48.4%) | $65,625 |
| 3+ Earners | 10 (6.4%) | $112,917 |
| Total | 157 (100.0%) | $42,708 |
Household Income in Ringwood
Household Income Brackets in Ringwood
With 54 households falling in the category, the $15,000 to $24,999 income range is the most frequent in Ringwood, accounting for 27.0% of all households.
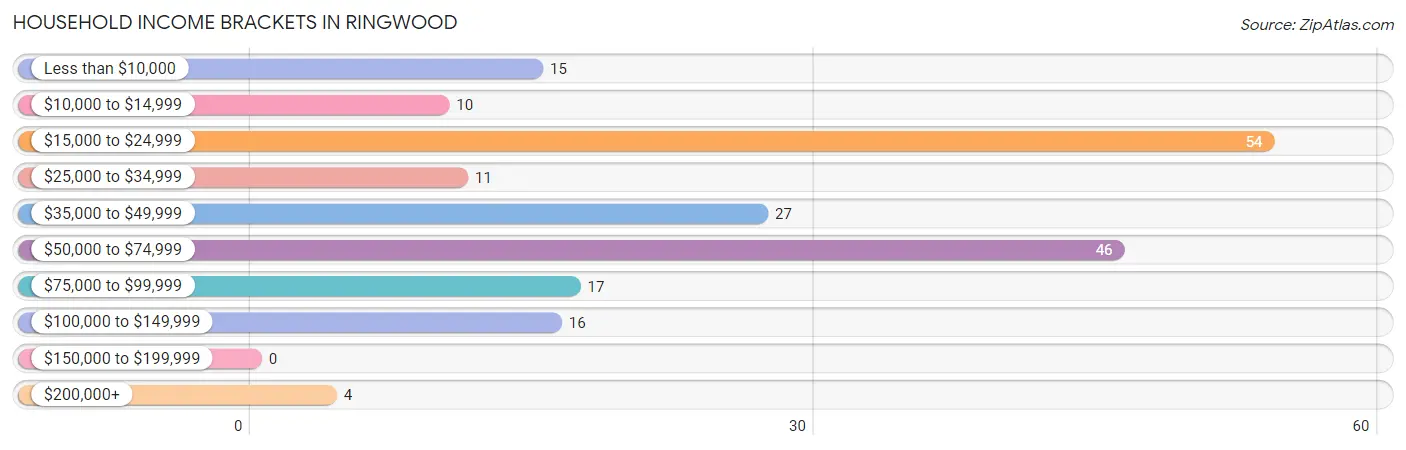
| Income Bracket | # Households | % Households |
| Less than $10,000 | 15 | 7.5% |
| $10,000 to $14,999 | 10 | 5.0% |
| $15,000 to $24,999 | 54 | 27.0% |
| $25,000 to $34,999 | 11 | 5.5% |
| $35,000 to $49,999 | 27 | 13.5% |
| $50,000 to $74,999 | 46 | 23.0% |
| $75,000 to $99,999 | 17 | 8.5% |
| $100,000 to $149,999 | 16 | 8.0% |
| $150,000 to $199,999 | 0 | 0.0% |
| $200,000+ | 4 | 2.0% |
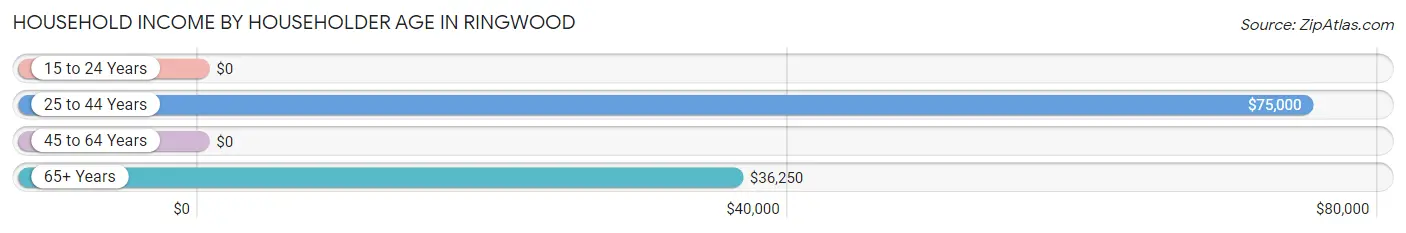
Household Income by Householder Age in Ringwood
The median household income in Ringwood is $40,000, with the highest median household income of $75,000 found in the 25 to 44 years age bracket for the primary householder. A total of 62 households (31.0%) fall into this category. Meanwhile, the 15 to 24 years age bracket for the primary householder has the lowest median household income of $0, with 15 households (7.5%) in this group.
| Income Bracket | # Households | Median Income |
| 15 to 24 Years | 15 (7.5%) | $0 |
| 25 to 44 Years | 62 (31.0%) | $75,000 |
| 45 to 64 Years | 79 (39.5%) | $0 |
| 65+ Years | 44 (22.0%) | $36,250 |
| Total | 200 (100.0%) | $40,000 |
Poverty in Ringwood
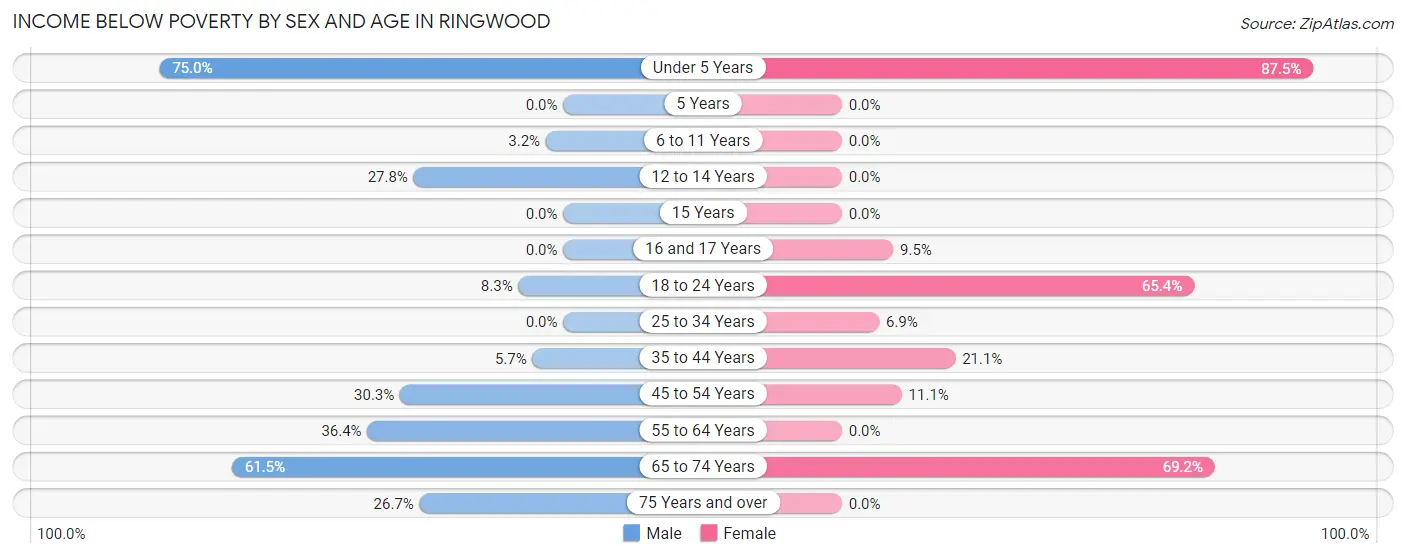
Income Below Poverty by Sex and Age in Ringwood
With 21.3% poverty level for males and 20.1% for females among the residents of Ringwood, under 5 year old males and under 5 year old females are the most vulnerable to poverty, with 15 males (75.0%) and 14 females (87.5%) in their respective age groups living below the poverty level.
| Age Bracket | Male | Female |
| Under 5 Years | 15 (75.0%) | 14 (87.5%) |
| 5 Years | 0 (0.0%) | 0 (0.0%) |
| 6 to 11 Years | 1 (3.2%) | 0 (0.0%) |
| 12 to 14 Years | 5 (27.8%) | 0 (0.0%) |
| 15 Years | 0 (0.0%) | 0 (0.0%) |
| 16 and 17 Years | 0 (0.0%) | 2 (9.5%) |
| 18 to 24 Years | 1 (8.3%) | 17 (65.4%) |
| 25 to 34 Years | 0 (0.0%) | 2 (6.9%) |
| 35 to 44 Years | 2 (5.7%) | 4 (21.0%) |
| 45 to 54 Years | 10 (30.3%) | 8 (11.1%) |
| 55 to 64 Years | 8 (36.4%) | 0 (0.0%) |
| 65 to 74 Years | 8 (61.5%) | 9 (69.2%) |
| 75 Years and over | 4 (26.7%) | 0 (0.0%) |
| Total | 54 (21.3%) | 56 (20.1%) |
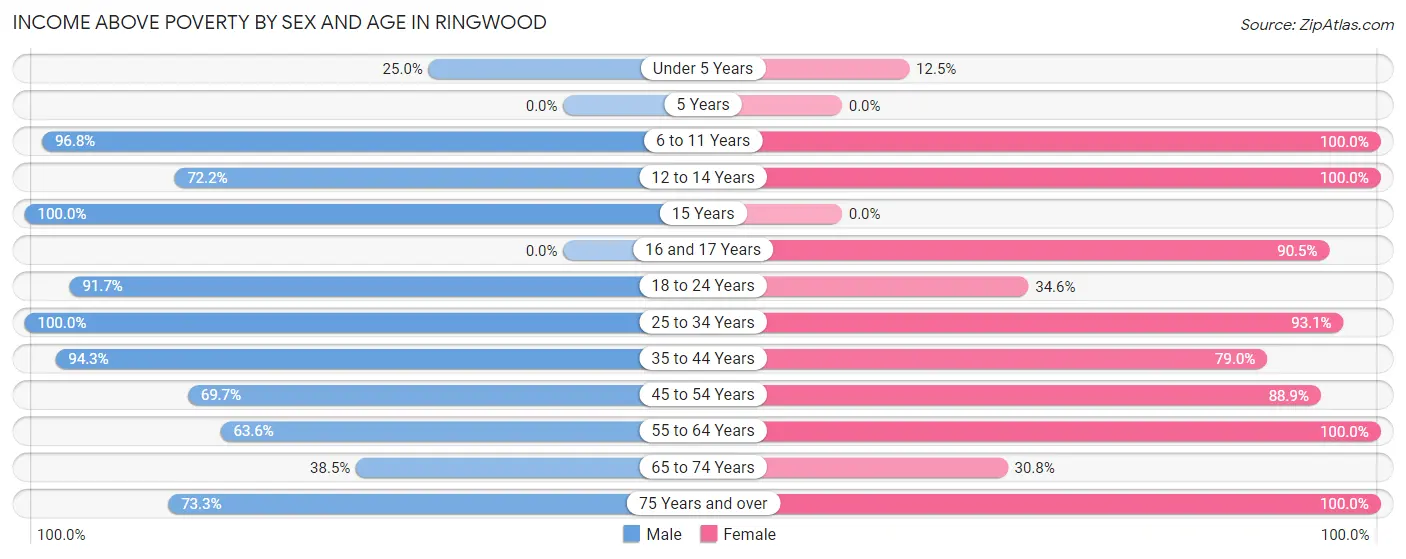
Income Above Poverty by Sex and Age in Ringwood
According to the poverty statistics in Ringwood, males aged 15 years and females aged 6 to 11 years are the age groups that are most secure financially, with 100.0% of males and 100.0% of females in these age groups living above the poverty line.
| Age Bracket | Male | Female |
| Under 5 Years | 5 (25.0%) | 2 (12.5%) |
| 5 Years | 0 (0.0%) | 0 (0.0%) |
| 6 to 11 Years | 30 (96.8%) | 35 (100.0%) |
| 12 to 14 Years | 13 (72.2%) | 17 (100.0%) |
| 15 Years | 12 (100.0%) | 0 (0.0%) |
| 16 and 17 Years | 0 (0.0%) | 19 (90.5%) |
| 18 to 24 Years | 11 (91.7%) | 9 (34.6%) |
| 25 to 34 Years | 42 (100.0%) | 27 (93.1%) |
| 35 to 44 Years | 33 (94.3%) | 15 (78.9%) |
| 45 to 54 Years | 23 (69.7%) | 64 (88.9%) |
| 55 to 64 Years | 14 (63.6%) | 9 (100.0%) |
| 65 to 74 Years | 5 (38.5%) | 4 (30.8%) |
| 75 Years and over | 11 (73.3%) | 22 (100.0%) |
| Total | 199 (78.7%) | 223 (79.9%) |
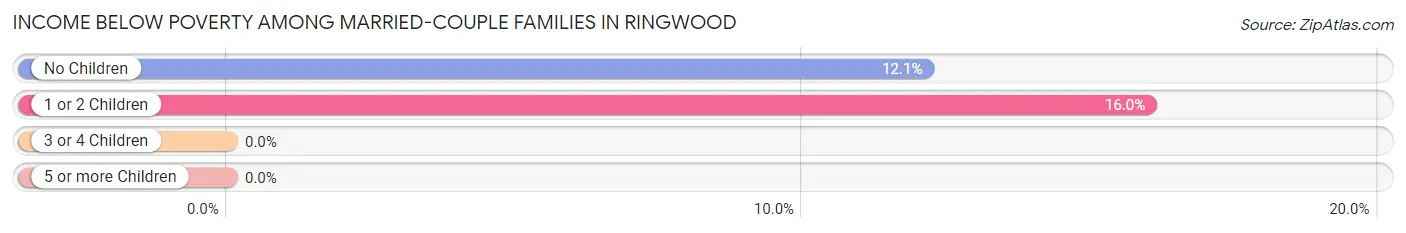
Income Below Poverty Among Married-Couple Families in Ringwood
The poverty statistics for married-couple families in Ringwood show that 12.9% or 16 of the total 124 families live below the poverty line. Families with 1 or 2 children have the highest poverty rate of 16.0%, comprising of 8 families. On the other hand, families with 3 or 4 children have the lowest poverty rate of 0.0%, which includes 0 families.
| Children | Above Poverty | Below Poverty |
| No Children | 58 (87.9%) | 8 (12.1%) |
| 1 or 2 Children | 42 (84.0%) | 8 (16.0%) |
| 3 or 4 Children | 8 (100.0%) | 0 (0.0%) |
| 5 or more Children | 0 (0.0%) | 0 (0.0%) |
| Total | 108 (87.1%) | 16 (12.9%) |
Income Below Poverty Among Single-Parent Households in Ringwood
According to the poverty data in Ringwood, 100.0% or 2 single-father households and 51.6% or 16 single-mother households are living below the poverty line. Among single-father households, those with no children have the highest poverty rate, with 2 households (100.0%) experiencing poverty. Likewise, among single-mother households, those with 1 or 2 children have the highest poverty rate, with 14 households (70.0%) falling below the poverty line.
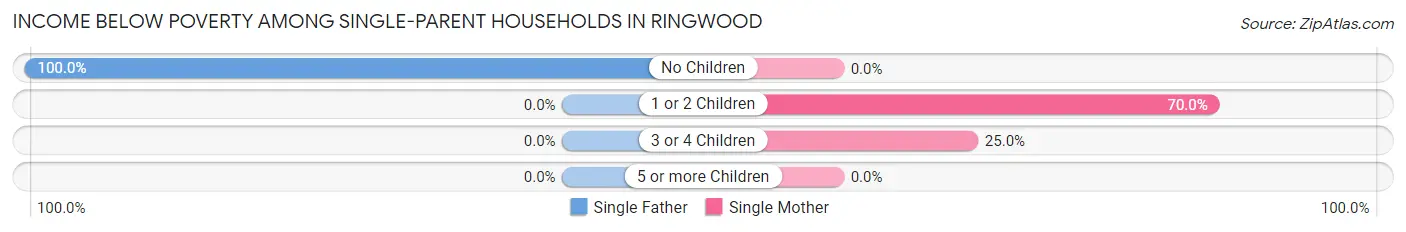
| Children | Single Father | Single Mother |
| No Children | 2 (100.0%) | 0 (0.0%) |
| 1 or 2 Children | 0 (0.0%) | 14 (70.0%) |
| 3 or 4 Children | 0 (0.0%) | 2 (25.0%) |
| 5 or more Children | 0 (0.0%) | 0 (0.0%) |
| Total | 2 (100.0%) | 16 (51.6%) |
Income Below Poverty Among Married-Couple vs Single-Parent Households in Ringwood
The poverty data for Ringwood shows that 16 of the married-couple family households (12.9%) and 18 of the single-parent households (54.5%) are living below the poverty level. Within the married-couple family households, those with 1 or 2 children have the highest poverty rate, with 8 households (16.0%) falling below the poverty line. Among the single-parent households, those with 1 or 2 children have the highest poverty rate, with 14 household (70.0%) living below poverty.
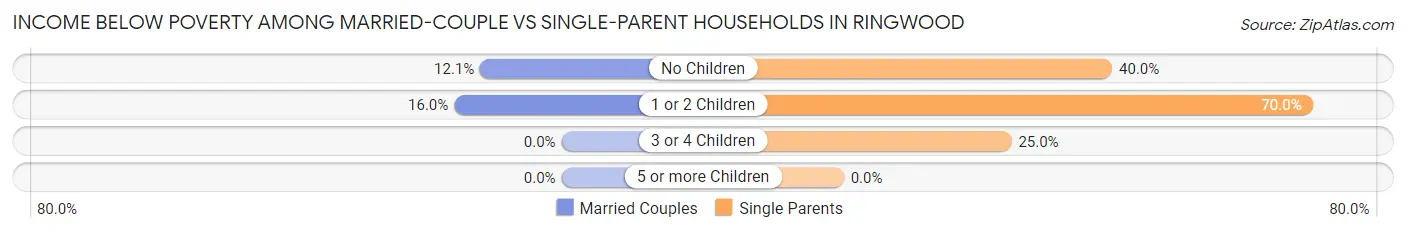
| Children | Married-Couple Families | Single-Parent Households |
| No Children | 8 (12.1%) | 2 (40.0%) |
| 1 or 2 Children | 8 (16.0%) | 14 (70.0%) |
| 3 or 4 Children | 0 (0.0%) | 2 (25.0%) |
| 5 or more Children | 0 (0.0%) | 0 (0.0%) |
| Total | 16 (12.9%) | 18 (54.5%) |
Race in Ringwood
The most populous races in Ringwood are Hispanic or Latino (311 | 58.5%), White / Caucasian (290 | 54.5%), and Some other Race (105 | 19.7%).
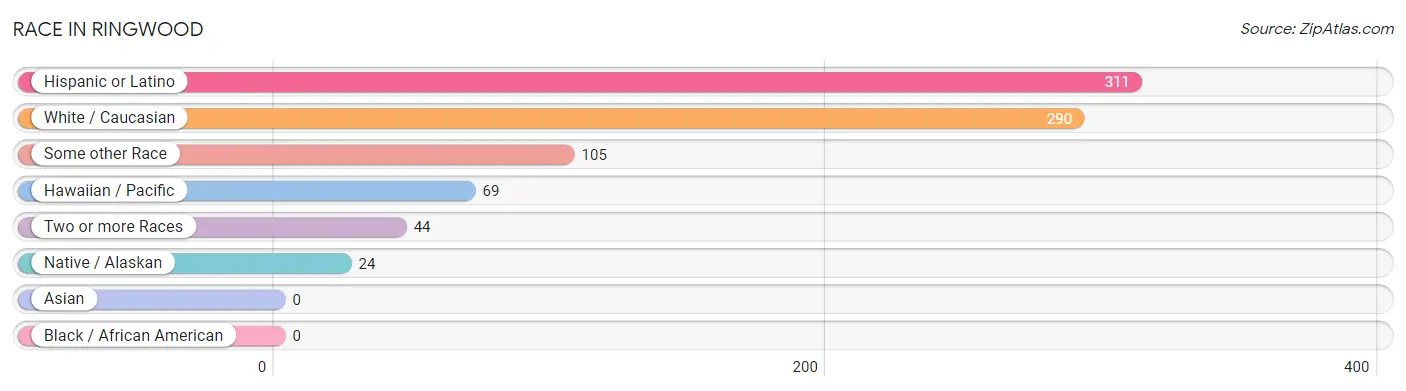
| Race | # Population | % Population |
| Asian | 0 | 0.0% |
| Black / African American | 0 | 0.0% |
| Hawaiian / Pacific | 69 | 13.0% |
| Hispanic or Latino | 311 | 58.5% |
| Native / Alaskan | 24 | 4.5% |
| White / Caucasian | 290 | 54.5% |
| Two or more Races | 44 | 8.3% |
| Some other Race | 105 | 19.7% |
| Total | 532 | 100.0% |
Ancestry in Ringwood
The most populous ancestries reported in Ringwood are Mexican (302 | 56.8%), Native Hawaiian (69 | 13.0%), German (58 | 10.9%), Irish (29 | 5.4%), and Delaware (24 | 4.5%), together accounting for 90.6% of all Ringwood residents.
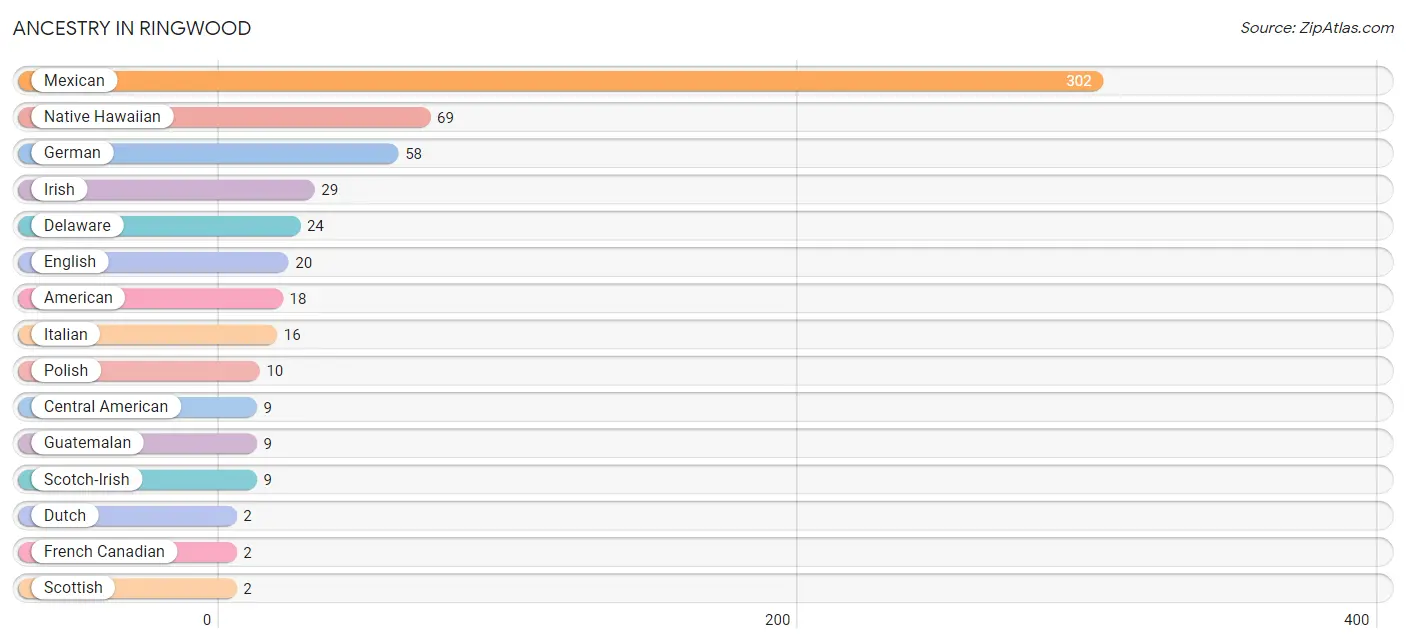
| Ancestry | # Population | % Population |
| American | 18 | 3.4% |
| Central American | 9 | 1.7% |
| Delaware | 24 | 4.5% |
| Dutch | 2 | 0.4% |
| English | 20 | 3.8% |
| French Canadian | 2 | 0.4% |
| German | 58 | 10.9% |
| Guatemalan | 9 | 1.7% |
| Irish | 29 | 5.4% |
| Italian | 16 | 3.0% |
| Mexican | 302 | 56.8% |
| Native Hawaiian | 69 | 13.0% |
| Polish | 10 | 1.9% |
| Scotch-Irish | 9 | 1.7% |
| Scottish | 2 | 0.4% | View All 15 Rows |
Immigrants in Ringwood
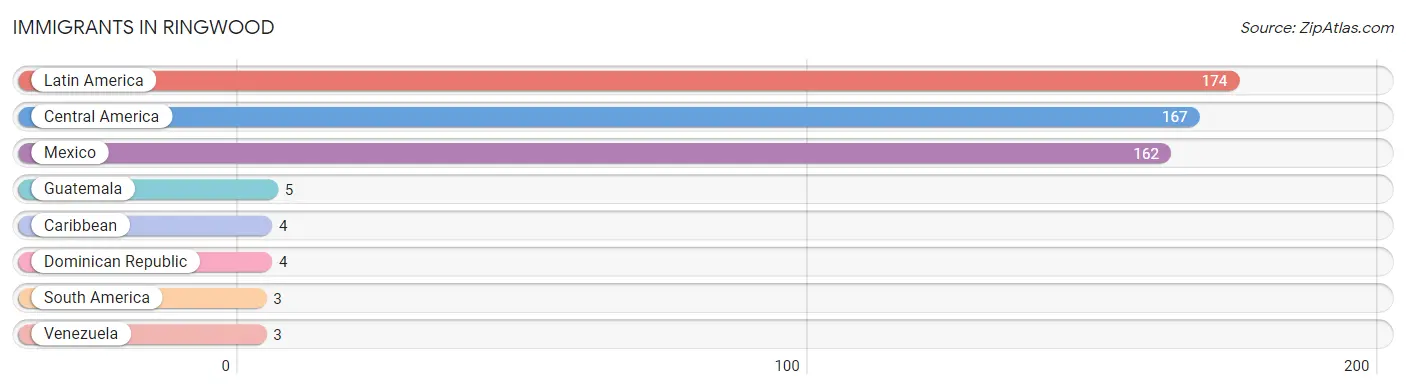
The most numerous immigrant groups reported in Ringwood came from Latin America (174 | 32.7%), Central America (167 | 31.4%), Mexico (162 | 30.4%), Guatemala (5 | 0.9%), and Caribbean (4 | 0.7%), together accounting for 96.2% of all Ringwood residents.
| Immigration Origin | # Population | % Population |
| Caribbean | 4 | 0.7% |
| Central America | 167 | 31.4% |
| Dominican Republic | 4 | 0.7% |
| Guatemala | 5 | 0.9% |
| Latin America | 174 | 32.7% |
| Mexico | 162 | 30.4% |
| South America | 3 | 0.6% |
| Venezuela | 3 | 0.6% | View All 8 Rows |
Sex and Age in Ringwood
Sex and Age in Ringwood
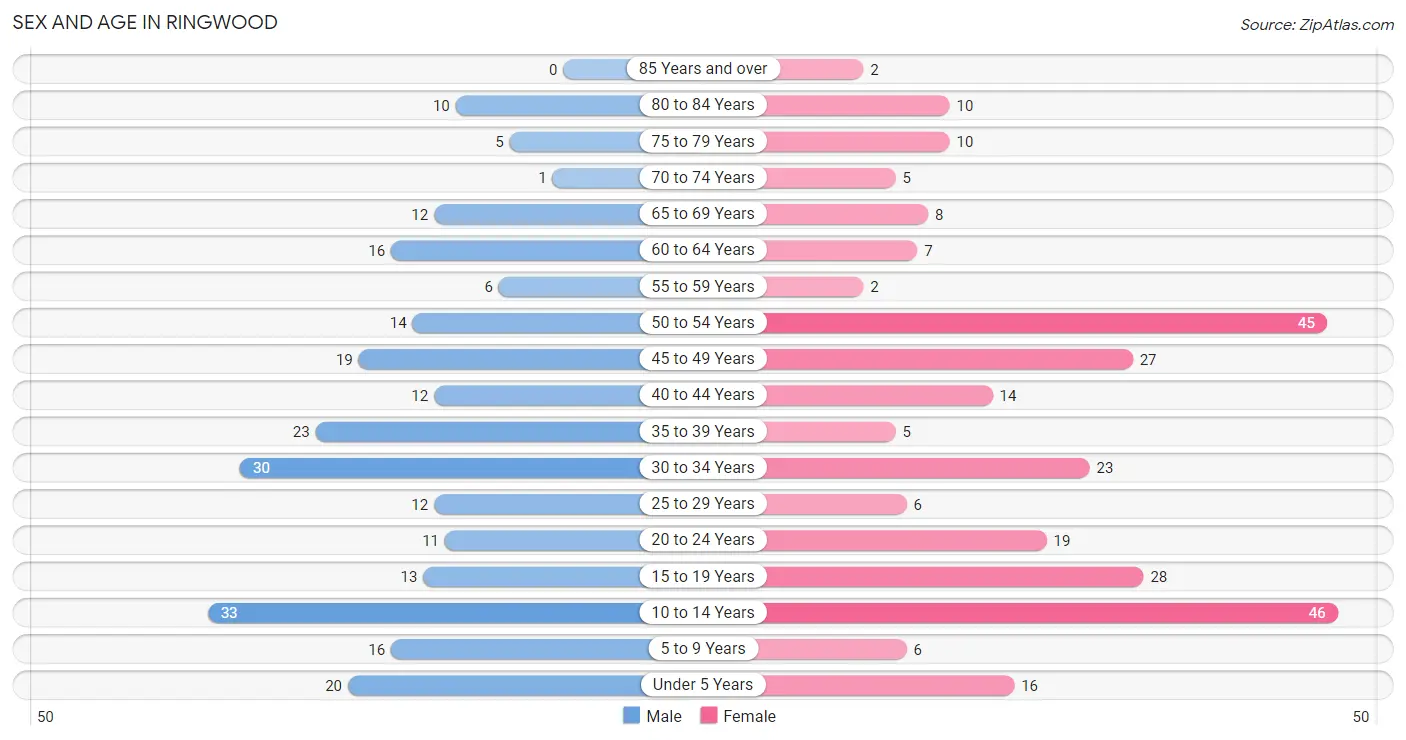
The most populous age groups in Ringwood are 10 to 14 Years (33 | 13.0%) for men and 10 to 14 Years (46 | 16.5%) for women.
| Age Bracket | Male | Female |
| Under 5 Years | 20 (7.9%) | 16 (5.7%) |
| 5 to 9 Years | 16 (6.3%) | 6 (2.1%) |
| 10 to 14 Years | 33 (13.0%) | 46 (16.5%) |
| 15 to 19 Years | 13 (5.1%) | 28 (10.0%) |
| 20 to 24 Years | 11 (4.3%) | 19 (6.8%) |
| 25 to 29 Years | 12 (4.7%) | 6 (2.1%) |
| 30 to 34 Years | 30 (11.9%) | 23 (8.2%) |
| 35 to 39 Years | 23 (9.1%) | 5 (1.8%) |
| 40 to 44 Years | 12 (4.7%) | 14 (5.0%) |
| 45 to 49 Years | 19 (7.5%) | 27 (9.7%) |
| 50 to 54 Years | 14 (5.5%) | 45 (16.1%) |
| 55 to 59 Years | 6 (2.4%) | 2 (0.7%) |
| 60 to 64 Years | 16 (6.3%) | 7 (2.5%) |
| 65 to 69 Years | 12 (4.7%) | 8 (2.9%) |
| 70 to 74 Years | 1 (0.4%) | 5 (1.8%) |
| 75 to 79 Years | 5 (2.0%) | 10 (3.6%) |
| 80 to 84 Years | 10 (4.0%) | 10 (3.6%) |
| 85 Years and over | 0 (0.0%) | 2 (0.7%) |
| Total | 253 (100.0%) | 279 (100.0%) |
Families and Households in Ringwood
Median Family Size in Ringwood
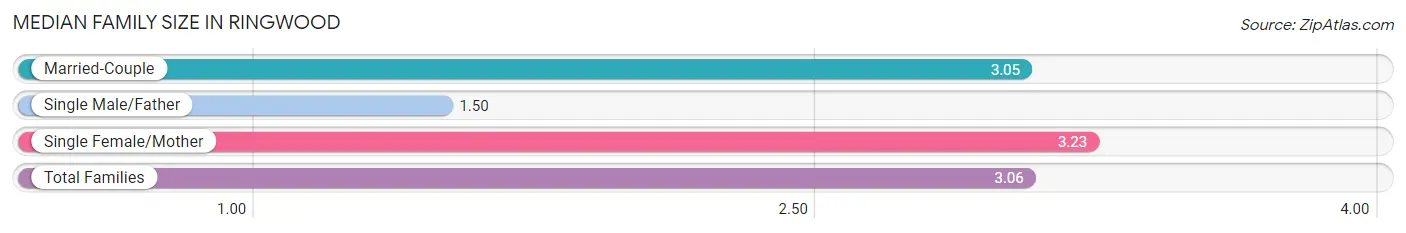
The median family size in Ringwood is 3.06 persons per family, with single female/mother families (31 | 19.8%) accounting for the largest median family size of 3.23 persons per family. On the other hand, single male/father families (2 | 1.3%) represent the smallest median family size with 1.50 persons per family.
| Family Type | # Families | Family Size |
| Married-Couple | 124 (79.0%) | 3.05 |
| Single Male/Father | 2 (1.3%) | 1.50 |
| Single Female/Mother | 31 (19.8%) | 3.23 |
| Total Families | 157 (100.0%) | 3.06 |
Median Household Size in Ringwood
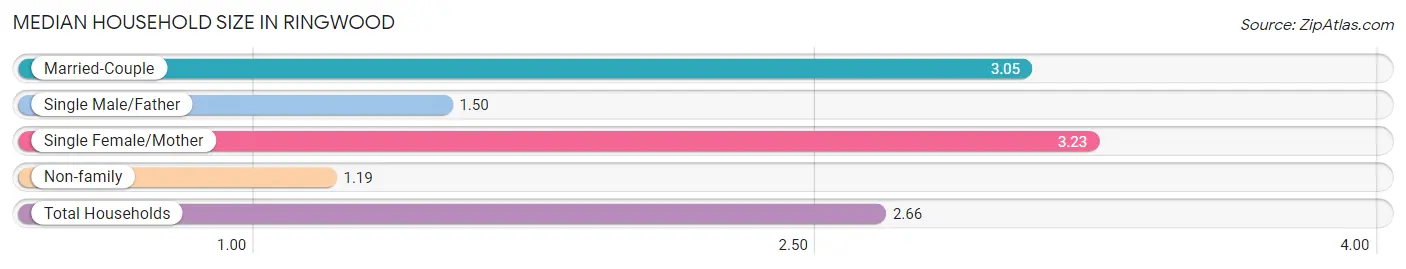
The median household size in Ringwood is 2.66 persons per household, with single female/mother households (31 | 15.5%) accounting for the largest median household size of 3.23 persons per household. non-family households (43 | 21.5%) represent the smallest median household size with 1.19 persons per household.
| Household Type | # Households | Household Size |
| Married-Couple | 124 (62.0%) | 3.05 |
| Single Male/Father | 2 (1.0%) | 1.50 |
| Single Female/Mother | 31 (15.5%) | 3.23 |
| Non-family | 43 (21.5%) | 1.19 |
| Total Households | 200 (100.0%) | 2.66 |
Household Size by Marriage Status in Ringwood
Out of a total of 200 households in Ringwood, 157 (78.5%) are family households, while 43 (21.5%) are nonfamily households. The most numerous type of family households are 3-person households, comprising 61, and the most common type of nonfamily households are 1-person households, comprising 30.
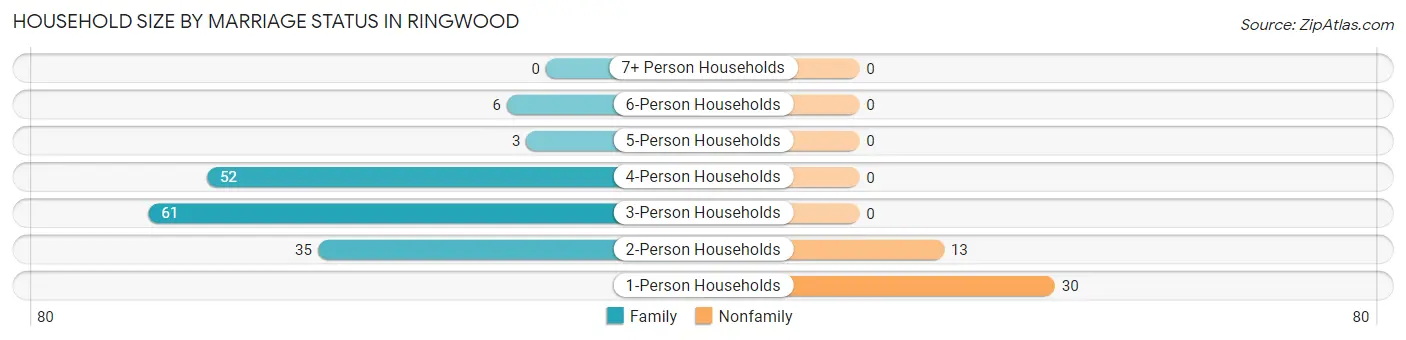
| Household Size | Family Households | Nonfamily Households |
| 1-Person Households | - | 30 (15.0%) |
| 2-Person Households | 35 (17.5%) | 13 (6.5%) |
| 3-Person Households | 61 (30.5%) | 0 (0.0%) |
| 4-Person Households | 52 (26.0%) | 0 (0.0%) |
| 5-Person Households | 3 (1.5%) | 0 (0.0%) |
| 6-Person Households | 6 (3.0%) | 0 (0.0%) |
| 7+ Person Households | 0 (0.0%) | 0 (0.0%) |
| Total | 157 (78.5%) | 43 (21.5%) |
Female Fertility in Ringwood
Fertility by Age in Ringwood
Average fertility rate in Ringwood is 131.0 births per 1,000 women. Women in the age bracket of 20 to 34 years have the highest fertility rate with 354.0 births per 1,000 women. Women in the age bracket of 20 to 34 years acount for 100.0% of all women with births.
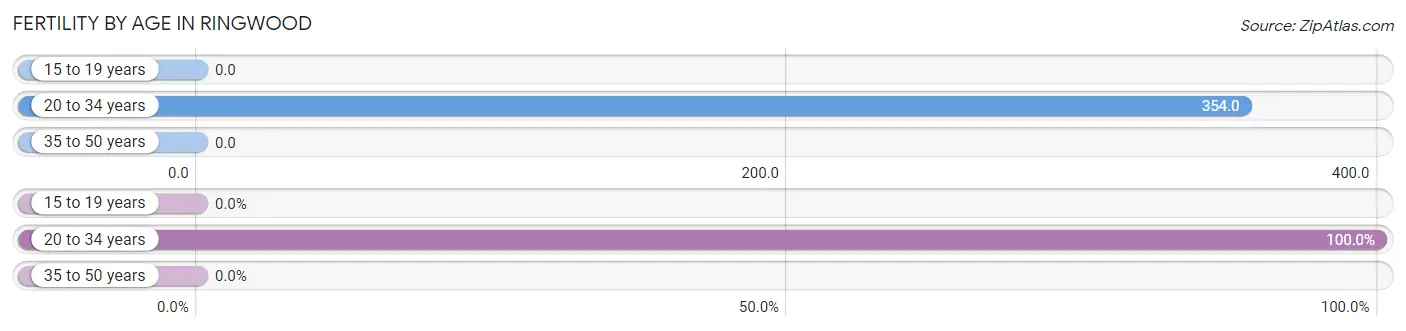
| Age Bracket | Women with Births | Births / 1,000 Women |
| 15 to 19 years | 0 (0.0%) | 0.0 |
| 20 to 34 years | 17 (100.0%) | 354.0 |
| 35 to 50 years | 0 (0.0%) | 0.0 |
| Total | 17 (100.0%) | 131.0 |
Fertility by Age by Marriage Status in Ringwood
41.2% of women with births (17) in Ringwood are married. The highest percentage of unmarried women with births falls into 20 to 34 years age bracket with 58.8% of them unmarried at the time of birth, while the lowest percentage of unmarried women with births belong to 20 to 34 years age bracket with 58.8% of them unmarried.
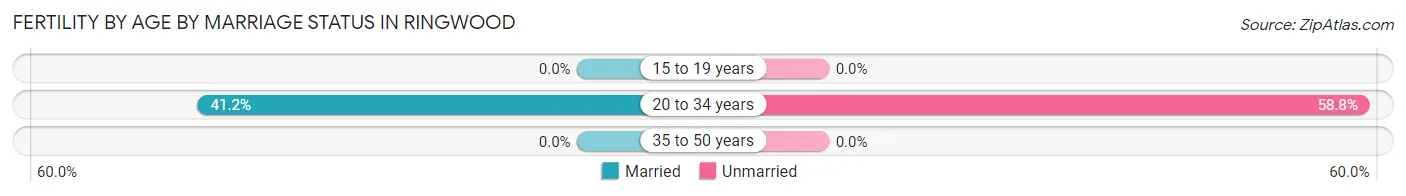
| Age Bracket | Married | Unmarried |
| 15 to 19 years | 0 (0.0%) | 0 (0.0%) |
| 20 to 34 years | 7 (41.2%) | 10 (58.8%) |
| 35 to 50 years | 0 (0.0%) | 0 (0.0%) |
| Total | 7 (41.2%) | 10 (58.8%) |
Fertility by Education in Ringwood
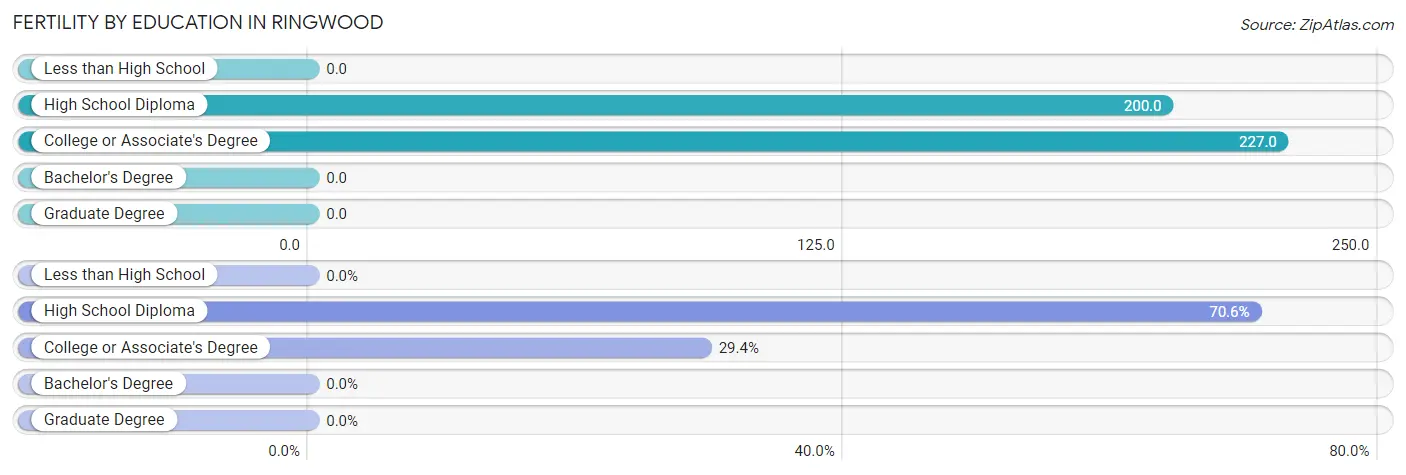
| Educational Attainment | Women with Births | Births / 1,000 Women |
| Less than High School | 0 (0.0%) | 0.0 |
| High School Diploma | 12 (70.6%) | 200.0 |
| College or Associate's Degree | 5 (29.4%) | 227.0 |
| Bachelor's Degree | 0 (0.0%) | 0.0 |
| Graduate Degree | 0 (0.0%) | 0.0 |
| Total | 17 (100.0%) | 131.0 |
Fertility by Education by Marriage Status in Ringwood
58.8% of women with births in Ringwood are unmarried. Women with the educational attainment of college or associate's degree are most likely to be married with 100.0% of them married at childbirth, while women with the educational attainment of high school diploma are least likely to be married with 83.3% of them unmarried at childbirth.
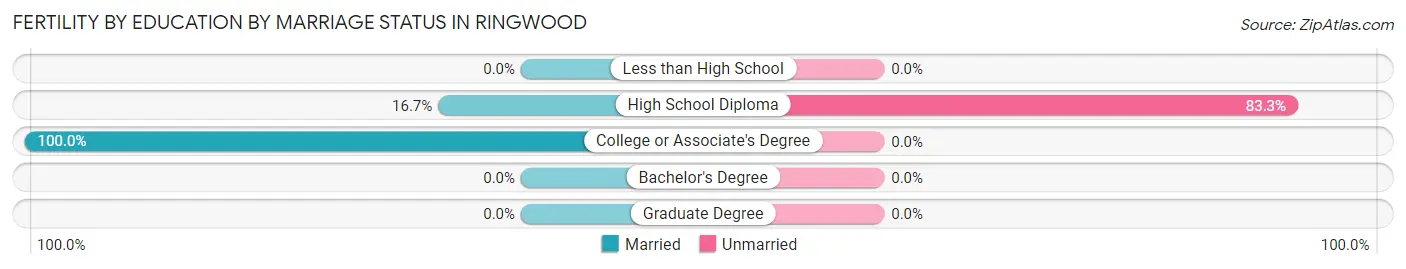
| Educational Attainment | Married | Unmarried |
| Less than High School | 0 (0.0%) | 0 (0.0%) |
| High School Diploma | 2 (16.7%) | 10 (83.3%) |
| College or Associate's Degree | 5 (100.0%) | 0 (0.0%) |
| Bachelor's Degree | 0 (0.0%) | 0 (0.0%) |
| Graduate Degree | 0 (0.0%) | 0 (0.0%) |
| Total | 7 (41.2%) | 10 (58.8%) |
Employment Characteristics in Ringwood
Employment by Class of Employer in Ringwood
Among the 192 employed individuals in Ringwood, private company employees (135 | 70.3%), self-employed (not incorporated) (22 | 11.5%), and local government employees (21 | 10.9%) make up the most common classes of employment.
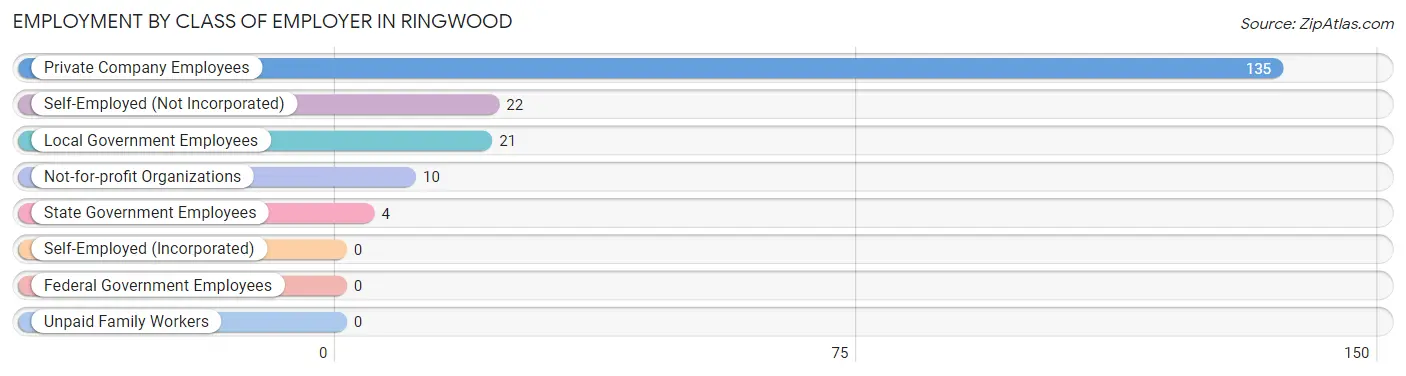
| Employer Class | # Employees | % Employees |
| Private Company Employees | 135 | 70.3% |
| Self-Employed (Incorporated) | 0 | 0.0% |
| Self-Employed (Not Incorporated) | 22 | 11.5% |
| Not-for-profit Organizations | 10 | 5.2% |
| Local Government Employees | 21 | 10.9% |
| State Government Employees | 4 | 2.1% |
| Federal Government Employees | 0 | 0.0% |
| Unpaid Family Workers | 0 | 0.0% |
| Total | 192 | 100.0% |
Employment Status by Age in Ringwood
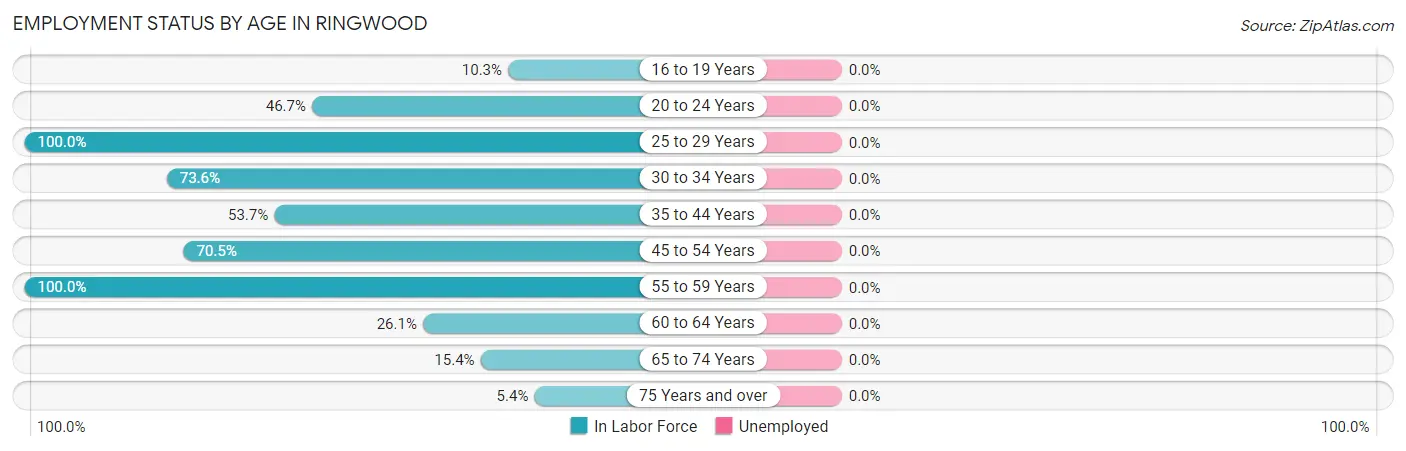
| Age Bracket | In Labor Force | Unemployed |
| 16 to 19 Years | 3 (10.3%) | 0 (0.0%) |
| 20 to 24 Years | 14 (46.7%) | 0 (0.0%) |
| 25 to 29 Years | 18 (100.0%) | 0 (0.0%) |
| 30 to 34 Years | 39 (73.6%) | 0 (0.0%) |
| 35 to 44 Years | 29 (53.7%) | 0 (0.0%) |
| 45 to 54 Years | 74 (70.5%) | 0 (0.0%) |
| 55 to 59 Years | 8 (100.0%) | 0 (0.0%) |
| 60 to 64 Years | 6 (26.1%) | 0 (0.0%) |
| 65 to 74 Years | 4 (15.4%) | 0 (0.0%) |
| 75 Years and over | 2 (5.4%) | 0 (0.0%) |
| Total | 197 (51.4%) | 0 (0.0%) |
Employment Status by Educational Attainment in Ringwood
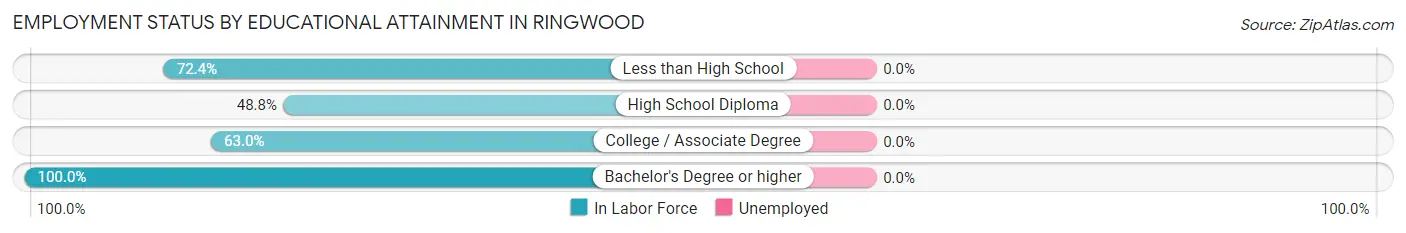
| Educational Attainment | In Labor Force | Unemployed |
| Less than High School | 76 (72.4%) | 0 (0.0%) |
| High School Diploma | 39 (48.8%) | 0 (0.0%) |
| College / Associate Degree | 29 (63.0%) | 0 (0.0%) |
| Bachelor's Degree or higher | 30 (100.0%) | 0 (0.0%) |
| Total | 174 (66.7%) | 0 (0.0%) |
Employment Occupations by Sex in Ringwood
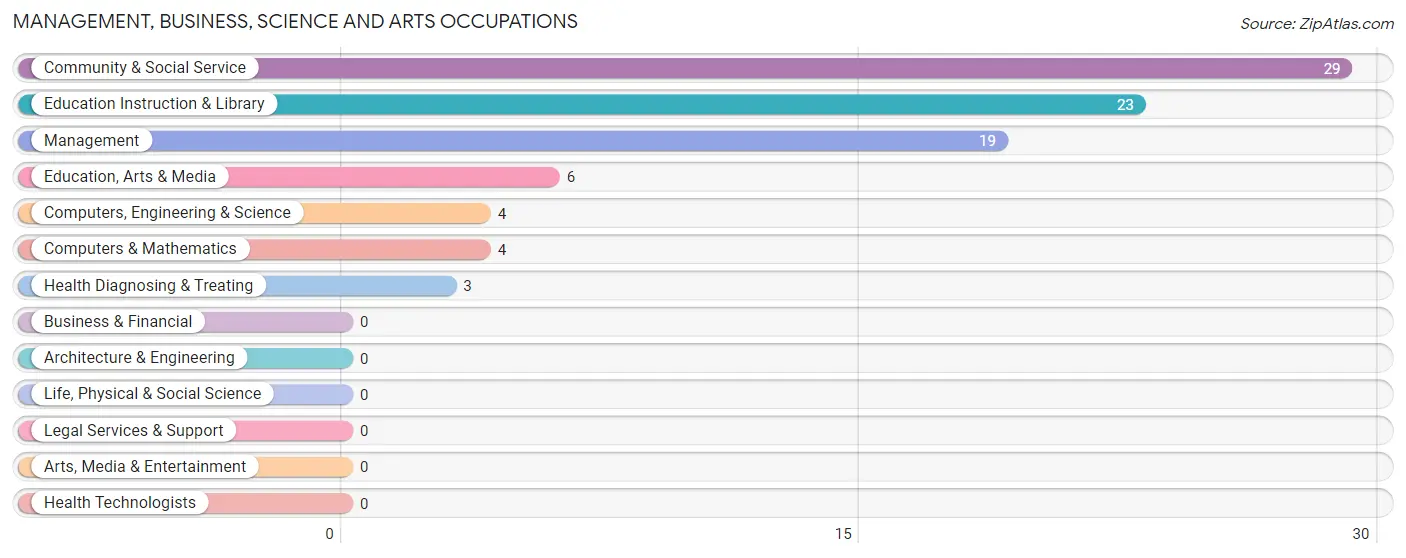
Management, Business, Science and Arts Occupations
The most common Management, Business, Science and Arts occupations in Ringwood are Community & Social Service (29 | 14.7%), Education Instruction & Library (23 | 11.7%), Management (19 | 9.6%), Education, Arts & Media (6 | 3.0%), and Computers, Engineering & Science (4 | 2.0%).
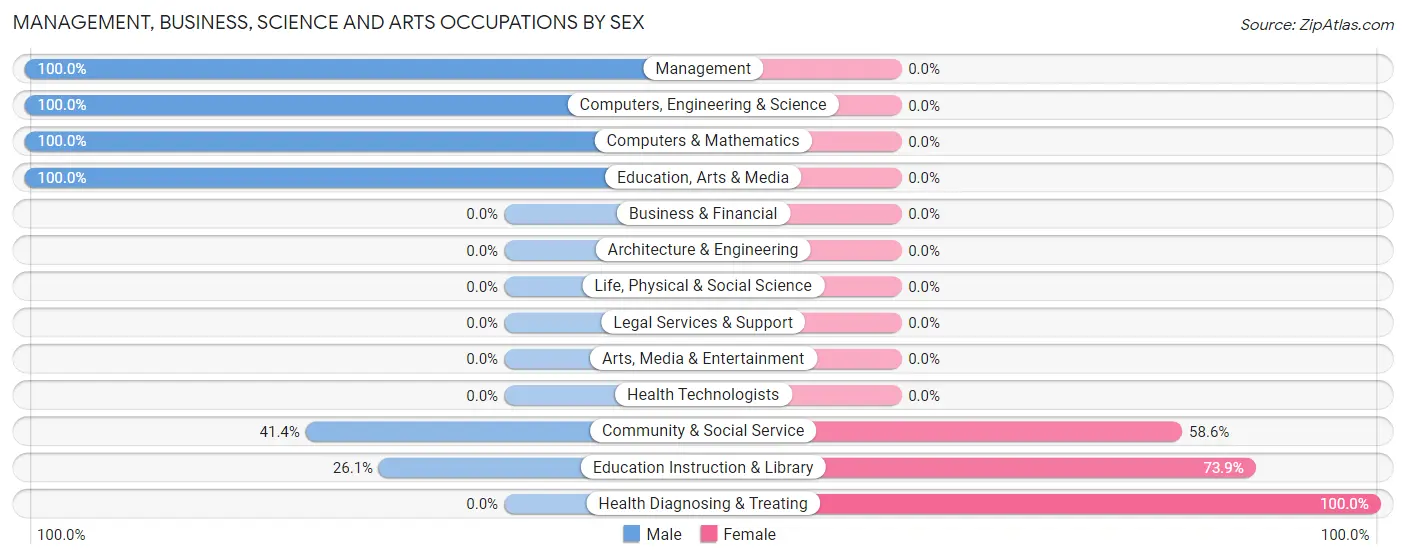
Management, Business, Science and Arts Occupations by Sex
Within the Management, Business, Science and Arts occupations in Ringwood, the most male-oriented occupations are Management (100.0%), Computers, Engineering & Science (100.0%), and Computers & Mathematics (100.0%), while the most female-oriented occupations are Health Diagnosing & Treating (100.0%), Education Instruction & Library (73.9%), and Community & Social Service (58.6%).
| Occupation | Male | Female |
| Management | 19 (100.0%) | 0 (0.0%) |
| Business & Financial | 0 (0.0%) | 0 (0.0%) |
| Computers, Engineering & Science | 4 (100.0%) | 0 (0.0%) |
| Computers & Mathematics | 4 (100.0%) | 0 (0.0%) |
| Architecture & Engineering | 0 (0.0%) | 0 (0.0%) |
| Life, Physical & Social Science | 0 (0.0%) | 0 (0.0%) |
| Community & Social Service | 12 (41.4%) | 17 (58.6%) |
| Education, Arts & Media | 6 (100.0%) | 0 (0.0%) |
| Legal Services & Support | 0 (0.0%) | 0 (0.0%) |
| Education Instruction & Library | 6 (26.1%) | 17 (73.9%) |
| Arts, Media & Entertainment | 0 (0.0%) | 0 (0.0%) |
| Health Diagnosing & Treating | 0 (0.0%) | 3 (100.0%) |
| Health Technologists | 0 (0.0%) | 0 (0.0%) |
| Total (Category) | 35 (63.6%) | 20 (36.4%) |
| Total (Overall) | 101 (51.3%) | 96 (48.7%) |
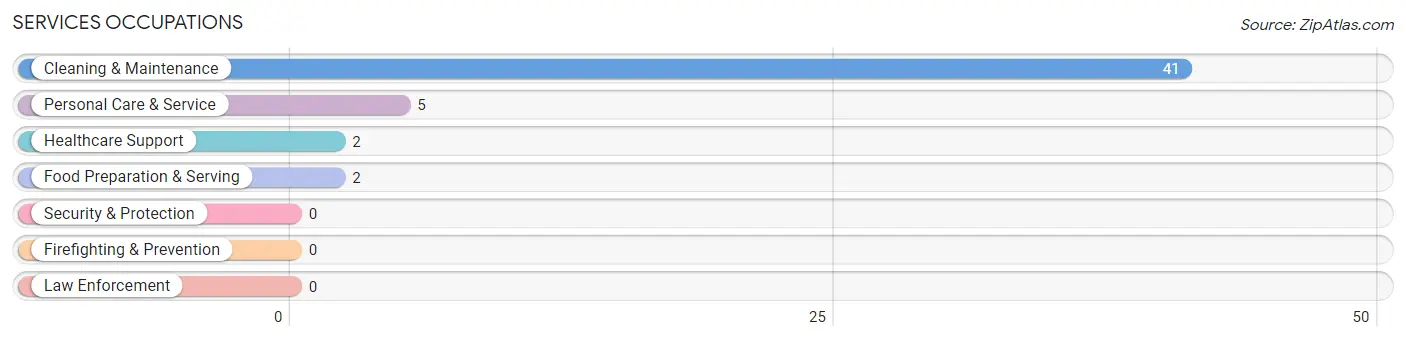
Services Occupations
The most common Services occupations in Ringwood are Cleaning & Maintenance (41 | 20.8%), Personal Care & Service (5 | 2.5%), Healthcare Support (2 | 1.0%), and Food Preparation & Serving (2 | 1.0%).
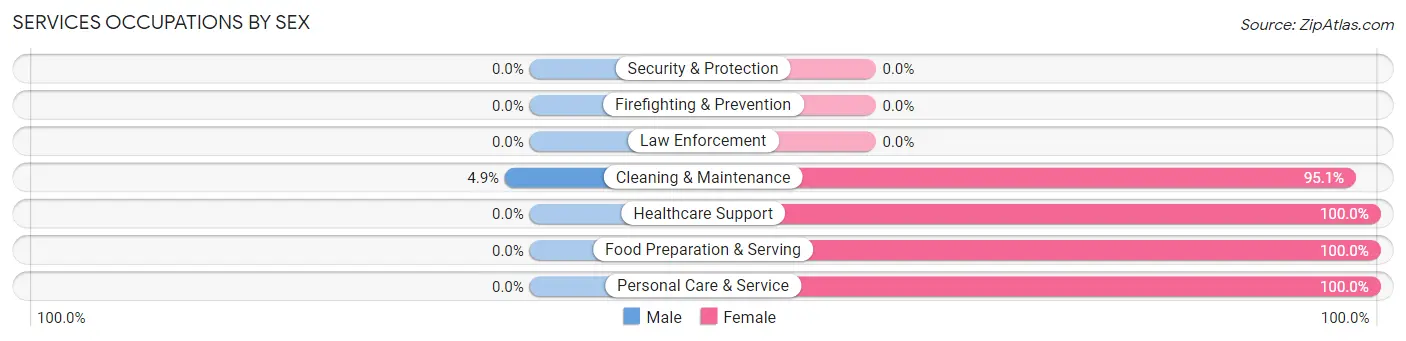
Services Occupations by Sex
| Occupation | Male | Female |
| Healthcare Support | 0 (0.0%) | 2 (100.0%) |
| Security & Protection | 0 (0.0%) | 0 (0.0%) |
| Firefighting & Prevention | 0 (0.0%) | 0 (0.0%) |
| Law Enforcement | 0 (0.0%) | 0 (0.0%) |
| Food Preparation & Serving | 0 (0.0%) | 2 (100.0%) |
| Cleaning & Maintenance | 2 (4.9%) | 39 (95.1%) |
| Personal Care & Service | 0 (0.0%) | 5 (100.0%) |
| Total (Category) | 2 (4.0%) | 48 (96.0%) |
| Total (Overall) | 101 (51.3%) | 96 (48.7%) |
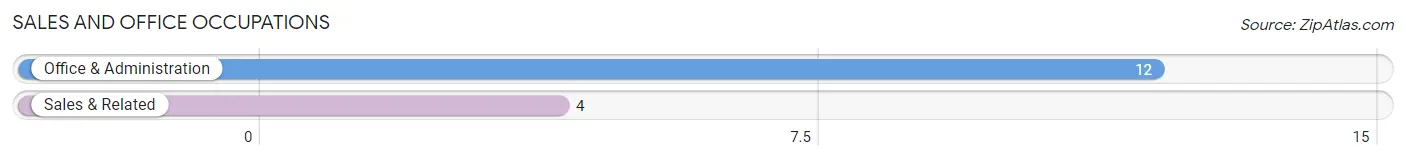
Sales and Office Occupations
The most common Sales and Office occupations in Ringwood are Office & Administration (12 | 6.1%), and Sales & Related (4 | 2.0%).
Sales and Office Occupations by Sex
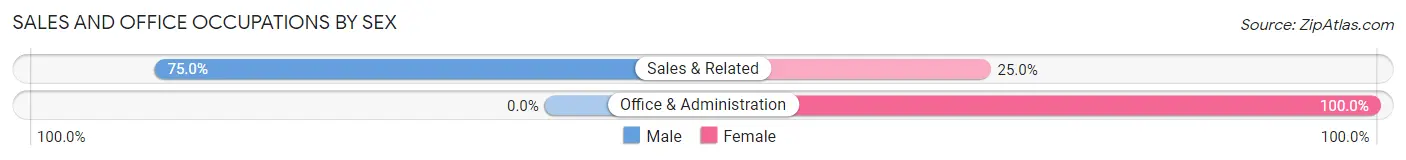
| Occupation | Male | Female |
| Sales & Related | 3 (75.0%) | 1 (25.0%) |
| Office & Administration | 0 (0.0%) | 12 (100.0%) |
| Total (Category) | 3 (18.8%) | 13 (81.2%) |
| Total (Overall) | 101 (51.3%) | 96 (48.7%) |
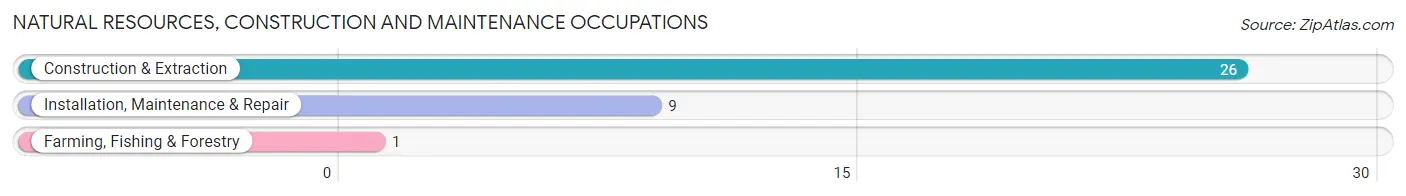
Natural Resources, Construction and Maintenance Occupations
The most common Natural Resources, Construction and Maintenance occupations in Ringwood are Construction & Extraction (26 | 13.2%), Installation, Maintenance & Repair (9 | 4.6%), and Farming, Fishing & Forestry (1 | 0.5%).
Natural Resources, Construction and Maintenance Occupations by Sex
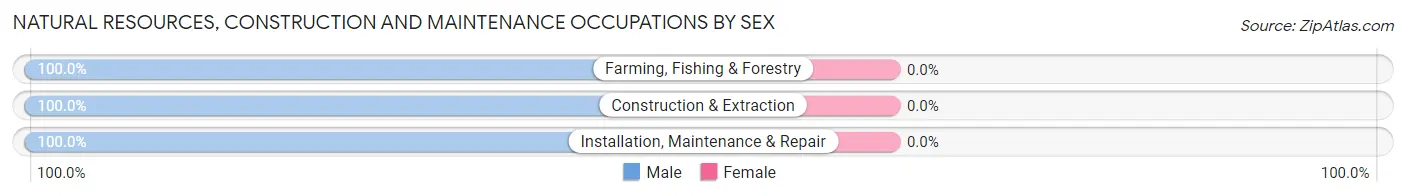
| Occupation | Male | Female |
| Farming, Fishing & Forestry | 1 (100.0%) | 0 (0.0%) |
| Construction & Extraction | 26 (100.0%) | 0 (0.0%) |
| Installation, Maintenance & Repair | 9 (100.0%) | 0 (0.0%) |
| Total (Category) | 36 (100.0%) | 0 (0.0%) |
| Total (Overall) | 101 (51.3%) | 96 (48.7%) |
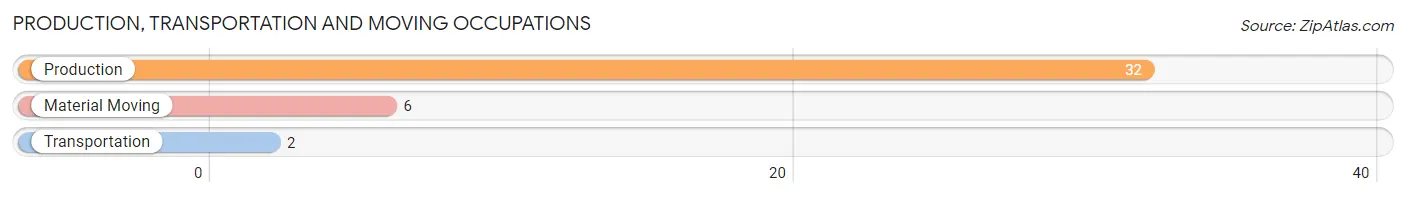
Production, Transportation and Moving Occupations
The most common Production, Transportation and Moving occupations in Ringwood are Production (32 | 16.2%), Material Moving (6 | 3.0%), and Transportation (2 | 1.0%).
Production, Transportation and Moving Occupations by Sex
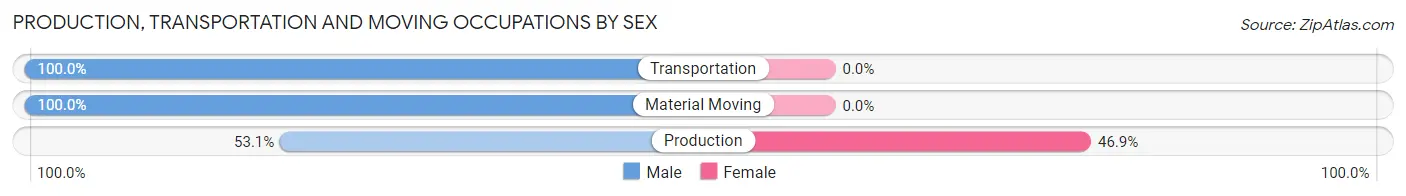
| Occupation | Male | Female |
| Production | 17 (53.1%) | 15 (46.9%) |
| Transportation | 2 (100.0%) | 0 (0.0%) |
| Material Moving | 6 (100.0%) | 0 (0.0%) |
| Total (Category) | 25 (62.5%) | 15 (37.5%) |
| Total (Overall) | 101 (51.3%) | 96 (48.7%) |
Employment Industries by Sex in Ringwood
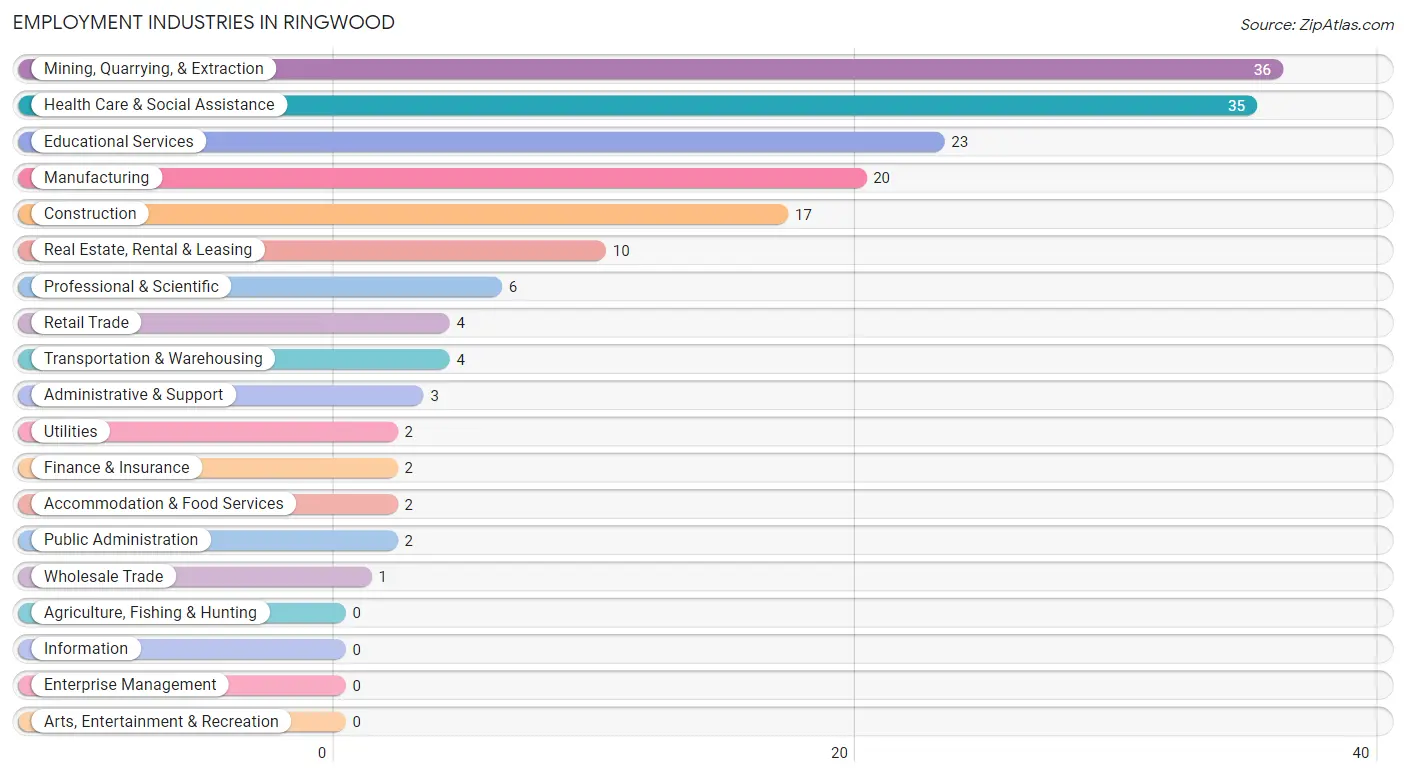
Employment Industries in Ringwood
The major employment industries in Ringwood include Mining, Quarrying, & Extraction (36 | 18.3%), Health Care & Social Assistance (35 | 17.8%), Educational Services (23 | 11.7%), Manufacturing (20 | 10.2%), and Construction (17 | 8.6%).
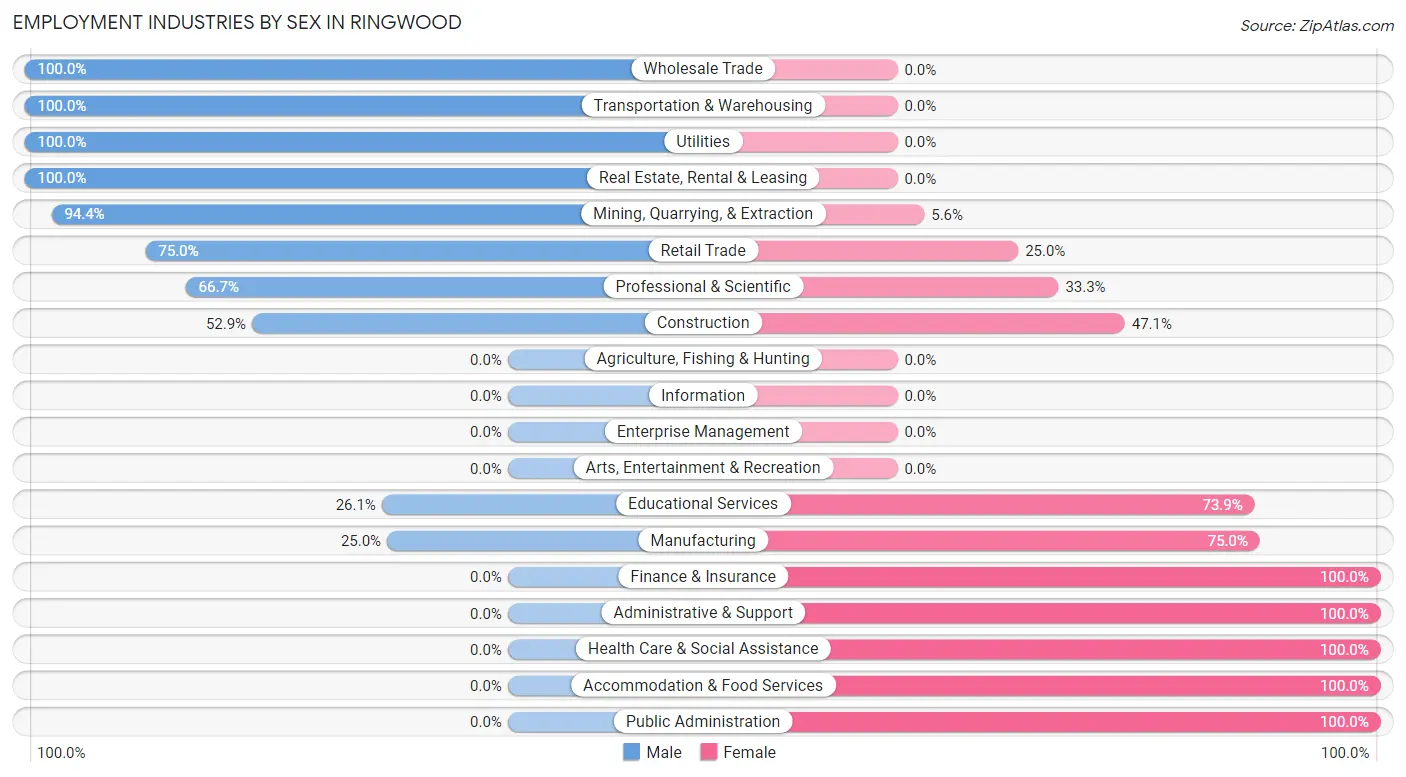
Employment Industries by Sex in Ringwood
The Ringwood industries that see more men than women are Wholesale Trade (100.0%), Transportation & Warehousing (100.0%), and Utilities (100.0%), whereas the industries that tend to have a higher number of women are Finance & Insurance (100.0%), Administrative & Support (100.0%), and Health Care & Social Assistance (100.0%).
| Industry | Male | Female |
| Agriculture, Fishing & Hunting | 0 (0.0%) | 0 (0.0%) |
| Mining, Quarrying, & Extraction | 34 (94.4%) | 2 (5.6%) |
| Construction | 9 (52.9%) | 8 (47.1%) |
| Manufacturing | 5 (25.0%) | 15 (75.0%) |
| Wholesale Trade | 1 (100.0%) | 0 (0.0%) |
| Retail Trade | 3 (75.0%) | 1 (25.0%) |
| Transportation & Warehousing | 4 (100.0%) | 0 (0.0%) |
| Utilities | 2 (100.0%) | 0 (0.0%) |
| Information | 0 (0.0%) | 0 (0.0%) |
| Finance & Insurance | 0 (0.0%) | 2 (100.0%) |
| Real Estate, Rental & Leasing | 10 (100.0%) | 0 (0.0%) |
| Professional & Scientific | 4 (66.7%) | 2 (33.3%) |
| Enterprise Management | 0 (0.0%) | 0 (0.0%) |
| Administrative & Support | 0 (0.0%) | 3 (100.0%) |
| Educational Services | 6 (26.1%) | 17 (73.9%) |
| Health Care & Social Assistance | 0 (0.0%) | 35 (100.0%) |
| Arts, Entertainment & Recreation | 0 (0.0%) | 0 (0.0%) |
| Accommodation & Food Services | 0 (0.0%) | 2 (100.0%) |
| Public Administration | 0 (0.0%) | 2 (100.0%) |
| Total | 101 (51.3%) | 96 (48.7%) |
Education in Ringwood
School Enrollment in Ringwood
The most common levels of schooling among the 150 students in Ringwood are elementary school (53 | 35.3%), middle school (48 | 32.0%), and high school (34 | 22.7%).
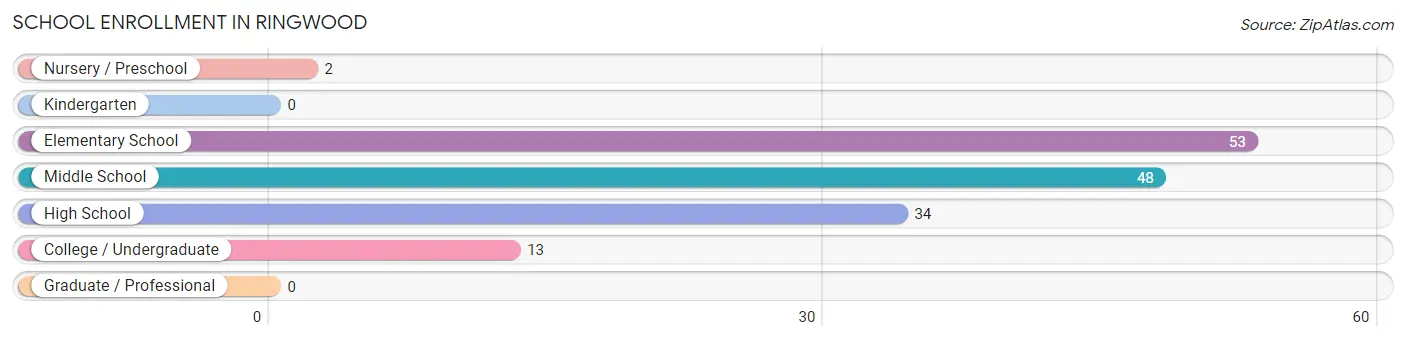
| School Level | # Students | % Students |
| Nursery / Preschool | 2 | 1.3% |
| Kindergarten | 0 | 0.0% |
| Elementary School | 53 | 35.3% |
| Middle School | 48 | 32.0% |
| High School | 34 | 22.7% |
| College / Undergraduate | 13 | 8.7% |
| Graduate / Professional | 0 | 0.0% |
| Total | 150 | 100.0% |
School Enrollment by Age by Funding Source in Ringwood
Out of a total of 150 students who are enrolled in schools in Ringwood, 3 (2.0%) attend a private institution, while the remaining 147 (98.0%) are enrolled in public schools. The age group of 3 to 4 year olds has the highest likelihood of being enrolled in private schools, with 2 (100.0% in the age bracket) enrolled. Conversely, the age group of 5 to 9 year old has the lowest likelihood of being enrolled in a private school, with 22 (100.0% in the age bracket) attending a public institution.
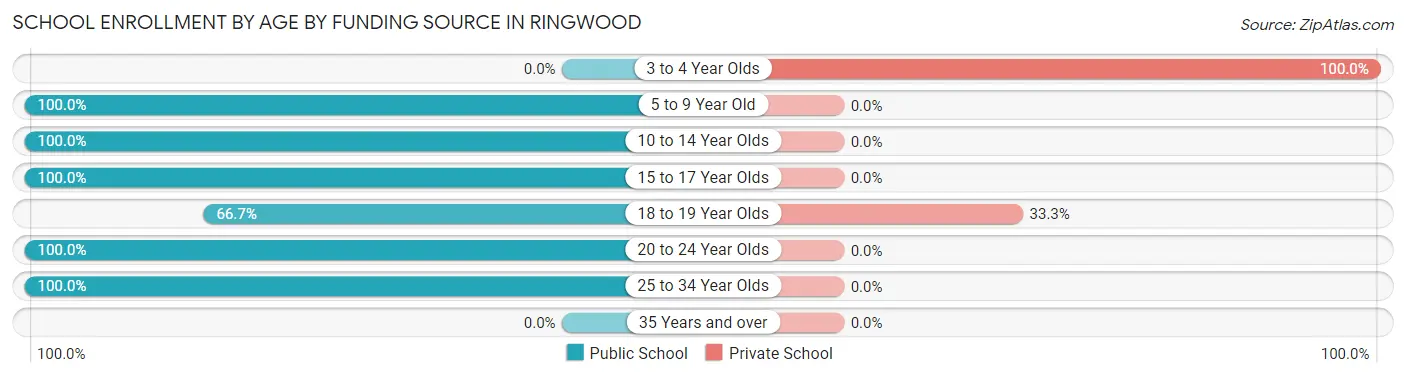
| Age Bracket | Public School | Private School |
| 3 to 4 Year Olds | 0 (0.0%) | 2 (100.0%) |
| 5 to 9 Year Old | 22 (100.0%) | 0 (0.0%) |
| 10 to 14 Year Olds | 79 (100.0%) | 0 (0.0%) |
| 15 to 17 Year Olds | 33 (100.0%) | 0 (0.0%) |
| 18 to 19 Year Olds | 2 (66.7%) | 1 (33.3%) |
| 20 to 24 Year Olds | 3 (100.0%) | 0 (0.0%) |
| 25 to 34 Year Olds | 8 (100.0%) | 0 (0.0%) |
| 35 Years and over | 0 (0.0%) | 0 (0.0%) |
| Total | 147 (98.0%) | 3 (2.0%) |
Educational Attainment by Field of Study in Ringwood
Education (10 | 32.3%), business (8 | 25.8%), liberal arts & history (6 | 19.4%), computers & mathematics (5 | 16.1%), and bio, nature & agricultural (2 | 6.5%) are the most common fields of study among 31 individuals in Ringwood who have obtained a bachelor's degree or higher.
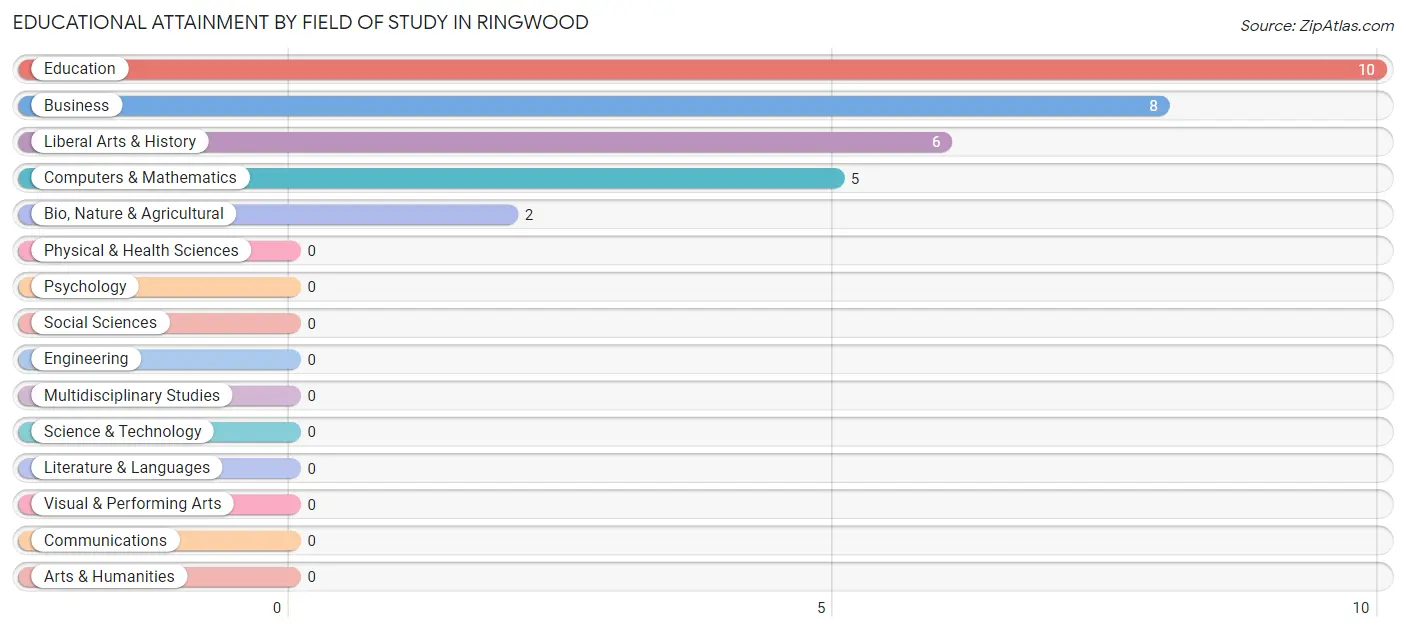
| Field of Study | # Graduates | % Graduates |
| Computers & Mathematics | 5 | 16.1% |
| Bio, Nature & Agricultural | 2 | 6.5% |
| Physical & Health Sciences | 0 | 0.0% |
| Psychology | 0 | 0.0% |
| Social Sciences | 0 | 0.0% |
| Engineering | 0 | 0.0% |
| Multidisciplinary Studies | 0 | 0.0% |
| Science & Technology | 0 | 0.0% |
| Business | 8 | 25.8% |
| Education | 10 | 32.3% |
| Literature & Languages | 0 | 0.0% |
| Liberal Arts & History | 6 | 19.4% |
| Visual & Performing Arts | 0 | 0.0% |
| Communications | 0 | 0.0% |
| Arts & Humanities | 0 | 0.0% |
| Total | 31 | 100.0% |
Transportation & Commute in Ringwood
Vehicle Availability by Sex in Ringwood
The most prevalent vehicle ownership categories in Ringwood are males with 2 vehicles (46, accounting for 45.5%) and females with 2 vehicles (26, making up 50.5%).
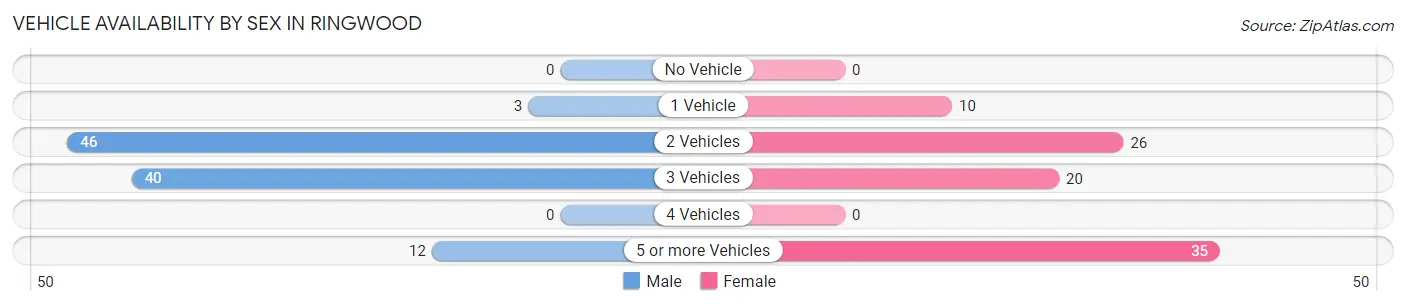
| Vehicles Available | Male | Female |
| No Vehicle | 0 (0.0%) | 0 (0.0%) |
| 1 Vehicle | 3 (3.0%) | 10 (11.0%) |
| 2 Vehicles | 46 (45.5%) | 26 (28.6%) |
| 3 Vehicles | 40 (39.6%) | 20 (22.0%) |
| 4 Vehicles | 0 (0.0%) | 0 (0.0%) |
| 5 or more Vehicles | 12 (11.9%) | 35 (38.5%) |
| Total | 101 (100.0%) | 91 (100.0%) |
Commute Time in Ringwood
The most frequently occuring commute durations in Ringwood are less than 5 minutes (47 commuters, 24.5%), 25 to 29 minutes (32 commuters, 16.7%), and 5 to 9 minutes (28 commuters, 14.6%).
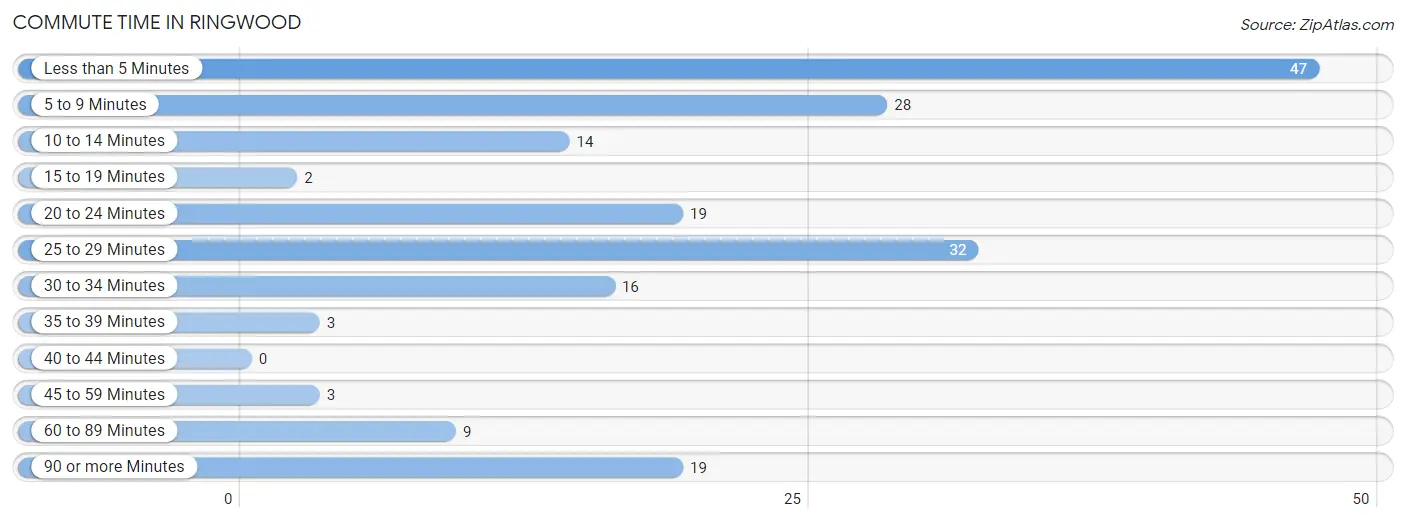
| Commute Time | # Commuters | % Commuters |
| Less than 5 Minutes | 47 | 24.5% |
| 5 to 9 Minutes | 28 | 14.6% |
| 10 to 14 Minutes | 14 | 7.3% |
| 15 to 19 Minutes | 2 | 1.0% |
| 20 to 24 Minutes | 19 | 9.9% |
| 25 to 29 Minutes | 32 | 16.7% |
| 30 to 34 Minutes | 16 | 8.3% |
| 35 to 39 Minutes | 3 | 1.6% |
| 40 to 44 Minutes | 0 | 0.0% |
| 45 to 59 Minutes | 3 | 1.6% |
| 60 to 89 Minutes | 9 | 4.7% |
| 90 or more Minutes | 19 | 9.9% |
Commute Time by Sex in Ringwood
The most common commute times in Ringwood are less than 5 minutes (24 commuters, 23.8%) for males and 25 to 29 minutes (32 commuters, 35.2%) for females.
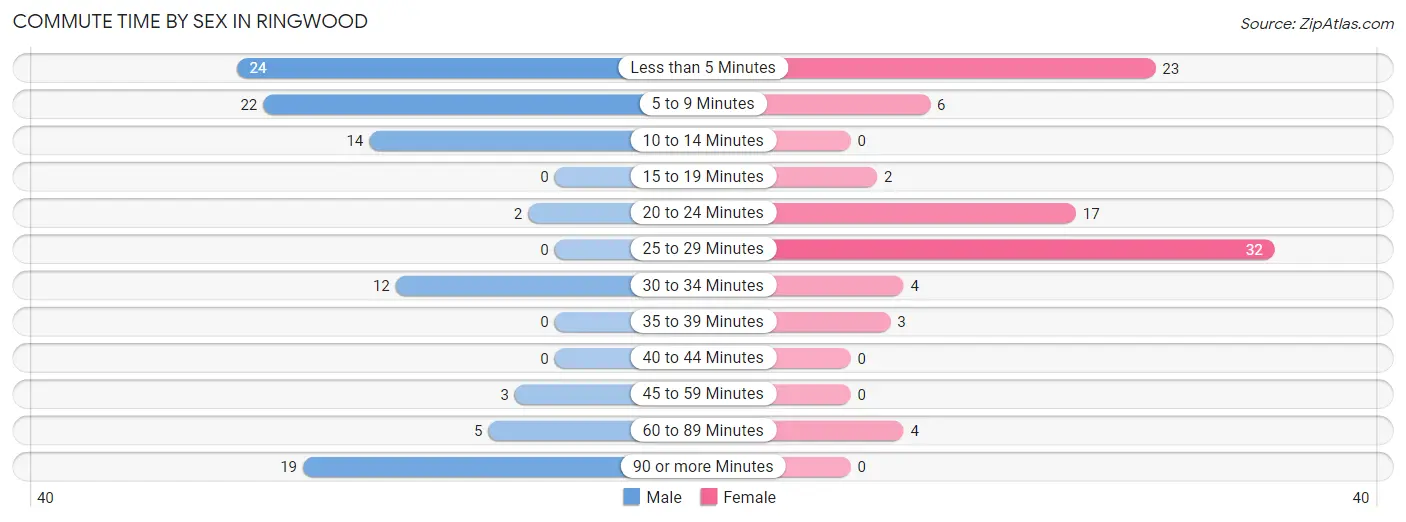
| Commute Time | Male | Female |
| Less than 5 Minutes | 24 (23.8%) | 23 (25.3%) |
| 5 to 9 Minutes | 22 (21.8%) | 6 (6.6%) |
| 10 to 14 Minutes | 14 (13.9%) | 0 (0.0%) |
| 15 to 19 Minutes | 0 (0.0%) | 2 (2.2%) |
| 20 to 24 Minutes | 2 (2.0%) | 17 (18.7%) |
| 25 to 29 Minutes | 0 (0.0%) | 32 (35.2%) |
| 30 to 34 Minutes | 12 (11.9%) | 4 (4.4%) |
| 35 to 39 Minutes | 0 (0.0%) | 3 (3.3%) |
| 40 to 44 Minutes | 0 (0.0%) | 0 (0.0%) |
| 45 to 59 Minutes | 3 (3.0%) | 0 (0.0%) |
| 60 to 89 Minutes | 5 (5.0%) | 4 (4.4%) |
| 90 or more Minutes | 19 (18.8%) | 0 (0.0%) |
Time of Departure to Work by Sex in Ringwood
The most frequent times of departure to work in Ringwood are 12:00 AM to 4:59 AM (19, 18.8%) for males and 5:30 AM to 5:59 AM (37, 40.7%) for females.
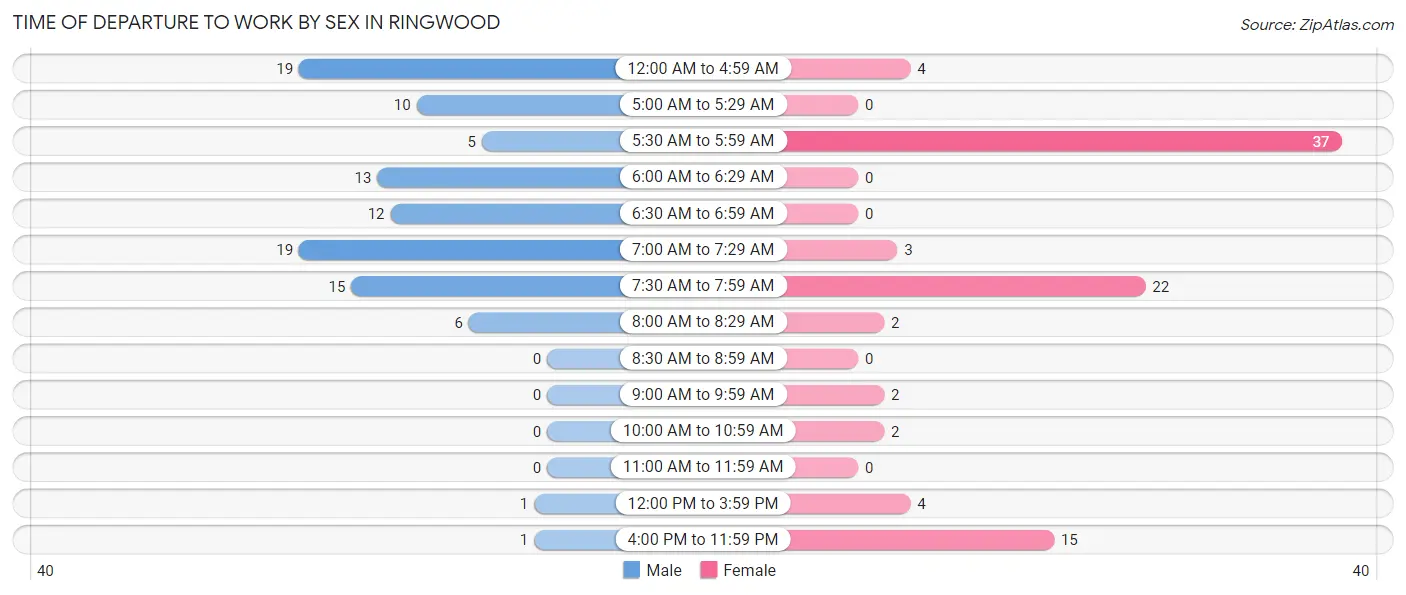
| Time of Departure | Male | Female |
| 12:00 AM to 4:59 AM | 19 (18.8%) | 4 (4.4%) |
| 5:00 AM to 5:29 AM | 10 (9.9%) | 0 (0.0%) |
| 5:30 AM to 5:59 AM | 5 (5.0%) | 37 (40.7%) |
| 6:00 AM to 6:29 AM | 13 (12.9%) | 0 (0.0%) |
| 6:30 AM to 6:59 AM | 12 (11.9%) | 0 (0.0%) |
| 7:00 AM to 7:29 AM | 19 (18.8%) | 3 (3.3%) |
| 7:30 AM to 7:59 AM | 15 (14.8%) | 22 (24.2%) |
| 8:00 AM to 8:29 AM | 6 (5.9%) | 2 (2.2%) |
| 8:30 AM to 8:59 AM | 0 (0.0%) | 0 (0.0%) |
| 9:00 AM to 9:59 AM | 0 (0.0%) | 2 (2.2%) |
| 10:00 AM to 10:59 AM | 0 (0.0%) | 2 (2.2%) |
| 11:00 AM to 11:59 AM | 0 (0.0%) | 0 (0.0%) |
| 12:00 PM to 3:59 PM | 1 (1.0%) | 4 (4.4%) |
| 4:00 PM to 11:59 PM | 1 (1.0%) | 15 (16.5%) |
| Total | 101 (100.0%) | 91 (100.0%) |
Housing Occupancy in Ringwood
Occupancy by Ownership in Ringwood
Of the total 200 dwellings in Ringwood, owner-occupied units account for 166 (83.0%), while renter-occupied units make up 34 (17.0%).
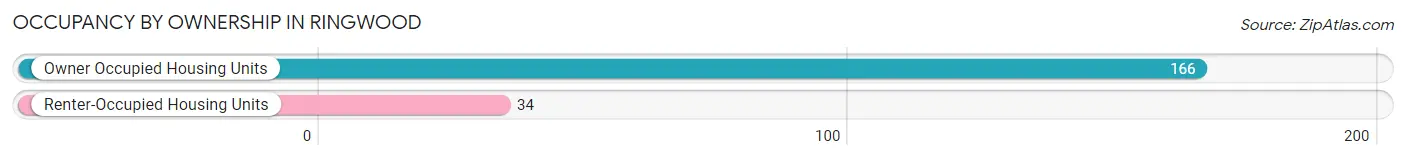
| Occupancy | # Housing Units | % Housing Units |
| Owner Occupied Housing Units | 166 | 83.0% |
| Renter-Occupied Housing Units | 34 | 17.0% |
| Total Occupied Housing Units | 200 | 100.0% |
Occupancy by Household Size in Ringwood
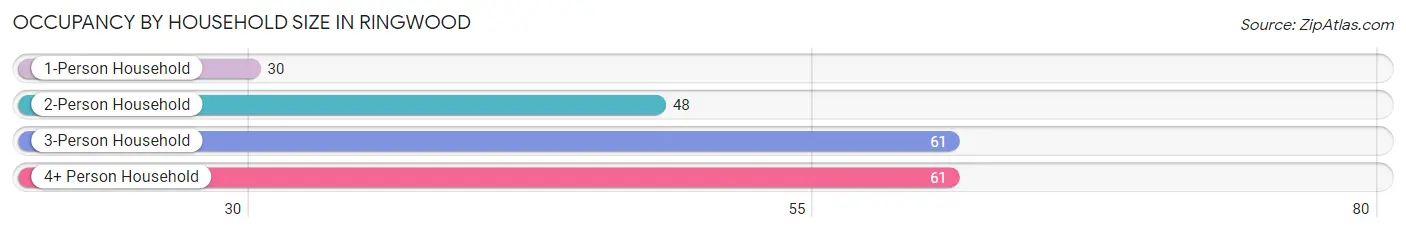
| Household Size | # Housing Units | % Housing Units |
| 1-Person Household | 30 | 15.0% |
| 2-Person Household | 48 | 24.0% |
| 3-Person Household | 61 | 30.5% |
| 4+ Person Household | 61 | 30.5% |
| Total Housing Units | 200 | 100.0% |
Occupancy by Ownership by Household Size in Ringwood
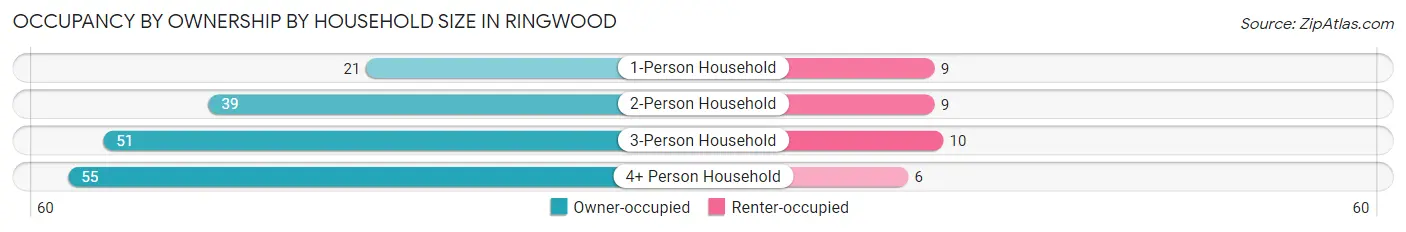
| Household Size | Owner-occupied | Renter-occupied |
| 1-Person Household | 21 (70.0%) | 9 (30.0%) |
| 2-Person Household | 39 (81.2%) | 9 (18.8%) |
| 3-Person Household | 51 (83.6%) | 10 (16.4%) |
| 4+ Person Household | 55 (90.2%) | 6 (9.8%) |
| Total Housing Units | 166 (83.0%) | 34 (17.0%) |
Occupancy by Educational Attainment in Ringwood
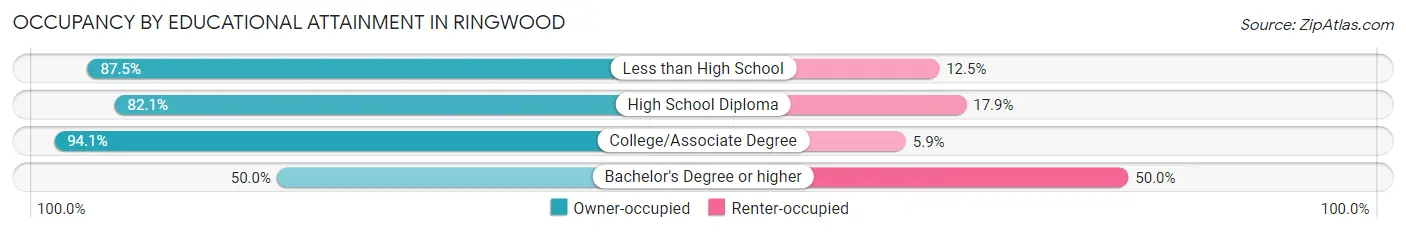
| Household Size | Owner-occupied | Renter-occupied |
| Less than High School | 56 (87.5%) | 8 (12.5%) |
| High School Diploma | 69 (82.1%) | 15 (17.9%) |
| College/Associate Degree | 32 (94.1%) | 2 (5.9%) |
| Bachelor's Degree or higher | 9 (50.0%) | 9 (50.0%) |
Occupancy by Age of Householder in Ringwood
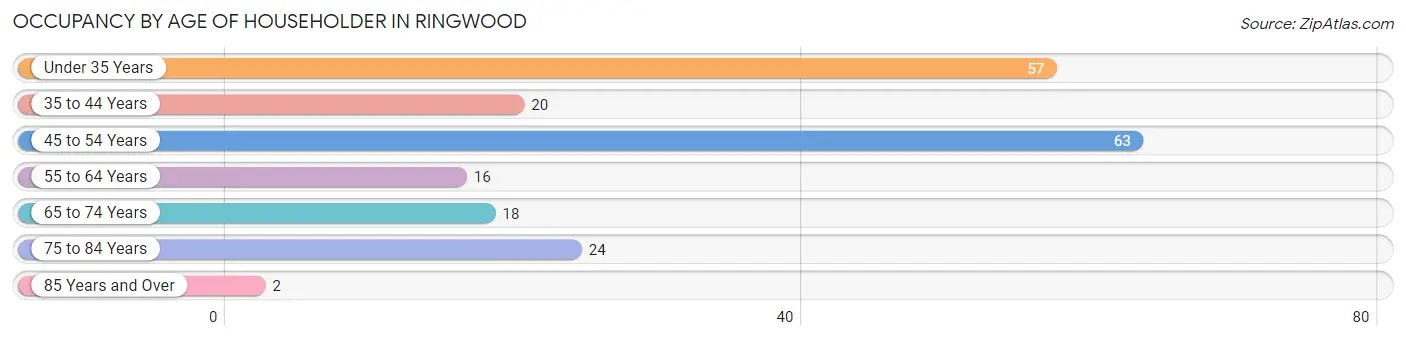
| Age Bracket | # Households | % Households |
| Under 35 Years | 57 | 28.5% |
| 35 to 44 Years | 20 | 10.0% |
| 45 to 54 Years | 63 | 31.5% |
| 55 to 64 Years | 16 | 8.0% |
| 65 to 74 Years | 18 | 9.0% |
| 75 to 84 Years | 24 | 12.0% |
| 85 Years and Over | 2 | 1.0% |
| Total | 200 | 100.0% |
Housing Finances in Ringwood
Median Income by Occupancy in Ringwood
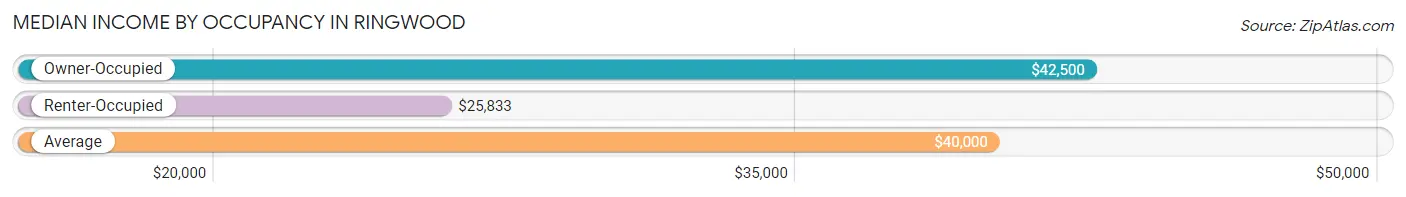
| Occupancy Type | # Households | Median Income |
| Owner-Occupied | 166 (83.0%) | $42,500 |
| Renter-Occupied | 34 (17.0%) | $25,833 |
| Average | 200 (100.0%) | $40,000 |
Occupancy by Householder Income Bracket in Ringwood
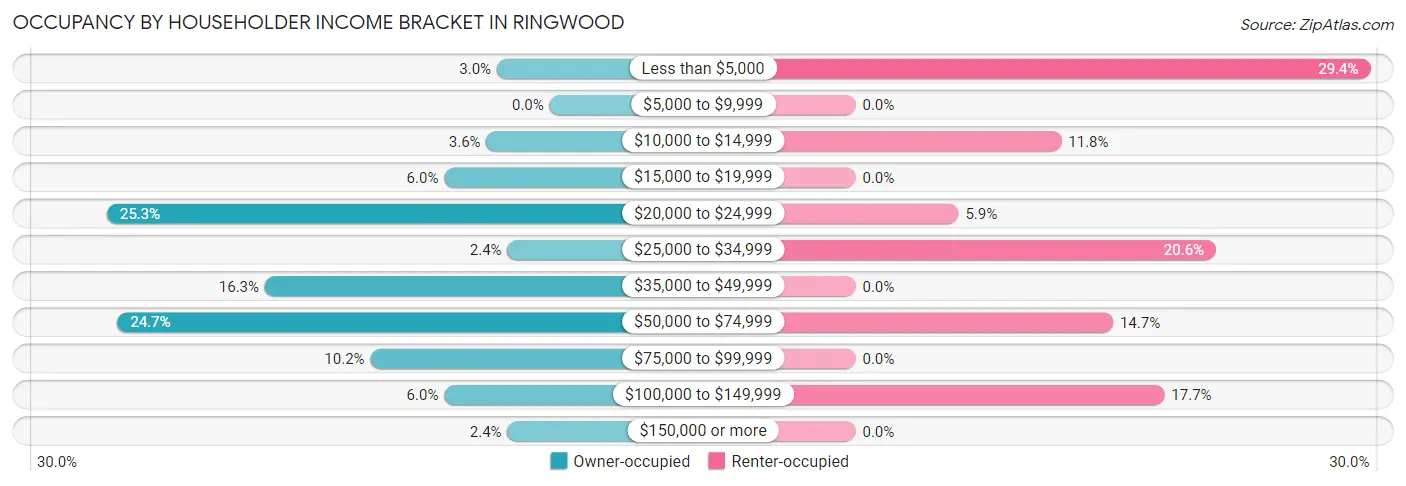
| Income Bracket | Owner-occupied | Renter-occupied |
| Less than $5,000 | 5 (3.0%) | 10 (29.4%) |
| $5,000 to $9,999 | 0 (0.0%) | 0 (0.0%) |
| $10,000 to $14,999 | 6 (3.6%) | 4 (11.8%) |
| $15,000 to $19,999 | 10 (6.0%) | 0 (0.0%) |
| $20,000 to $24,999 | 42 (25.3%) | 2 (5.9%) |
| $25,000 to $34,999 | 4 (2.4%) | 7 (20.6%) |
| $35,000 to $49,999 | 27 (16.3%) | 0 (0.0%) |
| $50,000 to $74,999 | 41 (24.7%) | 5 (14.7%) |
| $75,000 to $99,999 | 17 (10.2%) | 0 (0.0%) |
| $100,000 to $149,999 | 10 (6.0%) | 6 (17.6%) |
| $150,000 or more | 4 (2.4%) | 0 (0.0%) |
| Total | 166 (100.0%) | 34 (100.0%) |
Monthly Housing Cost Tiers in Ringwood
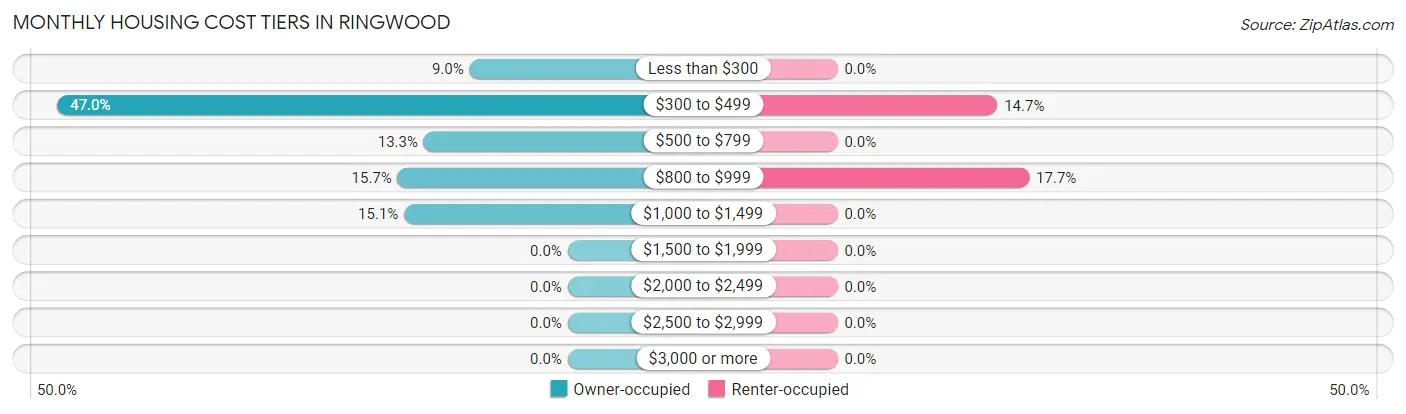
| Monthly Cost | Owner-occupied | Renter-occupied |
| Less than $300 | 15 (9.0%) | 0 (0.0%) |
| $300 to $499 | 78 (47.0%) | 5 (14.7%) |
| $500 to $799 | 22 (13.3%) | 0 (0.0%) |
| $800 to $999 | 26 (15.7%) | 6 (17.6%) |
| $1,000 to $1,499 | 25 (15.1%) | 0 (0.0%) |
| $1,500 to $1,999 | 0 (0.0%) | 0 (0.0%) |
| $2,000 to $2,499 | 0 (0.0%) | 0 (0.0%) |
| $2,500 to $2,999 | 0 (0.0%) | 0 (0.0%) |
| $3,000 or more | 0 (0.0%) | 0 (0.0%) |
| Total | 166 (100.0%) | 34 (100.0%) |
Physical Housing Characteristics in Ringwood
Housing Structures in Ringwood
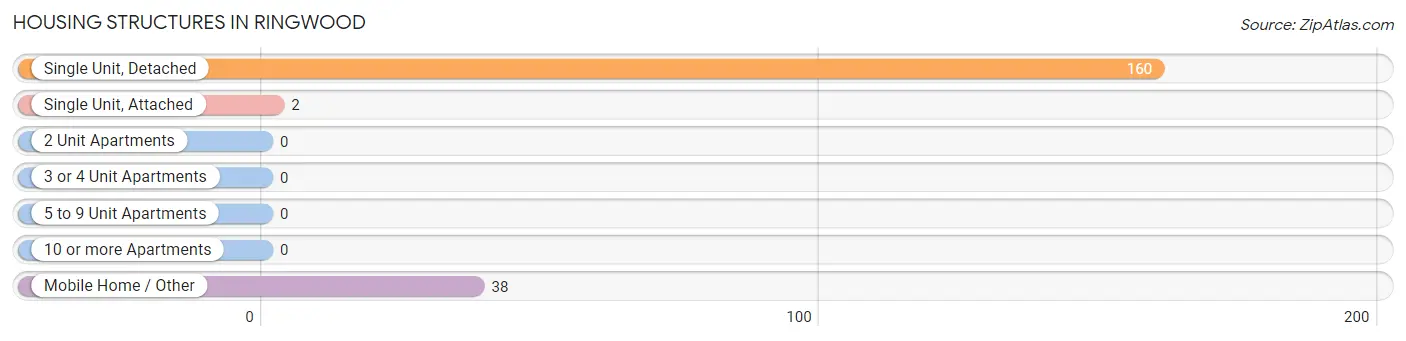
| Structure Type | # Housing Units | % Housing Units |
| Single Unit, Detached | 160 | 80.0% |
| Single Unit, Attached | 2 | 1.0% |
| 2 Unit Apartments | 0 | 0.0% |
| 3 or 4 Unit Apartments | 0 | 0.0% |
| 5 to 9 Unit Apartments | 0 | 0.0% |
| 10 or more Apartments | 0 | 0.0% |
| Mobile Home / Other | 38 | 19.0% |
| Total | 200 | 100.0% |
Housing Structures by Occupancy in Ringwood
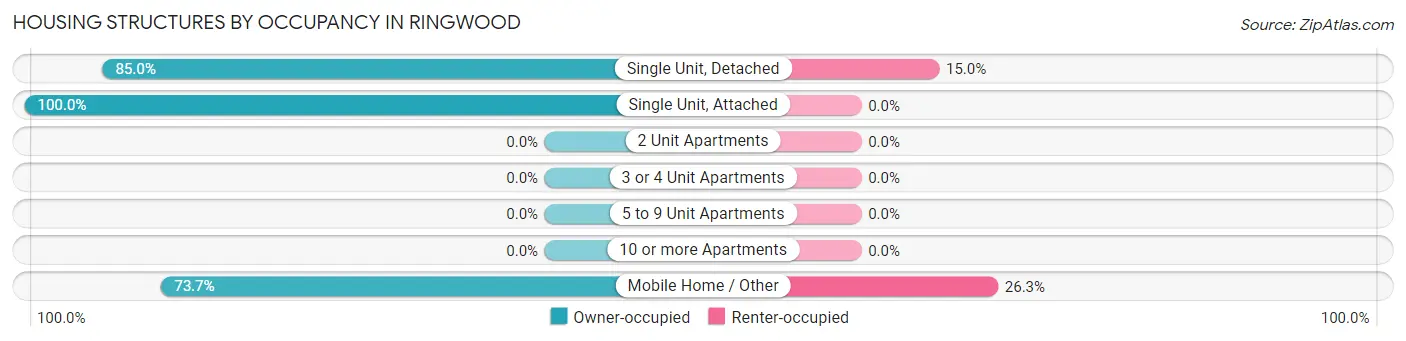
| Structure Type | Owner-occupied | Renter-occupied |
| Single Unit, Detached | 136 (85.0%) | 24 (15.0%) |
| Single Unit, Attached | 2 (100.0%) | 0 (0.0%) |
| 2 Unit Apartments | 0 (0.0%) | 0 (0.0%) |
| 3 or 4 Unit Apartments | 0 (0.0%) | 0 (0.0%) |
| 5 to 9 Unit Apartments | 0 (0.0%) | 0 (0.0%) |
| 10 or more Apartments | 0 (0.0%) | 0 (0.0%) |
| Mobile Home / Other | 28 (73.7%) | 10 (26.3%) |
| Total | 166 (83.0%) | 34 (17.0%) |
Housing Structures by Number of Rooms in Ringwood
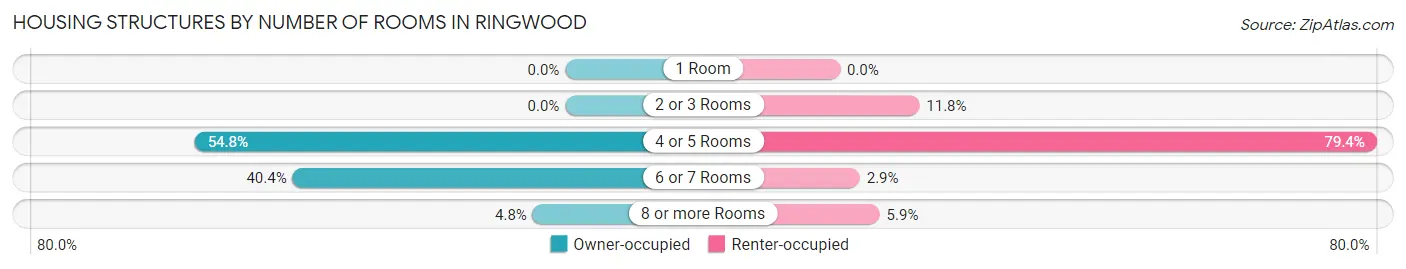
| Number of Rooms | Owner-occupied | Renter-occupied |
| 1 Room | 0 (0.0%) | 0 (0.0%) |
| 2 or 3 Rooms | 0 (0.0%) | 4 (11.8%) |
| 4 or 5 Rooms | 91 (54.8%) | 27 (79.4%) |
| 6 or 7 Rooms | 67 (40.4%) | 1 (2.9%) |
| 8 or more Rooms | 8 (4.8%) | 2 (5.9%) |
| Total | 166 (100.0%) | 34 (100.0%) |
Housing Structure by Heating Type in Ringwood
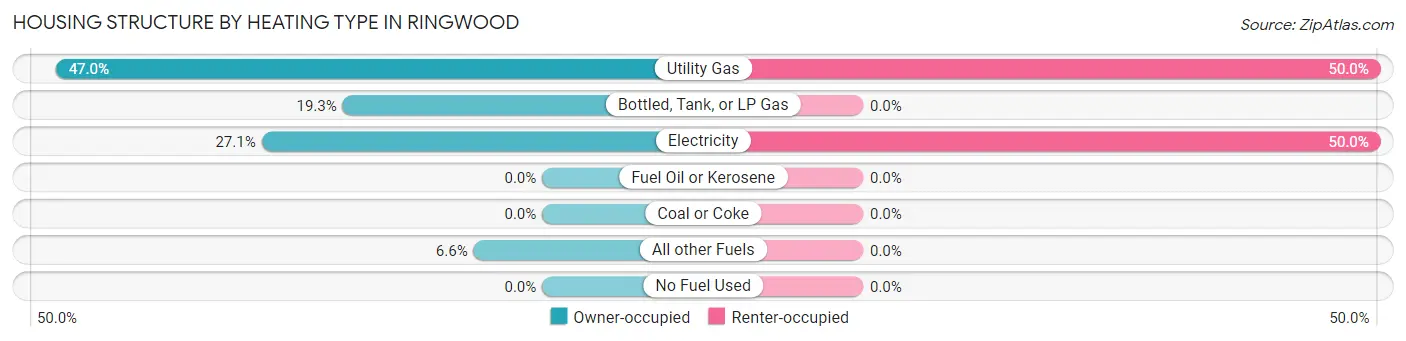
| Heating Type | Owner-occupied | Renter-occupied |
| Utility Gas | 78 (47.0%) | 17 (50.0%) |
| Bottled, Tank, or LP Gas | 32 (19.3%) | 0 (0.0%) |
| Electricity | 45 (27.1%) | 17 (50.0%) |
| Fuel Oil or Kerosene | 0 (0.0%) | 0 (0.0%) |
| Coal or Coke | 0 (0.0%) | 0 (0.0%) |
| All other Fuels | 11 (6.6%) | 0 (0.0%) |
| No Fuel Used | 0 (0.0%) | 0 (0.0%) |
| Total | 166 (100.0%) | 34 (100.0%) |
Household Vehicle Usage in Ringwood
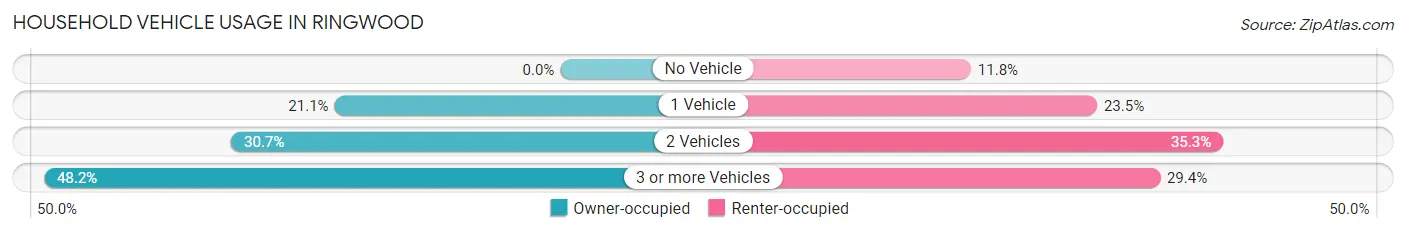
| Vehicles per Household | Owner-occupied | Renter-occupied |
| No Vehicle | 0 (0.0%) | 4 (11.8%) |
| 1 Vehicle | 35 (21.1%) | 8 (23.5%) |
| 2 Vehicles | 51 (30.7%) | 12 (35.3%) |
| 3 or more Vehicles | 80 (48.2%) | 10 (29.4%) |
| Total | 166 (100.0%) | 34 (100.0%) |
Real Estate & Mortgages in Ringwood
Real Estate and Mortgage Overview in Ringwood
| Characteristic | Without Mortgage | With Mortgage |
| Housing Units | 127 | 39 |
| Median Property Value | $90,100 | $136,500 |
| Median Household Income | - | - |
| Monthly Housing Costs | $428 | $0 |
| Real Estate Taxes | $287 | $0 |
Property Value by Mortgage Status in Ringwood
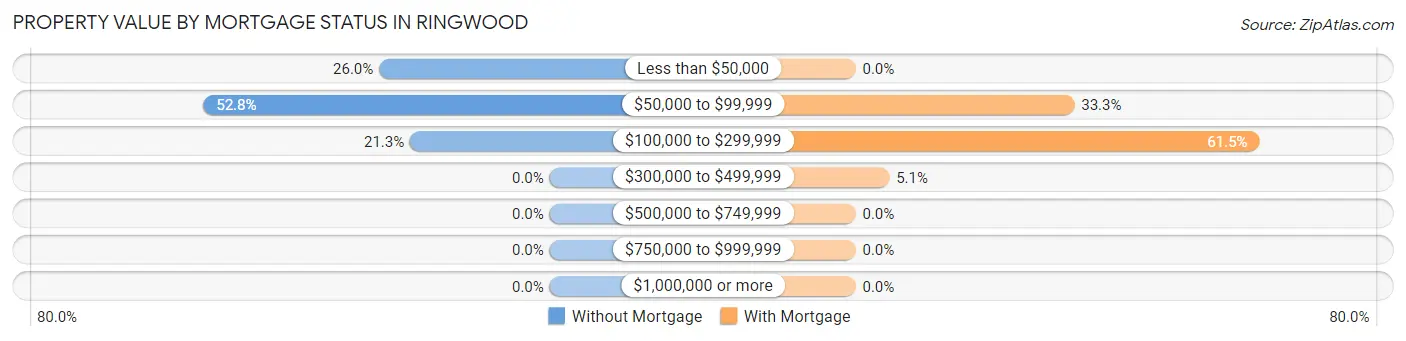
| Property Value | Without Mortgage | With Mortgage |
| Less than $50,000 | 33 (26.0%) | 0 (0.0%) |
| $50,000 to $99,999 | 67 (52.8%) | 13 (33.3%) |
| $100,000 to $299,999 | 27 (21.3%) | 24 (61.5%) |
| $300,000 to $499,999 | 0 (0.0%) | 2 (5.1%) |
| $500,000 to $749,999 | 0 (0.0%) | 0 (0.0%) |
| $750,000 to $999,999 | 0 (0.0%) | 0 (0.0%) |
| $1,000,000 or more | 0 (0.0%) | 0 (0.0%) |
| Total | 127 (100.0%) | 39 (100.0%) |
Household Income by Mortgage Status in Ringwood
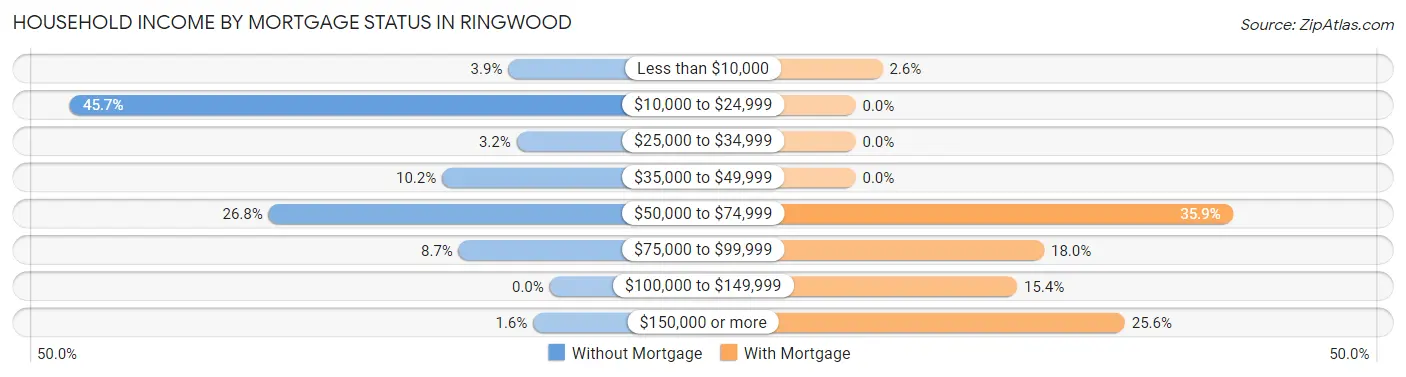
| Household Income | Without Mortgage | With Mortgage |
| Less than $10,000 | 5 (3.9%) | 1 (2.6%) |
| $10,000 to $24,999 | 58 (45.7%) | 0 (0.0%) |
| $25,000 to $34,999 | 4 (3.2%) | 0 (0.0%) |
| $35,000 to $49,999 | 13 (10.2%) | 0 (0.0%) |
| $50,000 to $74,999 | 34 (26.8%) | 14 (35.9%) |
| $75,000 to $99,999 | 11 (8.7%) | 7 (17.9%) |
| $100,000 to $149,999 | 0 (0.0%) | 6 (15.4%) |
| $150,000 or more | 2 (1.6%) | 10 (25.6%) |
| Total | 127 (100.0%) | 39 (100.0%) |
Property Value to Household Income Ratio in Ringwood
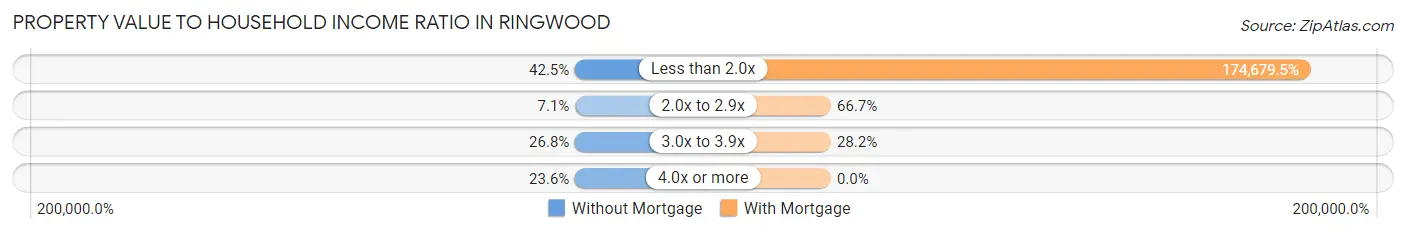
| Value-to-Income Ratio | Without Mortgage | With Mortgage |
| Less than 2.0x | 54 (42.5%) | 68,125 (174,679.5%) |
| 2.0x to 2.9x | 9 (7.1%) | 26 (66.7%) |
| 3.0x to 3.9x | 34 (26.8%) | 11 (28.2%) |
| 4.0x or more | 30 (23.6%) | 0 (0.0%) |
| Total | 127 (100.0%) | 39 (100.0%) |
Real Estate Taxes by Mortgage Status in Ringwood
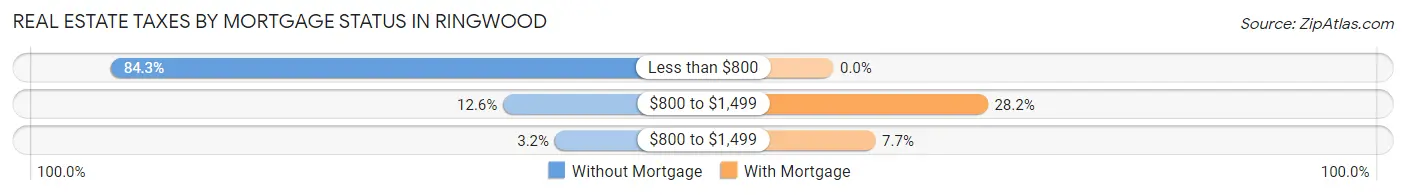
| Property Taxes | Without Mortgage | With Mortgage |
| Less than $800 | 107 (84.3%) | 0 (0.0%) |
| $800 to $1,499 | 16 (12.6%) | 11 (28.2%) |
| $800 to $1,499 | 4 (3.2%) | 3 (7.7%) |
| Total | 127 (100.0%) | 39 (100.0%) |
Health & Disability in Ringwood
Health Insurance Coverage by Age in Ringwood
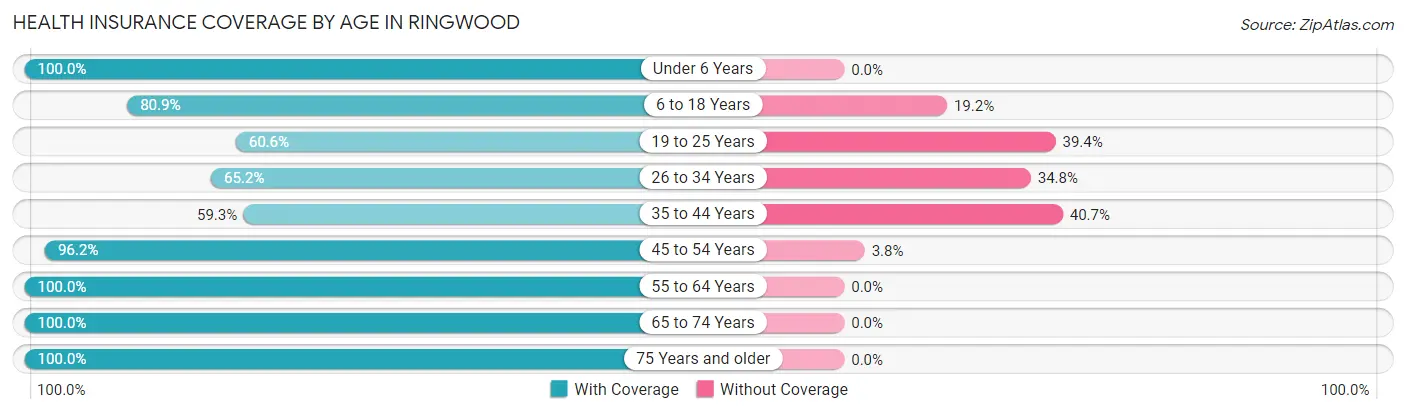
| Age Bracket | With Coverage | Without Coverage |
| Under 6 Years | 36 (100.0%) | 0 (0.0%) |
| 6 to 18 Years | 114 (80.8%) | 27 (19.2%) |
| 19 to 25 Years | 20 (60.6%) | 13 (39.4%) |
| 26 to 34 Years | 45 (65.2%) | 24 (34.8%) |
| 35 to 44 Years | 32 (59.3%) | 22 (40.7%) |
| 45 to 54 Years | 101 (96.2%) | 4 (3.8%) |
| 55 to 64 Years | 31 (100.0%) | 0 (0.0%) |
| 65 to 74 Years | 26 (100.0%) | 0 (0.0%) |
| 75 Years and older | 37 (100.0%) | 0 (0.0%) |
| Total | 442 (83.1%) | 90 (16.9%) |
Health Insurance Coverage by Citizenship Status in Ringwood
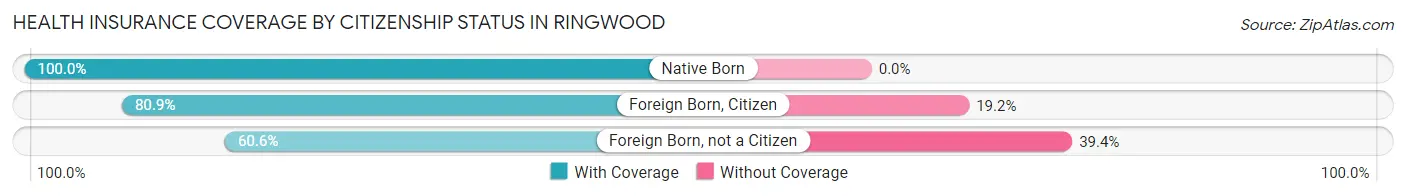
| Citizenship Status | With Coverage | Without Coverage |
| Native Born | 36 (100.0%) | 0 (0.0%) |
| Foreign Born, Citizen | 114 (80.8%) | 27 (19.2%) |
| Foreign Born, not a Citizen | 20 (60.6%) | 13 (39.4%) |
Health Insurance Coverage by Household Income in Ringwood
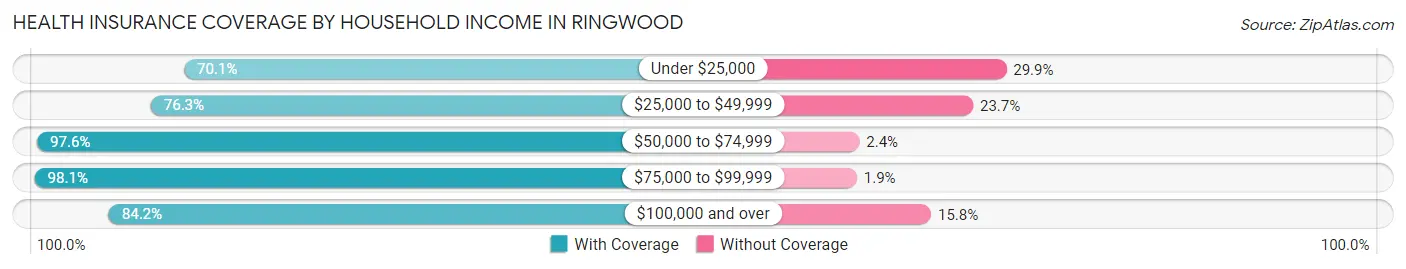
| Household Income | With Coverage | Without Coverage |
| Under $25,000 | 115 (70.1%) | 49 (29.9%) |
| $25,000 to $49,999 | 71 (76.3%) | 22 (23.7%) |
| $50,000 to $74,999 | 124 (97.6%) | 3 (2.4%) |
| $75,000 to $99,999 | 52 (98.1%) | 1 (1.9%) |
| $100,000 and over | 80 (84.2%) | 15 (15.8%) |
Public vs Private Health Insurance Coverage by Age in Ringwood
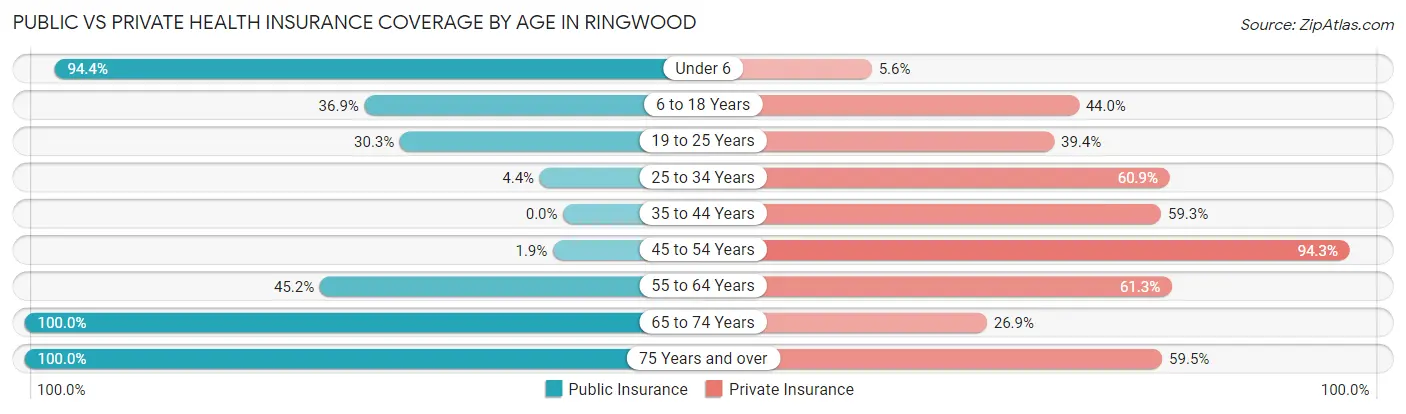
| Age Bracket | Public Insurance | Private Insurance |
| Under 6 | 34 (94.4%) | 2 (5.6%) |
| 6 to 18 Years | 52 (36.9%) | 62 (44.0%) |
| 19 to 25 Years | 10 (30.3%) | 13 (39.4%) |
| 25 to 34 Years | 3 (4.3%) | 42 (60.9%) |
| 35 to 44 Years | 0 (0.0%) | 32 (59.3%) |
| 45 to 54 Years | 2 (1.9%) | 99 (94.3%) |
| 55 to 64 Years | 14 (45.2%) | 19 (61.3%) |
| 65 to 74 Years | 26 (100.0%) | 7 (26.9%) |
| 75 Years and over | 37 (100.0%) | 22 (59.5%) |
| Total | 178 (33.5%) | 298 (56.0%) |
Disability Status by Sex by Age in Ringwood
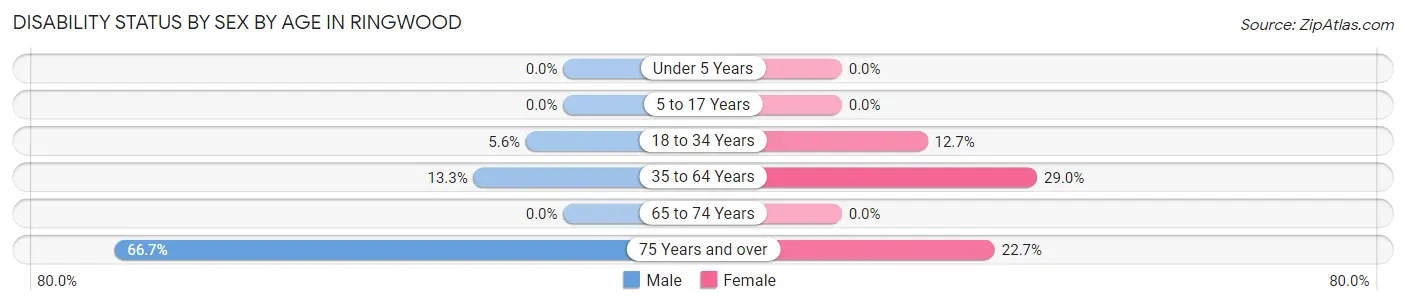
| Age Bracket | Male | Female |
| Under 5 Years | 0 (0.0%) | 0 (0.0%) |
| 5 to 17 Years | 0 (0.0%) | 0 (0.0%) |
| 18 to 34 Years | 3 (5.6%) | 7 (12.7%) |
| 35 to 64 Years | 12 (13.3%) | 29 (29.0%) |
| 65 to 74 Years | 0 (0.0%) | 0 (0.0%) |
| 75 Years and over | 10 (66.7%) | 5 (22.7%) |
Disability Class by Sex by Age in Ringwood
Disability Class: Hearing Difficulty
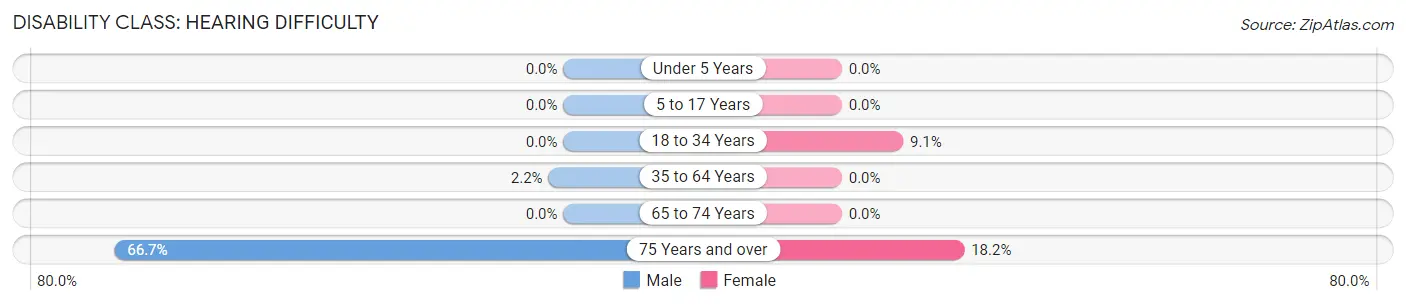
| Age Bracket | Male | Female |
| Under 5 Years | 0 (0.0%) | 0 (0.0%) |
| 5 to 17 Years | 0 (0.0%) | 0 (0.0%) |
| 18 to 34 Years | 0 (0.0%) | 5 (9.1%) |
| 35 to 64 Years | 2 (2.2%) | 0 (0.0%) |
| 65 to 74 Years | 0 (0.0%) | 0 (0.0%) |
| 75 Years and over | 10 (66.7%) | 4 (18.2%) |
Disability Class: Vision Difficulty
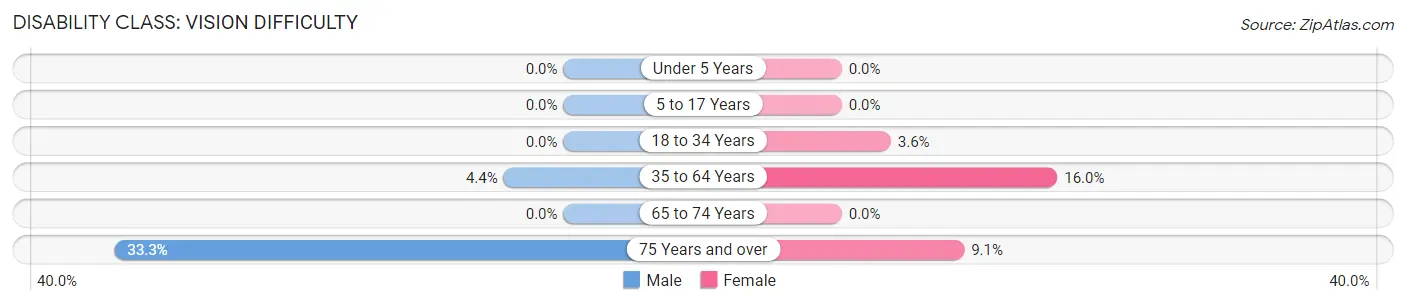
| Age Bracket | Male | Female |
| Under 5 Years | 0 (0.0%) | 0 (0.0%) |
| 5 to 17 Years | 0 (0.0%) | 0 (0.0%) |
| 18 to 34 Years | 0 (0.0%) | 2 (3.6%) |
| 35 to 64 Years | 4 (4.4%) | 16 (16.0%) |
| 65 to 74 Years | 0 (0.0%) | 0 (0.0%) |
| 75 Years and over | 5 (33.3%) | 2 (9.1%) |
Disability Class: Cognitive Difficulty
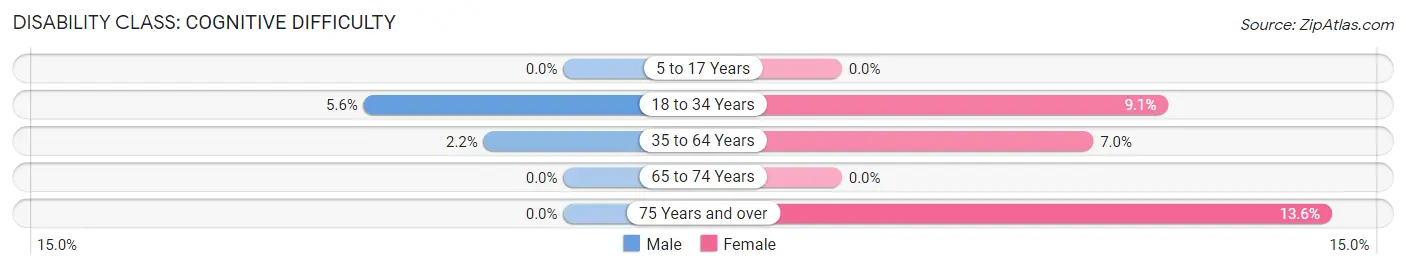
| Age Bracket | Male | Female |
| 5 to 17 Years | 0 (0.0%) | 0 (0.0%) |
| 18 to 34 Years | 3 (5.6%) | 5 (9.1%) |
| 35 to 64 Years | 2 (2.2%) | 7 (7.0%) |
| 65 to 74 Years | 0 (0.0%) | 0 (0.0%) |
| 75 Years and over | 0 (0.0%) | 3 (13.6%) |
Disability Class: Ambulatory Difficulty
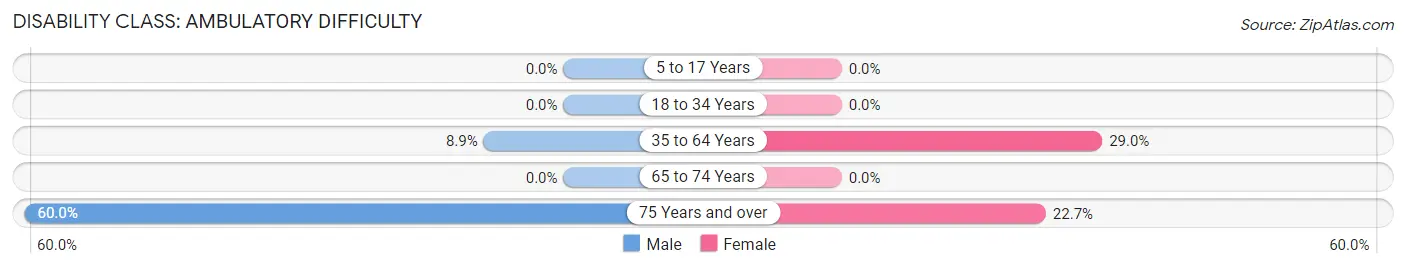
| Age Bracket | Male | Female |
| 5 to 17 Years | 0 (0.0%) | 0 (0.0%) |
| 18 to 34 Years | 0 (0.0%) | 0 (0.0%) |
| 35 to 64 Years | 8 (8.9%) | 29 (29.0%) |
| 65 to 74 Years | 0 (0.0%) | 0 (0.0%) |
| 75 Years and over | 9 (60.0%) | 5 (22.7%) |
Disability Class: Self-Care Difficulty
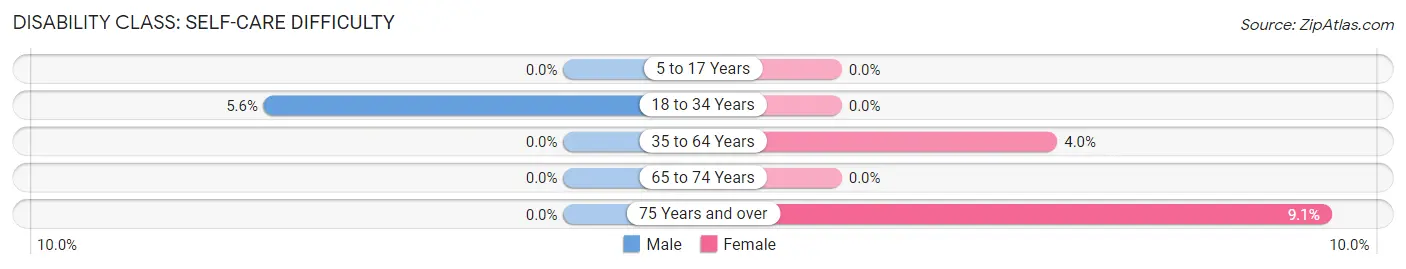
| Age Bracket | Male | Female |
| 5 to 17 Years | 0 (0.0%) | 0 (0.0%) |
| 18 to 34 Years | 3 (5.6%) | 0 (0.0%) |
| 35 to 64 Years | 0 (0.0%) | 4 (4.0%) |
| 65 to 74 Years | 0 (0.0%) | 0 (0.0%) |
| 75 Years and over | 0 (0.0%) | 2 (9.1%) |
Technology Access in Ringwood
Computing Device Access in Ringwood
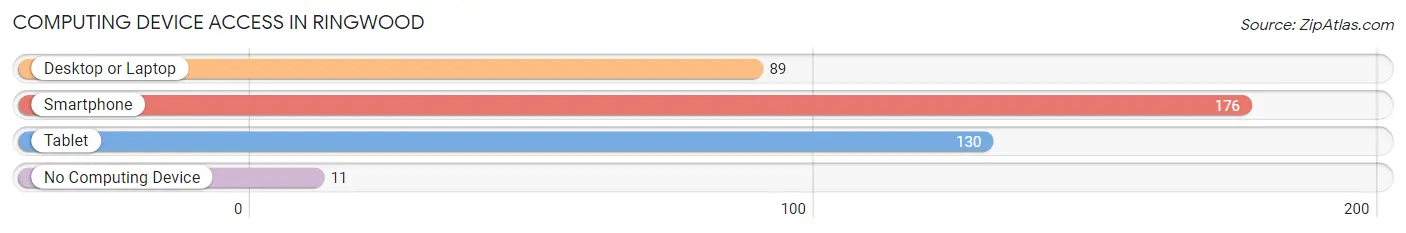
| Device Type | # Households | % Households |
| Desktop or Laptop | 89 | 44.5% |
| Smartphone | 176 | 88.0% |
| Tablet | 130 | 65.0% |
| No Computing Device | 11 | 5.5% |
| Total | 200 | 100.0% |
Internet Access in Ringwood
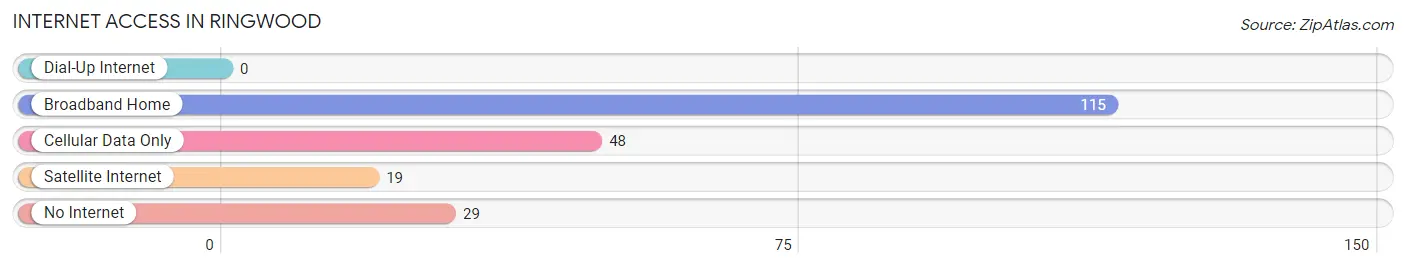
| Internet Type | # Households | % Households |
| Dial-Up Internet | 0 | 0.0% |
| Broadband Home | 115 | 57.5% |
| Cellular Data Only | 48 | 24.0% |
| Satellite Internet | 19 | 9.5% |
| No Internet | 29 | 14.5% |
| Total | 200 | 100.0% |
Ringwood Summary
Introduction
Ringwood, Oklahoma is a small town located in Major County, Oklahoma. It is situated in the southwestern part of the state, approximately 20 miles east of the Oklahoma-Kansas border. The town was founded in 1891 and has a population of approximately 500 people. The town is known for its rich history, diverse geography, and vibrant economy. This paper will explore the history, geography, economy, and demographics of Ringwood, Oklahoma in 2000 words.
History
Ringwood, Oklahoma was founded in 1891 by a group of settlers from Kansas. The town was named after Ringwood, England, which was the hometown of one of the settlers. The town was originally a farming community, and the settlers grew wheat, corn, and other crops. As the town grew, it became a center for trade and commerce. The town was also home to a number of businesses, including a general store, a blacksmith shop, and a hotel.
In the early 1900s, Ringwood experienced a period of growth and prosperity. The town was home to a number of businesses, including a bank, a newspaper, and a movie theater. The town also had a school, a library, and a post office.
In the mid-1900s, Ringwood experienced a period of decline. The town’s population decreased, and many of the businesses closed. In the late 1900s, the town experienced a period of revitalization. The town was home to a number of new businesses, including a grocery store, a hardware store, and a restaurant.
Geography
Ringwood, Oklahoma is located in Major County, Oklahoma. The town is situated in the southwestern part of the state, approximately 20 miles east of the Oklahoma-Kansas border. The town is located in the Great Plains region of the United States. The town is surrounded by rolling hills and prairies. The town is also located near the Salt Fork of the Arkansas River.
The climate in Ringwood is generally mild. The average temperature in the summer is around 80 degrees Fahrenheit, and the average temperature in the winter is around 40 degrees Fahrenheit. The town receives an average of 30 inches of precipitation per year.
Economy
The economy of Ringwood, Oklahoma is largely based on agriculture. The town is home to a number of farms, which produce wheat, corn, and other crops. The town is also home to a number of businesses, including a grocery store, a hardware store, and a restaurant.
The town is also home to a number of manufacturing businesses. The town is home to a number of factories, which produce a variety of products, including furniture, clothing, and electronics.
Demographics
As of the 2010 census, the population of Ringwood, Oklahoma was 498 people. The town is predominantly white, with approximately 95% of the population being white. The town is also home to a small Hispanic population, with approximately 4% of the population being Hispanic. The town is also home to a small African American population, with approximately 1% of the population being African American.
Conclusion
Ringwood, Oklahoma is a small town located in Major County, Oklahoma. The town was founded in 1891 and has a population of approximately 500 people. The town is known for its rich history, diverse geography, and vibrant economy. This paper has explored the history, geography, economy, and demographics of Ringwood, Oklahoma in 2000 words.
Common Questions
What is Per Capita Income in Ringwood?
Per Capita income in Ringwood is $19,648.
What is the Median Family Income in Ringwood?
Median Family Income in Ringwood is $42,708.
What is the Median Household income in Ringwood?
Median Household Income in Ringwood is $40,000.
What is Income or Wage Gap in Ringwood?
Income or Wage Gap in Ringwood is 73.9%.
Women in Ringwood earn 26.1 cents for every dollar earned by a man.
What is Inequality or Gini Index in Ringwood?
Inequality or Gini Index in Ringwood is 0.43.
What is the Total Population of Ringwood?
Total Population of Ringwood is 532.
What is the Total Male Population of Ringwood?
Total Male Population of Ringwood is 253.
What is the Total Female Population of Ringwood?
Total Female Population of Ringwood is 279.
What is the Ratio of Males per 100 Females in Ringwood?
There are 90.68 Males per 100 Females in Ringwood.
What is the Ratio of Females per 100 Males in Ringwood?
There are 110.28 Females per 100 Males in Ringwood.
What is the Median Population Age in Ringwood?
Median Population Age in Ringwood is 32.6 Years.
What is the Average Family Size in Ringwood
Average Family Size in Ringwood is 3.1 People.
What is the Average Household Size in Ringwood
Average Household Size in Ringwood is 2.7 People.
How Large is the Labor Force in Ringwood?
There are 197 People in the Labor Forcein in Ringwood.
What is the Percentage of People in the Labor Force in Ringwood?
51.4% of People are in the Labor Force in Ringwood.