Wilburton, OK Map & Demographics
Wilburton Map
Wilburton Overview
$20,123
PER CAPITA INCOME
$54,052
AVG FAMILY INCOME
$39,263
AVG HOUSEHOLD INCOME
27.5%
WAGE / INCOME GAP [ % ]
72.5¢/ $1
WAGE / INCOME GAP [ $ ]
$10,811
FAMILY INCOME DEFICIT
0.43
INEQUALITY / GINI INDEX
2,828
TOTAL POPULATION
1,412
MALE POPULATION
1,416
FEMALE POPULATION
99.72
MALES / 100 FEMALES
100.28
FEMALES / 100 MALES
30.9
MEDIAN AGE
3.1
AVG FAMILY SIZE
2.5
AVG HOUSEHOLD SIZE
1,205
LABOR FORCE [ PEOPLE ]
55.6%
PERCENT IN LABOR FORCE
9.9%
UNEMPLOYMENT RATE
Wilburton Zip Codes
Wilburton Area Codes
Income in Wilburton
Income Overview in Wilburton
Per Capita Income in Wilburton is $20,123, while median incomes of families and households are $54,052 and $39,263 respectively.
| Characteristic | Number | Measure |
| Per Capita Income | 2,828 | $20,123 |
| Median Family Income | 690 | $54,052 |
| Mean Family Income | 690 | $58,460 |
| Median Household Income | 1,041 | $39,263 |
| Mean Household Income | 1,041 | $53,444 |
| Income Deficit | 690 | $10,811 |
| Wage / Income Gap (%) | 2,828 | 27.48% |
| Wage / Income Gap ($) | 2,828 | 72.52¢ per $1 |
| Gini / Inequality Index | 2,828 | 0.43 |
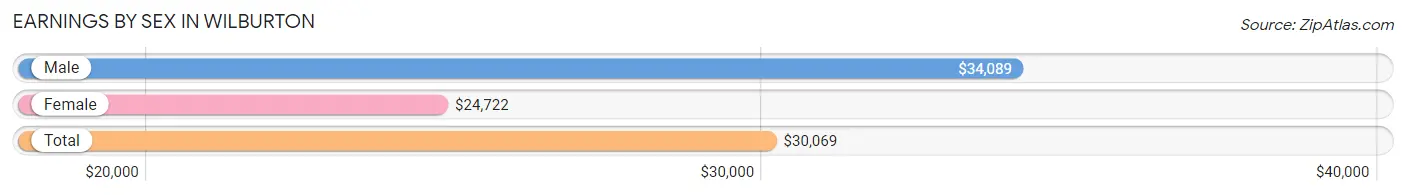
Earnings by Sex in Wilburton
Average Earnings in Wilburton are $30,069, $34,089 for men and $24,722 for women, a difference of 27.5%.
| Sex | Number | Average Earnings |
| Male | 691 (55.8%) | $34,089 |
| Female | 548 (44.2%) | $24,722 |
| Total | 1,239 (100.0%) | $30,069 |
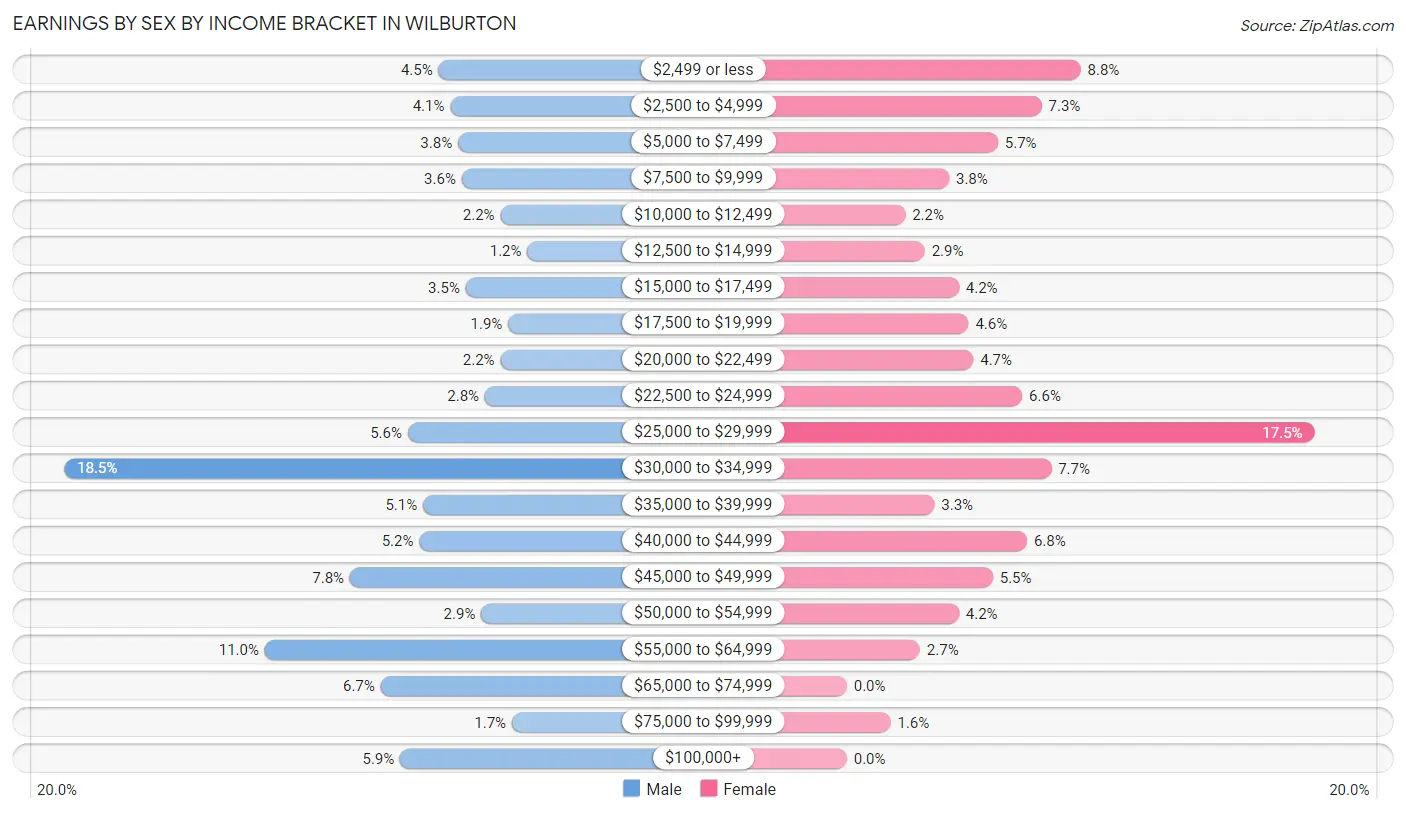
Earnings by Sex by Income Bracket in Wilburton
The most common earnings brackets in Wilburton are $30,000 to $34,999 for men (128 | 18.5%) and $25,000 to $29,999 for women (96 | 17.5%).
| Income | Male | Female |
| $2,499 or less | 31 (4.5%) | 48 (8.8%) |
| $2,500 to $4,999 | 28 (4.1%) | 40 (7.3%) |
| $5,000 to $7,499 | 26 (3.8%) | 31 (5.7%) |
| $7,500 to $9,999 | 25 (3.6%) | 21 (3.8%) |
| $10,000 to $12,499 | 15 (2.2%) | 12 (2.2%) |
| $12,500 to $14,999 | 8 (1.2%) | 16 (2.9%) |
| $15,000 to $17,499 | 24 (3.5%) | 23 (4.2%) |
| $17,500 to $19,999 | 13 (1.9%) | 25 (4.6%) |
| $20,000 to $22,499 | 15 (2.2%) | 26 (4.7%) |
| $22,500 to $24,999 | 19 (2.8%) | 36 (6.6%) |
| $25,000 to $29,999 | 39 (5.6%) | 96 (17.5%) |
| $30,000 to $34,999 | 128 (18.5%) | 42 (7.7%) |
| $35,000 to $39,999 | 35 (5.1%) | 18 (3.3%) |
| $40,000 to $44,999 | 36 (5.2%) | 37 (6.8%) |
| $45,000 to $49,999 | 54 (7.8%) | 30 (5.5%) |
| $50,000 to $54,999 | 20 (2.9%) | 23 (4.2%) |
| $55,000 to $64,999 | 76 (11.0%) | 15 (2.7%) |
| $65,000 to $74,999 | 46 (6.7%) | 0 (0.0%) |
| $75,000 to $99,999 | 12 (1.7%) | 9 (1.6%) |
| $100,000+ | 41 (5.9%) | 0 (0.0%) |
| Total | 691 (100.0%) | 548 (100.0%) |
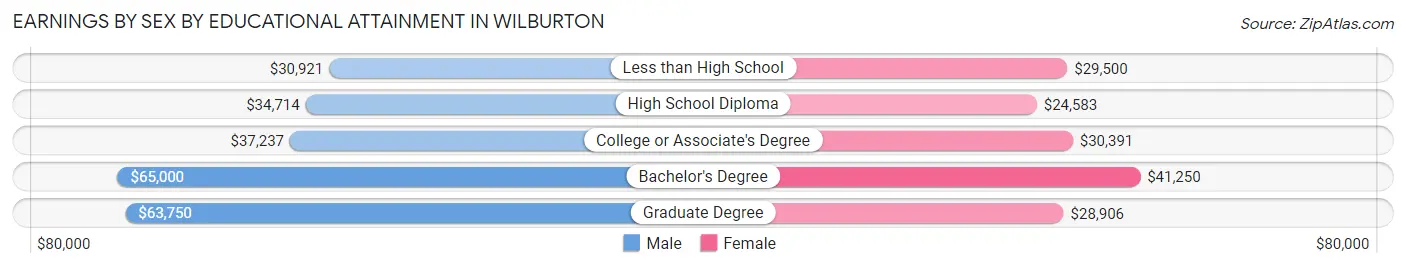
Earnings by Sex by Educational Attainment in Wilburton
Average earnings in Wilburton are $37,500 for men and $28,322 for women, a difference of 24.5%. Men with an educational attainment of bachelor's degree enjoy the highest average annual earnings of $65,000, while those with less than high school education earn the least with $30,921. Women with an educational attainment of bachelor's degree earn the most with the average annual earnings of $41,250, while those with high school diploma education have the smallest earnings of $24,583.
| Educational Attainment | Male Income | Female Income |
| Less than High School | $30,921 | $29,500 |
| High School Diploma | $34,714 | $24,583 |
| College or Associate's Degree | $37,237 | $30,391 |
| Bachelor's Degree | $65,000 | $41,250 |
| Graduate Degree | $63,750 | $28,906 |
| Total | $37,500 | $28,322 |
Family Income in Wilburton
Family Income Brackets in Wilburton
According to the Wilburton family income data, there are 201 families falling into the $50,000 to $74,999 income range, which is the most common income bracket and makes up 29.1% of all families. Conversely, the $200,000+ income bracket is the least frequent group with only 4 families (0.6%) belonging to this category.
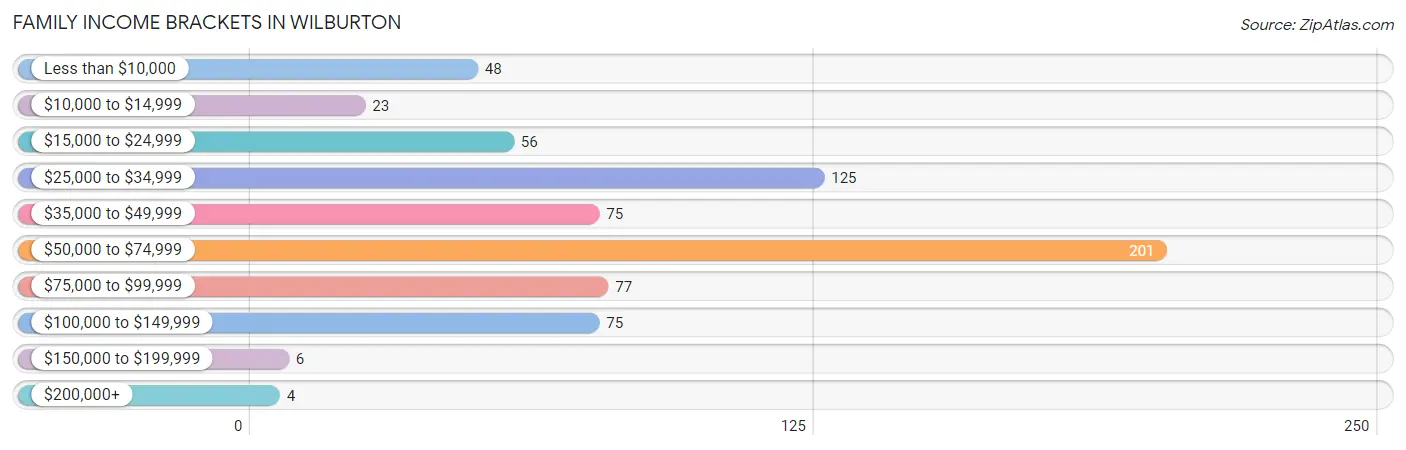
| Income Bracket | # Families | % Families |
| Less than $10,000 | 48 | 7.0% |
| $10,000 to $14,999 | 23 | 3.3% |
| $15,000 to $24,999 | 56 | 8.1% |
| $25,000 to $34,999 | 125 | 18.1% |
| $35,000 to $49,999 | 75 | 10.9% |
| $50,000 to $74,999 | 201 | 29.1% |
| $75,000 to $99,999 | 77 | 11.2% |
| $100,000 to $149,999 | 75 | 10.9% |
| $150,000 to $199,999 | 6 | 0.9% |
| $200,000+ | 4 | 0.6% |
Family Income by Famaliy Size in Wilburton
2-person families (304 | 44.1%) account for the highest median family income in Wilburton with $55,833 per family, while 2-person families (304 | 44.1%) have the highest median income of $27,916 per family member.
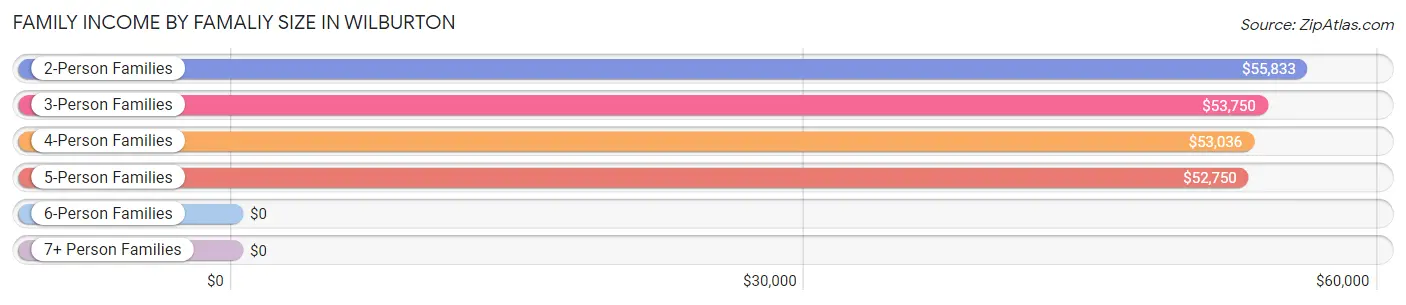
| Income Bracket | # Families | Median Income |
| 2-Person Families | 304 (44.1%) | $55,833 |
| 3-Person Families | 109 (15.8%) | $53,750 |
| 4-Person Families | 169 (24.5%) | $53,036 |
| 5-Person Families | 93 (13.5%) | $52,750 |
| 6-Person Families | 15 (2.2%) | $0 |
| 7+ Person Families | 0 (0.0%) | $0 |
| Total | 690 (100.0%) | $54,052 |
Family Income by Number of Earners in Wilburton
The median family income in Wilburton is $54,052, with families comprising 3+ earners (34) having the highest median family income of $120,833, while families with no earners (110) have the lowest median family income of $25,962, accounting for 4.9% and 15.9% of families, respectively.
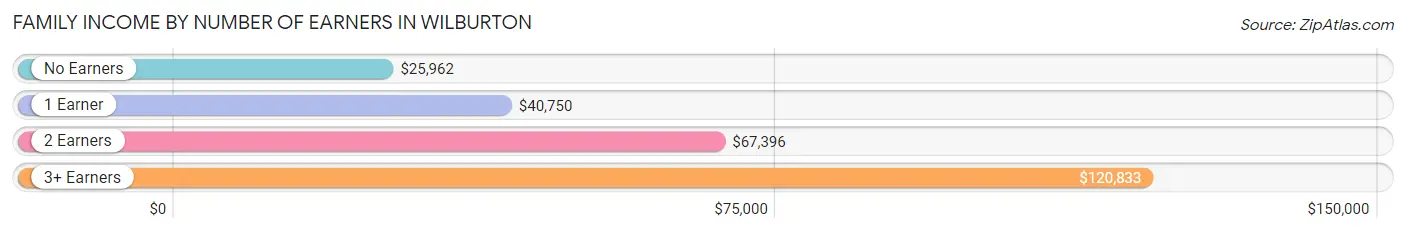
| Number of Earners | # Families | Median Income |
| No Earners | 110 (15.9%) | $25,962 |
| 1 Earner | 299 (43.3%) | $40,750 |
| 2 Earners | 247 (35.8%) | $67,396 |
| 3+ Earners | 34 (4.9%) | $120,833 |
| Total | 690 (100.0%) | $54,052 |
Household Income in Wilburton
Household Income Brackets in Wilburton
With 215 households falling in the category, the $50,000 to $74,999 income range is the most frequent in Wilburton, accounting for 20.6% of all households. In contrast, only 9 households (0.9%) fall into the $200,000+ income bracket, making it the least populous group.
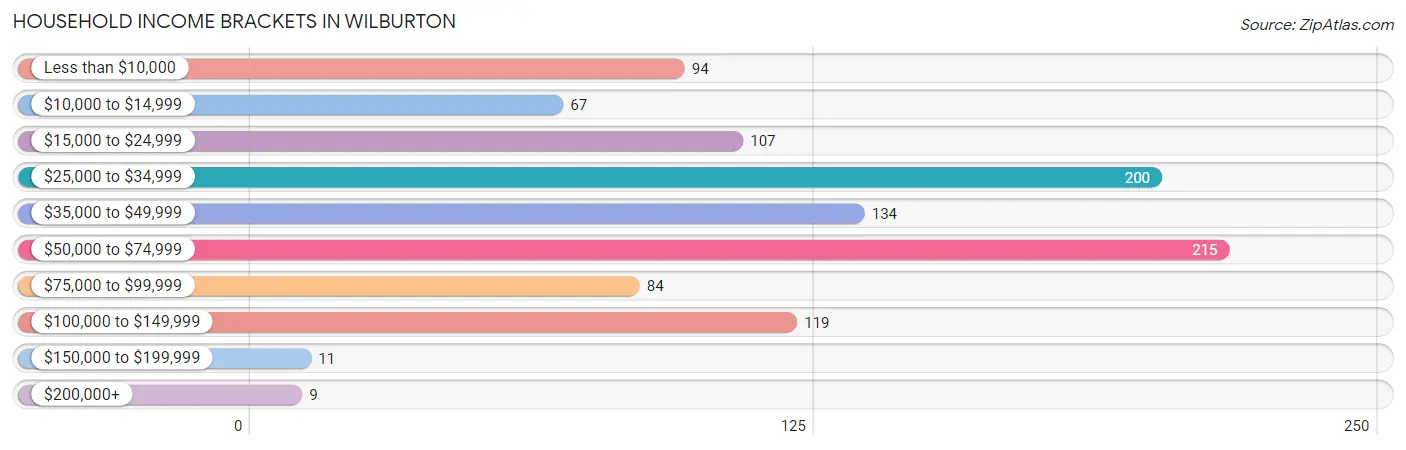
| Income Bracket | # Households | % Households |
| Less than $10,000 | 94 | 9.0% |
| $10,000 to $14,999 | 67 | 6.4% |
| $15,000 to $24,999 | 107 | 10.3% |
| $25,000 to $34,999 | 200 | 19.2% |
| $35,000 to $49,999 | 134 | 12.9% |
| $50,000 to $74,999 | 215 | 20.7% |
| $75,000 to $99,999 | 84 | 8.1% |
| $100,000 to $149,999 | 119 | 11.4% |
| $150,000 to $199,999 | 11 | 1.1% |
| $200,000+ | 9 | 0.9% |
Household Income by Householder Age in Wilburton
The median household income in Wilburton is $39,263, with the highest median household income of $55,469 found in the 45 to 64 years age bracket for the primary householder. A total of 367 households (35.2%) fall into this category. Meanwhile, the 65+ years age bracket for the primary householder has the lowest median household income of $22,371, with 223 households (21.4%) in this group.
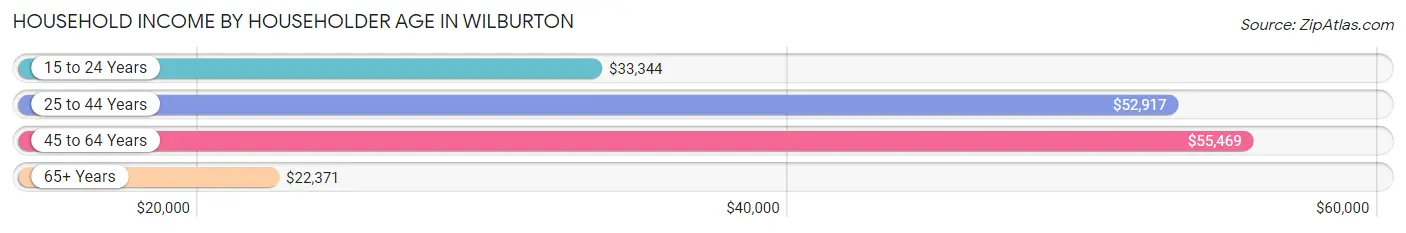
| Income Bracket | # Households | Median Income |
| 15 to 24 Years | 121 (11.6%) | $33,344 |
| 25 to 44 Years | 330 (31.7%) | $52,917 |
| 45 to 64 Years | 367 (35.2%) | $55,469 |
| 65+ Years | 223 (21.4%) | $22,371 |
| Total | 1,041 (100.0%) | $39,263 |
Poverty in Wilburton
Income Below Poverty by Sex and Age in Wilburton
With 19.4% poverty level for males and 25.3% for females among the residents of Wilburton, 16 and 17 year old males and under 5 year old females are the most vulnerable to poverty, with 24 males (88.9%) and 40 females (51.9%) in their respective age groups living below the poverty level.
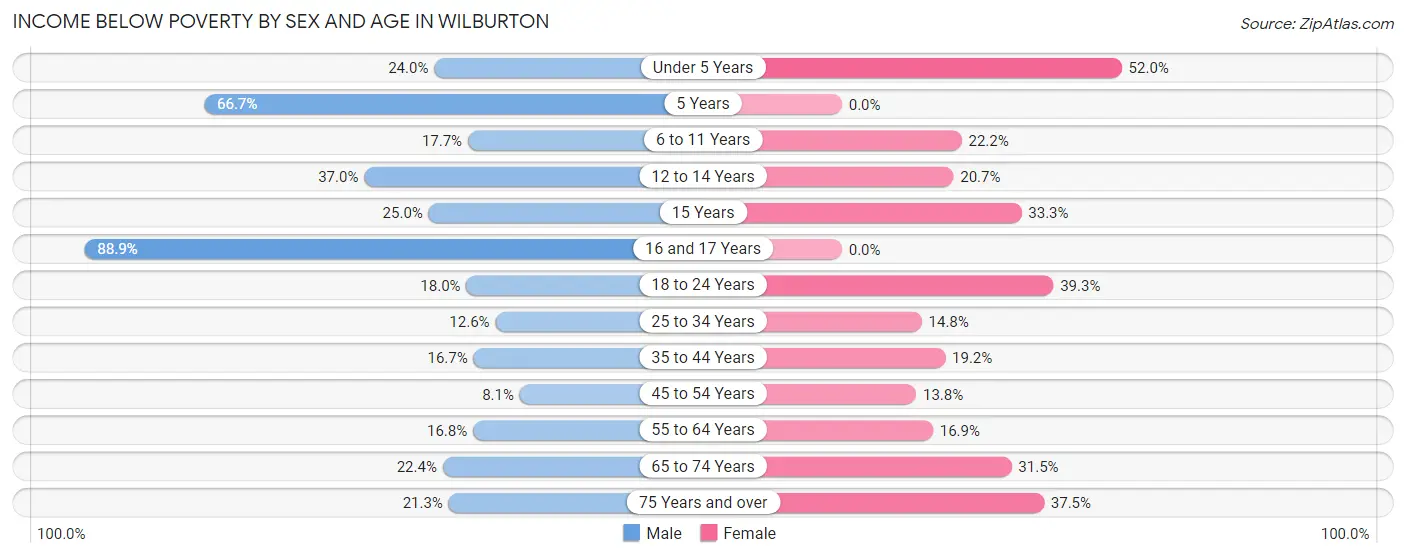
| Age Bracket | Male | Female |
| Under 5 Years | 29 (24.0%) | 40 (51.9%) |
| 5 Years | 6 (66.7%) | 0 (0.0%) |
| 6 to 11 Years | 31 (17.7%) | 30 (22.2%) |
| 12 to 14 Years | 17 (37.0%) | 6 (20.7%) |
| 15 Years | 6 (25.0%) | 3 (33.3%) |
| 16 and 17 Years | 24 (88.9%) | 0 (0.0%) |
| 18 to 24 Years | 34 (18.0%) | 73 (39.3%) |
| 25 to 34 Years | 28 (12.6%) | 20 (14.8%) |
| 35 to 44 Years | 26 (16.7%) | 28 (19.2%) |
| 45 to 54 Years | 8 (8.1%) | 20 (13.8%) |
| 55 to 64 Years | 29 (16.8%) | 25 (16.9%) |
| 65 to 74 Years | 15 (22.4%) | 34 (31.5%) |
| 75 Years and over | 10 (21.3%) | 30 (37.5%) |
| Total | 263 (19.4%) | 309 (25.3%) |
Income Above Poverty by Sex and Age in Wilburton
According to the poverty statistics in Wilburton, males aged 45 to 54 years and females aged 5 years are the age groups that are most secure financially, with 91.9% of males and 100.0% of females in these age groups living above the poverty line.
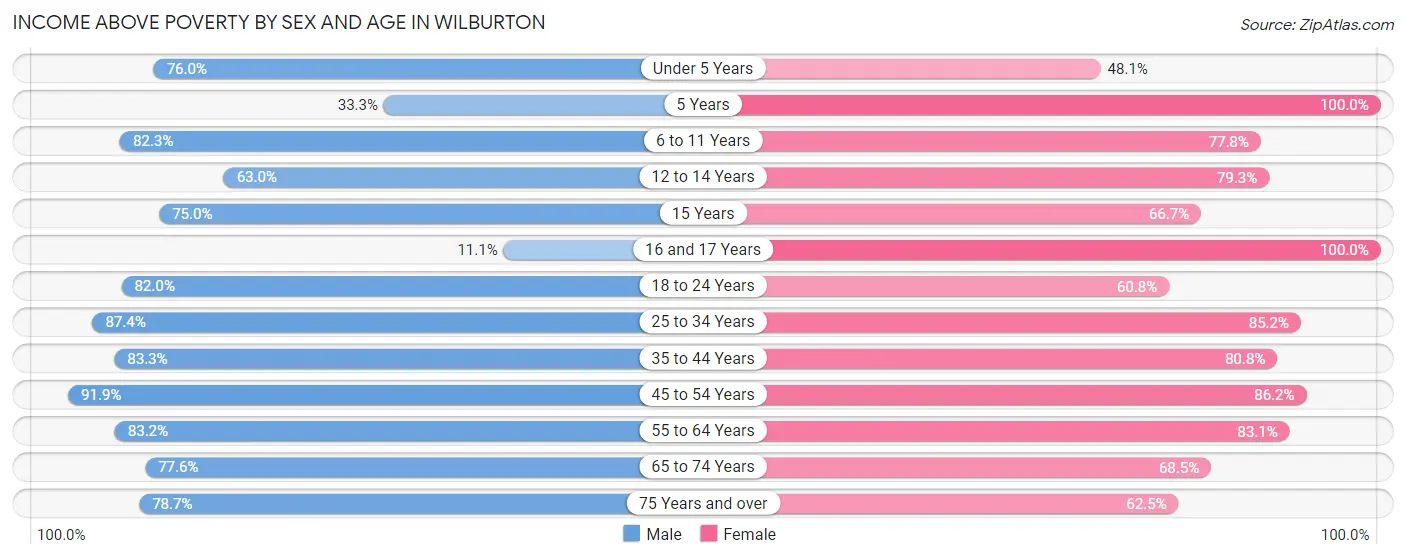
| Age Bracket | Male | Female |
| Under 5 Years | 92 (76.0%) | 37 (48.0%) |
| 5 Years | 3 (33.3%) | 4 (100.0%) |
| 6 to 11 Years | 144 (82.3%) | 105 (77.8%) |
| 12 to 14 Years | 29 (63.0%) | 23 (79.3%) |
| 15 Years | 18 (75.0%) | 6 (66.7%) |
| 16 and 17 Years | 3 (11.1%) | 22 (100.0%) |
| 18 to 24 Years | 155 (82.0%) | 113 (60.8%) |
| 25 to 34 Years | 194 (87.4%) | 115 (85.2%) |
| 35 to 44 Years | 130 (83.3%) | 118 (80.8%) |
| 45 to 54 Years | 91 (91.9%) | 125 (86.2%) |
| 55 to 64 Years | 144 (83.2%) | 123 (83.1%) |
| 65 to 74 Years | 52 (77.6%) | 74 (68.5%) |
| 75 Years and over | 37 (78.7%) | 50 (62.5%) |
| Total | 1,092 (80.6%) | 915 (74.8%) |
Income Below Poverty Among Married-Couple Families in Wilburton
The poverty statistics for married-couple families in Wilburton show that 6.1% or 26 of the total 428 families live below the poverty line. Families with 1 or 2 children have the highest poverty rate of 8.4%, comprising of 14 families. On the other hand, families with 3 or 4 children have the lowest poverty rate of 0.0%, which includes 0 families.
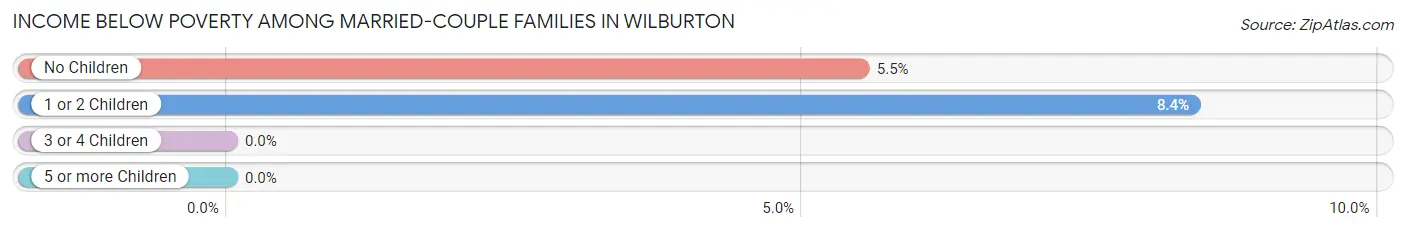
| Children | Above Poverty | Below Poverty |
| No Children | 206 (94.5%) | 12 (5.5%) |
| 1 or 2 Children | 153 (91.6%) | 14 (8.4%) |
| 3 or 4 Children | 43 (100.0%) | 0 (0.0%) |
| 5 or more Children | 0 (0.0%) | 0 (0.0%) |
| Total | 402 (93.9%) | 26 (6.1%) |
Income Below Poverty Among Single-Parent Households in Wilburton
According to the poverty data in Wilburton, 33.9% or 41 single-father households and 53.2% or 75 single-mother households are living below the poverty line. Among single-father households, those with 3 or 4 children have the highest poverty rate, with 6 households (100.0%) experiencing poverty. Likewise, among single-mother households, those with 3 or 4 children have the highest poverty rate, with 24 households (82.8%) falling below the poverty line.
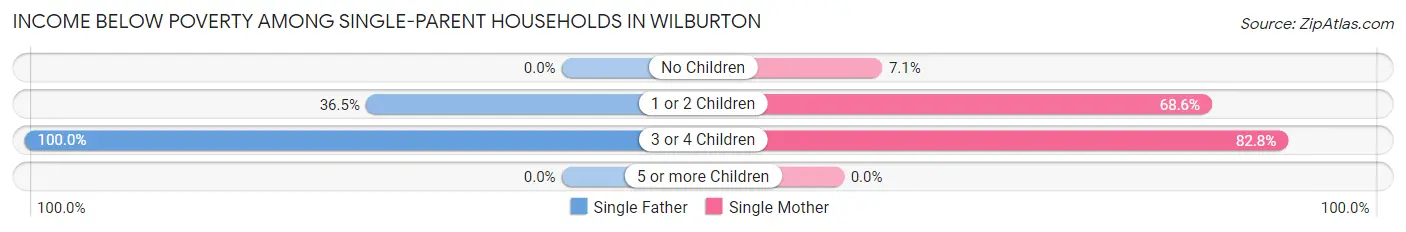
| Children | Single Father | Single Mother |
| No Children | 0 (0.0%) | 3 (7.1%) |
| 1 or 2 Children | 35 (36.5%) | 48 (68.6%) |
| 3 or 4 Children | 6 (100.0%) | 24 (82.8%) |
| 5 or more Children | 0 (0.0%) | 0 (0.0%) |
| Total | 41 (33.9%) | 75 (53.2%) |
Income Below Poverty Among Married-Couple vs Single-Parent Households in Wilburton
The poverty data for Wilburton shows that 26 of the married-couple family households (6.1%) and 116 of the single-parent households (44.3%) are living below the poverty level. Within the married-couple family households, those with 1 or 2 children have the highest poverty rate, with 14 households (8.4%) falling below the poverty line. Among the single-parent households, those with 3 or 4 children have the highest poverty rate, with 30 household (85.7%) living below poverty.
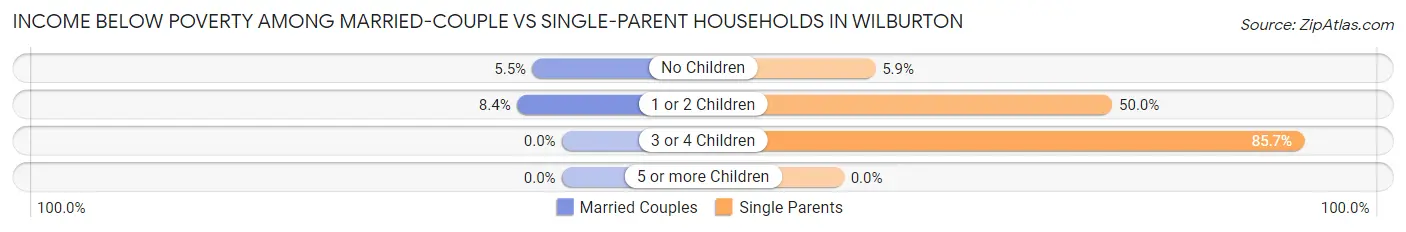
| Children | Married-Couple Families | Single-Parent Households |
| No Children | 12 (5.5%) | 3 (5.9%) |
| 1 or 2 Children | 14 (8.4%) | 83 (50.0%) |
| 3 or 4 Children | 0 (0.0%) | 30 (85.7%) |
| 5 or more Children | 0 (0.0%) | 0 (0.0%) |
| Total | 26 (6.1%) | 116 (44.3%) |
Race in Wilburton
The most populous races in Wilburton are White / Caucasian (1,854 | 65.6%), Native / Alaskan (666 | 23.5%), and Two or more Races (272 | 9.6%).
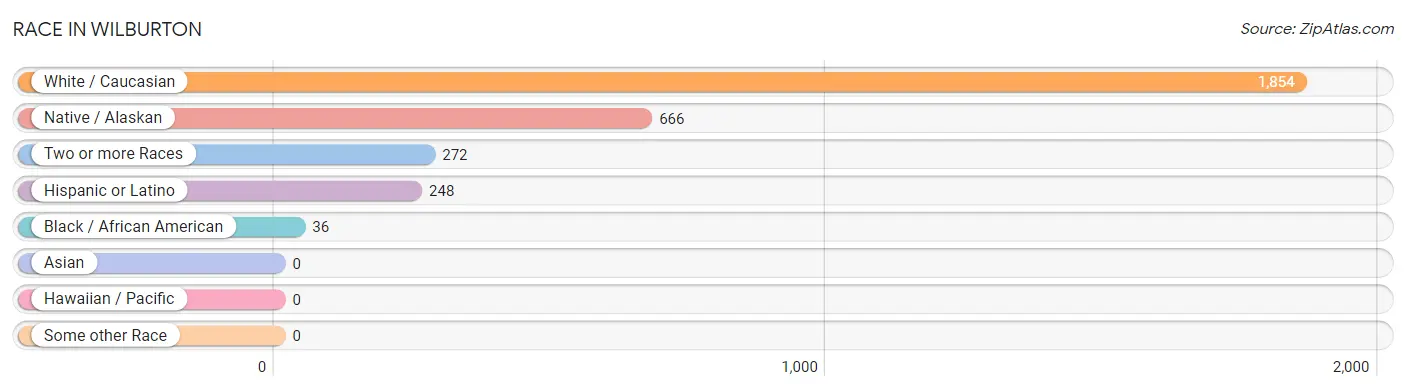
| Race | # Population | % Population |
| Asian | 0 | 0.0% |
| Black / African American | 36 | 1.3% |
| Hawaiian / Pacific | 0 | 0.0% |
| Hispanic or Latino | 248 | 8.8% |
| Native / Alaskan | 666 | 23.5% |
| White / Caucasian | 1,854 | 65.6% |
| Two or more Races | 272 | 9.6% |
| Some other Race | 0 | 0.0% |
| Total | 2,828 | 100.0% |
Ancestry in Wilburton
The most populous ancestries reported in Wilburton are Choctaw (651 | 23.0%), Irish (431 | 15.2%), English (203 | 7.2%), Mexican (193 | 6.8%), and German (177 | 6.3%), together accounting for 58.5% of all Wilburton residents.
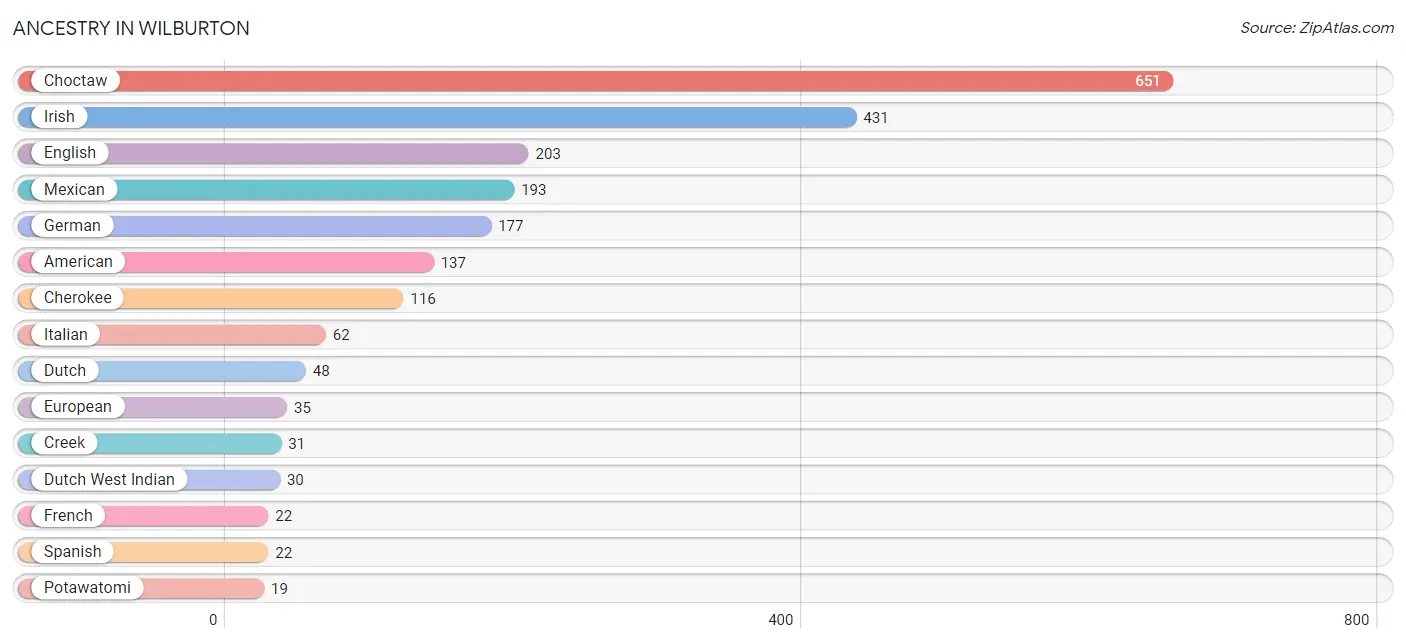
| Ancestry | # Population | % Population |
| American | 137 | 4.8% |
| Apache | 2 | 0.1% |
| Blackfeet | 9 | 0.3% |
| British | 7 | 0.3% |
| Cherokee | 116 | 4.1% |
| Choctaw | 651 | 23.0% |
| Creek | 31 | 1.1% |
| Dutch | 48 | 1.7% |
| Dutch West Indian | 30 | 1.1% |
| English | 203 | 7.2% |
| European | 35 | 1.2% |
| French | 22 | 0.8% |
| German | 177 | 6.3% |
| Irish | 431 | 15.2% |
| Italian | 62 | 2.2% |
| Mexican | 193 | 6.8% |
| Norwegian | 9 | 0.3% |
| Pakistani | 16 | 0.6% |
| Potawatomi | 19 | 0.7% |
| Russian | 2 | 0.1% |
| Scandinavian | 7 | 0.3% |
| Scotch-Irish | 19 | 0.7% |
| Scottish | 9 | 0.3% |
| Sioux | 15 | 0.5% |
| Slovene | 10 | 0.4% |
| Spanish | 22 | 0.8% |
| Swedish | 6 | 0.2% |
| Welsh | 15 | 0.5% | View All 28 Rows |
Immigrants in Wilburton
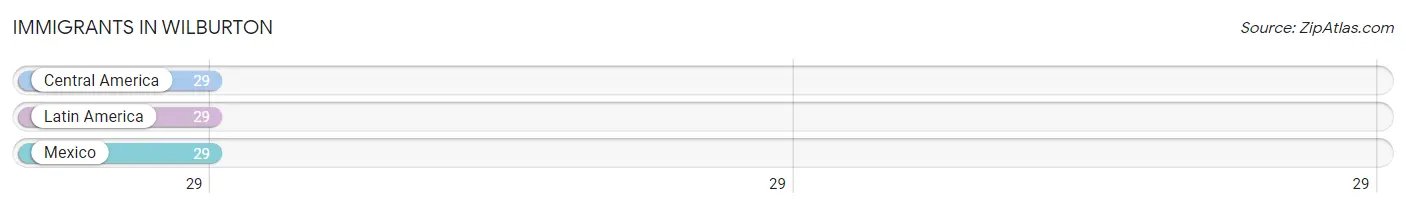
The most numerous immigrant groups reported in Wilburton came from Central America (29 | 1.0%), Latin America (29 | 1.0%), and Mexico (29 | 1.0%), together accounting for 3.1% of all Wilburton residents.
| Immigration Origin | # Population | % Population |
| Central America | 29 | 1.0% |
| Latin America | 29 | 1.0% |
| Mexico | 29 | 1.0% | View All 3 Rows |
Sex and Age in Wilburton
Sex and Age in Wilburton
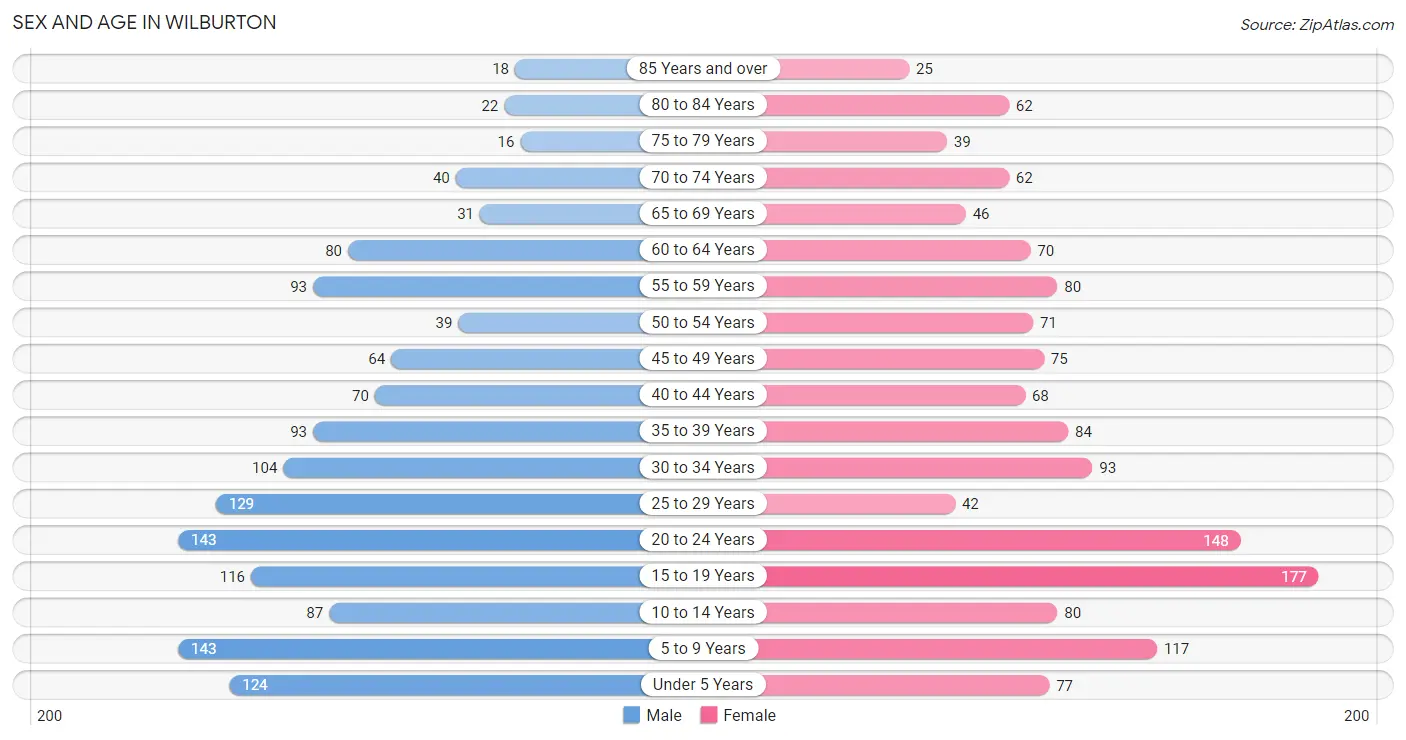
The most populous age groups in Wilburton are 5 to 9 Years (143 | 10.1%) for men and 15 to 19 Years (177 | 12.5%) for women.
| Age Bracket | Male | Female |
| Under 5 Years | 124 (8.8%) | 77 (5.4%) |
| 5 to 9 Years | 143 (10.1%) | 117 (8.3%) |
| 10 to 14 Years | 87 (6.2%) | 80 (5.7%) |
| 15 to 19 Years | 116 (8.2%) | 177 (12.5%) |
| 20 to 24 Years | 143 (10.1%) | 148 (10.4%) |
| 25 to 29 Years | 129 (9.1%) | 42 (3.0%) |
| 30 to 34 Years | 104 (7.4%) | 93 (6.6%) |
| 35 to 39 Years | 93 (6.6%) | 84 (5.9%) |
| 40 to 44 Years | 70 (5.0%) | 68 (4.8%) |
| 45 to 49 Years | 64 (4.5%) | 75 (5.3%) |
| 50 to 54 Years | 39 (2.8%) | 71 (5.0%) |
| 55 to 59 Years | 93 (6.6%) | 80 (5.7%) |
| 60 to 64 Years | 80 (5.7%) | 70 (4.9%) |
| 65 to 69 Years | 31 (2.2%) | 46 (3.3%) |
| 70 to 74 Years | 40 (2.8%) | 62 (4.4%) |
| 75 to 79 Years | 16 (1.1%) | 39 (2.8%) |
| 80 to 84 Years | 22 (1.6%) | 62 (4.4%) |
| 85 Years and over | 18 (1.3%) | 25 (1.8%) |
| Total | 1,412 (100.0%) | 1,416 (100.0%) |
Families and Households in Wilburton
Median Family Size in Wilburton
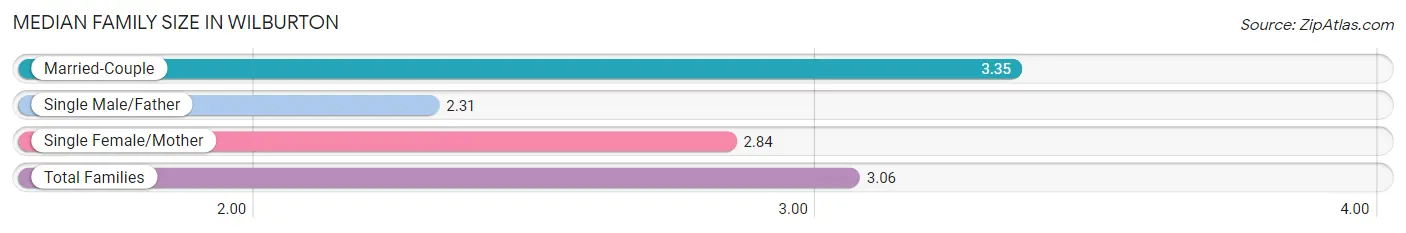
The median family size in Wilburton is 3.06 persons per family, with married-couple families (428 | 62.0%) accounting for the largest median family size of 3.35 persons per family. On the other hand, single male/father families (121 | 17.5%) represent the smallest median family size with 2.31 persons per family.
| Family Type | # Families | Family Size |
| Married-Couple | 428 (62.0%) | 3.35 |
| Single Male/Father | 121 (17.5%) | 2.31 |
| Single Female/Mother | 141 (20.4%) | 2.84 |
| Total Families | 690 (100.0%) | 3.06 |
Median Household Size in Wilburton
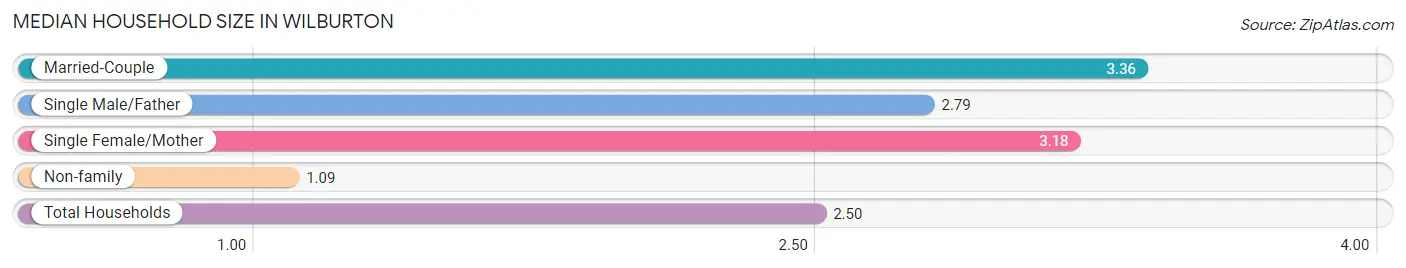
The median household size in Wilburton is 2.50 persons per household, with married-couple households (428 | 41.1%) accounting for the largest median household size of 3.36 persons per household. non-family households (351 | 33.7%) represent the smallest median household size with 1.09 persons per household.
| Household Type | # Households | Household Size |
| Married-Couple | 428 (41.1%) | 3.36 |
| Single Male/Father | 121 (11.6%) | 2.79 |
| Single Female/Mother | 141 (13.5%) | 3.18 |
| Non-family | 351 (33.7%) | 1.09 |
| Total Households | 1,041 (100.0%) | 2.50 |
Household Size by Marriage Status in Wilburton
Out of a total of 1,041 households in Wilburton, 690 (66.3%) are family households, while 351 (33.7%) are nonfamily households. The most numerous type of family households are 2-person households, comprising 235, and the most common type of nonfamily households are 1-person households, comprising 311.
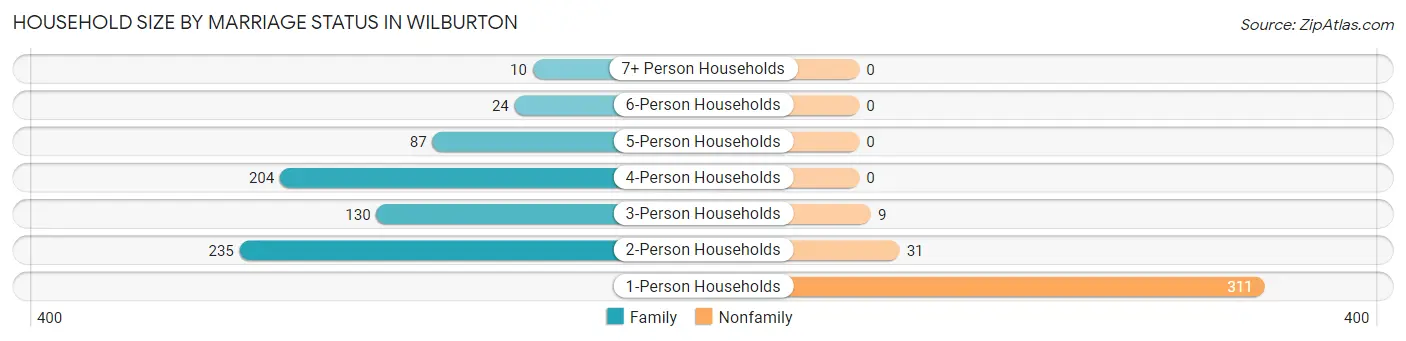
| Household Size | Family Households | Nonfamily Households |
| 1-Person Households | - | 311 (29.9%) |
| 2-Person Households | 235 (22.6%) | 31 (3.0%) |
| 3-Person Households | 130 (12.5%) | 9 (0.9%) |
| 4-Person Households | 204 (19.6%) | 0 (0.0%) |
| 5-Person Households | 87 (8.4%) | 0 (0.0%) |
| 6-Person Households | 24 (2.3%) | 0 (0.0%) |
| 7+ Person Households | 10 (1.0%) | 0 (0.0%) |
| Total | 690 (66.3%) | 351 (33.7%) |
Female Fertility in Wilburton
Fertility by Age in Wilburton
Average fertility rate in Wilburton is 14.0 births per 1,000 women. Women in the age bracket of 15 to 19 years have the highest fertility rate with 23.0 births per 1,000 women. Women in the age bracket of 20 to 34 years acount for 60.0% of all women with births.
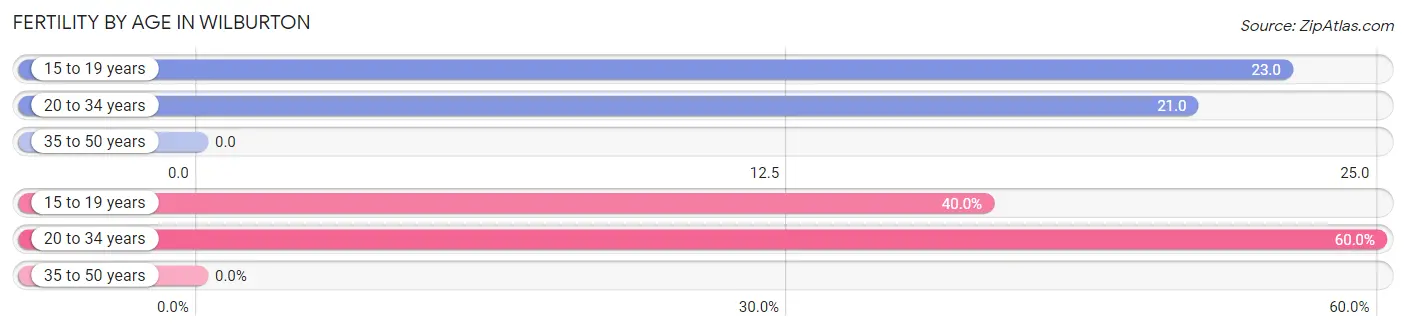
| Age Bracket | Women with Births | Births / 1,000 Women |
| 15 to 19 years | 4 (40.0%) | 23.0 |
| 20 to 34 years | 6 (60.0%) | 21.0 |
| 35 to 50 years | 0 (0.0%) | 0.0 |
| Total | 10 (100.0%) | 14.0 |
Fertility by Age by Marriage Status in Wilburton
60.0% of women with births (10) in Wilburton are married. The highest percentage of unmarried women with births falls into 15 to 19 years age bracket with 100.0% of them unmarried at the time of birth, while the lowest percentage of unmarried women with births belong to 20 to 34 years age bracket with 0.0% of them unmarried.
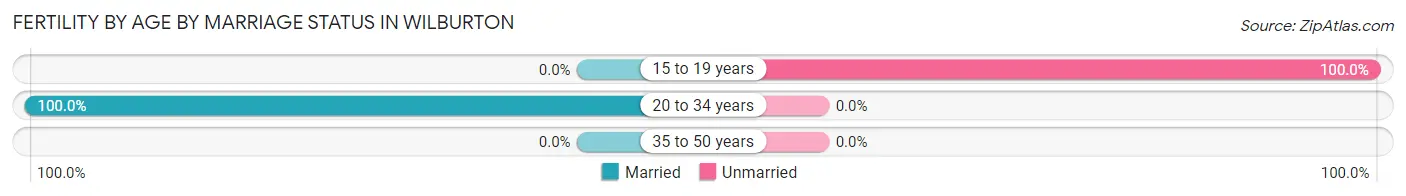
| Age Bracket | Married | Unmarried |
| 15 to 19 years | 0 (0.0%) | 4 (100.0%) |
| 20 to 34 years | 6 (100.0%) | 0 (0.0%) |
| 35 to 50 years | 0 (0.0%) | 0 (0.0%) |
| Total | 6 (60.0%) | 4 (40.0%) |
Fertility by Education in Wilburton
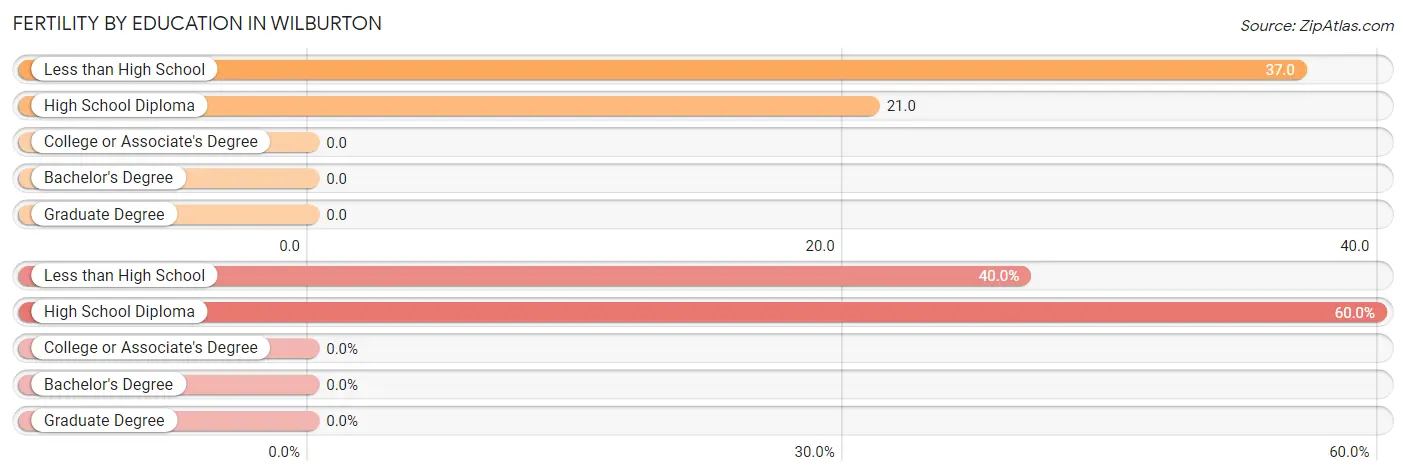
| Educational Attainment | Women with Births | Births / 1,000 Women |
| Less than High School | 4 (40.0%) | 37.0 |
| High School Diploma | 6 (60.0%) | 21.0 |
| College or Associate's Degree | 0 (0.0%) | 0.0 |
| Bachelor's Degree | 0 (0.0%) | 0.0 |
| Graduate Degree | 0 (0.0%) | 0.0 |
| Total | 10 (100.0%) | 14.0 |
Fertility by Education by Marriage Status in Wilburton
40.0% of women with births in Wilburton are unmarried. Women with the educational attainment of high school diploma are most likely to be married with 100.0% of them married at childbirth, while women with the educational attainment of less than high school are least likely to be married with 100.0% of them unmarried at childbirth.
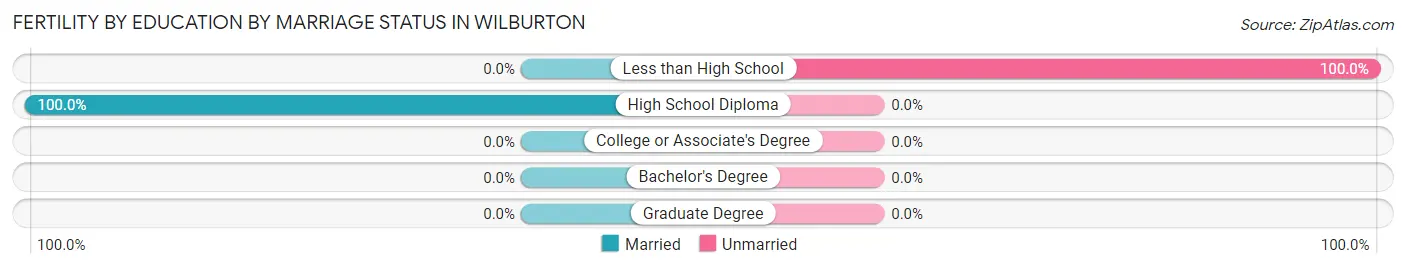
| Educational Attainment | Married | Unmarried |
| Less than High School | 0 (0.0%) | 4 (100.0%) |
| High School Diploma | 6 (100.0%) | 0 (0.0%) |
| College or Associate's Degree | 0 (0.0%) | 0 (0.0%) |
| Bachelor's Degree | 0 (0.0%) | 0 (0.0%) |
| Graduate Degree | 0 (0.0%) | 0 (0.0%) |
| Total | 6 (60.0%) | 4 (40.0%) |
Employment Characteristics in Wilburton
Employment by Class of Employer in Wilburton
Among the 1,069 employed individuals in Wilburton, private company employees (675 | 63.1%), local government employees (109 | 10.2%), and state government employees (107 | 10.0%) make up the most common classes of employment.
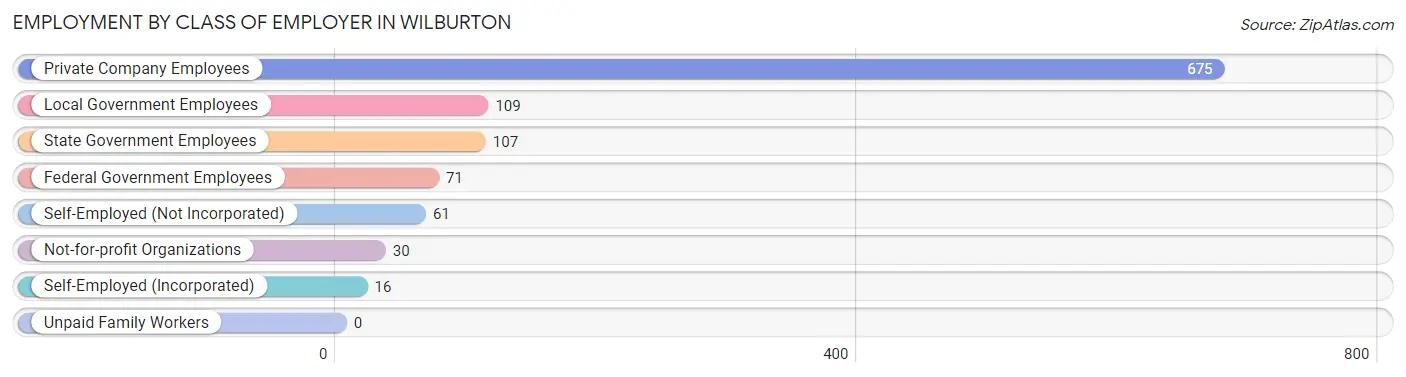
| Employer Class | # Employees | % Employees |
| Private Company Employees | 675 | 63.1% |
| Self-Employed (Incorporated) | 16 | 1.5% |
| Self-Employed (Not Incorporated) | 61 | 5.7% |
| Not-for-profit Organizations | 30 | 2.8% |
| Local Government Employees | 109 | 10.2% |
| State Government Employees | 107 | 10.0% |
| Federal Government Employees | 71 | 6.6% |
| Unpaid Family Workers | 0 | 0.0% |
| Total | 1,069 | 100.0% |
Employment Status by Age in Wilburton
According to the labor force statistics for Wilburton, out of the total population over 16 years of age (2,167), 55.6% or 1,205 individuals are in the labor force, with 9.9% or 119 of them unemployed. The age group with the highest labor force participation rate is 25 to 29 years, with 82.5% or 141 individuals in the labor force. Within the labor force, the 16 to 19 years age range has the highest percentage of unemployed individuals, with 36.8% or 42 of them being unemployed.
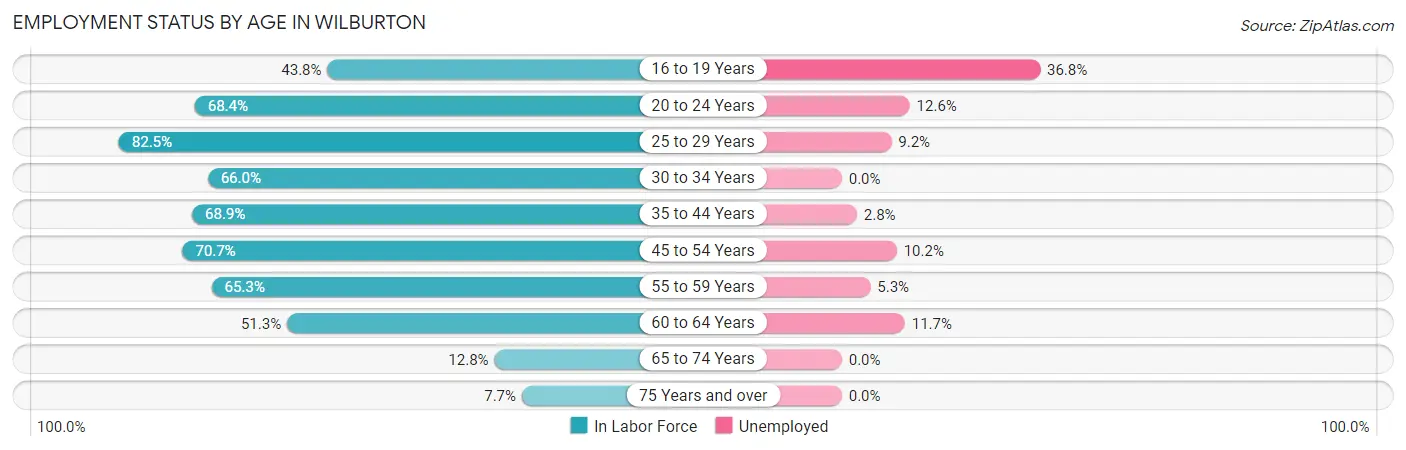
| Age Bracket | In Labor Force | Unemployed |
| 16 to 19 Years | 114 (43.8%) | 42 (36.8%) |
| 20 to 24 Years | 199 (68.4%) | 25 (12.6%) |
| 25 to 29 Years | 141 (82.5%) | 13 (9.2%) |
| 30 to 34 Years | 130 (66.0%) | 0 (0.0%) |
| 35 to 44 Years | 217 (68.9%) | 6 (2.8%) |
| 45 to 54 Years | 176 (70.7%) | 18 (10.2%) |
| 55 to 59 Years | 113 (65.3%) | 6 (5.3%) |
| 60 to 64 Years | 77 (51.3%) | 9 (11.7%) |
| 65 to 74 Years | 23 (12.8%) | 0 (0.0%) |
| 75 Years and over | 14 (7.7%) | 0 (0.0%) |
| Total | 1,205 (55.6%) | 119 (9.9%) |
Employment Status by Educational Attainment in Wilburton
According to labor force statistics for Wilburton, 68.0% of individuals (853) out of the total population between 25 and 64 years of age (1,255) are in the labor force, with 6.1% or 52 of them being unemployed. The group with the highest labor force participation rate are those with the educational attainment of bachelor's degree or higher, with 73.9% or 85 individuals in the labor force. Within the labor force, individuals with high school diploma education have the highest percentage of unemployment, with 7.5% or 27 of them being unemployed.
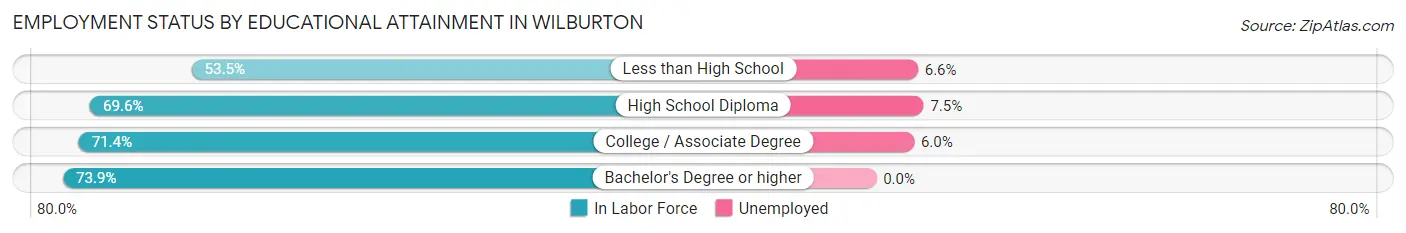
| Educational Attainment | In Labor Force | Unemployed |
| Less than High School | 106 (53.5%) | 13 (6.6%) |
| High School Diploma | 361 (69.6%) | 39 (7.5%) |
| College / Associate Degree | 302 (71.4%) | 25 (6.0%) |
| Bachelor's Degree or higher | 85 (73.9%) | 0 (0.0%) |
| Total | 853 (68.0%) | 77 (6.1%) |
Employment Occupations by Sex in Wilburton
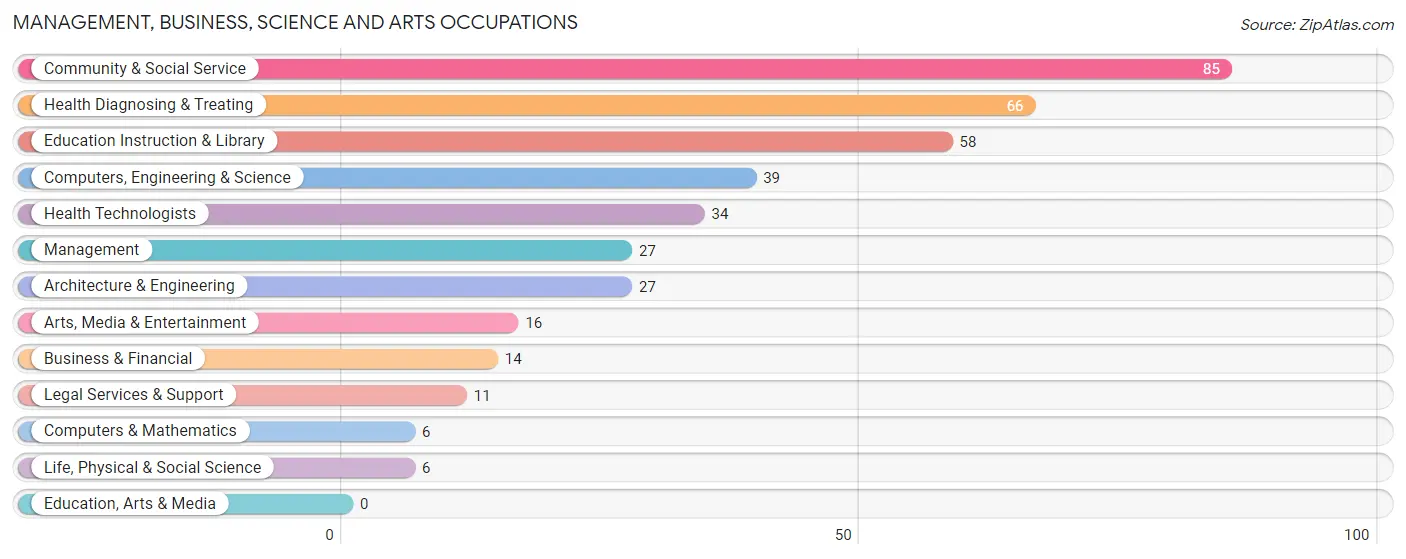
Management, Business, Science and Arts Occupations
The most common Management, Business, Science and Arts occupations in Wilburton are Community & Social Service (85 | 7.8%), Health Diagnosing & Treating (66 | 6.1%), Education Instruction & Library (58 | 5.3%), Computers, Engineering & Science (39 | 3.6%), and Health Technologists (34 | 3.1%).
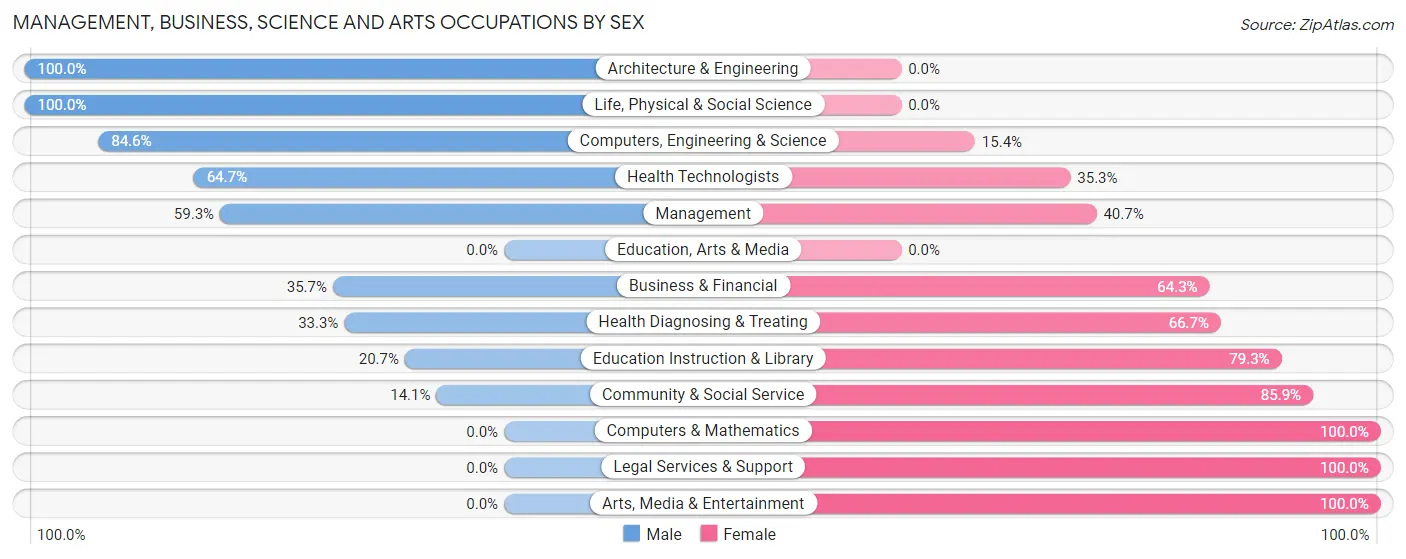
Management, Business, Science and Arts Occupations by Sex
Within the Management, Business, Science and Arts occupations in Wilburton, the most male-oriented occupations are Architecture & Engineering (100.0%), Life, Physical & Social Science (100.0%), and Computers, Engineering & Science (84.6%), while the most female-oriented occupations are Computers & Mathematics (100.0%), Legal Services & Support (100.0%), and Arts, Media & Entertainment (100.0%).
| Occupation | Male | Female |
| Management | 16 (59.3%) | 11 (40.7%) |
| Business & Financial | 5 (35.7%) | 9 (64.3%) |
| Computers, Engineering & Science | 33 (84.6%) | 6 (15.4%) |
| Computers & Mathematics | 0 (0.0%) | 6 (100.0%) |
| Architecture & Engineering | 27 (100.0%) | 0 (0.0%) |
| Life, Physical & Social Science | 6 (100.0%) | 0 (0.0%) |
| Community & Social Service | 12 (14.1%) | 73 (85.9%) |
| Education, Arts & Media | 0 (0.0%) | 0 (0.0%) |
| Legal Services & Support | 0 (0.0%) | 11 (100.0%) |
| Education Instruction & Library | 12 (20.7%) | 46 (79.3%) |
| Arts, Media & Entertainment | 0 (0.0%) | 16 (100.0%) |
| Health Diagnosing & Treating | 22 (33.3%) | 44 (66.7%) |
| Health Technologists | 22 (64.7%) | 12 (35.3%) |
| Total (Category) | 88 (38.1%) | 143 (61.9%) |
| Total (Overall) | 590 (54.4%) | 495 (45.6%) |
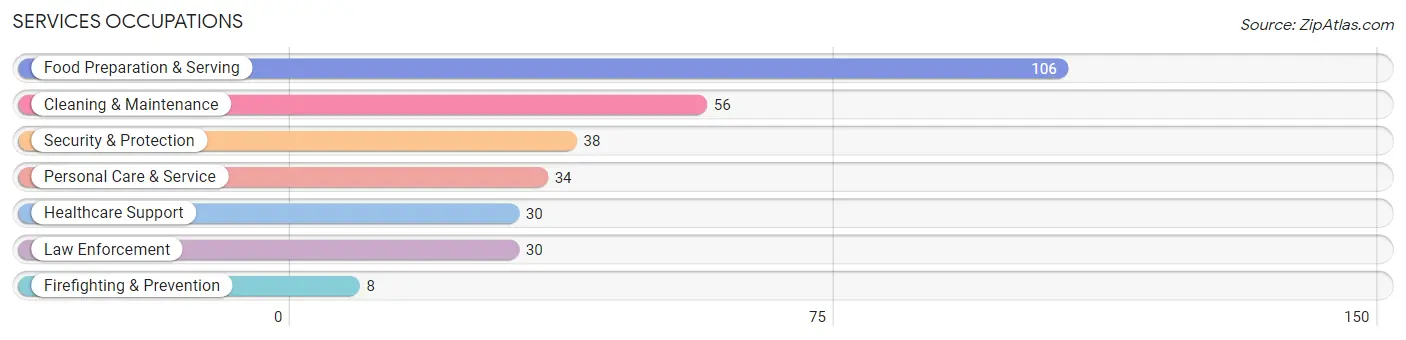
Services Occupations
The most common Services occupations in Wilburton are Food Preparation & Serving (106 | 9.8%), Cleaning & Maintenance (56 | 5.2%), Security & Protection (38 | 3.5%), Personal Care & Service (34 | 3.1%), and Healthcare Support (30 | 2.8%).
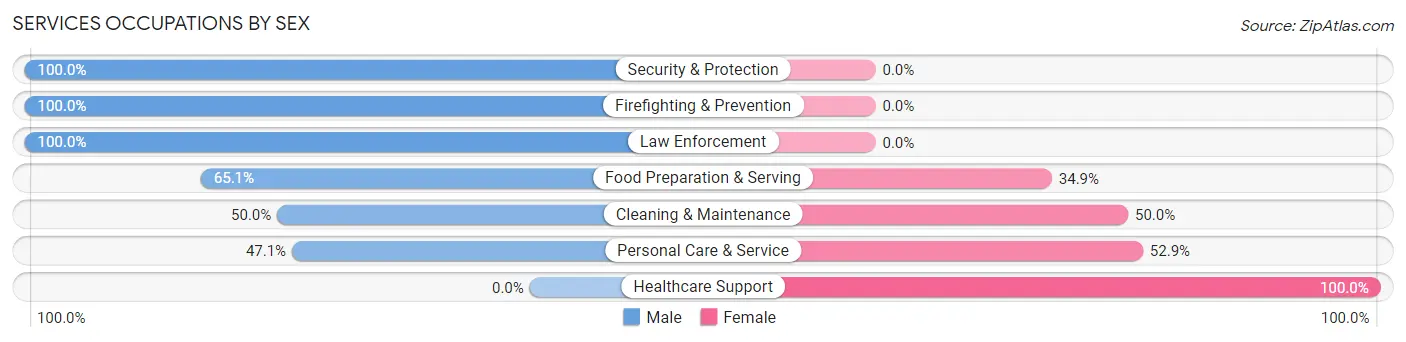
Services Occupations by Sex
Within the Services occupations in Wilburton, the most male-oriented occupations are Security & Protection (100.0%), Firefighting & Prevention (100.0%), and Law Enforcement (100.0%), while the most female-oriented occupations are Healthcare Support (100.0%), Personal Care & Service (52.9%), and Cleaning & Maintenance (50.0%).
| Occupation | Male | Female |
| Healthcare Support | 0 (0.0%) | 30 (100.0%) |
| Security & Protection | 38 (100.0%) | 0 (0.0%) |
| Firefighting & Prevention | 8 (100.0%) | 0 (0.0%) |
| Law Enforcement | 30 (100.0%) | 0 (0.0%) |
| Food Preparation & Serving | 69 (65.1%) | 37 (34.9%) |
| Cleaning & Maintenance | 28 (50.0%) | 28 (50.0%) |
| Personal Care & Service | 16 (47.1%) | 18 (52.9%) |
| Total (Category) | 151 (57.2%) | 113 (42.8%) |
| Total (Overall) | 590 (54.4%) | 495 (45.6%) |
Sales and Office Occupations
The most common Sales and Office occupations in Wilburton are Office & Administration (176 | 16.2%), and Sales & Related (70 | 6.5%).
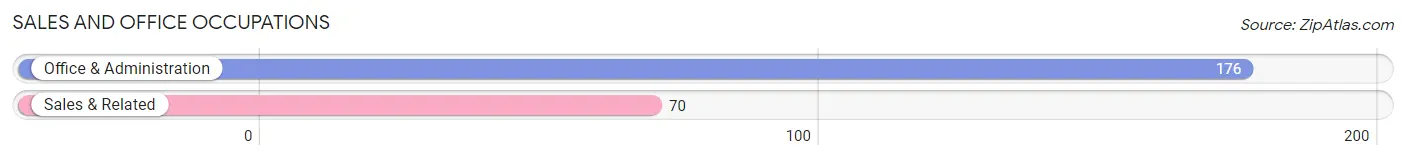
Sales and Office Occupations by Sex
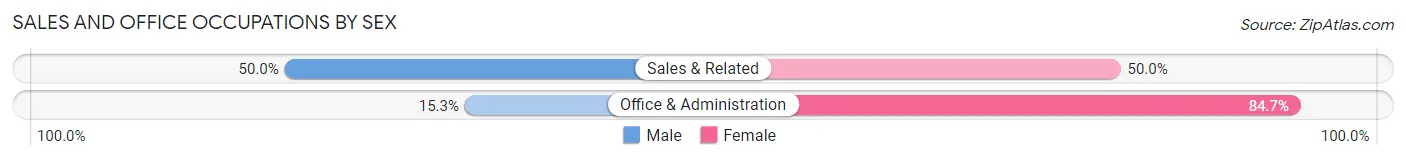
| Occupation | Male | Female |
| Sales & Related | 35 (50.0%) | 35 (50.0%) |
| Office & Administration | 27 (15.3%) | 149 (84.7%) |
| Total (Category) | 62 (25.2%) | 184 (74.8%) |
| Total (Overall) | 590 (54.4%) | 495 (45.6%) |
Natural Resources, Construction and Maintenance Occupations
The most common Natural Resources, Construction and Maintenance occupations in Wilburton are Installation, Maintenance & Repair (86 | 7.9%), Construction & Extraction (40 | 3.7%), and Farming, Fishing & Forestry (10 | 0.9%).
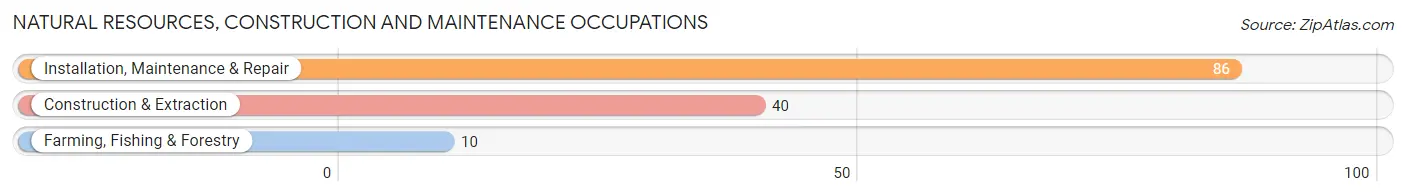
Natural Resources, Construction and Maintenance Occupations by Sex
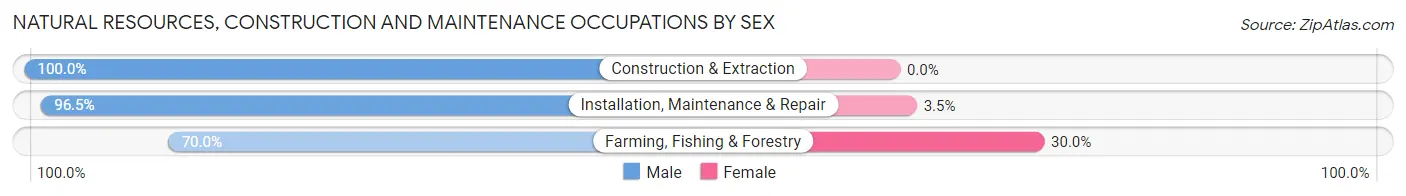
| Occupation | Male | Female |
| Farming, Fishing & Forestry | 7 (70.0%) | 3 (30.0%) |
| Construction & Extraction | 40 (100.0%) | 0 (0.0%) |
| Installation, Maintenance & Repair | 83 (96.5%) | 3 (3.5%) |
| Total (Category) | 130 (95.6%) | 6 (4.4%) |
| Total (Overall) | 590 (54.4%) | 495 (45.6%) |
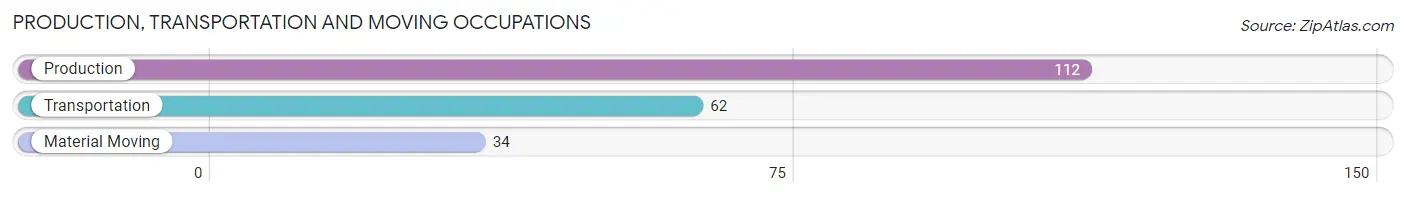
Production, Transportation and Moving Occupations
The most common Production, Transportation and Moving occupations in Wilburton are Production (112 | 10.3%), Transportation (62 | 5.7%), and Material Moving (34 | 3.1%).
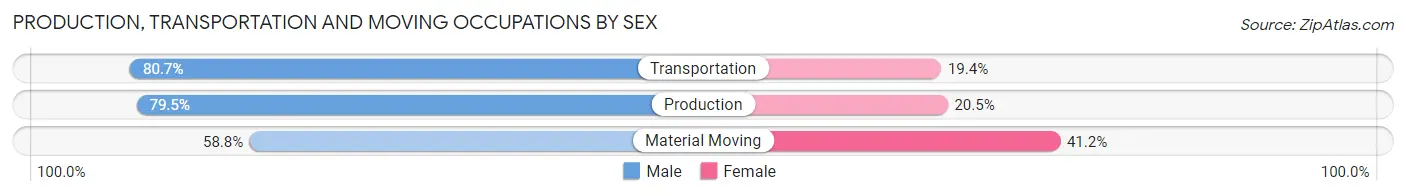
Production, Transportation and Moving Occupations by Sex
| Occupation | Male | Female |
| Production | 89 (79.5%) | 23 (20.5%) |
| Transportation | 50 (80.6%) | 12 (19.4%) |
| Material Moving | 20 (58.8%) | 14 (41.2%) |
| Total (Category) | 159 (76.4%) | 49 (23.6%) |
| Total (Overall) | 590 (54.4%) | 495 (45.6%) |
Employment Industries by Sex in Wilburton
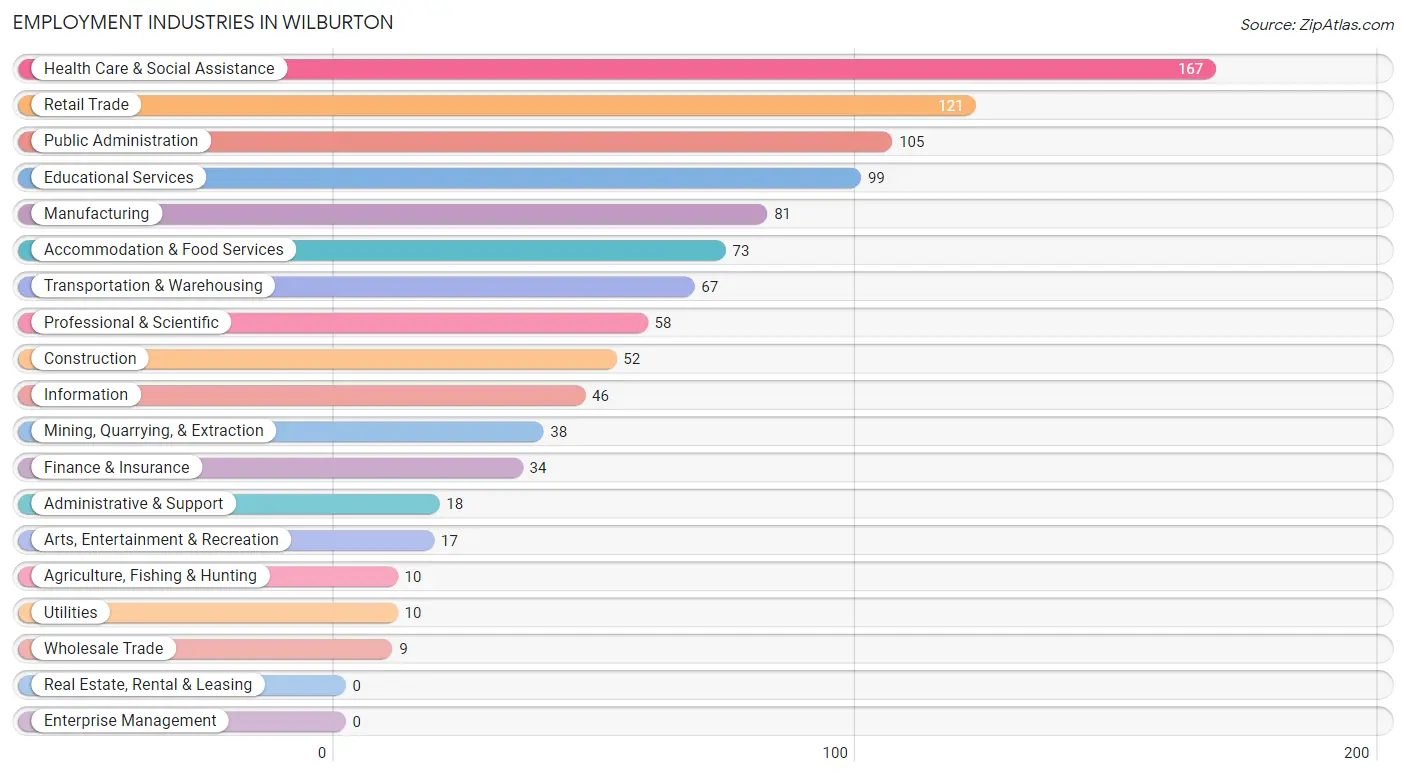
Employment Industries in Wilburton
The major employment industries in Wilburton include Health Care & Social Assistance (167 | 15.4%), Retail Trade (121 | 11.2%), Public Administration (105 | 9.7%), Educational Services (99 | 9.1%), and Manufacturing (81 | 7.5%).
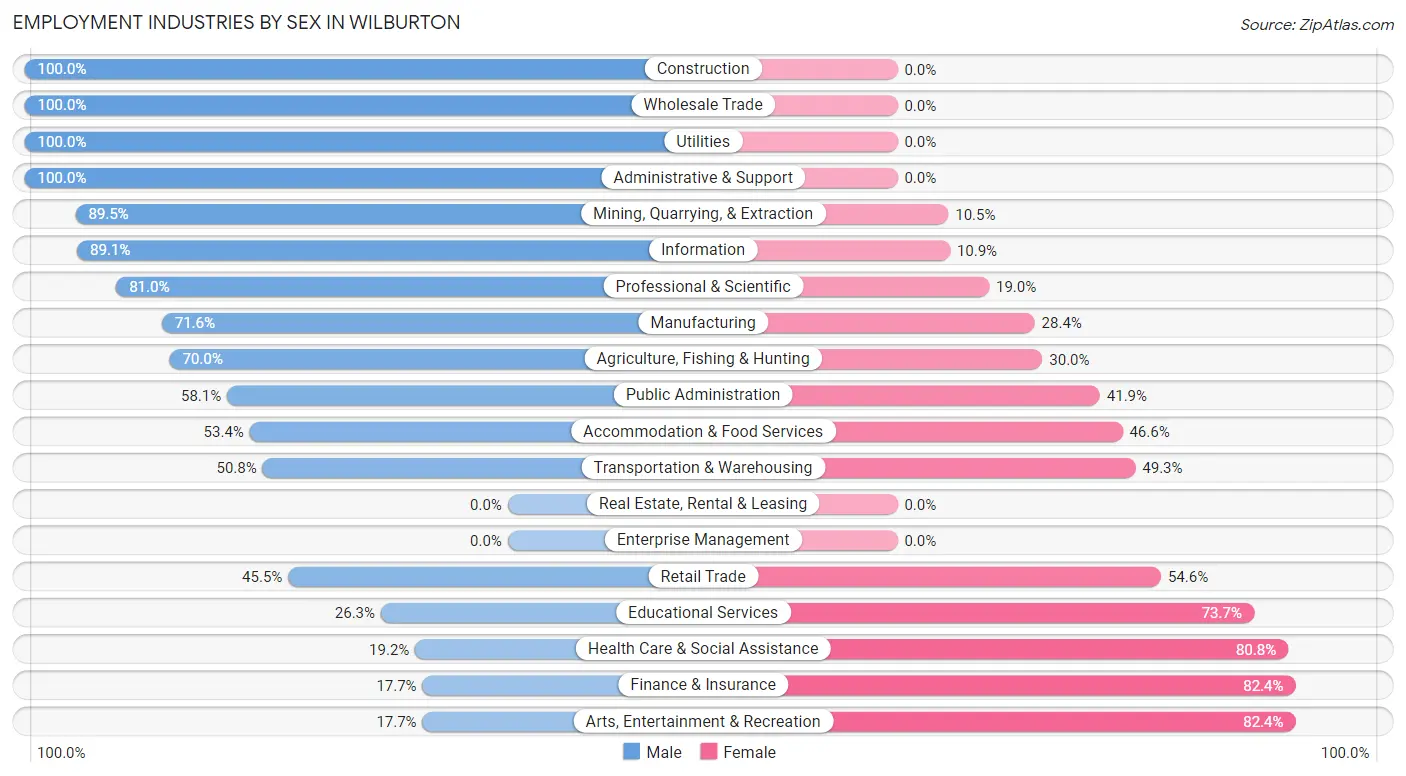
Employment Industries by Sex in Wilburton
The Wilburton industries that see more men than women are Construction (100.0%), Wholesale Trade (100.0%), and Utilities (100.0%), whereas the industries that tend to have a higher number of women are Finance & Insurance (82.4%), Arts, Entertainment & Recreation (82.4%), and Health Care & Social Assistance (80.8%).
| Industry | Male | Female |
| Agriculture, Fishing & Hunting | 7 (70.0%) | 3 (30.0%) |
| Mining, Quarrying, & Extraction | 34 (89.5%) | 4 (10.5%) |
| Construction | 52 (100.0%) | 0 (0.0%) |
| Manufacturing | 58 (71.6%) | 23 (28.4%) |
| Wholesale Trade | 9 (100.0%) | 0 (0.0%) |
| Retail Trade | 55 (45.5%) | 66 (54.5%) |
| Transportation & Warehousing | 34 (50.7%) | 33 (49.2%) |
| Utilities | 10 (100.0%) | 0 (0.0%) |
| Information | 41 (89.1%) | 5 (10.9%) |
| Finance & Insurance | 6 (17.6%) | 28 (82.4%) |
| Real Estate, Rental & Leasing | 0 (0.0%) | 0 (0.0%) |
| Professional & Scientific | 47 (81.0%) | 11 (19.0%) |
| Enterprise Management | 0 (0.0%) | 0 (0.0%) |
| Administrative & Support | 18 (100.0%) | 0 (0.0%) |
| Educational Services | 26 (26.3%) | 73 (73.7%) |
| Health Care & Social Assistance | 32 (19.2%) | 135 (80.8%) |
| Arts, Entertainment & Recreation | 3 (17.6%) | 14 (82.4%) |
| Accommodation & Food Services | 39 (53.4%) | 34 (46.6%) |
| Public Administration | 61 (58.1%) | 44 (41.9%) |
| Total | 590 (54.4%) | 495 (45.6%) |
Education in Wilburton
School Enrollment in Wilburton
The most common levels of schooling among the 724 students in Wilburton are elementary school (226 | 31.2%), college / undergraduate (204 | 28.2%), and high school (116 | 16.0%).
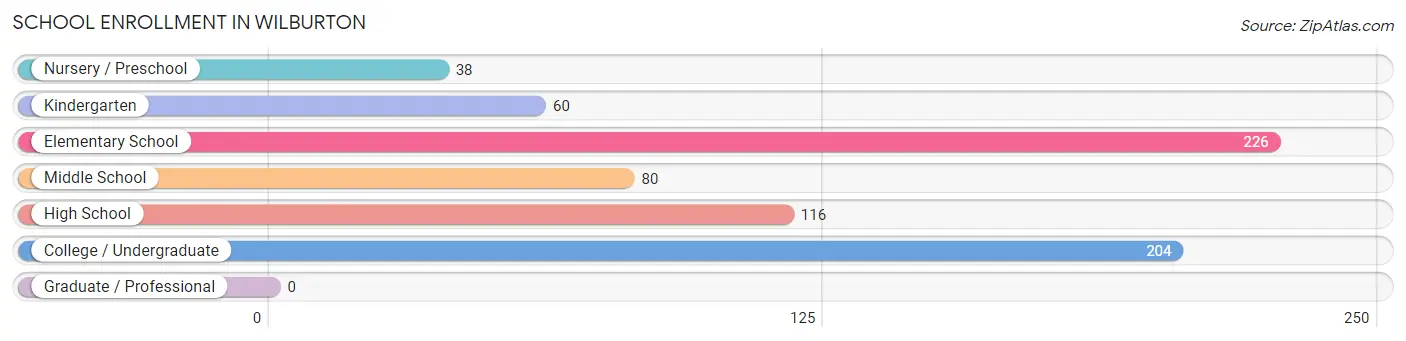
| School Level | # Students | % Students |
| Nursery / Preschool | 38 | 5.2% |
| Kindergarten | 60 | 8.3% |
| Elementary School | 226 | 31.2% |
| Middle School | 80 | 11.1% |
| High School | 116 | 16.0% |
| College / Undergraduate | 204 | 28.2% |
| Graduate / Professional | 0 | 0.0% |
| Total | 724 | 100.0% |
School Enrollment by Age by Funding Source in Wilburton
Out of a total of 724 students who are enrolled in schools in Wilburton, 32 (4.4%) attend a private institution, while the remaining 692 (95.6%) are enrolled in public schools. The age group of 3 to 4 year olds has the highest likelihood of being enrolled in private schools, with 6 (27.3% in the age bracket) enrolled. Conversely, the age group of 5 to 9 year old has the lowest likelihood of being enrolled in a private school, with 236 (100.0% in the age bracket) attending a public institution.
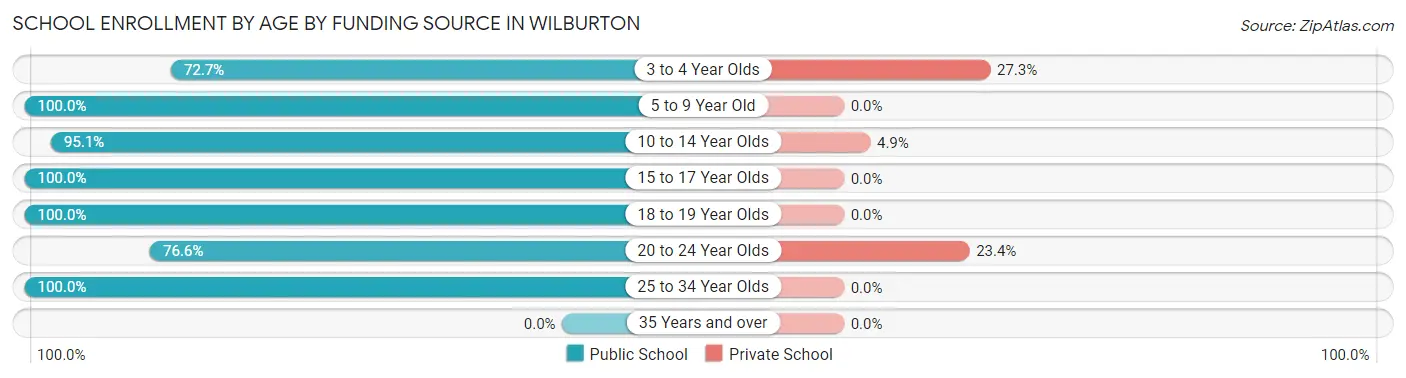
| Age Bracket | Public School | Private School |
| 3 to 4 Year Olds | 16 (72.7%) | 6 (27.3%) |
| 5 to 9 Year Old | 236 (100.0%) | 0 (0.0%) |
| 10 to 14 Year Olds | 155 (95.1%) | 8 (4.9%) |
| 15 to 17 Year Olds | 74 (100.0%) | 0 (0.0%) |
| 18 to 19 Year Olds | 139 (100.0%) | 0 (0.0%) |
| 20 to 24 Year Olds | 59 (76.6%) | 18 (23.4%) |
| 25 to 34 Year Olds | 13 (100.0%) | 0 (0.0%) |
| 35 Years and over | 0 (0.0%) | 0 (0.0%) |
| Total | 692 (95.6%) | 32 (4.4%) |
Educational Attainment by Field of Study in Wilburton
Education (62 | 33.0%), science & technology (40 | 21.3%), computers & mathematics (23 | 12.2%), physical & health sciences (15 | 8.0%), and bio, nature & agricultural (14 | 7.4%) are the most common fields of study among 188 individuals in Wilburton who have obtained a bachelor's degree or higher.
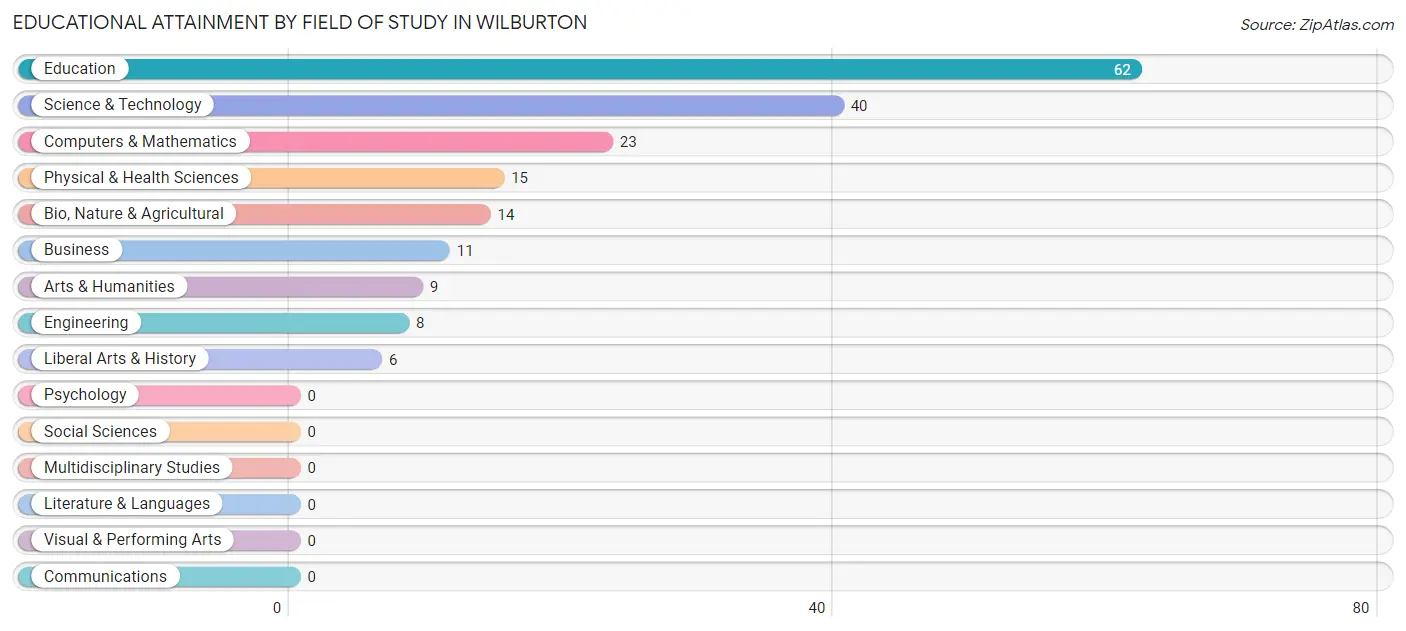
| Field of Study | # Graduates | % Graduates |
| Computers & Mathematics | 23 | 12.2% |
| Bio, Nature & Agricultural | 14 | 7.4% |
| Physical & Health Sciences | 15 | 8.0% |
| Psychology | 0 | 0.0% |
| Social Sciences | 0 | 0.0% |
| Engineering | 8 | 4.3% |
| Multidisciplinary Studies | 0 | 0.0% |
| Science & Technology | 40 | 21.3% |
| Business | 11 | 5.9% |
| Education | 62 | 33.0% |
| Literature & Languages | 0 | 0.0% |
| Liberal Arts & History | 6 | 3.2% |
| Visual & Performing Arts | 0 | 0.0% |
| Communications | 0 | 0.0% |
| Arts & Humanities | 9 | 4.8% |
| Total | 188 | 100.0% |
Transportation & Commute in Wilburton
Vehicle Availability by Sex in Wilburton
The most prevalent vehicle ownership categories in Wilburton are males with 2 vehicles (239, accounting for 41.1%) and females with 2 vehicles (195, making up 51.8%).
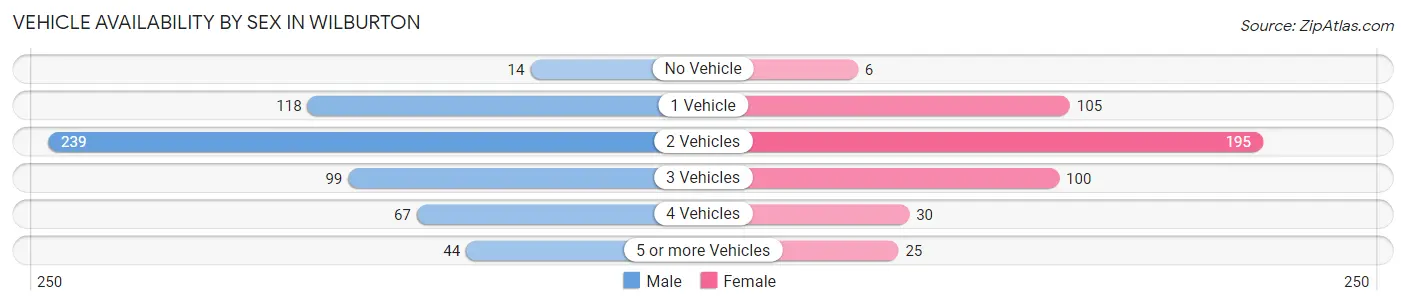
| Vehicles Available | Male | Female |
| No Vehicle | 14 (2.4%) | 6 (1.3%) |
| 1 Vehicle | 118 (20.3%) | 105 (22.8%) |
| 2 Vehicles | 239 (41.1%) | 195 (42.3%) |
| 3 Vehicles | 99 (17.0%) | 100 (21.7%) |
| 4 Vehicles | 67 (11.5%) | 30 (6.5%) |
| 5 or more Vehicles | 44 (7.6%) | 25 (5.4%) |
| Total | 581 (100.0%) | 461 (100.0%) |
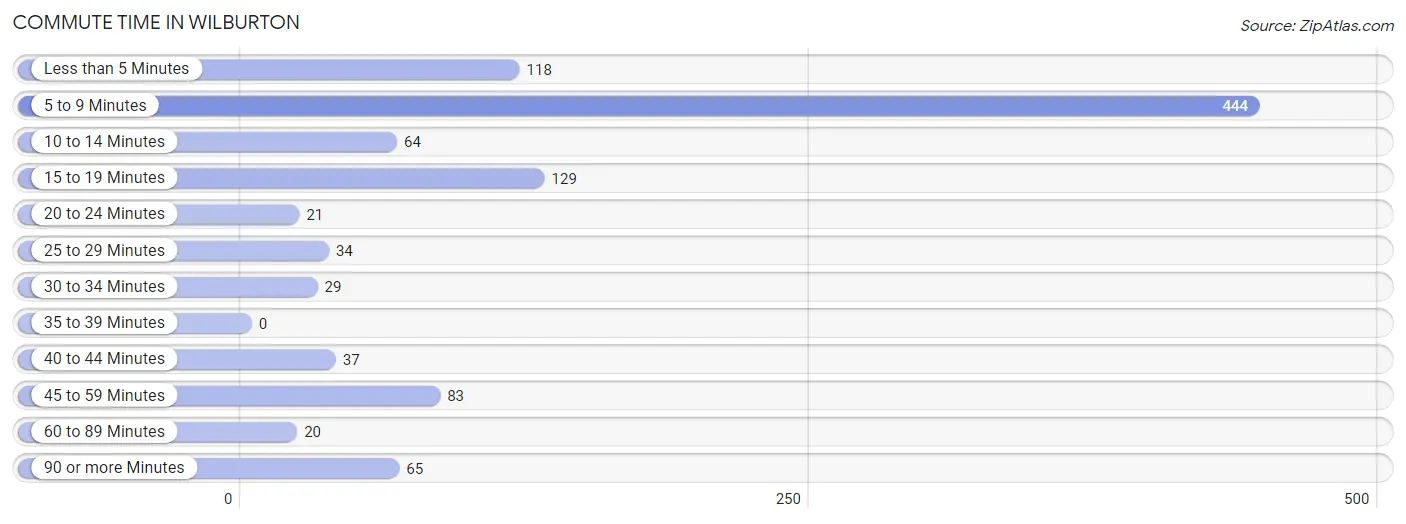
Commute Time in Wilburton
The most frequently occuring commute durations in Wilburton are 5 to 9 minutes (444 commuters, 42.5%), 15 to 19 minutes (129 commuters, 12.4%), and less than 5 minutes (118 commuters, 11.3%).
| Commute Time | # Commuters | % Commuters |
| Less than 5 Minutes | 118 | 11.3% |
| 5 to 9 Minutes | 444 | 42.5% |
| 10 to 14 Minutes | 64 | 6.1% |
| 15 to 19 Minutes | 129 | 12.4% |
| 20 to 24 Minutes | 21 | 2.0% |
| 25 to 29 Minutes | 34 | 3.3% |
| 30 to 34 Minutes | 29 | 2.8% |
| 35 to 39 Minutes | 0 | 0.0% |
| 40 to 44 Minutes | 37 | 3.5% |
| 45 to 59 Minutes | 83 | 8.0% |
| 60 to 89 Minutes | 20 | 1.9% |
| 90 or more Minutes | 65 | 6.2% |
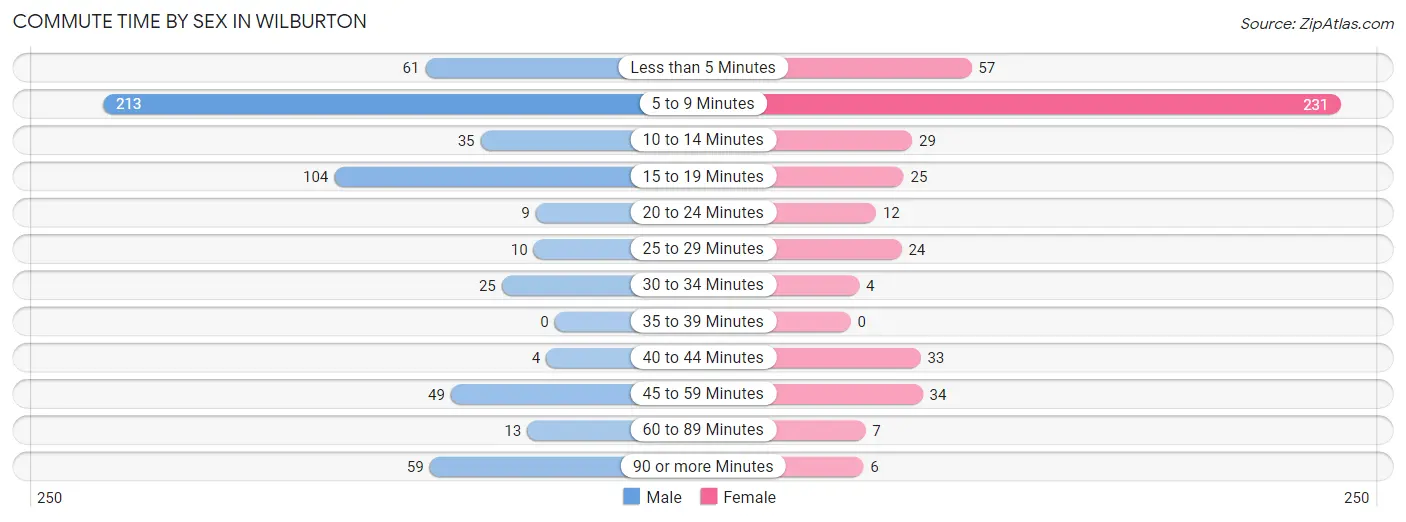
Commute Time by Sex in Wilburton
The most common commute times in Wilburton are 5 to 9 minutes (213 commuters, 36.6%) for males and 5 to 9 minutes (231 commuters, 50.0%) for females.
| Commute Time | Male | Female |
| Less than 5 Minutes | 61 (10.5%) | 57 (12.3%) |
| 5 to 9 Minutes | 213 (36.6%) | 231 (50.0%) |
| 10 to 14 Minutes | 35 (6.0%) | 29 (6.3%) |
| 15 to 19 Minutes | 104 (17.9%) | 25 (5.4%) |
| 20 to 24 Minutes | 9 (1.5%) | 12 (2.6%) |
| 25 to 29 Minutes | 10 (1.7%) | 24 (5.2%) |
| 30 to 34 Minutes | 25 (4.3%) | 4 (0.9%) |
| 35 to 39 Minutes | 0 (0.0%) | 0 (0.0%) |
| 40 to 44 Minutes | 4 (0.7%) | 33 (7.1%) |
| 45 to 59 Minutes | 49 (8.4%) | 34 (7.4%) |
| 60 to 89 Minutes | 13 (2.2%) | 7 (1.5%) |
| 90 or more Minutes | 59 (10.1%) | 6 (1.3%) |
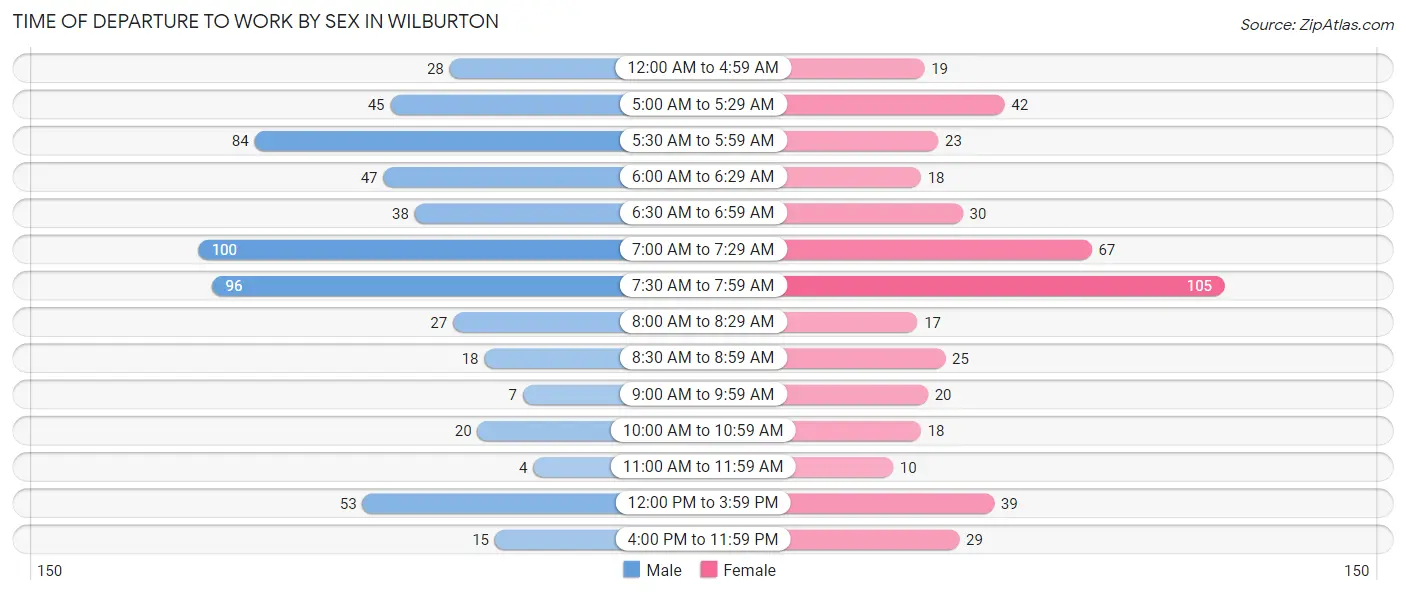
Time of Departure to Work by Sex in Wilburton
The most frequent times of departure to work in Wilburton are 7:00 AM to 7:29 AM (100, 17.2%) for males and 7:30 AM to 7:59 AM (105, 22.7%) for females.
| Time of Departure | Male | Female |
| 12:00 AM to 4:59 AM | 28 (4.8%) | 19 (4.1%) |
| 5:00 AM to 5:29 AM | 45 (7.7%) | 42 (9.1%) |
| 5:30 AM to 5:59 AM | 84 (14.4%) | 23 (5.0%) |
| 6:00 AM to 6:29 AM | 47 (8.1%) | 18 (3.9%) |
| 6:30 AM to 6:59 AM | 38 (6.5%) | 30 (6.5%) |
| 7:00 AM to 7:29 AM | 100 (17.2%) | 67 (14.5%) |
| 7:30 AM to 7:59 AM | 96 (16.5%) | 105 (22.7%) |
| 8:00 AM to 8:29 AM | 27 (4.6%) | 17 (3.7%) |
| 8:30 AM to 8:59 AM | 18 (3.1%) | 25 (5.4%) |
| 9:00 AM to 9:59 AM | 7 (1.2%) | 20 (4.3%) |
| 10:00 AM to 10:59 AM | 20 (3.4%) | 18 (3.9%) |
| 11:00 AM to 11:59 AM | 4 (0.7%) | 10 (2.2%) |
| 12:00 PM to 3:59 PM | 53 (9.1%) | 39 (8.4%) |
| 4:00 PM to 11:59 PM | 15 (2.6%) | 29 (6.3%) |
| Total | 582 (100.0%) | 462 (100.0%) |
Housing Occupancy in Wilburton
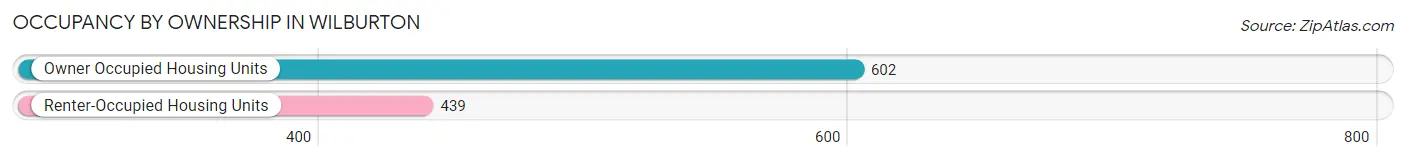
Occupancy by Ownership in Wilburton
Of the total 1,041 dwellings in Wilburton, owner-occupied units account for 602 (57.8%), while renter-occupied units make up 439 (42.2%).
| Occupancy | # Housing Units | % Housing Units |
| Owner Occupied Housing Units | 602 | 57.8% |
| Renter-Occupied Housing Units | 439 | 42.2% |
| Total Occupied Housing Units | 1,041 | 100.0% |
Occupancy by Household Size in Wilburton
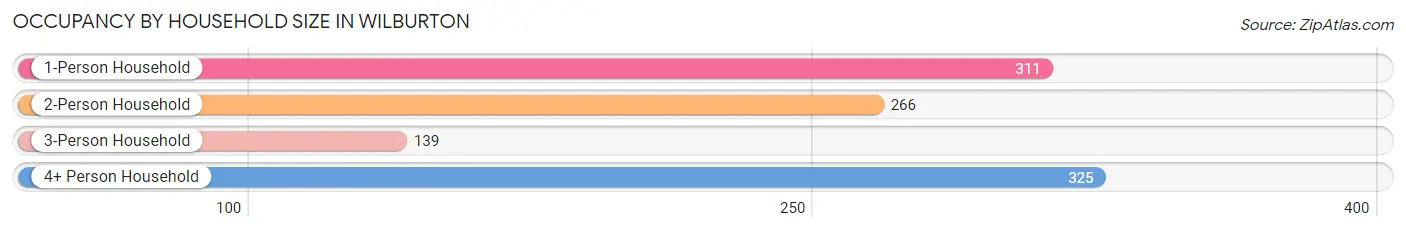
| Household Size | # Housing Units | % Housing Units |
| 1-Person Household | 311 | 29.9% |
| 2-Person Household | 266 | 25.6% |
| 3-Person Household | 139 | 13.4% |
| 4+ Person Household | 325 | 31.2% |
| Total Housing Units | 1,041 | 100.0% |
Occupancy by Ownership by Household Size in Wilburton
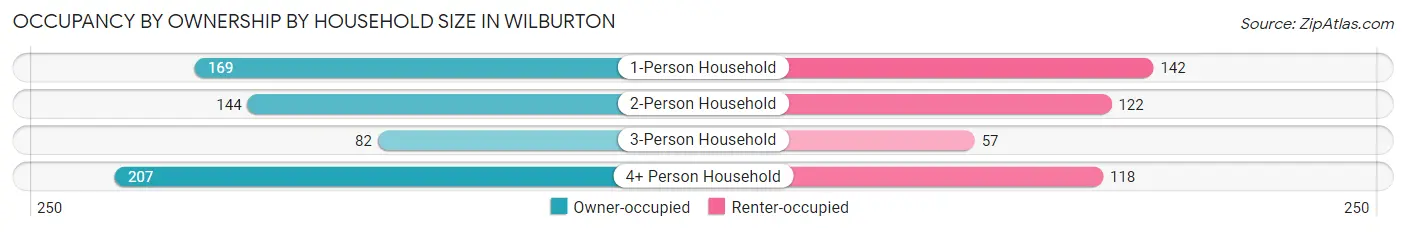
| Household Size | Owner-occupied | Renter-occupied |
| 1-Person Household | 169 (54.3%) | 142 (45.7%) |
| 2-Person Household | 144 (54.1%) | 122 (45.9%) |
| 3-Person Household | 82 (59.0%) | 57 (41.0%) |
| 4+ Person Household | 207 (63.7%) | 118 (36.3%) |
| Total Housing Units | 602 (57.8%) | 439 (42.2%) |
Occupancy by Educational Attainment in Wilburton
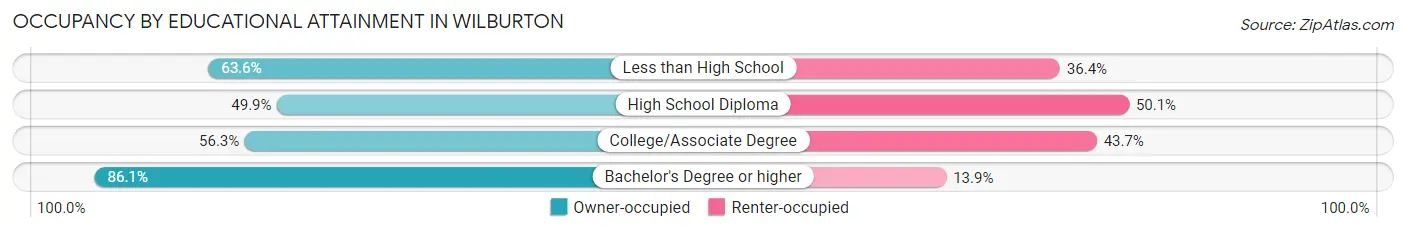
| Household Size | Owner-occupied | Renter-occupied |
| Less than High School | 89 (63.6%) | 51 (36.4%) |
| High School Diploma | 205 (49.9%) | 206 (50.1%) |
| College/Associate Degree | 215 (56.3%) | 167 (43.7%) |
| Bachelor's Degree or higher | 93 (86.1%) | 15 (13.9%) |
Occupancy by Age of Householder in Wilburton
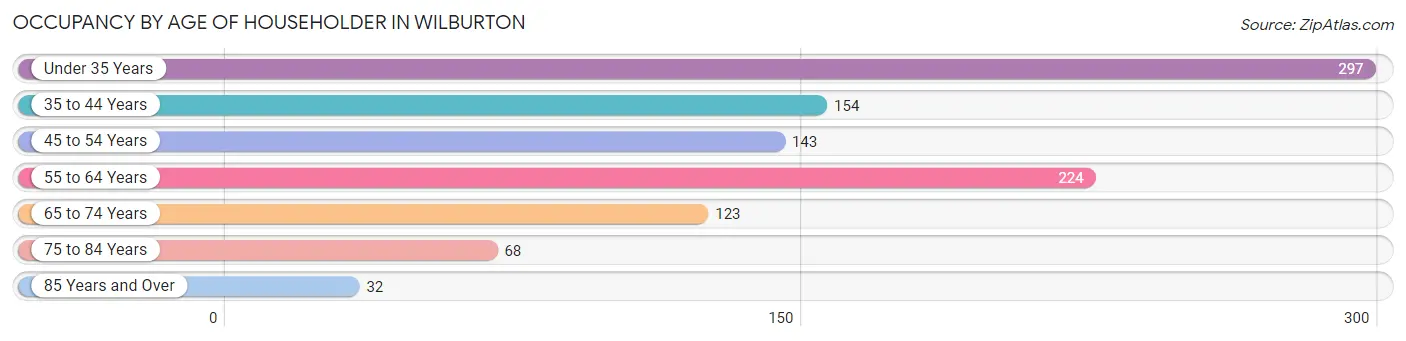
| Age Bracket | # Households | % Households |
| Under 35 Years | 297 | 28.5% |
| 35 to 44 Years | 154 | 14.8% |
| 45 to 54 Years | 143 | 13.7% |
| 55 to 64 Years | 224 | 21.5% |
| 65 to 74 Years | 123 | 11.8% |
| 75 to 84 Years | 68 | 6.5% |
| 85 Years and Over | 32 | 3.1% |
| Total | 1,041 | 100.0% |
Housing Finances in Wilburton
Median Income by Occupancy in Wilburton
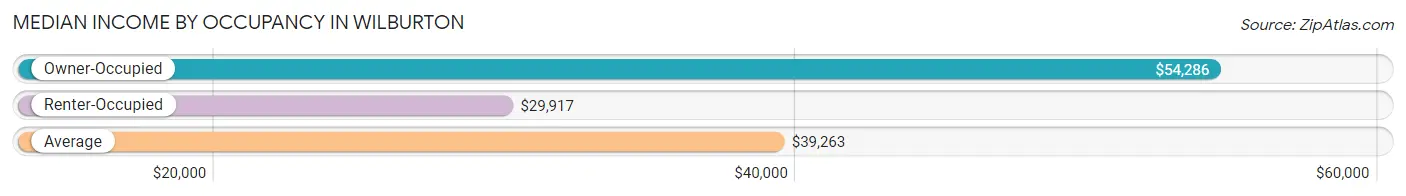
| Occupancy Type | # Households | Median Income |
| Owner-Occupied | 602 (57.8%) | $54,286 |
| Renter-Occupied | 439 (42.2%) | $29,917 |
| Average | 1,041 (100.0%) | $39,263 |
Occupancy by Householder Income Bracket in Wilburton
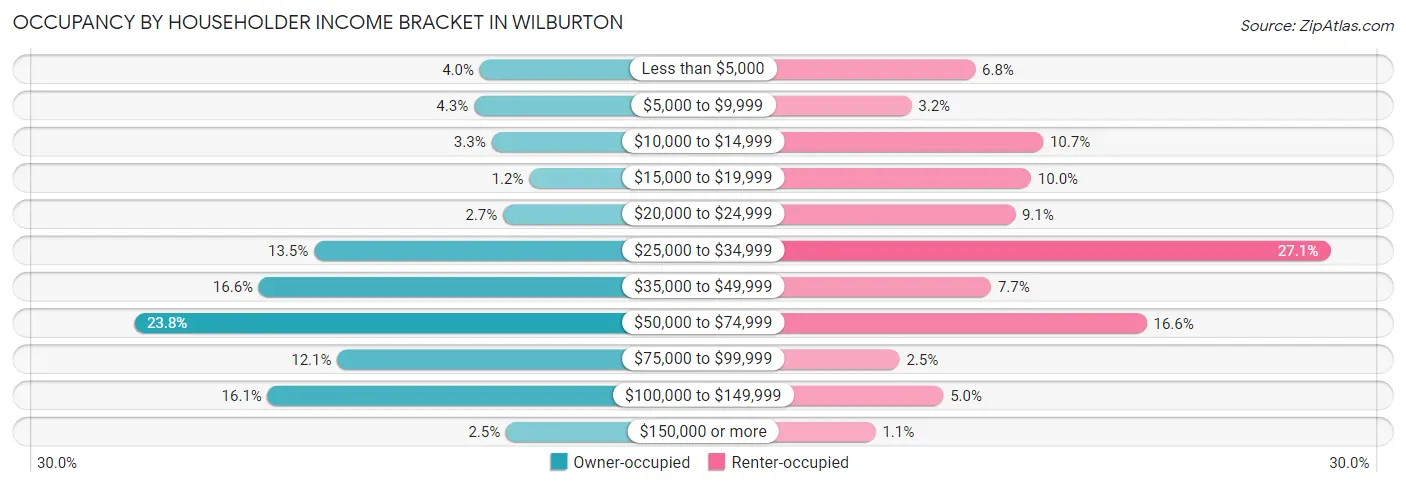
| Income Bracket | Owner-occupied | Renter-occupied |
| Less than $5,000 | 24 (4.0%) | 30 (6.8%) |
| $5,000 to $9,999 | 26 (4.3%) | 14 (3.2%) |
| $10,000 to $14,999 | 20 (3.3%) | 47 (10.7%) |
| $15,000 to $19,999 | 7 (1.2%) | 44 (10.0%) |
| $20,000 to $24,999 | 16 (2.7%) | 40 (9.1%) |
| $25,000 to $34,999 | 81 (13.5%) | 119 (27.1%) |
| $35,000 to $49,999 | 100 (16.6%) | 34 (7.7%) |
| $50,000 to $74,999 | 143 (23.7%) | 73 (16.6%) |
| $75,000 to $99,999 | 73 (12.1%) | 11 (2.5%) |
| $100,000 to $149,999 | 97 (16.1%) | 22 (5.0%) |
| $150,000 or more | 15 (2.5%) | 5 (1.1%) |
| Total | 602 (100.0%) | 439 (100.0%) |
Monthly Housing Cost Tiers in Wilburton
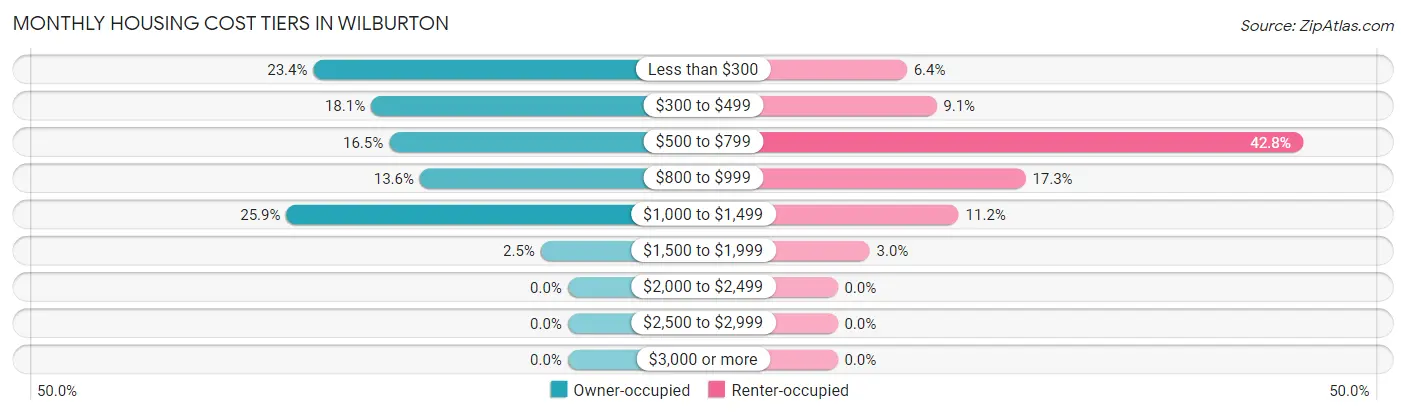
| Monthly Cost | Owner-occupied | Renter-occupied |
| Less than $300 | 141 (23.4%) | 28 (6.4%) |
| $300 to $499 | 109 (18.1%) | 40 (9.1%) |
| $500 to $799 | 99 (16.5%) | 188 (42.8%) |
| $800 to $999 | 82 (13.6%) | 76 (17.3%) |
| $1,000 to $1,499 | 156 (25.9%) | 49 (11.2%) |
| $1,500 to $1,999 | 15 (2.5%) | 13 (3.0%) |
| $2,000 to $2,499 | 0 (0.0%) | 0 (0.0%) |
| $2,500 to $2,999 | 0 (0.0%) | 0 (0.0%) |
| $3,000 or more | 0 (0.0%) | 0 (0.0%) |
| Total | 602 (100.0%) | 439 (100.0%) |
Physical Housing Characteristics in Wilburton
Housing Structures in Wilburton
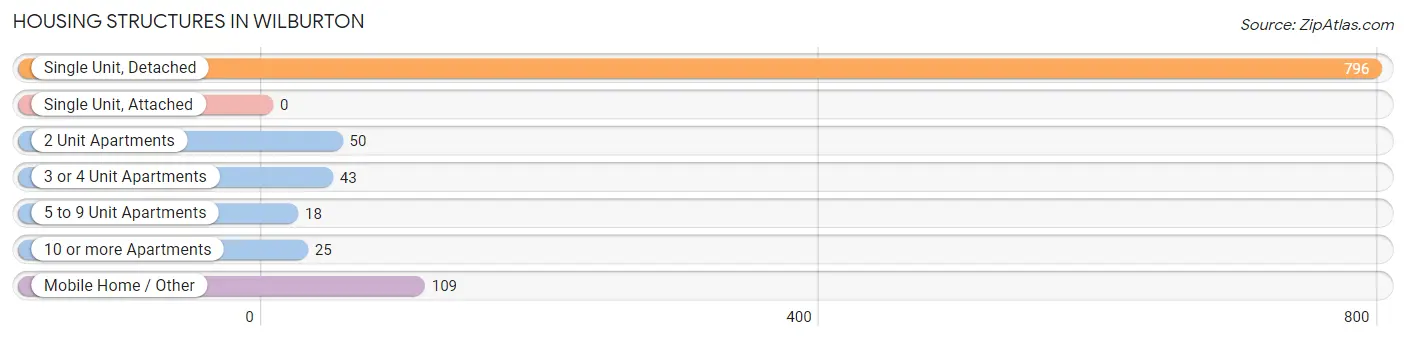
| Structure Type | # Housing Units | % Housing Units |
| Single Unit, Detached | 796 | 76.5% |
| Single Unit, Attached | 0 | 0.0% |
| 2 Unit Apartments | 50 | 4.8% |
| 3 or 4 Unit Apartments | 43 | 4.1% |
| 5 to 9 Unit Apartments | 18 | 1.7% |
| 10 or more Apartments | 25 | 2.4% |
| Mobile Home / Other | 109 | 10.5% |
| Total | 1,041 | 100.0% |
Housing Structures by Occupancy in Wilburton
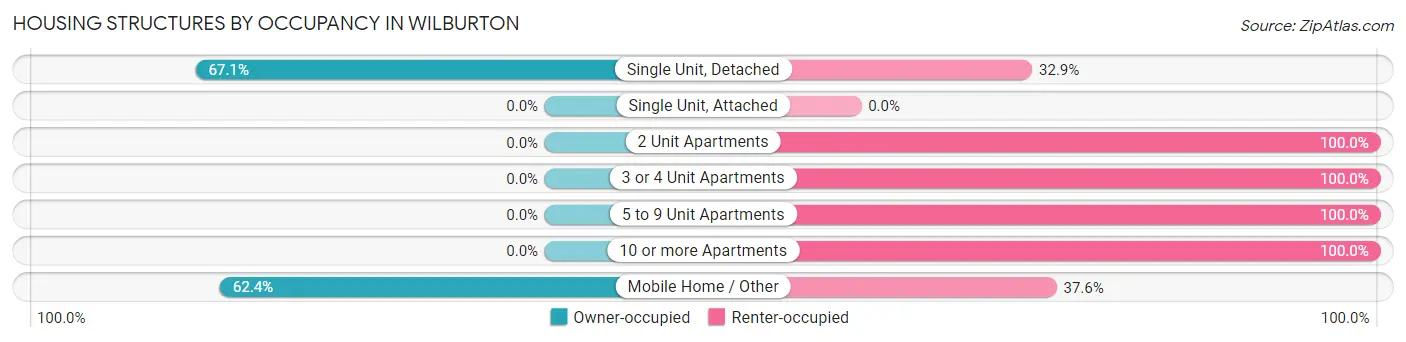
| Structure Type | Owner-occupied | Renter-occupied |
| Single Unit, Detached | 534 (67.1%) | 262 (32.9%) |
| Single Unit, Attached | 0 (0.0%) | 0 (0.0%) |
| 2 Unit Apartments | 0 (0.0%) | 50 (100.0%) |
| 3 or 4 Unit Apartments | 0 (0.0%) | 43 (100.0%) |
| 5 to 9 Unit Apartments | 0 (0.0%) | 18 (100.0%) |
| 10 or more Apartments | 0 (0.0%) | 25 (100.0%) |
| Mobile Home / Other | 68 (62.4%) | 41 (37.6%) |
| Total | 602 (57.8%) | 439 (42.2%) |
Housing Structures by Number of Rooms in Wilburton
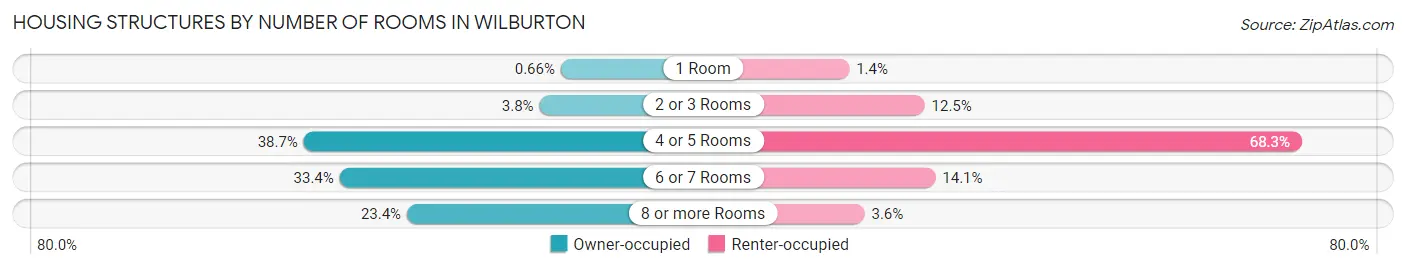
| Number of Rooms | Owner-occupied | Renter-occupied |
| 1 Room | 4 (0.7%) | 6 (1.4%) |
| 2 or 3 Rooms | 23 (3.8%) | 55 (12.5%) |
| 4 or 5 Rooms | 233 (38.7%) | 300 (68.3%) |
| 6 or 7 Rooms | 201 (33.4%) | 62 (14.1%) |
| 8 or more Rooms | 141 (23.4%) | 16 (3.6%) |
| Total | 602 (100.0%) | 439 (100.0%) |
Housing Structure by Heating Type in Wilburton
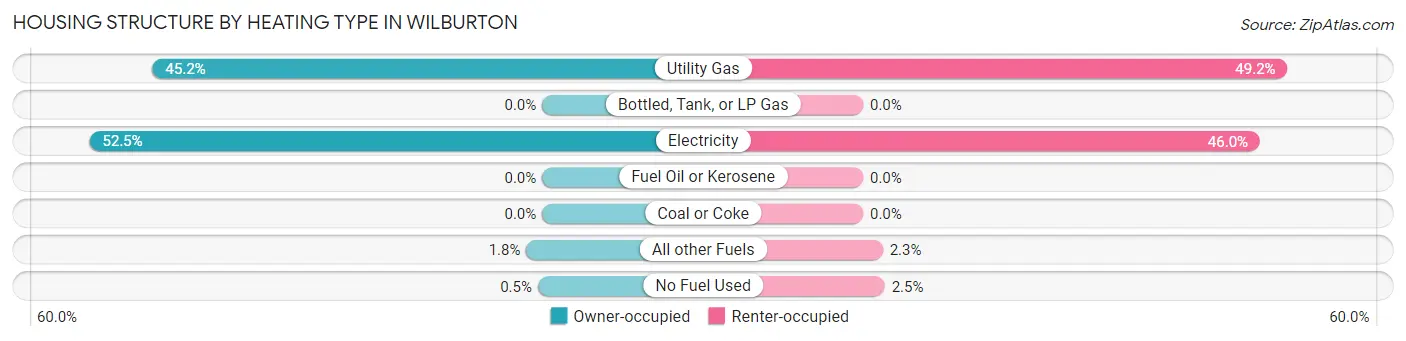
| Heating Type | Owner-occupied | Renter-occupied |
| Utility Gas | 272 (45.2%) | 216 (49.2%) |
| Bottled, Tank, or LP Gas | 0 (0.0%) | 0 (0.0%) |
| Electricity | 316 (52.5%) | 202 (46.0%) |
| Fuel Oil or Kerosene | 0 (0.0%) | 0 (0.0%) |
| Coal or Coke | 0 (0.0%) | 0 (0.0%) |
| All other Fuels | 11 (1.8%) | 10 (2.3%) |
| No Fuel Used | 3 (0.5%) | 11 (2.5%) |
| Total | 602 (100.0%) | 439 (100.0%) |
Household Vehicle Usage in Wilburton

| Vehicles per Household | Owner-occupied | Renter-occupied |
| No Vehicle | 6 (1.0%) | 51 (11.6%) |
| 1 Vehicle | 204 (33.9%) | 177 (40.3%) |
| 2 Vehicles | 184 (30.6%) | 177 (40.3%) |
| 3 or more Vehicles | 208 (34.5%) | 34 (7.7%) |
| Total | 602 (100.0%) | 439 (100.0%) |
Real Estate & Mortgages in Wilburton
Real Estate and Mortgage Overview in Wilburton
| Characteristic | Without Mortgage | With Mortgage |
| Housing Units | 289 | 313 |
| Median Property Value | $70,500 | $118,900 |
| Median Household Income | $36,250 | $4 |
| Monthly Housing Costs | $305 | $0 |
| Real Estate Taxes | $386 | $15 |
Property Value by Mortgage Status in Wilburton
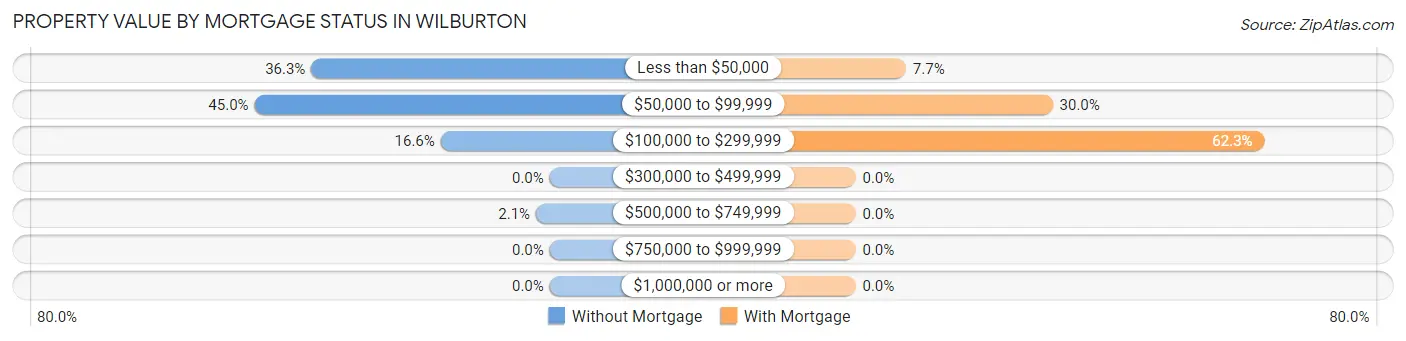
| Property Value | Without Mortgage | With Mortgage |
| Less than $50,000 | 105 (36.3%) | 24 (7.7%) |
| $50,000 to $99,999 | 130 (45.0%) | 94 (30.0%) |
| $100,000 to $299,999 | 48 (16.6%) | 195 (62.3%) |
| $300,000 to $499,999 | 0 (0.0%) | 0 (0.0%) |
| $500,000 to $749,999 | 6 (2.1%) | 0 (0.0%) |
| $750,000 to $999,999 | 0 (0.0%) | 0 (0.0%) |
| $1,000,000 or more | 0 (0.0%) | 0 (0.0%) |
| Total | 289 (100.0%) | 313 (100.0%) |
Household Income by Mortgage Status in Wilburton
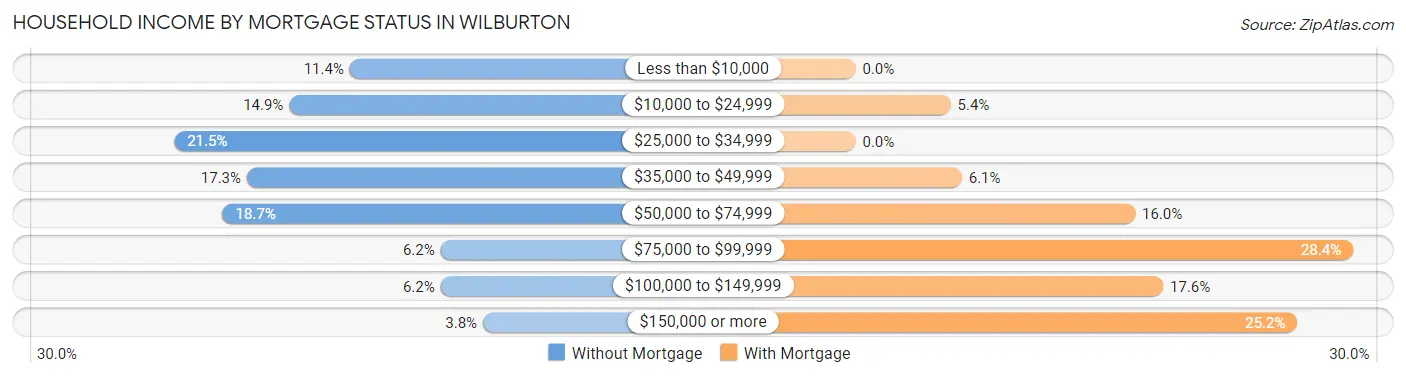
| Household Income | Without Mortgage | With Mortgage |
| Less than $10,000 | 33 (11.4%) | 0 (0.0%) |
| $10,000 to $24,999 | 43 (14.9%) | 17 (5.4%) |
| $25,000 to $34,999 | 62 (21.4%) | 0 (0.0%) |
| $35,000 to $49,999 | 50 (17.3%) | 19 (6.1%) |
| $50,000 to $74,999 | 54 (18.7%) | 50 (16.0%) |
| $75,000 to $99,999 | 18 (6.2%) | 89 (28.4%) |
| $100,000 to $149,999 | 18 (6.2%) | 55 (17.6%) |
| $150,000 or more | 11 (3.8%) | 79 (25.2%) |
| Total | 289 (100.0%) | 313 (100.0%) |
Property Value to Household Income Ratio in Wilburton
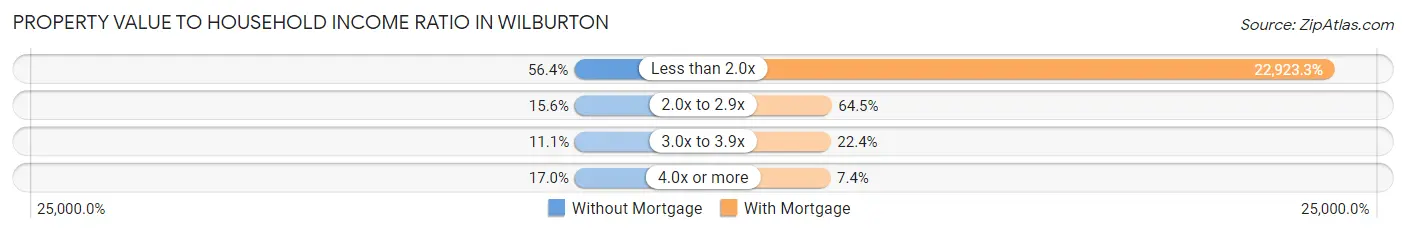
| Value-to-Income Ratio | Without Mortgage | With Mortgage |
| Less than 2.0x | 163 (56.4%) | 71,750 (22,923.3%) |
| 2.0x to 2.9x | 45 (15.6%) | 202 (64.5%) |
| 3.0x to 3.9x | 32 (11.1%) | 70 (22.4%) |
| 4.0x or more | 49 (17.0%) | 23 (7.3%) |
| Total | 289 (100.0%) | 313 (100.0%) |
Real Estate Taxes by Mortgage Status in Wilburton
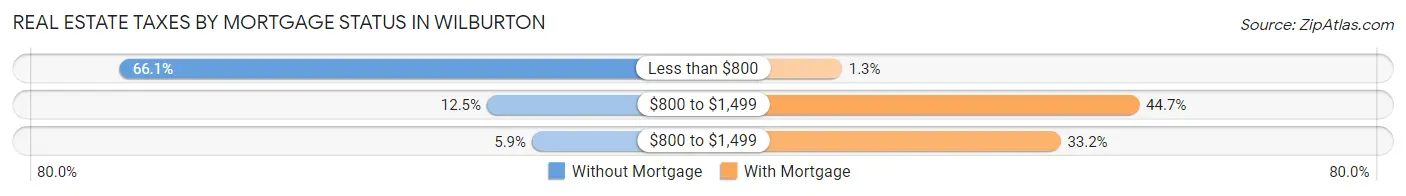
| Property Taxes | Without Mortgage | With Mortgage |
| Less than $800 | 191 (66.1%) | 4 (1.3%) |
| $800 to $1,499 | 36 (12.5%) | 140 (44.7%) |
| $800 to $1,499 | 17 (5.9%) | 104 (33.2%) |
| Total | 289 (100.0%) | 313 (100.0%) |
Health & Disability in Wilburton
Health Insurance Coverage by Age in Wilburton
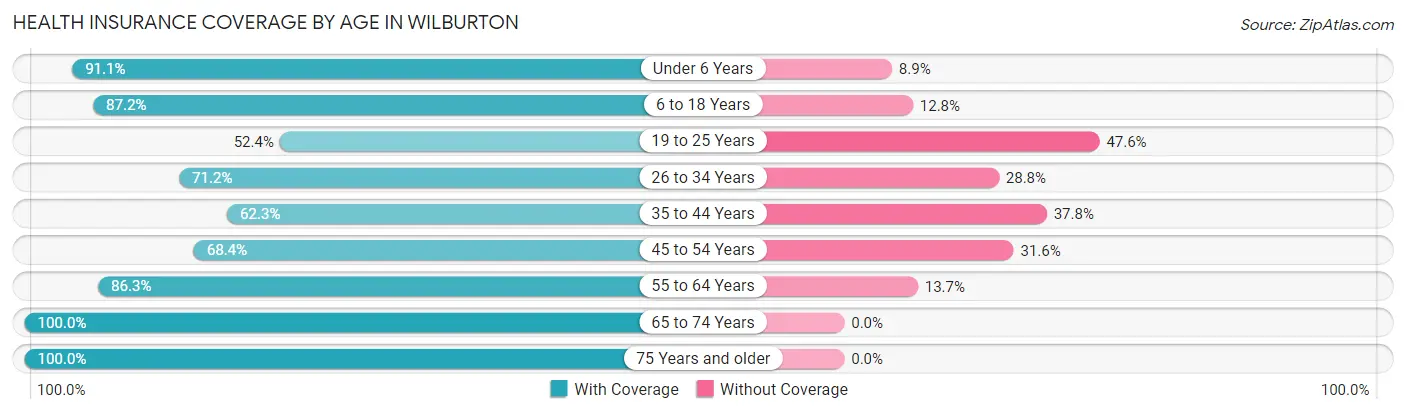
| Age Bracket | With Coverage | Without Coverage |
| Under 6 Years | 195 (91.1%) | 19 (8.9%) |
| 6 to 18 Years | 518 (87.2%) | 76 (12.8%) |
| 19 to 25 Years | 217 (52.4%) | 197 (47.6%) |
| 26 to 34 Years | 247 (71.2%) | 100 (28.8%) |
| 35 to 44 Years | 188 (62.3%) | 114 (37.8%) |
| 45 to 54 Years | 167 (68.4%) | 77 (31.6%) |
| 55 to 64 Years | 277 (86.3%) | 44 (13.7%) |
| 65 to 74 Years | 175 (100.0%) | 0 (0.0%) |
| 75 Years and older | 127 (100.0%) | 0 (0.0%) |
| Total | 2,111 (77.1%) | 627 (22.9%) |
Health Insurance Coverage by Citizenship Status in Wilburton
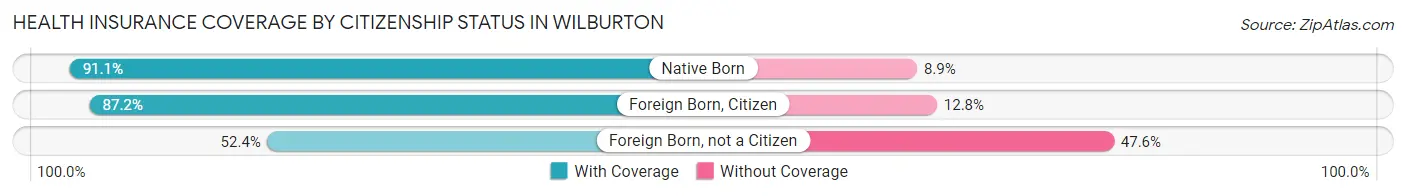
| Citizenship Status | With Coverage | Without Coverage |
| Native Born | 195 (91.1%) | 19 (8.9%) |
| Foreign Born, Citizen | 518 (87.2%) | 76 (12.8%) |
| Foreign Born, not a Citizen | 217 (52.4%) | 197 (47.6%) |
Health Insurance Coverage by Household Income in Wilburton
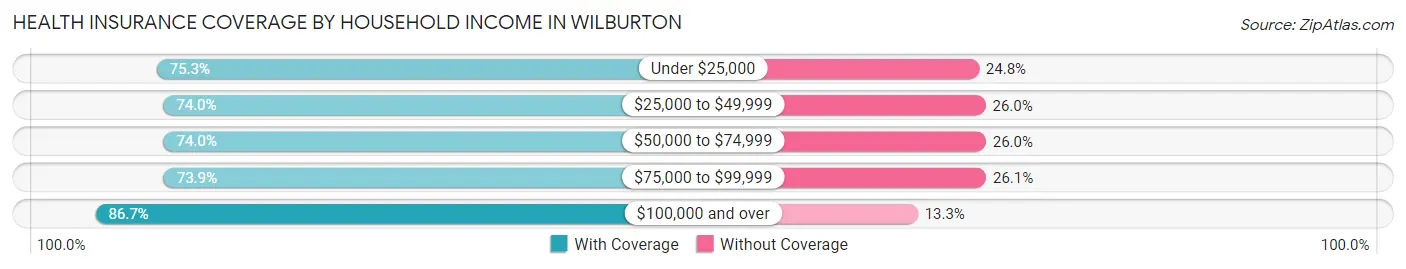
| Household Income | With Coverage | Without Coverage |
| Under $25,000 | 371 (75.2%) | 122 (24.7%) |
| $25,000 to $49,999 | 609 (74.0%) | 214 (26.0%) |
| $50,000 to $74,999 | 500 (74.0%) | 176 (26.0%) |
| $75,000 to $99,999 | 170 (73.9%) | 60 (26.1%) |
| $100,000 and over | 333 (86.7%) | 51 (13.3%) |
Public vs Private Health Insurance Coverage by Age in Wilburton
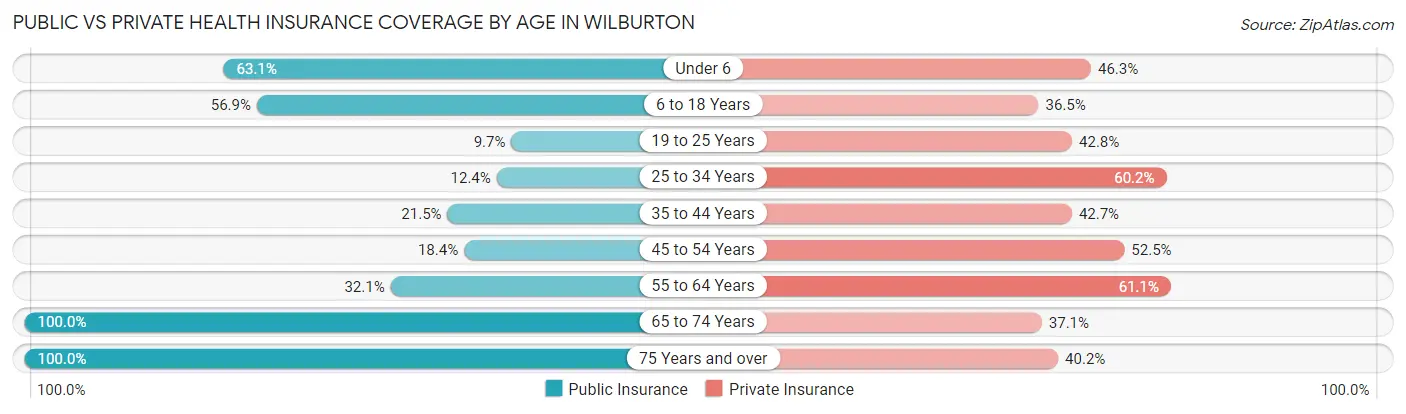
| Age Bracket | Public Insurance | Private Insurance |
| Under 6 | 135 (63.1%) | 99 (46.3%) |
| 6 to 18 Years | 338 (56.9%) | 217 (36.5%) |
| 19 to 25 Years | 40 (9.7%) | 177 (42.7%) |
| 25 to 34 Years | 43 (12.4%) | 209 (60.2%) |
| 35 to 44 Years | 65 (21.5%) | 129 (42.7%) |
| 45 to 54 Years | 45 (18.4%) | 128 (52.5%) |
| 55 to 64 Years | 103 (32.1%) | 196 (61.1%) |
| 65 to 74 Years | 175 (100.0%) | 65 (37.1%) |
| 75 Years and over | 127 (100.0%) | 51 (40.2%) |
| Total | 1,071 (39.1%) | 1,271 (46.4%) |
Disability Status by Sex by Age in Wilburton
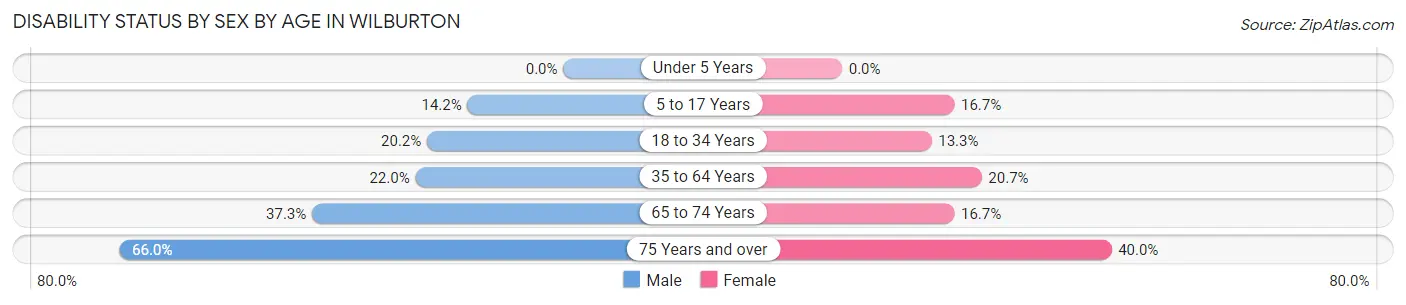
| Age Bracket | Male | Female |
| Under 5 Years | 0 (0.0%) | 0 (0.0%) |
| 5 to 17 Years | 40 (14.2%) | 38 (16.7%) |
| 18 to 34 Years | 87 (20.2%) | 57 (13.3%) |
| 35 to 64 Years | 94 (22.0%) | 91 (20.7%) |
| 65 to 74 Years | 25 (37.3%) | 18 (16.7%) |
| 75 Years and over | 31 (66.0%) | 32 (40.0%) |
Disability Class by Sex by Age in Wilburton
Disability Class: Hearing Difficulty
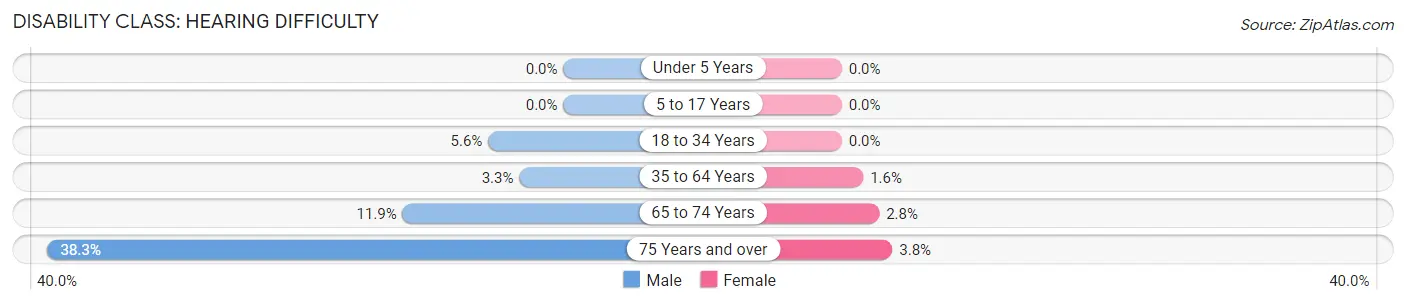
| Age Bracket | Male | Female |
| Under 5 Years | 0 (0.0%) | 0 (0.0%) |
| 5 to 17 Years | 0 (0.0%) | 0 (0.0%) |
| 18 to 34 Years | 24 (5.6%) | 0 (0.0%) |
| 35 to 64 Years | 14 (3.3%) | 7 (1.6%) |
| 65 to 74 Years | 8 (11.9%) | 3 (2.8%) |
| 75 Years and over | 18 (38.3%) | 3 (3.7%) |
Disability Class: Vision Difficulty
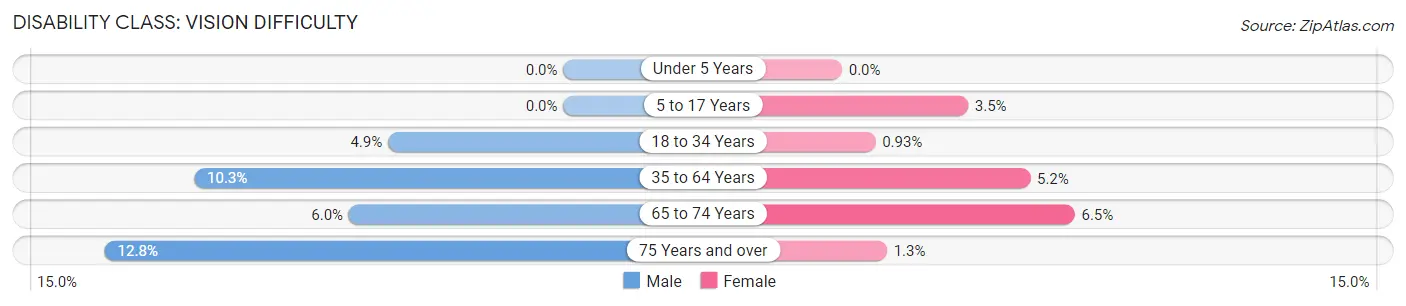
| Age Bracket | Male | Female |
| Under 5 Years | 0 (0.0%) | 0 (0.0%) |
| 5 to 17 Years | 0 (0.0%) | 8 (3.5%) |
| 18 to 34 Years | 21 (4.9%) | 4 (0.9%) |
| 35 to 64 Years | 44 (10.3%) | 23 (5.2%) |
| 65 to 74 Years | 4 (6.0%) | 7 (6.5%) |
| 75 Years and over | 6 (12.8%) | 1 (1.3%) |
Disability Class: Cognitive Difficulty
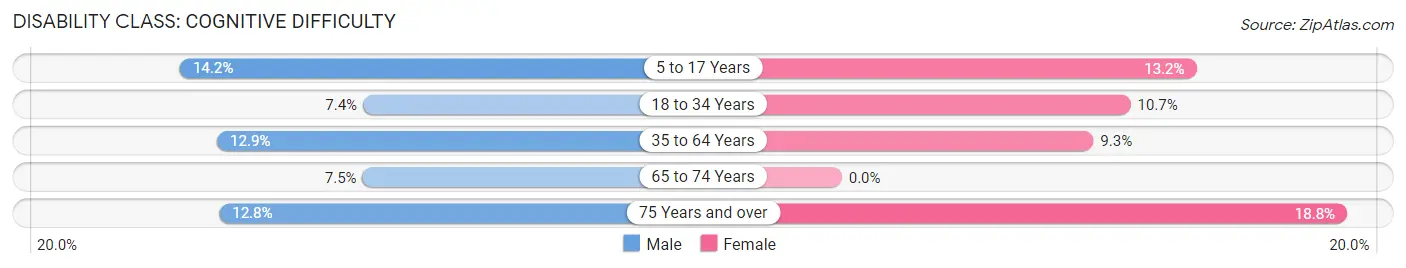
| Age Bracket | Male | Female |
| 5 to 17 Years | 40 (14.2%) | 30 (13.2%) |
| 18 to 34 Years | 32 (7.4%) | 46 (10.7%) |
| 35 to 64 Years | 55 (12.9%) | 41 (9.3%) |
| 65 to 74 Years | 5 (7.5%) | 0 (0.0%) |
| 75 Years and over | 6 (12.8%) | 15 (18.8%) |
Disability Class: Ambulatory Difficulty
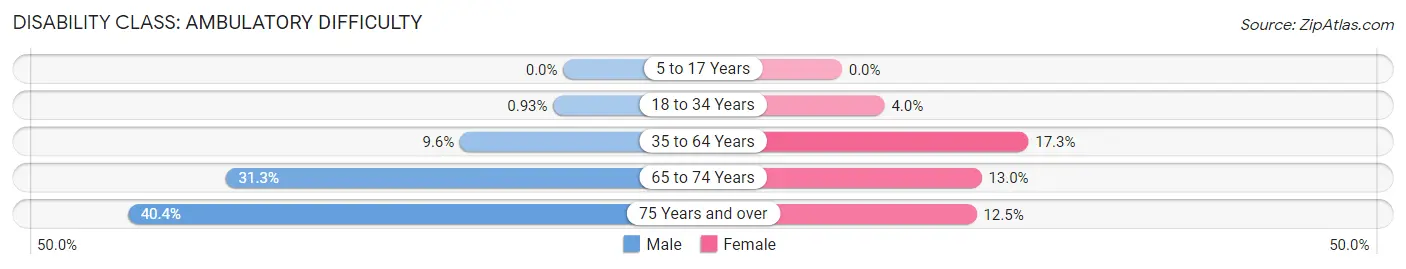
| Age Bracket | Male | Female |
| 5 to 17 Years | 0 (0.0%) | 0 (0.0%) |
| 18 to 34 Years | 4 (0.9%) | 17 (4.0%) |
| 35 to 64 Years | 41 (9.6%) | 76 (17.3%) |
| 65 to 74 Years | 21 (31.3%) | 14 (13.0%) |
| 75 Years and over | 19 (40.4%) | 10 (12.5%) |
Disability Class: Self-Care Difficulty
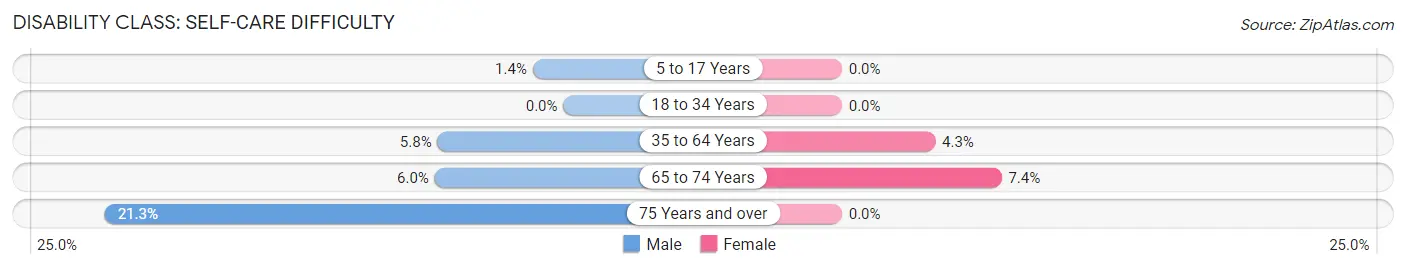
| Age Bracket | Male | Female |
| 5 to 17 Years | 4 (1.4%) | 0 (0.0%) |
| 18 to 34 Years | 0 (0.0%) | 0 (0.0%) |
| 35 to 64 Years | 25 (5.8%) | 19 (4.3%) |
| 65 to 74 Years | 4 (6.0%) | 8 (7.4%) |
| 75 Years and over | 10 (21.3%) | 0 (0.0%) |
Technology Access in Wilburton
Computing Device Access in Wilburton
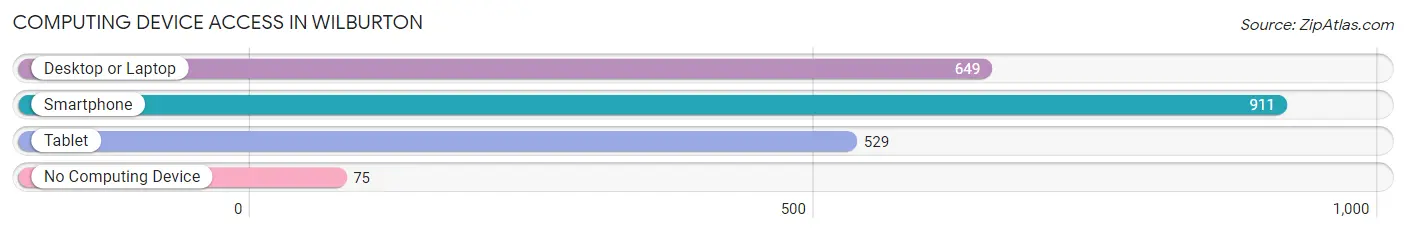
| Device Type | # Households | % Households |
| Desktop or Laptop | 649 | 62.3% |
| Smartphone | 911 | 87.5% |
| Tablet | 529 | 50.8% |
| No Computing Device | 75 | 7.2% |
| Total | 1,041 | 100.0% |
Internet Access in Wilburton
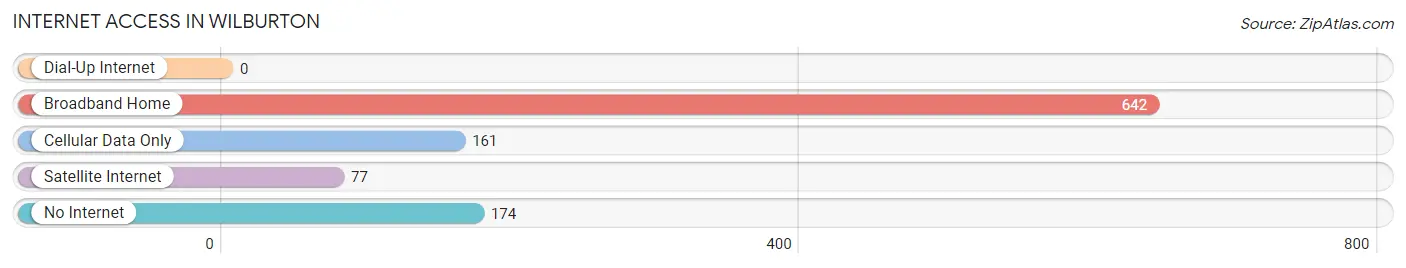
| Internet Type | # Households | % Households |
| Dial-Up Internet | 0 | 0.0% |
| Broadband Home | 642 | 61.7% |
| Cellular Data Only | 161 | 15.5% |
| Satellite Internet | 77 | 7.4% |
| No Internet | 174 | 16.7% |
| Total | 1,041 | 100.0% |
Wilburton Summary
Wilburton is a city located in Latimer County, Oklahoma. It is the county seat of Latimer County and is situated in the southeastern part of the state. The city is located in the foothills of the Ouachita Mountains and is home to Eastern Oklahoma State College. As of the 2010 census, the population of Wilburton was 3,543.
History
The area that is now Wilburton was originally inhabited by the Choctaw Indians. The first white settlers arrived in the area in the late 1800s. The town was named after Wilburton, Pennsylvania, the hometown of one of the first settlers. The town was officially incorporated in 1901.
In the early 1900s, Wilburton was a thriving coal mining town. The coal industry was the main source of employment for the town’s residents. The coal mines were owned by the Wilburton Coal Company, which was founded in 1902. The company operated several mines in the area, including the Wilburton Mine, which was the largest coal mine in the state.
The coal industry began to decline in the 1920s, and by the 1930s, the Wilburton Coal Company had closed all of its mines. The town’s economy shifted to agriculture and timber production. The timber industry was especially important to the town’s economy, and the town was home to several sawmills.
In the 1950s, the town began to experience a resurgence in the coal industry. The Wilburton Coal Company reopened several of its mines, and the town’s population began to grow. The town was also home to several other industries, including a brick plant and a furniture factory.
Geography
Wilburton is located in southeastern Oklahoma, in the foothills of the Ouachita Mountains. The city is situated at the intersection of U.S. Highway 270 and State Highway 2. The city is located approximately 75 miles southeast of Tulsa and 90 miles northeast of Oklahoma City.
The city has a total area of 4.2 square miles, all of which is land. The city is located in a hilly area, and the elevation is 890 feet above sea level. The city is located in a humid subtropical climate zone, and the average annual temperature is 63 degrees Fahrenheit.
Economy
The economy of Wilburton is largely based on agriculture and timber production. The city is home to several sawmills, and the timber industry is an important part of the local economy. The city is also home to several manufacturing companies, including a furniture factory and a brick plant.
The city is also home to Eastern Oklahoma State College, which is a two-year college that offers associate’s degrees in a variety of fields. The college is an important part of the local economy, and it provides jobs for many of the city’s residents.
Demographics
As of the 2010 census, the population of Wilburton was 3,543. The population is spread out with 49.3% male and 50.7% female. The median age of the population is 38.7 years.
The racial makeup of the city is 87.2% White, 8.2% Native American, 0.7% Asian, 0.3% African American, and 3.6% from other races. The median household income is $30,938, and the median family income is $37,917. The per capita income is $17,845.
Common Questions
What is Per Capita Income in Wilburton?
Per Capita income in Wilburton is $20,123.
What is the Median Family Income in Wilburton?
Median Family Income in Wilburton is $54,052.
What is the Median Household income in Wilburton?
Median Household Income in Wilburton is $39,263.
What is Income or Wage Gap in Wilburton?
Income or Wage Gap in Wilburton is 27.5%.
Women in Wilburton earn 72.5 cents for every dollar earned by a man.
What is Family Income Deficit in Wilburton?
Family Income Deficit in Wilburton is $10,811.
Families that are below poverty line in Wilburton earn $10,811 less on average than the poverty threshold level.
What is Inequality or Gini Index in Wilburton?
Inequality or Gini Index in Wilburton is 0.43.
What is the Total Population of Wilburton?
Total Population of Wilburton is 2,828.
What is the Total Male Population of Wilburton?
Total Male Population of Wilburton is 1,412.
What is the Total Female Population of Wilburton?
Total Female Population of Wilburton is 1,416.
What is the Ratio of Males per 100 Females in Wilburton?
There are 99.72 Males per 100 Females in Wilburton.
What is the Ratio of Females per 100 Males in Wilburton?
There are 100.28 Females per 100 Males in Wilburton.
What is the Median Population Age in Wilburton?
Median Population Age in Wilburton is 30.9 Years.
What is the Average Family Size in Wilburton
Average Family Size in Wilburton is 3.1 People.
What is the Average Household Size in Wilburton
Average Household Size in Wilburton is 2.5 People.
How Large is the Labor Force in Wilburton?
There are 1,205 People in the Labor Forcein in Wilburton.
What is the Percentage of People in the Labor Force in Wilburton?
55.6% of People are in the Labor Force in Wilburton.
What is the Unemployment Rate in Wilburton?
Unemployment Rate in Wilburton is 9.9%.