Buffalo, OK Map & Demographics
Buffalo Map
Buffalo Overview
$24,540
PER CAPITA INCOME
$84,667
AVG FAMILY INCOME
$67,500
AVG HOUSEHOLD INCOME
30.4%
WAGE / INCOME GAP [ % ]
69.6¢/ $1
WAGE / INCOME GAP [ $ ]
0.33
INEQUALITY / GINI INDEX
1,273
TOTAL POPULATION
575
MALE POPULATION
698
FEMALE POPULATION
82.38
MALES / 100 FEMALES
121.39
FEMALES / 100 MALES
39.4
MEDIAN AGE
3.2
AVG FAMILY SIZE
2.9
AVG HOUSEHOLD SIZE
541
LABOR FORCE [ PEOPLE ]
56.9%
PERCENT IN LABOR FORCE
2.8%
UNEMPLOYMENT RATE
Buffalo Zip Codes
Buffalo Area Codes
Income in Buffalo
Income Overview in Buffalo
Per Capita Income in Buffalo is $24,540, while median incomes of families and households are $84,667 and $67,500 respectively.
| Characteristic | Number | Measure |
| Per Capita Income | 1,273 | $24,540 |
| Median Family Income | 298 | $84,667 |
| Mean Family Income | 298 | $87,745 |
| Median Household Income | 414 | $67,500 |
| Mean Household Income | 414 | $72,532 |
| Income Deficit | 298 | $0 |
| Wage / Income Gap (%) | 1,273 | 30.43% |
| Wage / Income Gap ($) | 1,273 | 69.57¢ per $1 |
| Gini / Inequality Index | 1,273 | 0.33 |
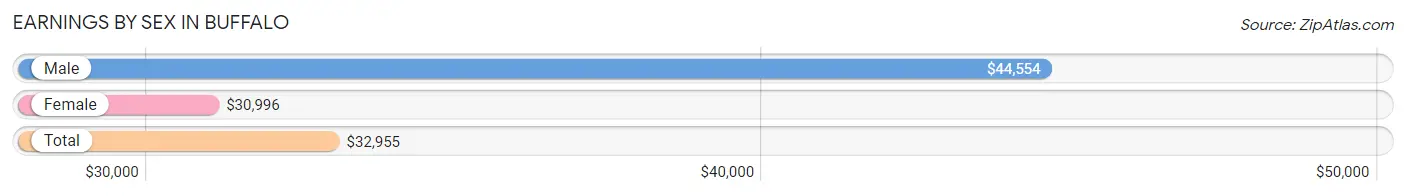
Earnings by Sex in Buffalo
Average Earnings in Buffalo are $32,955, $44,554 for men and $30,996 for women, a difference of 30.4%.
| Sex | Number | Average Earnings |
| Male | 321 (53.3%) | $44,554 |
| Female | 281 (46.7%) | $30,996 |
| Total | 602 (100.0%) | $32,955 |
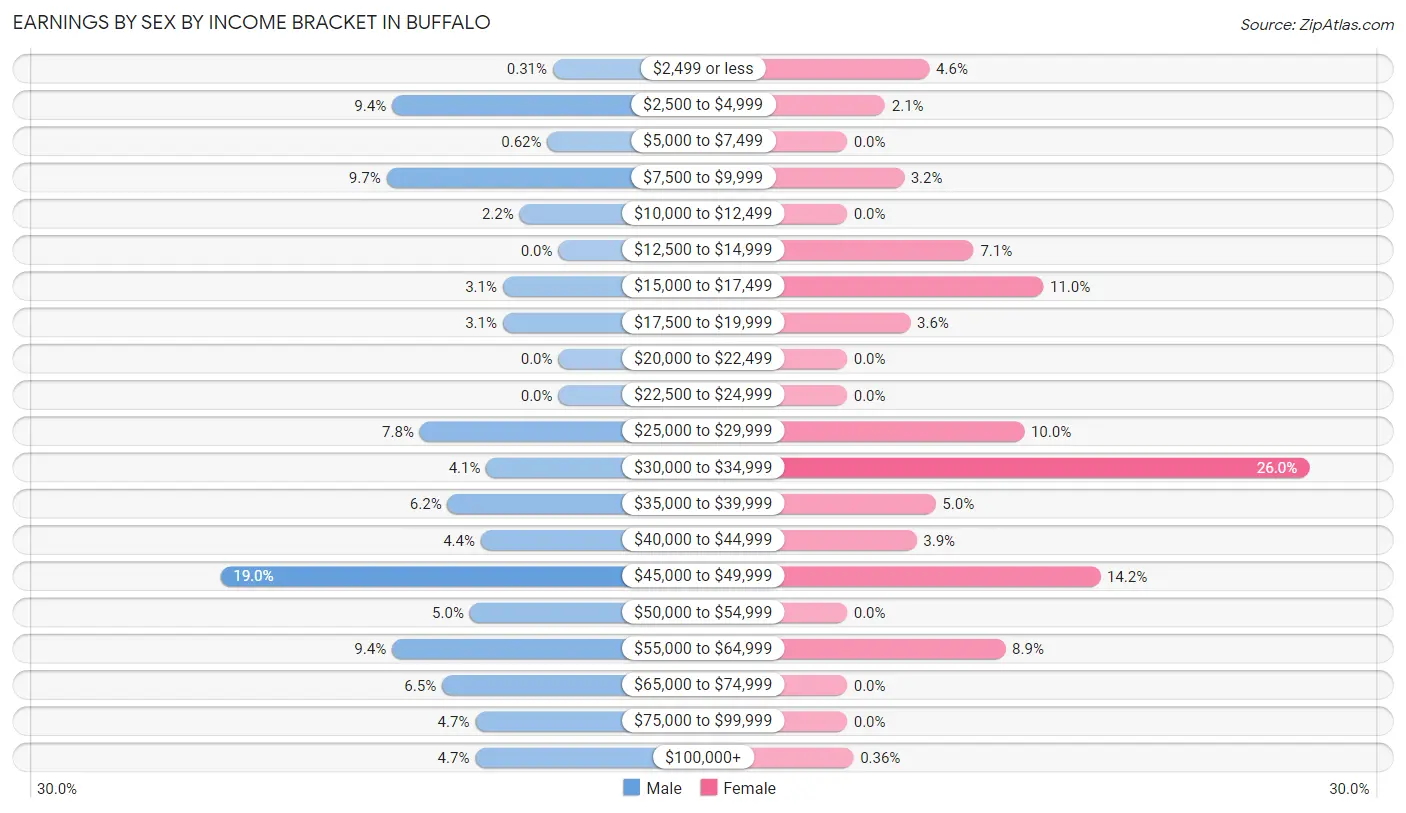
Earnings by Sex by Income Bracket in Buffalo
The most common earnings brackets in Buffalo are $45,000 to $49,999 for men (61 | 19.0%) and $30,000 to $34,999 for women (73 | 26.0%).
| Income | Male | Female |
| $2,499 or less | 1 (0.3%) | 13 (4.6%) |
| $2,500 to $4,999 | 30 (9.3%) | 6 (2.1%) |
| $5,000 to $7,499 | 2 (0.6%) | 0 (0.0%) |
| $7,500 to $9,999 | 31 (9.7%) | 9 (3.2%) |
| $10,000 to $12,499 | 7 (2.2%) | 0 (0.0%) |
| $12,500 to $14,999 | 0 (0.0%) | 20 (7.1%) |
| $15,000 to $17,499 | 10 (3.1%) | 31 (11.0%) |
| $17,500 to $19,999 | 10 (3.1%) | 10 (3.6%) |
| $20,000 to $22,499 | 0 (0.0%) | 0 (0.0%) |
| $22,500 to $24,999 | 0 (0.0%) | 0 (0.0%) |
| $25,000 to $29,999 | 25 (7.8%) | 28 (10.0%) |
| $30,000 to $34,999 | 13 (4.1%) | 73 (26.0%) |
| $35,000 to $39,999 | 20 (6.2%) | 14 (5.0%) |
| $40,000 to $44,999 | 14 (4.4%) | 11 (3.9%) |
| $45,000 to $49,999 | 61 (19.0%) | 40 (14.2%) |
| $50,000 to $54,999 | 16 (5.0%) | 0 (0.0%) |
| $55,000 to $64,999 | 30 (9.3%) | 25 (8.9%) |
| $65,000 to $74,999 | 21 (6.5%) | 0 (0.0%) |
| $75,000 to $99,999 | 15 (4.7%) | 0 (0.0%) |
| $100,000+ | 15 (4.7%) | 1 (0.4%) |
| Total | 321 (100.0%) | 281 (100.0%) |
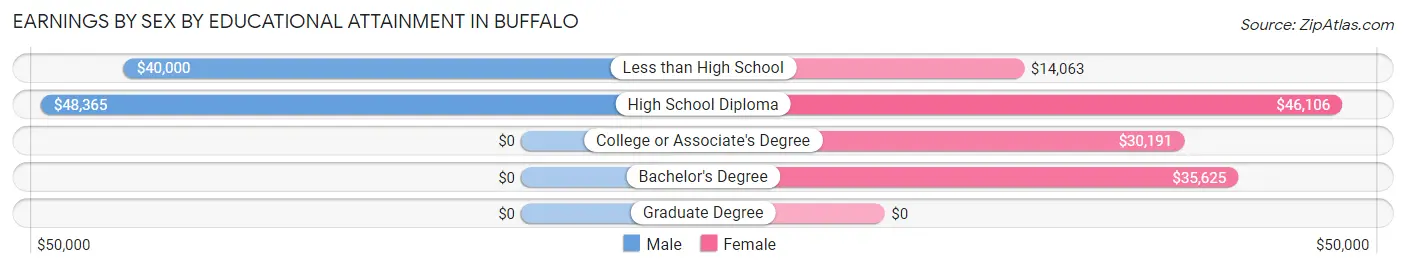
Earnings by Sex by Educational Attainment in Buffalo
Average earnings in Buffalo are $44,554 for men and $31,377 for women, a difference of 29.6%. Men with an educational attainment of high school diploma enjoy the highest average annual earnings of $48,365, while those with less than high school education earn the least with $40,000. Women with an educational attainment of high school diploma earn the most with the average annual earnings of $46,106, while those with less than high school education have the smallest earnings of $14,063.
| Educational Attainment | Male Income | Female Income |
| Less than High School | $40,000 | $14,063 |
| High School Diploma | $48,365 | $46,106 |
| College or Associate's Degree | - | - |
| Bachelor's Degree | - | - |
| Graduate Degree | - | - |
| Total | $44,554 | $31,377 |
Family Income in Buffalo
Family Income Brackets in Buffalo
According to the Buffalo family income data, there are 100 families falling into the $75,000 to $99,999 income range, which is the most common income bracket and makes up 33.6% of all families.
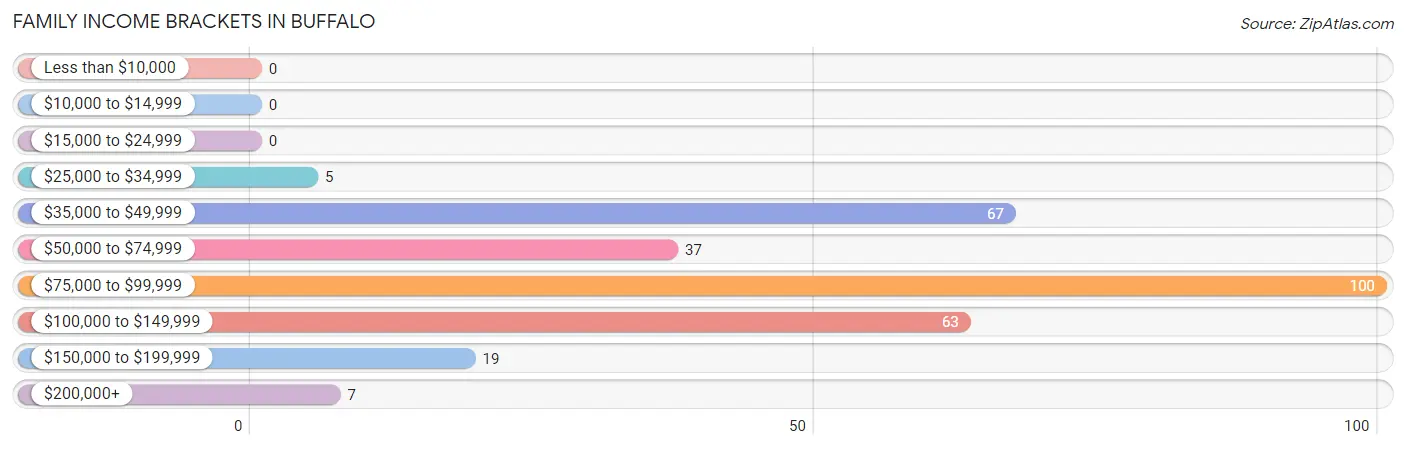
| Income Bracket | # Families | % Families |
| Less than $10,000 | 0 | 0.0% |
| $10,000 to $14,999 | 0 | 0.0% |
| $15,000 to $24,999 | 0 | 0.0% |
| $25,000 to $34,999 | 5 | 1.7% |
| $35,000 to $49,999 | 67 | 22.5% |
| $50,000 to $74,999 | 37 | 12.4% |
| $75,000 to $99,999 | 100 | 33.6% |
| $100,000 to $149,999 | 63 | 21.1% |
| $150,000 to $199,999 | 19 | 6.4% |
| $200,000+ | 7 | 2.3% |
Family Income by Famaliy Size in Buffalo
4-person families (48 | 16.1%) account for the highest median family income in Buffalo with $95,962 per family, while 2-person families (118 | 39.6%) have the highest median income of $43,438 per family member.
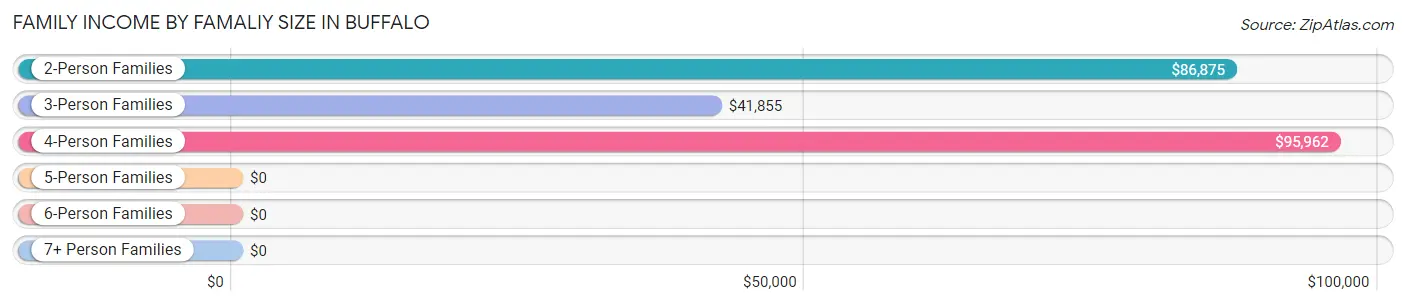
| Income Bracket | # Families | Median Income |
| 2-Person Families | 118 (39.6%) | $86,875 |
| 3-Person Families | 56 (18.8%) | $41,855 |
| 4-Person Families | 48 (16.1%) | $95,962 |
| 5-Person Families | 31 (10.4%) | $0 |
| 6-Person Families | 45 (15.1%) | $0 |
| 7+ Person Families | 0 (0.0%) | $0 |
| Total | 298 (100.0%) | $84,667 |
Family Income by Number of Earners in Buffalo
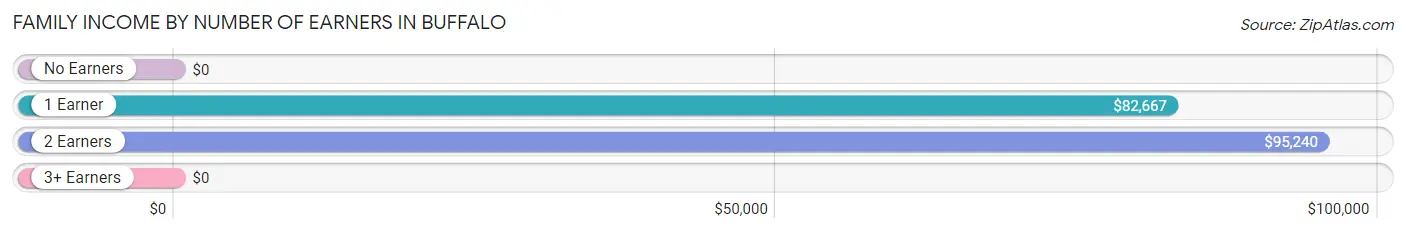
| Number of Earners | # Families | Median Income |
| No Earners | 1 (0.3%) | $0 |
| 1 Earner | 72 (24.2%) | $82,667 |
| 2 Earners | 225 (75.5%) | $95,240 |
| 3+ Earners | 0 (0.0%) | $0 |
| Total | 298 (100.0%) | $84,667 |
Household Income in Buffalo
Household Income Brackets in Buffalo
With 103 households falling in the category, the $35,000 to $49,999 income range is the most frequent in Buffalo, accounting for 24.9% of all households.
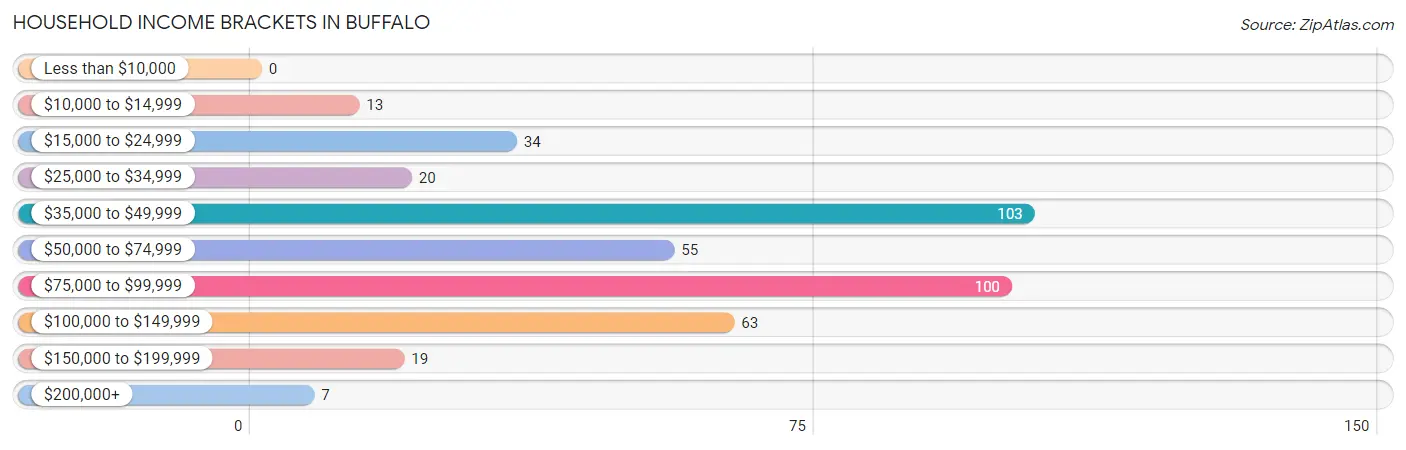
| Income Bracket | # Households | % Households |
| Less than $10,000 | 0 | 0.0% |
| $10,000 to $14,999 | 13 | 3.1% |
| $15,000 to $24,999 | 34 | 8.2% |
| $25,000 to $34,999 | 20 | 4.8% |
| $35,000 to $49,999 | 103 | 24.9% |
| $50,000 to $74,999 | 55 | 13.3% |
| $75,000 to $99,999 | 100 | 24.2% |
| $100,000 to $149,999 | 63 | 15.2% |
| $150,000 to $199,999 | 19 | 4.6% |
| $200,000+ | 7 | 1.7% |
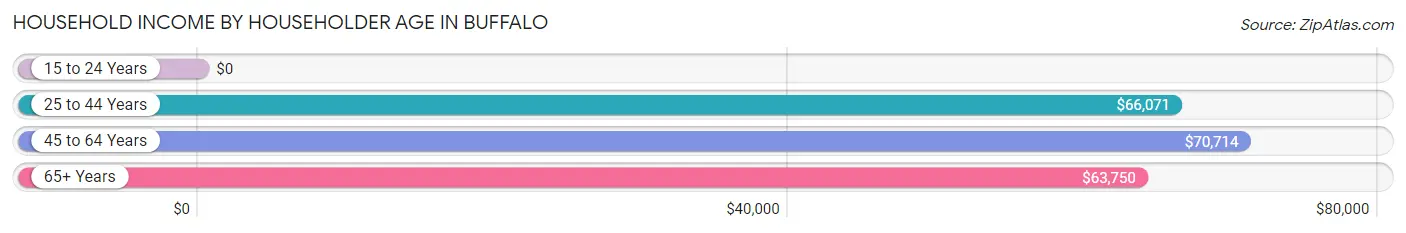
Household Income by Householder Age in Buffalo
The median household income in Buffalo is $67,500, with the highest median household income of $70,714 found in the 45 to 64 years age bracket for the primary householder. A total of 138 households (33.3%) fall into this category. Meanwhile, the 15 to 24 years age bracket for the primary householder has the lowest median household income of $0, with 10 households (2.4%) in this group.
| Income Bracket | # Households | Median Income |
| 15 to 24 Years | 10 (2.4%) | $0 |
| 25 to 44 Years | 146 (35.3%) | $66,071 |
| 45 to 64 Years | 138 (33.3%) | $70,714 |
| 65+ Years | 120 (29.0%) | $63,750 |
| Total | 414 (100.0%) | $67,500 |
Poverty in Buffalo
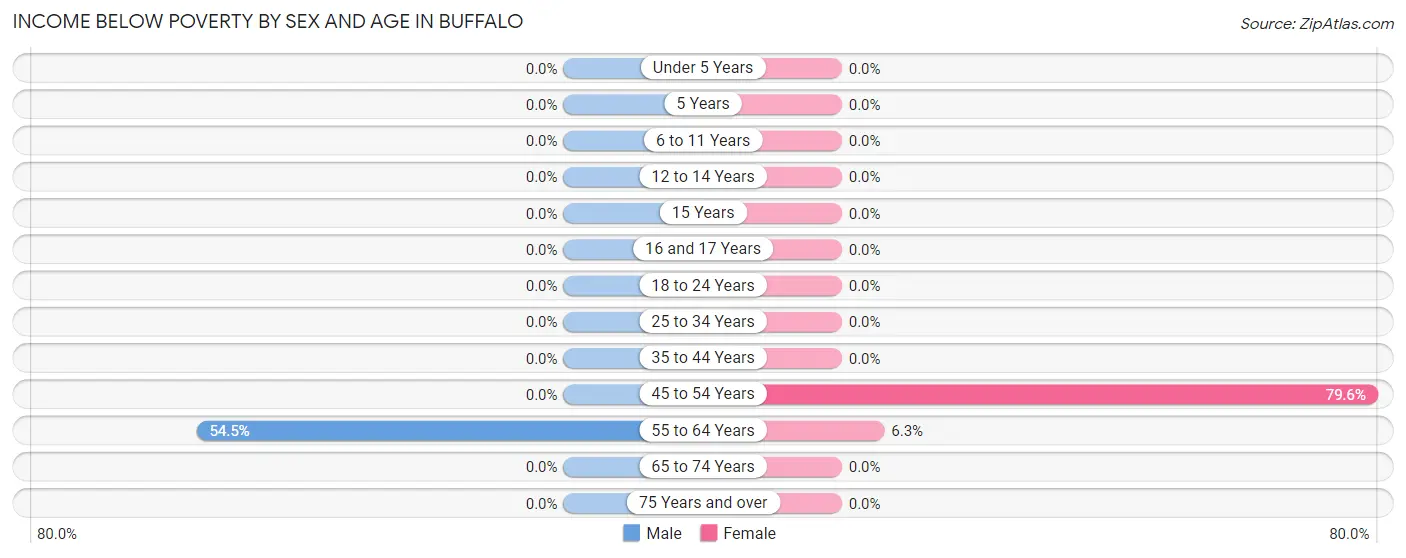
Income Below Poverty by Sex and Age in Buffalo
With 14.5% poverty level for males and 7.0% for females among the residents of Buffalo, 55 to 64 year old males and 45 to 54 year old females are the most vulnerable to poverty, with 73 males (54.5%) and 39 females (79.6%) in their respective age groups living below the poverty level.
| Age Bracket | Male | Female |
| Under 5 Years | 0 (0.0%) | 0 (0.0%) |
| 5 Years | 0 (0.0%) | 0 (0.0%) |
| 6 to 11 Years | 0 (0.0%) | 0 (0.0%) |
| 12 to 14 Years | 0 (0.0%) | 0 (0.0%) |
| 15 Years | 0 (0.0%) | 0 (0.0%) |
| 16 and 17 Years | 0 (0.0%) | 0 (0.0%) |
| 18 to 24 Years | 0 (0.0%) | 0 (0.0%) |
| 25 to 34 Years | 0 (0.0%) | 0 (0.0%) |
| 35 to 44 Years | 0 (0.0%) | 0 (0.0%) |
| 45 to 54 Years | 0 (0.0%) | 39 (79.6%) |
| 55 to 64 Years | 73 (54.5%) | 6 (6.3%) |
| 65 to 74 Years | 0 (0.0%) | 0 (0.0%) |
| 75 Years and over | 0 (0.0%) | 0 (0.0%) |
| Total | 73 (14.5%) | 45 (7.0%) |
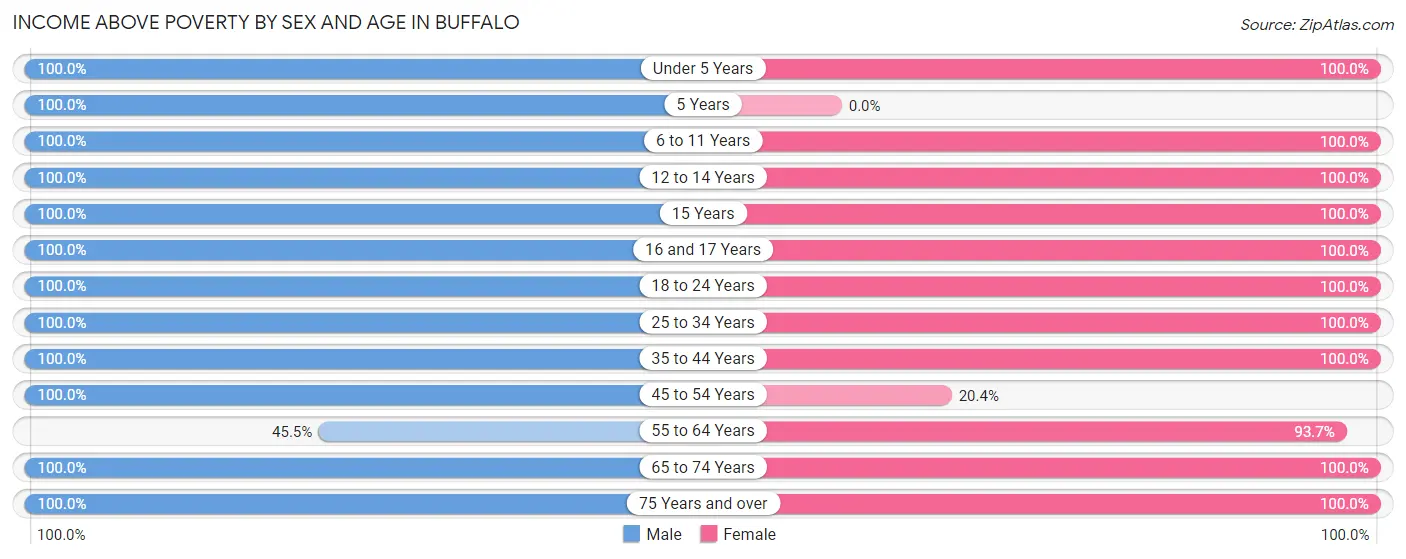
Income Above Poverty by Sex and Age in Buffalo
According to the poverty statistics in Buffalo, males aged under 5 years and females aged under 5 years are the age groups that are most secure financially, with 100.0% of males and 100.0% of females in these age groups living above the poverty line.
| Age Bracket | Male | Female |
| Under 5 Years | 15 (100.0%) | 81 (100.0%) |
| 5 Years | 11 (100.0%) | 0 (0.0%) |
| 6 to 11 Years | 29 (100.0%) | 43 (100.0%) |
| 12 to 14 Years | 18 (100.0%) | 30 (100.0%) |
| 15 Years | 5 (100.0%) | 17 (100.0%) |
| 16 and 17 Years | 11 (100.0%) | 36 (100.0%) |
| 18 to 24 Years | 9 (100.0%) | 10 (100.0%) |
| 25 to 34 Years | 66 (100.0%) | 83 (100.0%) |
| 35 to 44 Years | 99 (100.0%) | 68 (100.0%) |
| 45 to 54 Years | 50 (100.0%) | 10 (20.4%) |
| 55 to 64 Years | 61 (45.5%) | 89 (93.7%) |
| 65 to 74 Years | 33 (100.0%) | 59 (100.0%) |
| 75 Years and over | 22 (100.0%) | 71 (100.0%) |
| Total | 429 (85.5%) | 597 (93.0%) |
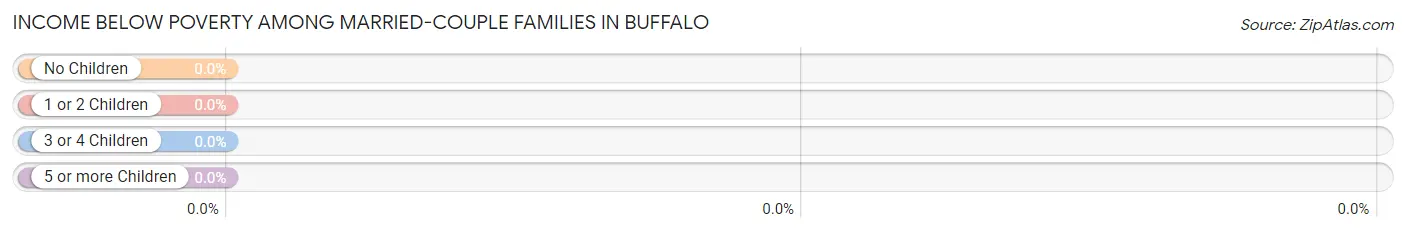
Income Below Poverty Among Married-Couple Families in Buffalo
| Children | Above Poverty | Below Poverty |
| No Children | 102 (100.0%) | 0 (0.0%) |
| 1 or 2 Children | 99 (100.0%) | 0 (0.0%) |
| 3 or 4 Children | 76 (100.0%) | 0 (0.0%) |
| 5 or more Children | 0 (0.0%) | 0 (0.0%) |
| Total | 277 (100.0%) | 0 (0.0%) |
Income Below Poverty Among Single-Parent Households in Buffalo
| Children | Single Father | Single Mother |
| No Children | 0 (0.0%) | 0 (0.0%) |
| 1 or 2 Children | 0 (0.0%) | 0 (0.0%) |
| 3 or 4 Children | 0 (0.0%) | 0 (0.0%) |
| 5 or more Children | 0 (0.0%) | 0 (0.0%) |
| Total | 0 (0.0%) | 0 (0.0%) |
Income Below Poverty Among Married-Couple vs Single-Parent Households in Buffalo
| Children | Married-Couple Families | Single-Parent Households |
| No Children | 0 (0.0%) | 0 (0.0%) |
| 1 or 2 Children | 0 (0.0%) | 0 (0.0%) |
| 3 or 4 Children | 0 (0.0%) | 0 (0.0%) |
| 5 or more Children | 0 (0.0%) | 0 (0.0%) |
| Total | 0 (0.0%) | 0 (0.0%) |
Race in Buffalo
The most populous races in Buffalo are White / Caucasian (1,016 | 79.8%), Hispanic or Latino (361 | 28.4%), and Some other Race (197 | 15.5%).
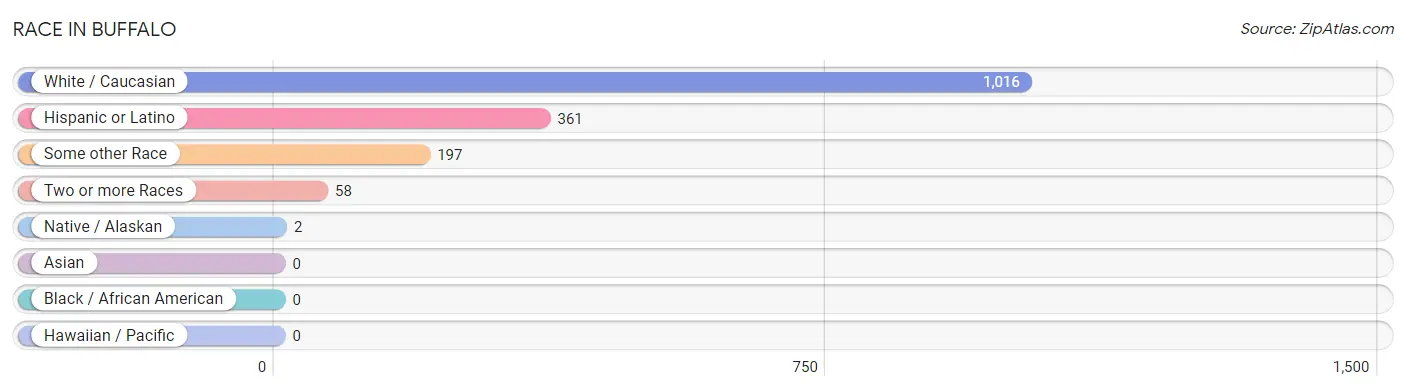
| Race | # Population | % Population |
| Asian | 0 | 0.0% |
| Black / African American | 0 | 0.0% |
| Hawaiian / Pacific | 0 | 0.0% |
| Hispanic or Latino | 361 | 28.4% |
| Native / Alaskan | 2 | 0.2% |
| White / Caucasian | 1,016 | 79.8% |
| Two or more Races | 58 | 4.6% |
| Some other Race | 197 | 15.5% |
| Total | 1,273 | 100.0% |
Ancestry in Buffalo
The most populous ancestries reported in Buffalo are Mexican (360 | 28.3%), German (212 | 16.7%), Irish (120 | 9.4%), Norwegian (112 | 8.8%), and American (71 | 5.6%), together accounting for 68.7% of all Buffalo residents.
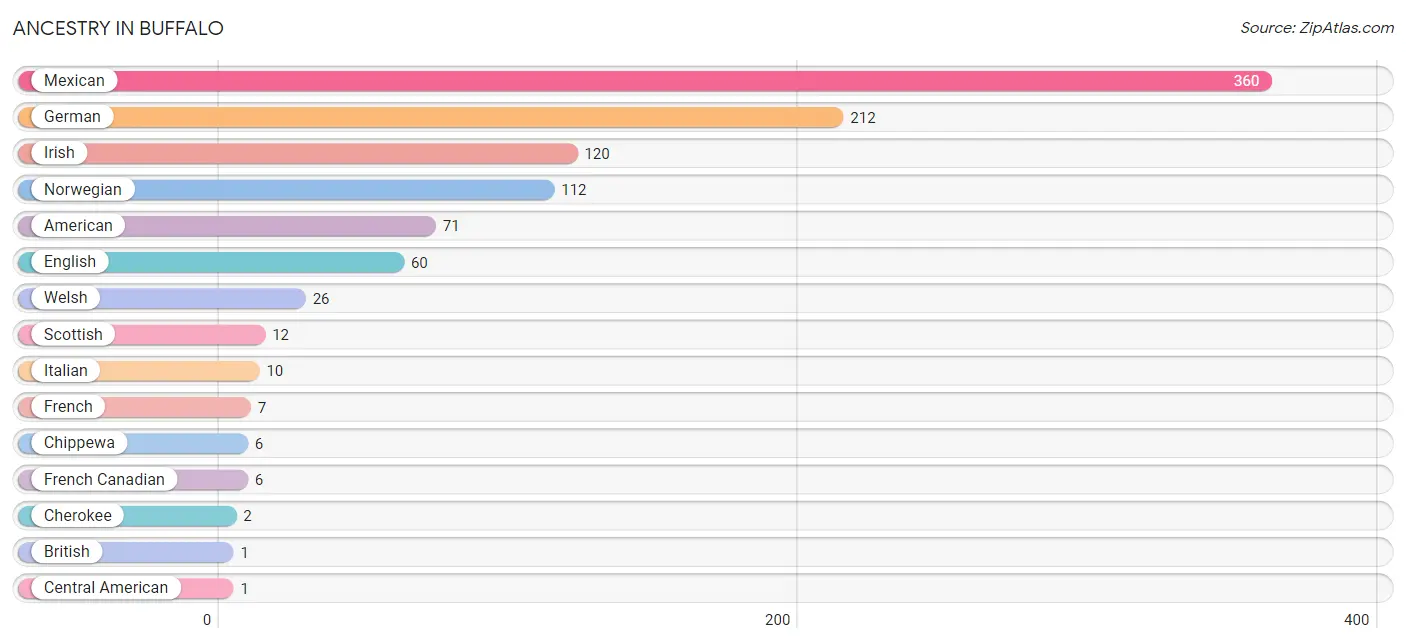
| Ancestry | # Population | % Population |
| American | 71 | 5.6% |
| British | 1 | 0.1% |
| Central American | 1 | 0.1% |
| Cherokee | 2 | 0.2% |
| Chippewa | 6 | 0.5% |
| English | 60 | 4.7% |
| French | 7 | 0.5% |
| French Canadian | 6 | 0.5% |
| German | 212 | 16.7% |
| Guatemalan | 1 | 0.1% |
| Irish | 120 | 9.4% |
| Italian | 10 | 0.8% |
| Mexican | 360 | 28.3% |
| Norwegian | 112 | 8.8% |
| Scottish | 12 | 0.9% |
| Swiss | 1 | 0.1% |
| Welsh | 26 | 2.0% | View All 17 Rows |
Immigrants in Buffalo
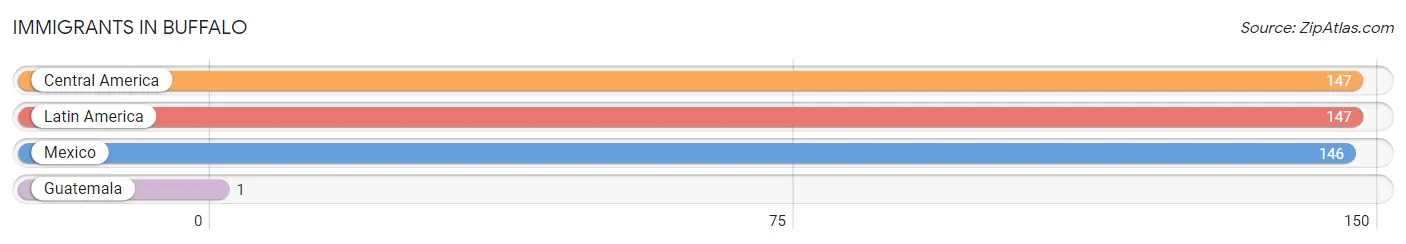
The most numerous immigrant groups reported in Buffalo came from Central America (147 | 11.6%), Latin America (147 | 11.6%), Mexico (146 | 11.5%), and Guatemala (1 | 0.1%), together accounting for 34.7% of all Buffalo residents.
| Immigration Origin | # Population | % Population |
| Central America | 147 | 11.6% |
| Guatemala | 1 | 0.1% |
| Latin America | 147 | 11.6% |
| Mexico | 146 | 11.5% | View All 4 Rows |
Sex and Age in Buffalo
Sex and Age in Buffalo
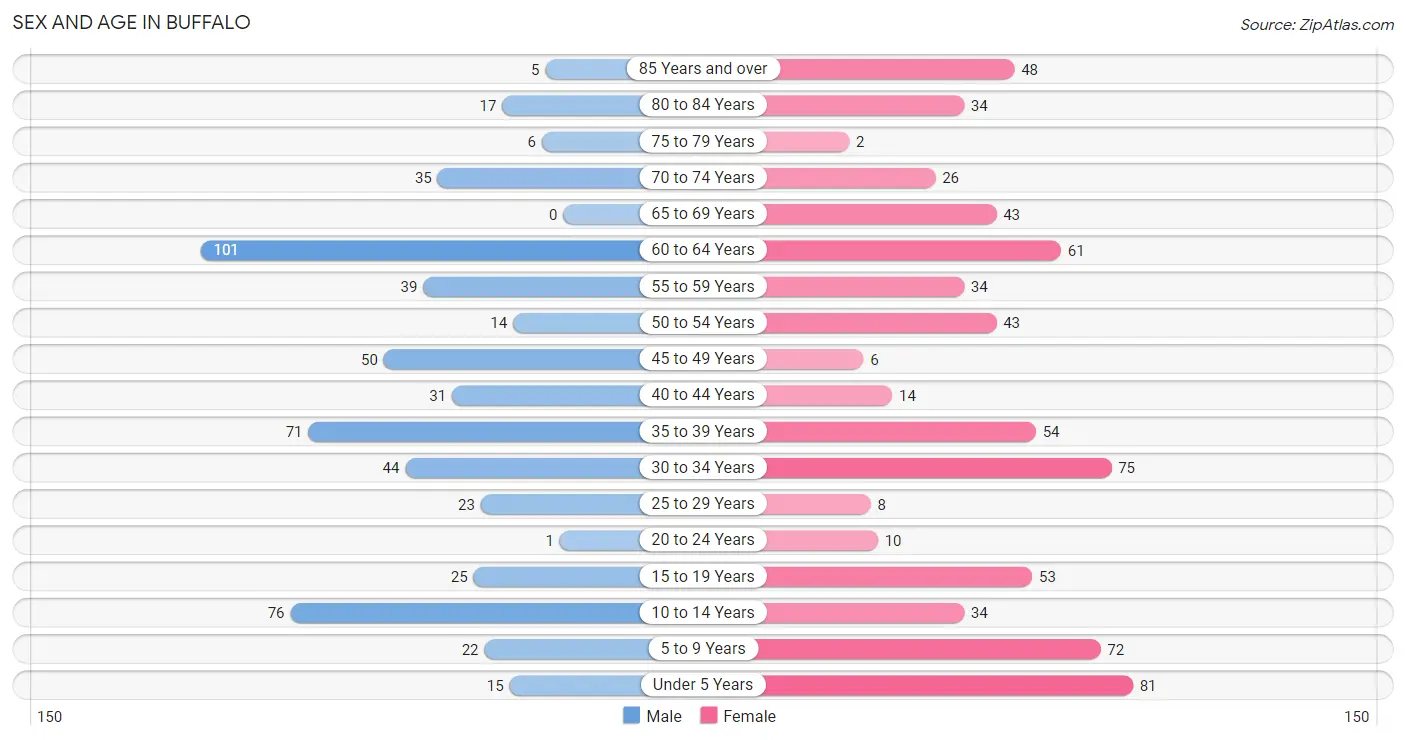
The most populous age groups in Buffalo are 60 to 64 Years (101 | 17.6%) for men and Under 5 Years (81 | 11.6%) for women.
| Age Bracket | Male | Female |
| Under 5 Years | 15 (2.6%) | 81 (11.6%) |
| 5 to 9 Years | 22 (3.8%) | 72 (10.3%) |
| 10 to 14 Years | 76 (13.2%) | 34 (4.9%) |
| 15 to 19 Years | 25 (4.3%) | 53 (7.6%) |
| 20 to 24 Years | 1 (0.2%) | 10 (1.4%) |
| 25 to 29 Years | 23 (4.0%) | 8 (1.1%) |
| 30 to 34 Years | 44 (7.6%) | 75 (10.7%) |
| 35 to 39 Years | 71 (12.3%) | 54 (7.7%) |
| 40 to 44 Years | 31 (5.4%) | 14 (2.0%) |
| 45 to 49 Years | 50 (8.7%) | 6 (0.9%) |
| 50 to 54 Years | 14 (2.4%) | 43 (6.2%) |
| 55 to 59 Years | 39 (6.8%) | 34 (4.9%) |
| 60 to 64 Years | 101 (17.6%) | 61 (8.7%) |
| 65 to 69 Years | 0 (0.0%) | 43 (6.2%) |
| 70 to 74 Years | 35 (6.1%) | 26 (3.7%) |
| 75 to 79 Years | 6 (1.0%) | 2 (0.3%) |
| 80 to 84 Years | 17 (3.0%) | 34 (4.9%) |
| 85 Years and over | 5 (0.9%) | 48 (6.9%) |
| Total | 575 (100.0%) | 698 (100.0%) |
Families and Households in Buffalo
Median Family Size in Buffalo
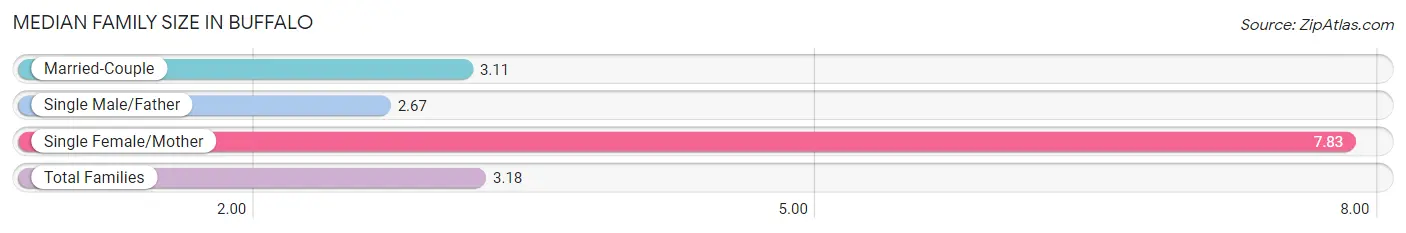
The median family size in Buffalo is 3.18 persons per family, with single female/mother families (6 | 2.0%) accounting for the largest median family size of 7.83 persons per family. On the other hand, single male/father families (15 | 5.0%) represent the smallest median family size with 2.67 persons per family.
| Family Type | # Families | Family Size |
| Married-Couple | 277 (92.9%) | 3.11 |
| Single Male/Father | 15 (5.0%) | 2.67 |
| Single Female/Mother | 6 (2.0%) | 7.83 |
| Total Families | 298 (100.0%) | 3.18 |
Median Household Size in Buffalo
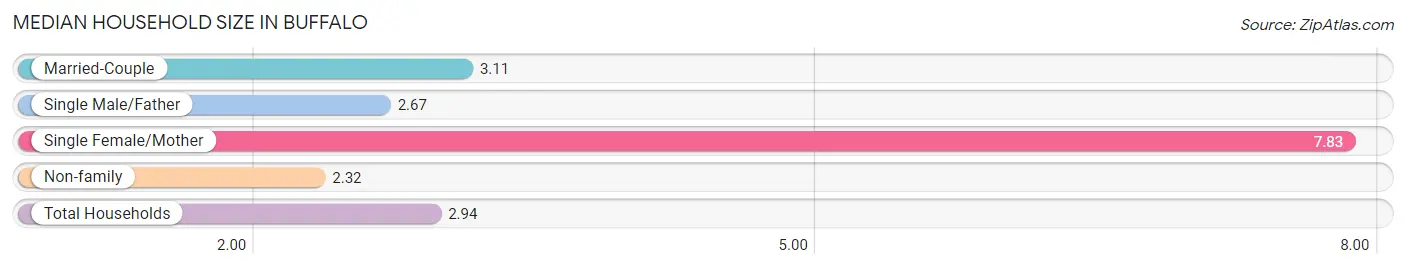
The median household size in Buffalo is 2.94 persons per household, with single female/mother households (6 | 1.5%) accounting for the largest median household size of 7.83 persons per household. non-family households (116 | 28.0%) represent the smallest median household size with 2.32 persons per household.
| Household Type | # Households | Household Size |
| Married-Couple | 277 (66.9%) | 3.11 |
| Single Male/Father | 15 (3.6%) | 2.67 |
| Single Female/Mother | 6 (1.5%) | 7.83 |
| Non-family | 116 (28.0%) | 2.32 |
| Total Households | 414 (100.0%) | 2.94 |
Household Size by Marriage Status in Buffalo
Out of a total of 414 households in Buffalo, 298 (72.0%) are family households, while 116 (28.0%) are nonfamily households. The most numerous type of family households are 2-person households, comprising 118, and the most common type of nonfamily households are 1-person households, comprising 91.
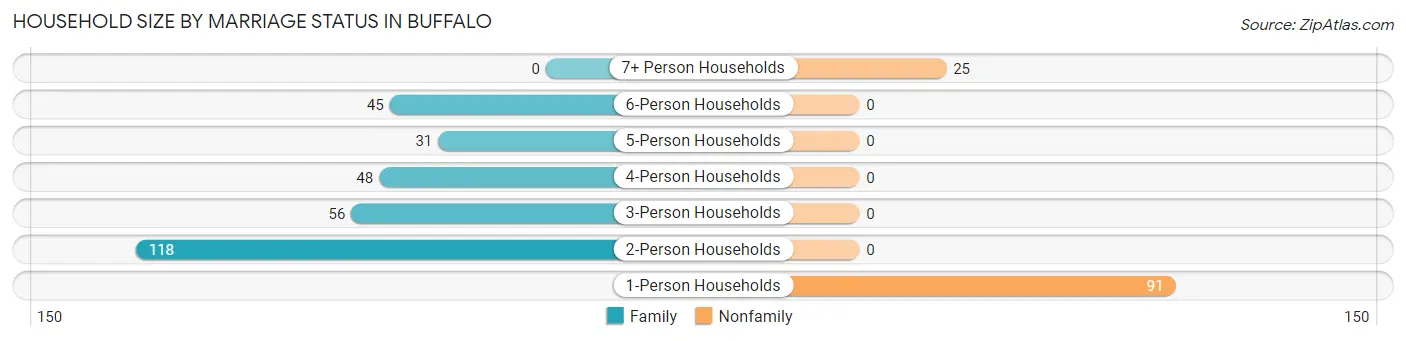
| Household Size | Family Households | Nonfamily Households |
| 1-Person Households | - | 91 (22.0%) |
| 2-Person Households | 118 (28.5%) | 0 (0.0%) |
| 3-Person Households | 56 (13.5%) | 0 (0.0%) |
| 4-Person Households | 48 (11.6%) | 0 (0.0%) |
| 5-Person Households | 31 (7.5%) | 0 (0.0%) |
| 6-Person Households | 45 (10.9%) | 0 (0.0%) |
| 7+ Person Households | 0 (0.0%) | 25 (6.0%) |
| Total | 298 (72.0%) | 116 (28.0%) |
Female Fertility in Buffalo
Fertility by Age in Buffalo
Average fertility rate in Buffalo is 45.0 births per 1,000 women. Women in the age bracket of 20 to 34 years have the highest fertility rate with 108.0 births per 1,000 women. Women in the age bracket of 20 to 34 years acount for 100.0% of all women with births.
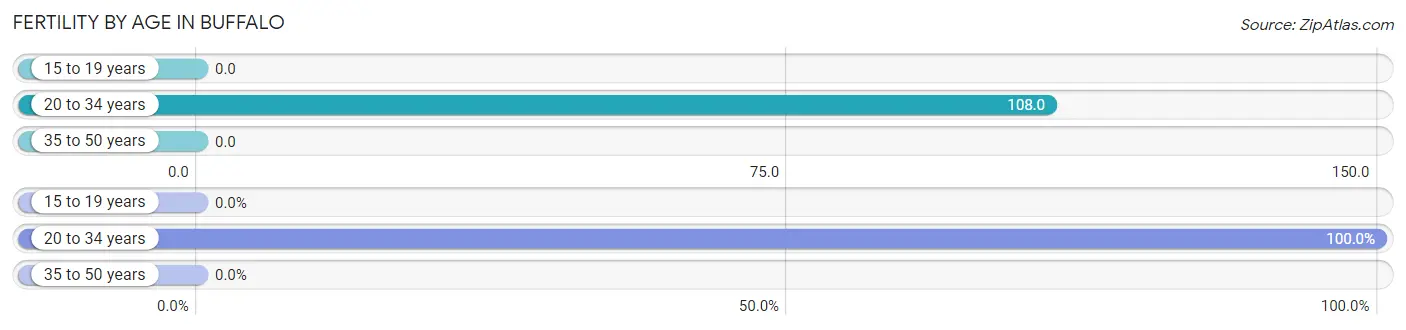
| Age Bracket | Women with Births | Births / 1,000 Women |
| 15 to 19 years | 0 (0.0%) | 0.0 |
| 20 to 34 years | 10 (100.0%) | 108.0 |
| 35 to 50 years | 0 (0.0%) | 0.0 |
| Total | 10 (100.0%) | 45.0 |
Fertility by Age by Marriage Status in Buffalo
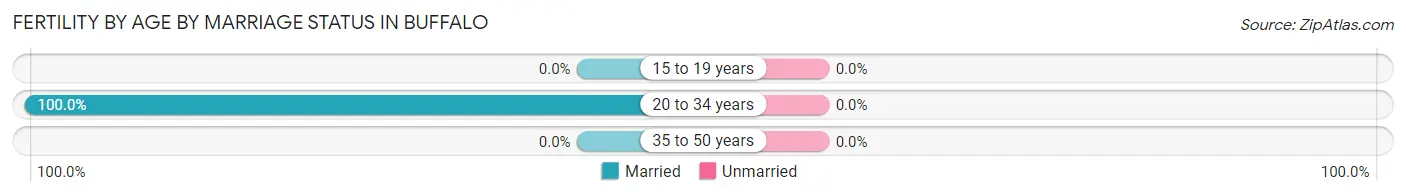
| Age Bracket | Married | Unmarried |
| 15 to 19 years | 0 (0.0%) | 0 (0.0%) |
| 20 to 34 years | 10 (100.0%) | 0 (0.0%) |
| 35 to 50 years | 0 (0.0%) | 0 (0.0%) |
| Total | 10 (100.0%) | 0 (0.0%) |
Fertility by Education in Buffalo
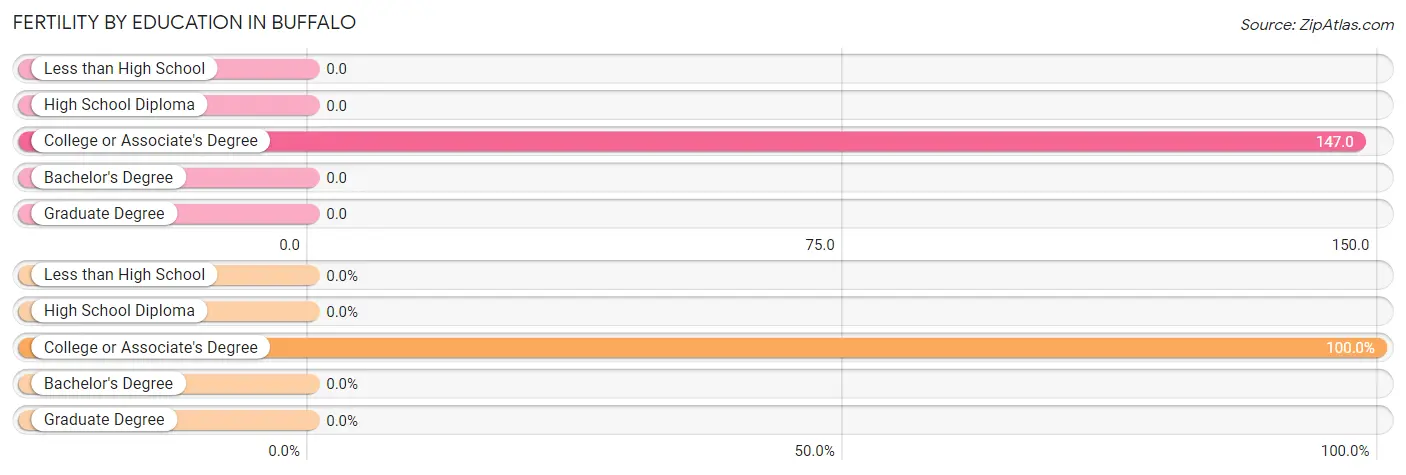
| Educational Attainment | Women with Births | Births / 1,000 Women |
| Less than High School | 0 (0.0%) | 0.0 |
| High School Diploma | 0 (0.0%) | 0.0 |
| College or Associate's Degree | 10 (100.0%) | 147.0 |
| Bachelor's Degree | 0 (0.0%) | 0.0 |
| Graduate Degree | 0 (0.0%) | 0.0 |
| Total | 10 (100.0%) | 45.0 |
Fertility by Education by Marriage Status in Buffalo
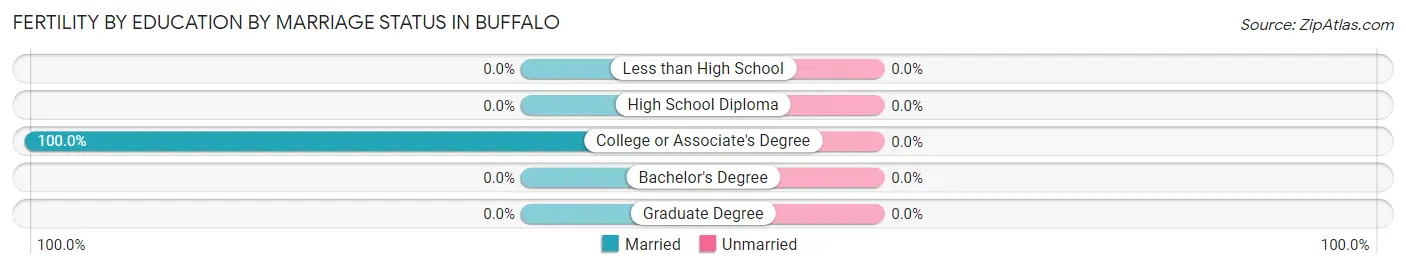
| Educational Attainment | Married | Unmarried |
| Less than High School | 0 (0.0%) | 0 (0.0%) |
| High School Diploma | 0 (0.0%) | 0 (0.0%) |
| College or Associate's Degree | 10 (100.0%) | 0 (0.0%) |
| Bachelor's Degree | 0 (0.0%) | 0 (0.0%) |
| Graduate Degree | 0 (0.0%) | 0 (0.0%) |
| Total | 10 (100.0%) | 0 (0.0%) |
Employment Characteristics in Buffalo
Employment by Class of Employer in Buffalo
Among the 526 employed individuals in Buffalo, private company employees (290 | 55.1%), local government employees (102 | 19.4%), and state government employees (81 | 15.4%) make up the most common classes of employment.
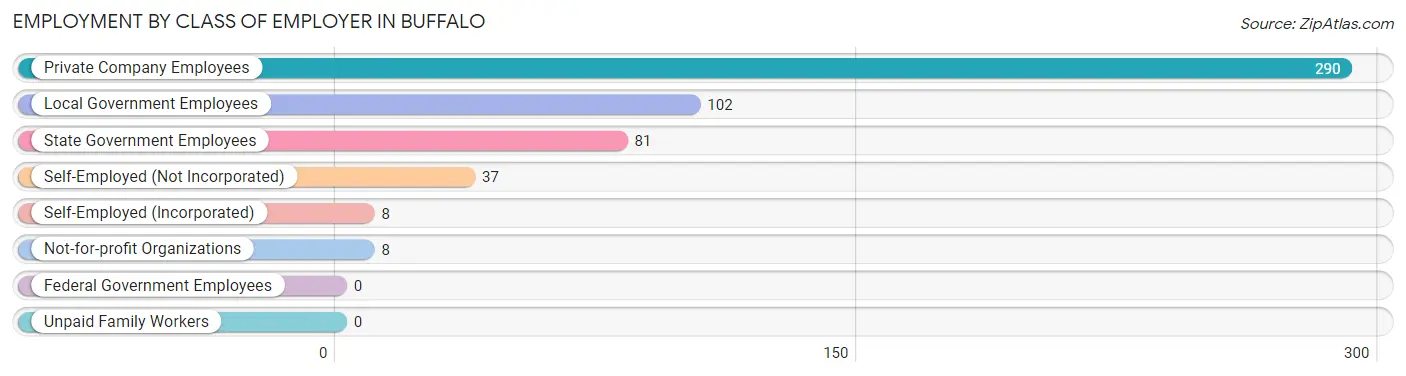
| Employer Class | # Employees | % Employees |
| Private Company Employees | 290 | 55.1% |
| Self-Employed (Incorporated) | 8 | 1.5% |
| Self-Employed (Not Incorporated) | 37 | 7.0% |
| Not-for-profit Organizations | 8 | 1.5% |
| Local Government Employees | 102 | 19.4% |
| State Government Employees | 81 | 15.4% |
| Federal Government Employees | 0 | 0.0% |
| Unpaid Family Workers | 0 | 0.0% |
| Total | 526 | 100.0% |
Employment Status by Age in Buffalo
According to the labor force statistics for Buffalo, out of the total population over 16 years of age (951), 56.9% or 541 individuals are in the labor force, with 2.8% or 15 of them unemployed. The age group with the highest labor force participation rate is 25 to 29 years, with 96.8% or 30 individuals in the labor force. Within the labor force, the 35 to 44 years age range has the highest percentage of unemployed individuals, with 6.1% or 10 of them being unemployed.
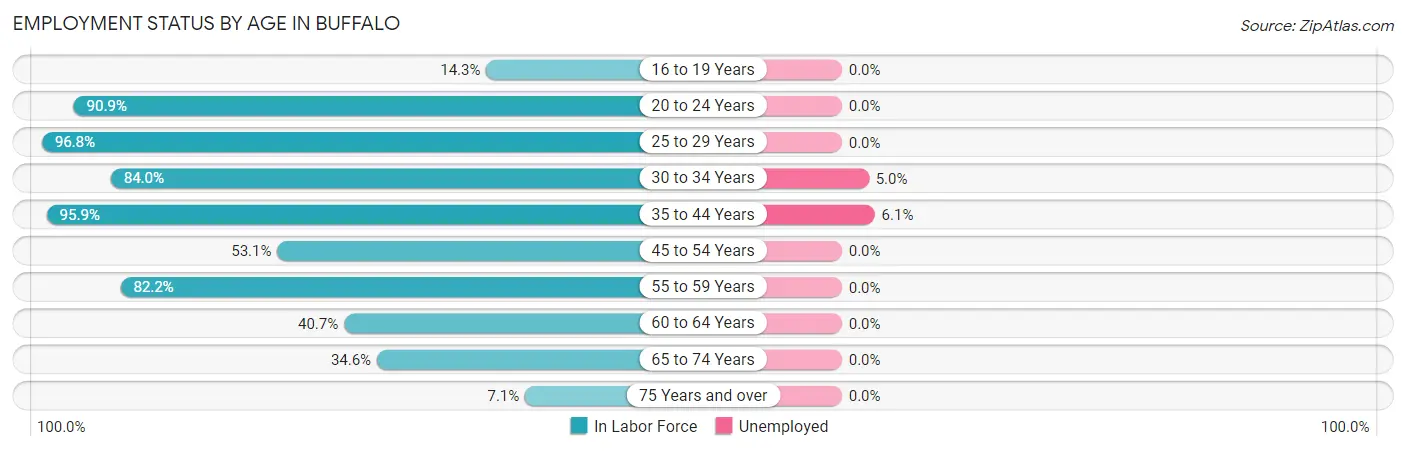
| Age Bracket | In Labor Force | Unemployed |
| 16 to 19 Years | 8 (14.3%) | 0 (0.0%) |
| 20 to 24 Years | 10 (90.9%) | 0 (0.0%) |
| 25 to 29 Years | 30 (96.8%) | 0 (0.0%) |
| 30 to 34 Years | 100 (84.0%) | 5 (5.0%) |
| 35 to 44 Years | 163 (95.9%) | 10 (6.1%) |
| 45 to 54 Years | 60 (53.1%) | 0 (0.0%) |
| 55 to 59 Years | 60 (82.2%) | 0 (0.0%) |
| 60 to 64 Years | 66 (40.7%) | 0 (0.0%) |
| 65 to 74 Years | 36 (34.6%) | 0 (0.0%) |
| 75 Years and over | 8 (7.1%) | 0 (0.0%) |
| Total | 541 (56.9%) | 15 (2.8%) |
Employment Status by Educational Attainment in Buffalo
According to labor force statistics for Buffalo, 71.7% of individuals (479) out of the total population between 25 and 64 years of age (668) are in the labor force, with 3.1% or 15 of them being unemployed. The group with the highest labor force participation rate are those with the educational attainment of bachelor's degree or higher, with 100.0% or 45 individuals in the labor force. Within the labor force, individuals with high school diploma education have the highest percentage of unemployment, with 6.4% or 10 of them being unemployed.
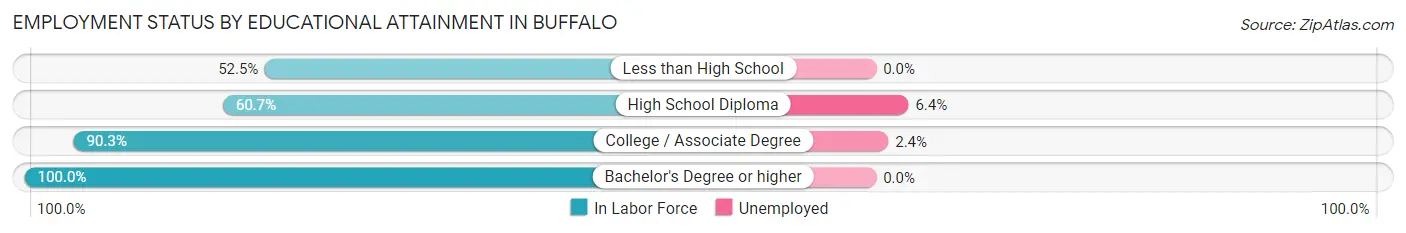
| Educational Attainment | In Labor Force | Unemployed |
| Less than High School | 73 (52.5%) | 0 (0.0%) |
| High School Diploma | 156 (60.7%) | 16 (6.4%) |
| College / Associate Degree | 205 (90.3%) | 5 (2.4%) |
| Bachelor's Degree or higher | 45 (100.0%) | 0 (0.0%) |
| Total | 479 (71.7%) | 21 (3.1%) |
Employment Occupations by Sex in Buffalo
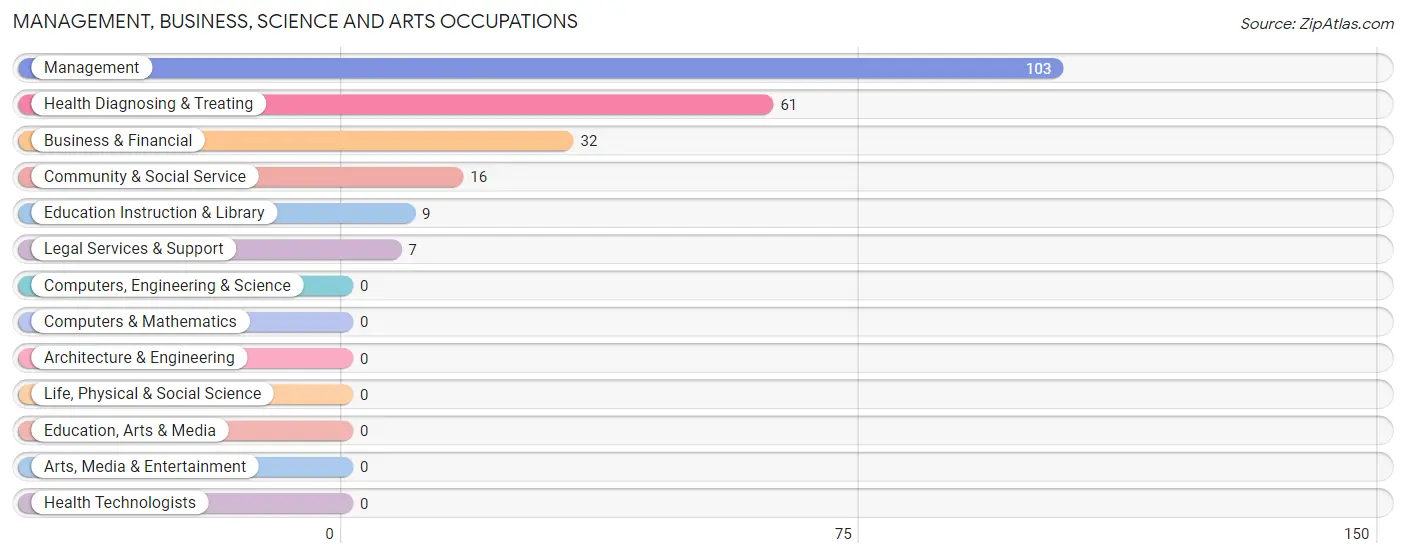
Management, Business, Science and Arts Occupations
The most common Management, Business, Science and Arts occupations in Buffalo are Management (103 | 19.6%), Health Diagnosing & Treating (61 | 11.6%), Business & Financial (32 | 6.1%), Community & Social Service (16 | 3.0%), and Education Instruction & Library (9 | 1.7%).
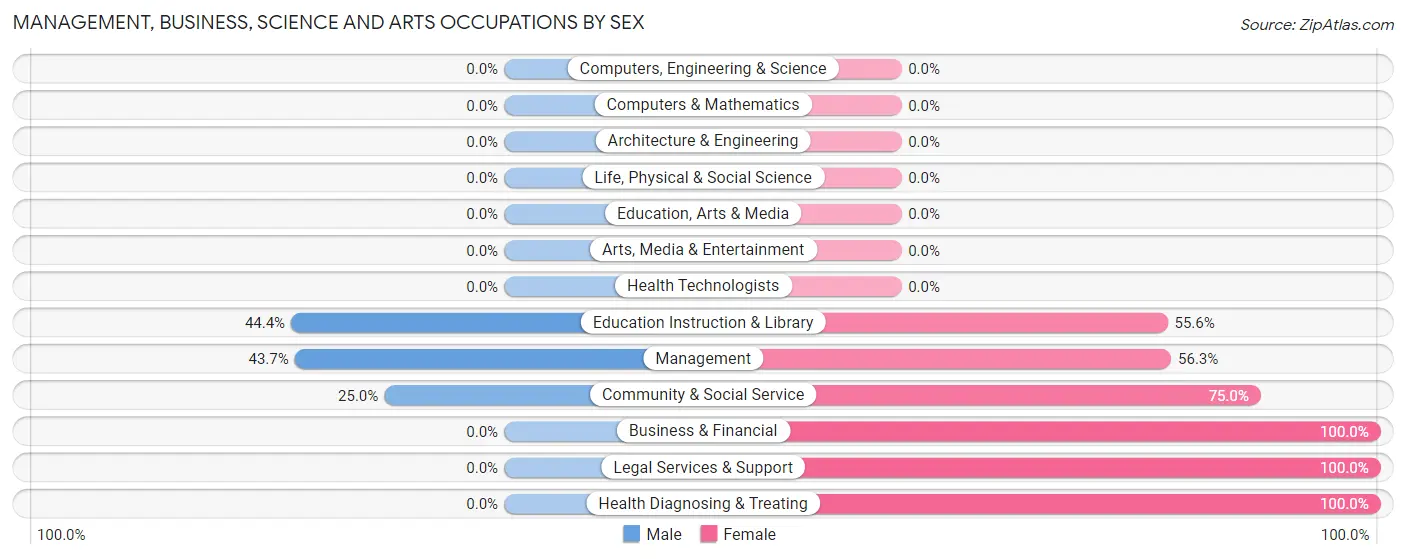
Management, Business, Science and Arts Occupations by Sex
Within the Management, Business, Science and Arts occupations in Buffalo, the most male-oriented occupations are Education Instruction & Library (44.4%), Management (43.7%), and Community & Social Service (25.0%), while the most female-oriented occupations are Business & Financial (100.0%), Legal Services & Support (100.0%), and Health Diagnosing & Treating (100.0%).
| Occupation | Male | Female |
| Management | 45 (43.7%) | 58 (56.3%) |
| Business & Financial | 0 (0.0%) | 32 (100.0%) |
| Computers, Engineering & Science | 0 (0.0%) | 0 (0.0%) |
| Computers & Mathematics | 0 (0.0%) | 0 (0.0%) |
| Architecture & Engineering | 0 (0.0%) | 0 (0.0%) |
| Life, Physical & Social Science | 0 (0.0%) | 0 (0.0%) |
| Community & Social Service | 4 (25.0%) | 12 (75.0%) |
| Education, Arts & Media | 0 (0.0%) | 0 (0.0%) |
| Legal Services & Support | 0 (0.0%) | 7 (100.0%) |
| Education Instruction & Library | 4 (44.4%) | 5 (55.6%) |
| Arts, Media & Entertainment | 0 (0.0%) | 0 (0.0%) |
| Health Diagnosing & Treating | 0 (0.0%) | 61 (100.0%) |
| Health Technologists | 0 (0.0%) | 0 (0.0%) |
| Total (Category) | 49 (23.1%) | 163 (76.9%) |
| Total (Overall) | 258 (49.0%) | 268 (50.9%) |
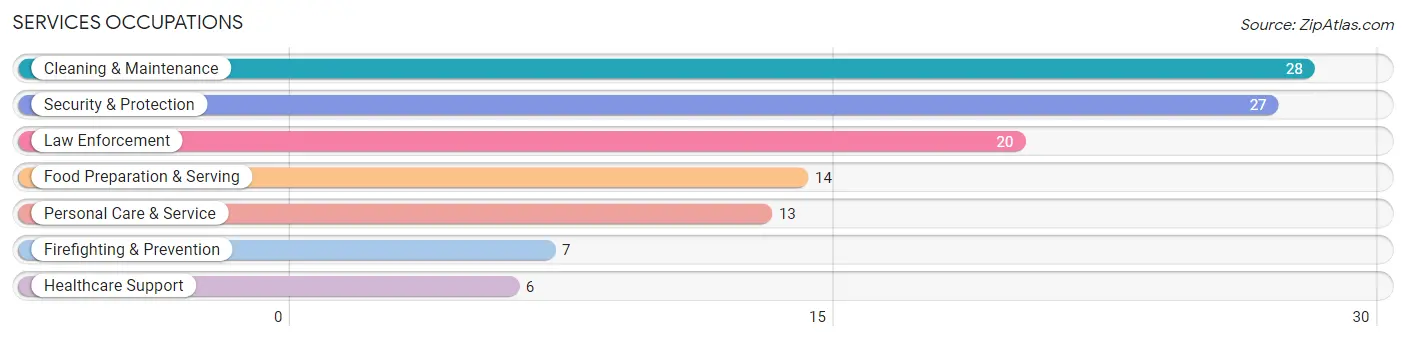
Services Occupations
The most common Services occupations in Buffalo are Cleaning & Maintenance (28 | 5.3%), Security & Protection (27 | 5.1%), Law Enforcement (20 | 3.8%), Food Preparation & Serving (14 | 2.7%), and Personal Care & Service (13 | 2.5%).
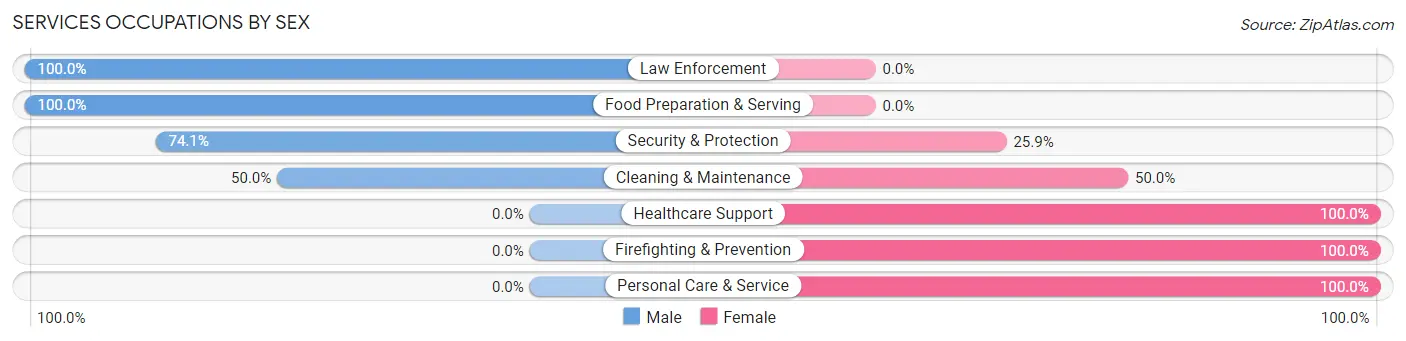
Services Occupations by Sex
Within the Services occupations in Buffalo, the most male-oriented occupations are Law Enforcement (100.0%), Food Preparation & Serving (100.0%), and Security & Protection (74.1%), while the most female-oriented occupations are Healthcare Support (100.0%), Firefighting & Prevention (100.0%), and Personal Care & Service (100.0%).
| Occupation | Male | Female |
| Healthcare Support | 0 (0.0%) | 6 (100.0%) |
| Security & Protection | 20 (74.1%) | 7 (25.9%) |
| Firefighting & Prevention | 0 (0.0%) | 7 (100.0%) |
| Law Enforcement | 20 (100.0%) | 0 (0.0%) |
| Food Preparation & Serving | 14 (100.0%) | 0 (0.0%) |
| Cleaning & Maintenance | 14 (50.0%) | 14 (50.0%) |
| Personal Care & Service | 0 (0.0%) | 13 (100.0%) |
| Total (Category) | 48 (54.5%) | 40 (45.5%) |
| Total (Overall) | 258 (49.0%) | 268 (50.9%) |
Sales and Office Occupations
The most common Sales and Office occupations in Buffalo are Office & Administration (62 | 11.8%), and Sales & Related (15 | 2.9%).

Sales and Office Occupations by Sex

| Occupation | Male | Female |
| Sales & Related | 7 (46.7%) | 8 (53.3%) |
| Office & Administration | 11 (17.7%) | 51 (82.3%) |
| Total (Category) | 18 (23.4%) | 59 (76.6%) |
| Total (Overall) | 258 (49.0%) | 268 (50.9%) |
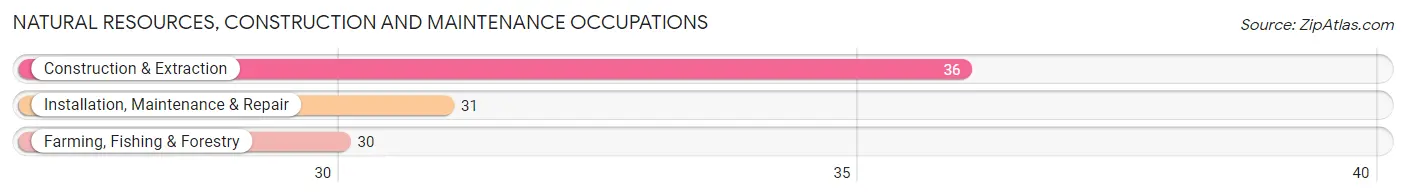
Natural Resources, Construction and Maintenance Occupations
The most common Natural Resources, Construction and Maintenance occupations in Buffalo are Construction & Extraction (36 | 6.8%), Installation, Maintenance & Repair (31 | 5.9%), and Farming, Fishing & Forestry (30 | 5.7%).
Natural Resources, Construction and Maintenance Occupations by Sex
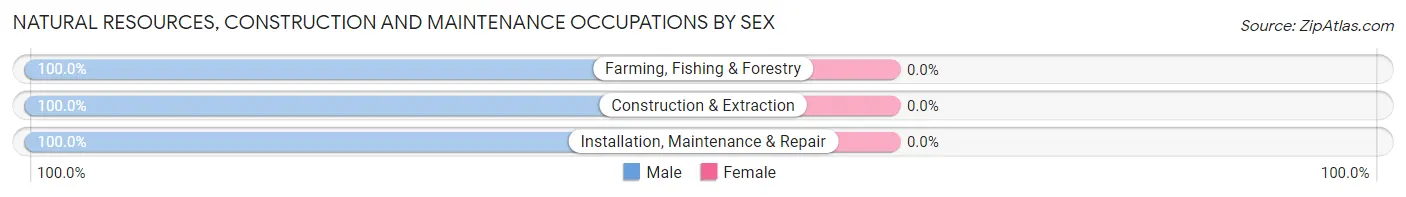
| Occupation | Male | Female |
| Farming, Fishing & Forestry | 30 (100.0%) | 0 (0.0%) |
| Construction & Extraction | 36 (100.0%) | 0 (0.0%) |
| Installation, Maintenance & Repair | 31 (100.0%) | 0 (0.0%) |
| Total (Category) | 97 (100.0%) | 0 (0.0%) |
| Total (Overall) | 258 (49.0%) | 268 (50.9%) |
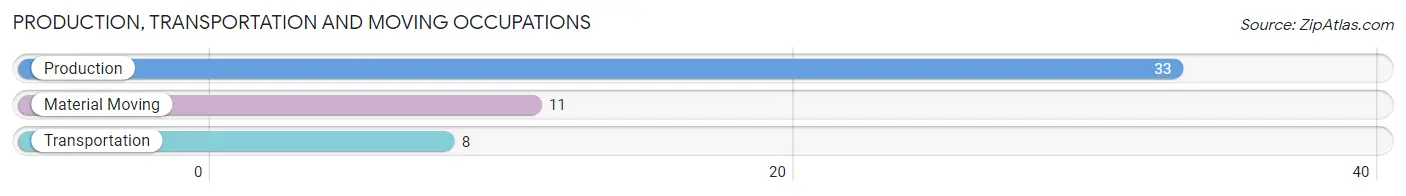
Production, Transportation and Moving Occupations
The most common Production, Transportation and Moving occupations in Buffalo are Production (33 | 6.3%), Material Moving (11 | 2.1%), and Transportation (8 | 1.5%).
Production, Transportation and Moving Occupations by Sex
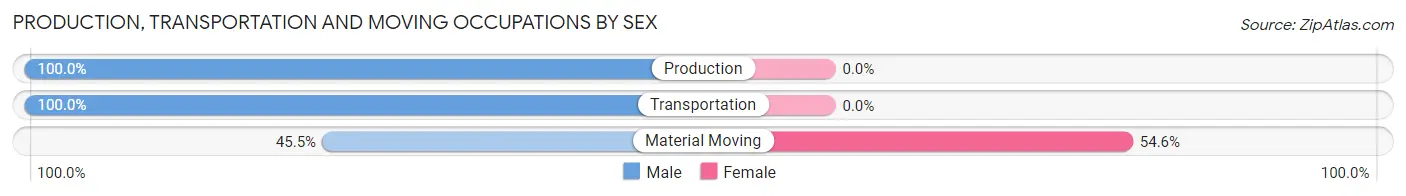
| Occupation | Male | Female |
| Production | 33 (100.0%) | 0 (0.0%) |
| Transportation | 8 (100.0%) | 0 (0.0%) |
| Material Moving | 5 (45.5%) | 6 (54.5%) |
| Total (Category) | 46 (88.5%) | 6 (11.5%) |
| Total (Overall) | 258 (49.0%) | 268 (50.9%) |
Employment Industries by Sex in Buffalo
Employment Industries in Buffalo
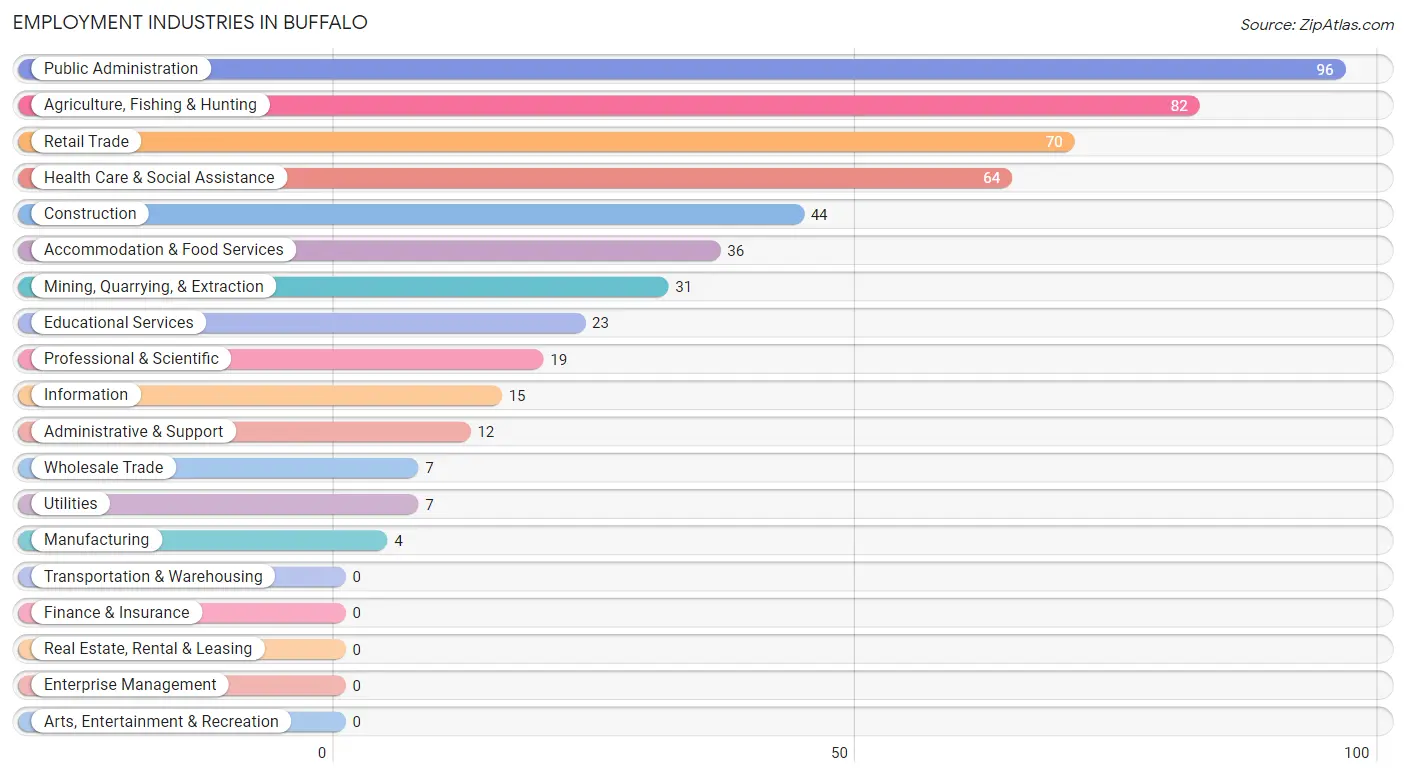
The major employment industries in Buffalo include Public Administration (96 | 18.2%), Agriculture, Fishing & Hunting (82 | 15.6%), Retail Trade (70 | 13.3%), Health Care & Social Assistance (64 | 12.2%), and Construction (44 | 8.4%).
Employment Industries by Sex in Buffalo
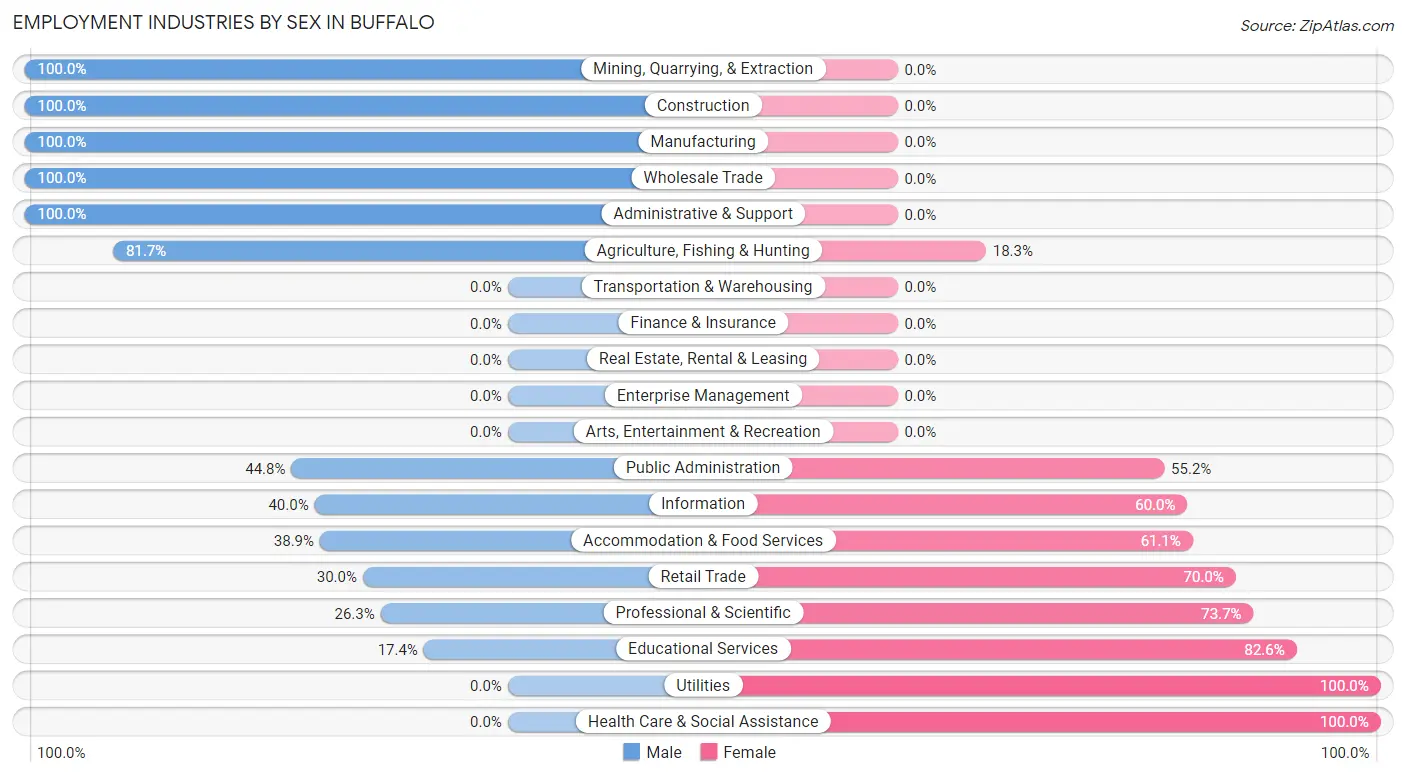
The Buffalo industries that see more men than women are Mining, Quarrying, & Extraction (100.0%), Construction (100.0%), and Manufacturing (100.0%), whereas the industries that tend to have a higher number of women are Utilities (100.0%), Health Care & Social Assistance (100.0%), and Educational Services (82.6%).
| Industry | Male | Female |
| Agriculture, Fishing & Hunting | 67 (81.7%) | 15 (18.3%) |
| Mining, Quarrying, & Extraction | 31 (100.0%) | 0 (0.0%) |
| Construction | 44 (100.0%) | 0 (0.0%) |
| Manufacturing | 4 (100.0%) | 0 (0.0%) |
| Wholesale Trade | 7 (100.0%) | 0 (0.0%) |
| Retail Trade | 21 (30.0%) | 49 (70.0%) |
| Transportation & Warehousing | 0 (0.0%) | 0 (0.0%) |
| Utilities | 0 (0.0%) | 7 (100.0%) |
| Information | 6 (40.0%) | 9 (60.0%) |
| Finance & Insurance | 0 (0.0%) | 0 (0.0%) |
| Real Estate, Rental & Leasing | 0 (0.0%) | 0 (0.0%) |
| Professional & Scientific | 5 (26.3%) | 14 (73.7%) |
| Enterprise Management | 0 (0.0%) | 0 (0.0%) |
| Administrative & Support | 12 (100.0%) | 0 (0.0%) |
| Educational Services | 4 (17.4%) | 19 (82.6%) |
| Health Care & Social Assistance | 0 (0.0%) | 64 (100.0%) |
| Arts, Entertainment & Recreation | 0 (0.0%) | 0 (0.0%) |
| Accommodation & Food Services | 14 (38.9%) | 22 (61.1%) |
| Public Administration | 43 (44.8%) | 53 (55.2%) |
| Total | 258 (49.0%) | 268 (50.9%) |
Education in Buffalo
School Enrollment in Buffalo
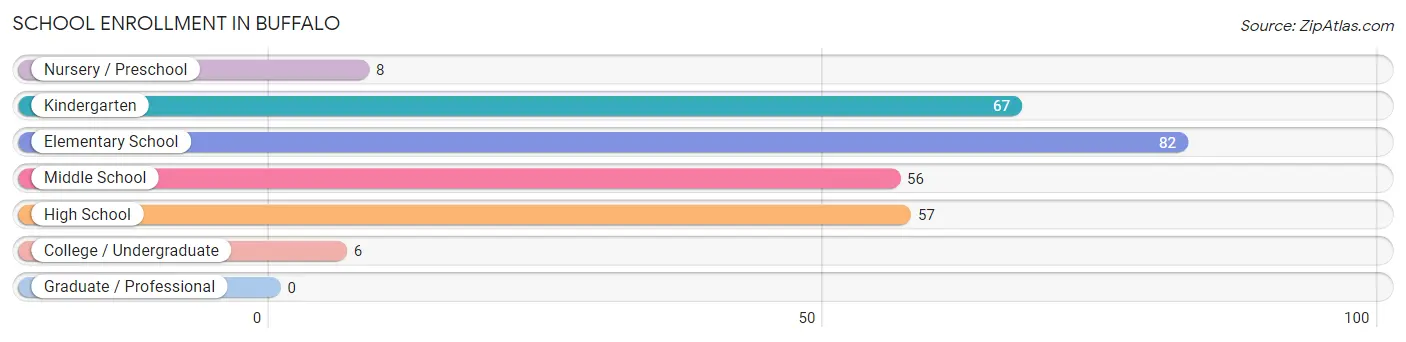
The most common levels of schooling among the 276 students in Buffalo are elementary school (82 | 29.7%), kindergarten (67 | 24.3%), and high school (57 | 20.6%).
| School Level | # Students | % Students |
| Nursery / Preschool | 8 | 2.9% |
| Kindergarten | 67 | 24.3% |
| Elementary School | 82 | 29.7% |
| Middle School | 56 | 20.3% |
| High School | 57 | 20.6% |
| College / Undergraduate | 6 | 2.2% |
| Graduate / Professional | 0 | 0.0% |
| Total | 276 | 100.0% |
School Enrollment by Age by Funding Source in Buffalo
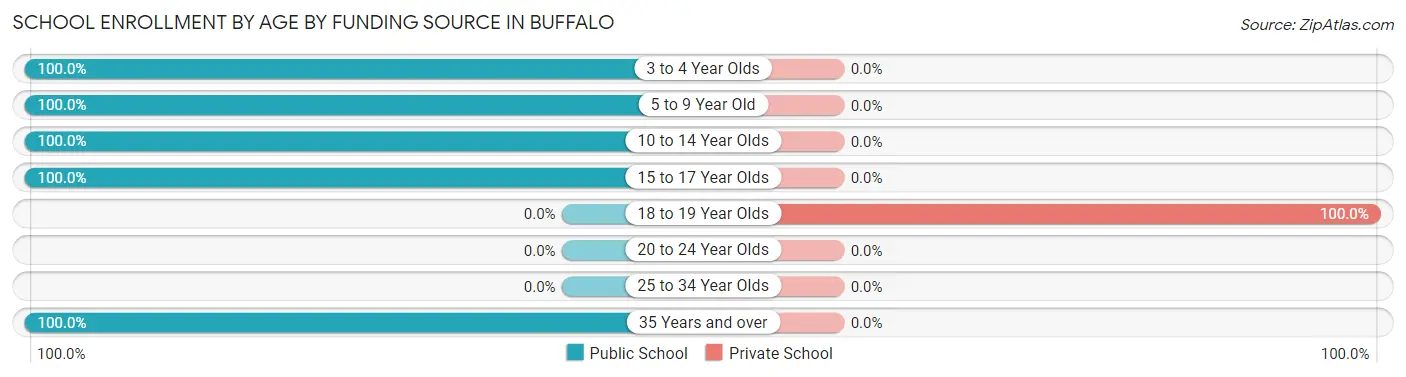
Out of a total of 276 students who are enrolled in schools in Buffalo, 9 (3.3%) attend a private institution, while the remaining 267 (96.7%) are enrolled in public schools. The age group of 18 to 19 year olds has the highest likelihood of being enrolled in private schools, with 9 (100.0% in the age bracket) enrolled. Conversely, the age group of 3 to 4 year olds has the lowest likelihood of being enrolled in a private school, with 47 (100.0% in the age bracket) attending a public institution.
| Age Bracket | Public School | Private School |
| 3 to 4 Year Olds | 47 (100.0%) | 0 (0.0%) |
| 5 to 9 Year Old | 84 (100.0%) | 0 (0.0%) |
| 10 to 14 Year Olds | 85 (100.0%) | 0 (0.0%) |
| 15 to 17 Year Olds | 45 (100.0%) | 0 (0.0%) |
| 18 to 19 Year Olds | 0 (0.0%) | 9 (100.0%) |
| 20 to 24 Year Olds | 0 (0.0%) | 0 (0.0%) |
| 25 to 34 Year Olds | 0 (0.0%) | 0 (0.0%) |
| 35 Years and over | 6 (100.0%) | 0 (0.0%) |
| Total | 267 (96.7%) | 9 (3.3%) |
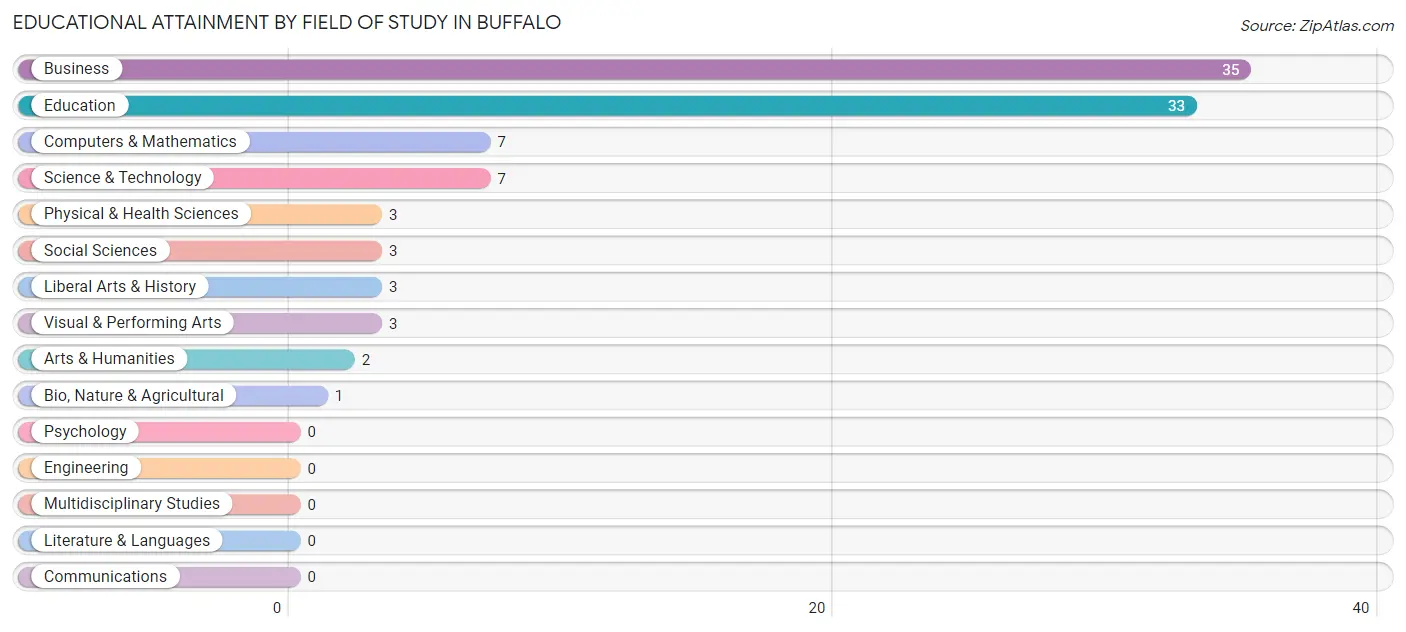
Educational Attainment by Field of Study in Buffalo
Business (35 | 36.1%), education (33 | 34.0%), computers & mathematics (7 | 7.2%), science & technology (7 | 7.2%), and physical & health sciences (3 | 3.1%) are the most common fields of study among 97 individuals in Buffalo who have obtained a bachelor's degree or higher.
| Field of Study | # Graduates | % Graduates |
| Computers & Mathematics | 7 | 7.2% |
| Bio, Nature & Agricultural | 1 | 1.0% |
| Physical & Health Sciences | 3 | 3.1% |
| Psychology | 0 | 0.0% |
| Social Sciences | 3 | 3.1% |
| Engineering | 0 | 0.0% |
| Multidisciplinary Studies | 0 | 0.0% |
| Science & Technology | 7 | 7.2% |
| Business | 35 | 36.1% |
| Education | 33 | 34.0% |
| Literature & Languages | 0 | 0.0% |
| Liberal Arts & History | 3 | 3.1% |
| Visual & Performing Arts | 3 | 3.1% |
| Communications | 0 | 0.0% |
| Arts & Humanities | 2 | 2.1% |
| Total | 97 | 100.0% |
Transportation & Commute in Buffalo
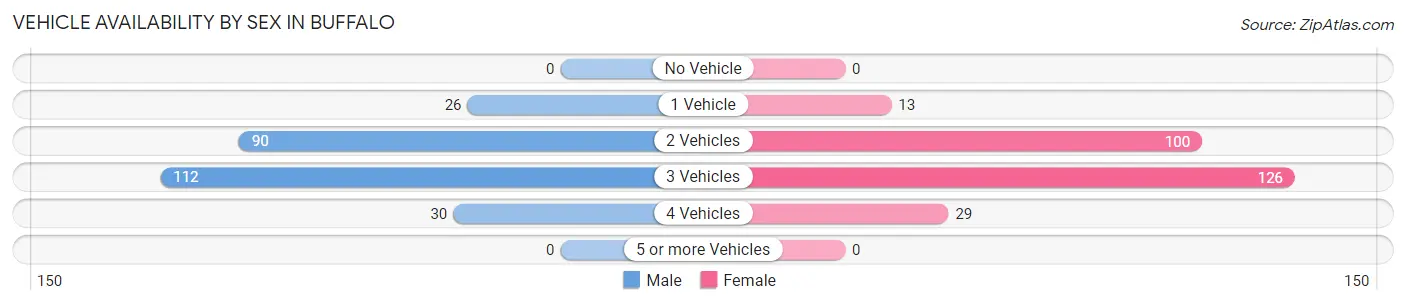
Vehicle Availability by Sex in Buffalo
The most prevalent vehicle ownership categories in Buffalo are males with 3 vehicles (112, accounting for 43.4%) and females with 3 vehicles (126, making up 41.8%).
| Vehicles Available | Male | Female |
| No Vehicle | 0 (0.0%) | 0 (0.0%) |
| 1 Vehicle | 26 (10.1%) | 13 (4.9%) |
| 2 Vehicles | 90 (34.9%) | 100 (37.3%) |
| 3 Vehicles | 112 (43.4%) | 126 (47.0%) |
| 4 Vehicles | 30 (11.6%) | 29 (10.8%) |
| 5 or more Vehicles | 0 (0.0%) | 0 (0.0%) |
| Total | 258 (100.0%) | 268 (100.0%) |
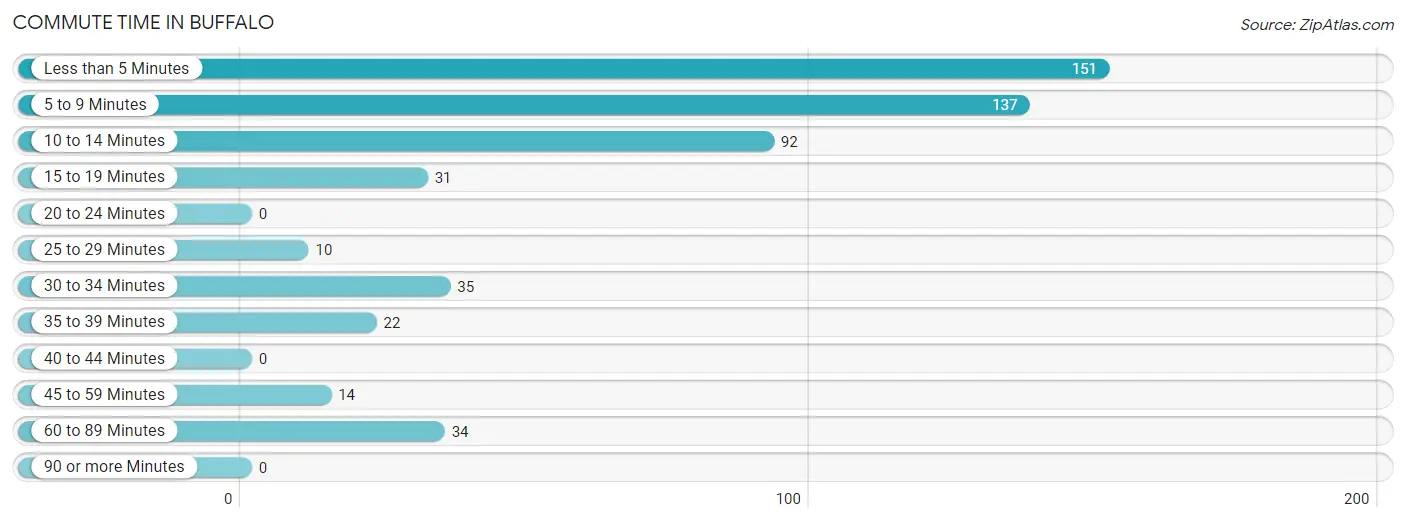
Commute Time in Buffalo
The most frequently occuring commute durations in Buffalo are less than 5 minutes (151 commuters, 28.7%), 5 to 9 minutes (137 commuters, 26.1%), and 10 to 14 minutes (92 commuters, 17.5%).
| Commute Time | # Commuters | % Commuters |
| Less than 5 Minutes | 151 | 28.7% |
| 5 to 9 Minutes | 137 | 26.1% |
| 10 to 14 Minutes | 92 | 17.5% |
| 15 to 19 Minutes | 31 | 5.9% |
| 20 to 24 Minutes | 0 | 0.0% |
| 25 to 29 Minutes | 10 | 1.9% |
| 30 to 34 Minutes | 35 | 6.7% |
| 35 to 39 Minutes | 22 | 4.2% |
| 40 to 44 Minutes | 0 | 0.0% |
| 45 to 59 Minutes | 14 | 2.7% |
| 60 to 89 Minutes | 34 | 6.5% |
| 90 or more Minutes | 0 | 0.0% |
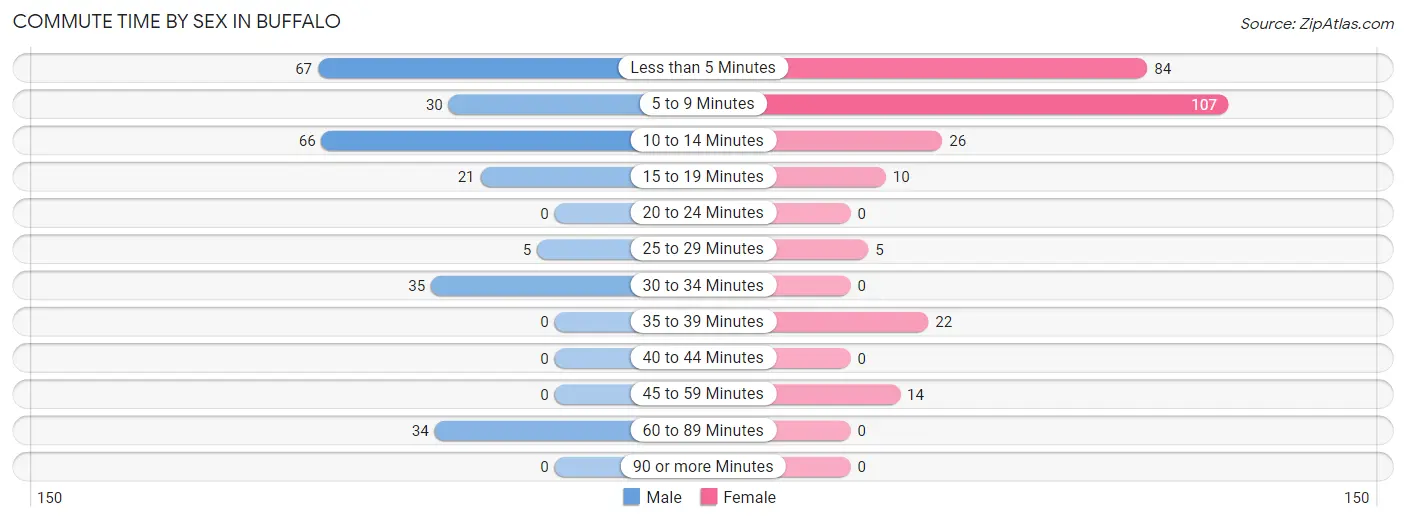
Commute Time by Sex in Buffalo
The most common commute times in Buffalo are less than 5 minutes (67 commuters, 26.0%) for males and 5 to 9 minutes (107 commuters, 39.9%) for females.
| Commute Time | Male | Female |
| Less than 5 Minutes | 67 (26.0%) | 84 (31.3%) |
| 5 to 9 Minutes | 30 (11.6%) | 107 (39.9%) |
| 10 to 14 Minutes | 66 (25.6%) | 26 (9.7%) |
| 15 to 19 Minutes | 21 (8.1%) | 10 (3.7%) |
| 20 to 24 Minutes | 0 (0.0%) | 0 (0.0%) |
| 25 to 29 Minutes | 5 (1.9%) | 5 (1.9%) |
| 30 to 34 Minutes | 35 (13.6%) | 0 (0.0%) |
| 35 to 39 Minutes | 0 (0.0%) | 22 (8.2%) |
| 40 to 44 Minutes | 0 (0.0%) | 0 (0.0%) |
| 45 to 59 Minutes | 0 (0.0%) | 14 (5.2%) |
| 60 to 89 Minutes | 34 (13.2%) | 0 (0.0%) |
| 90 or more Minutes | 0 (0.0%) | 0 (0.0%) |
Time of Departure to Work by Sex in Buffalo
The most frequent times of departure to work in Buffalo are 7:00 AM to 7:29 AM (97, 37.6%) for males and 7:30 AM to 7:59 AM (109, 40.7%) for females.
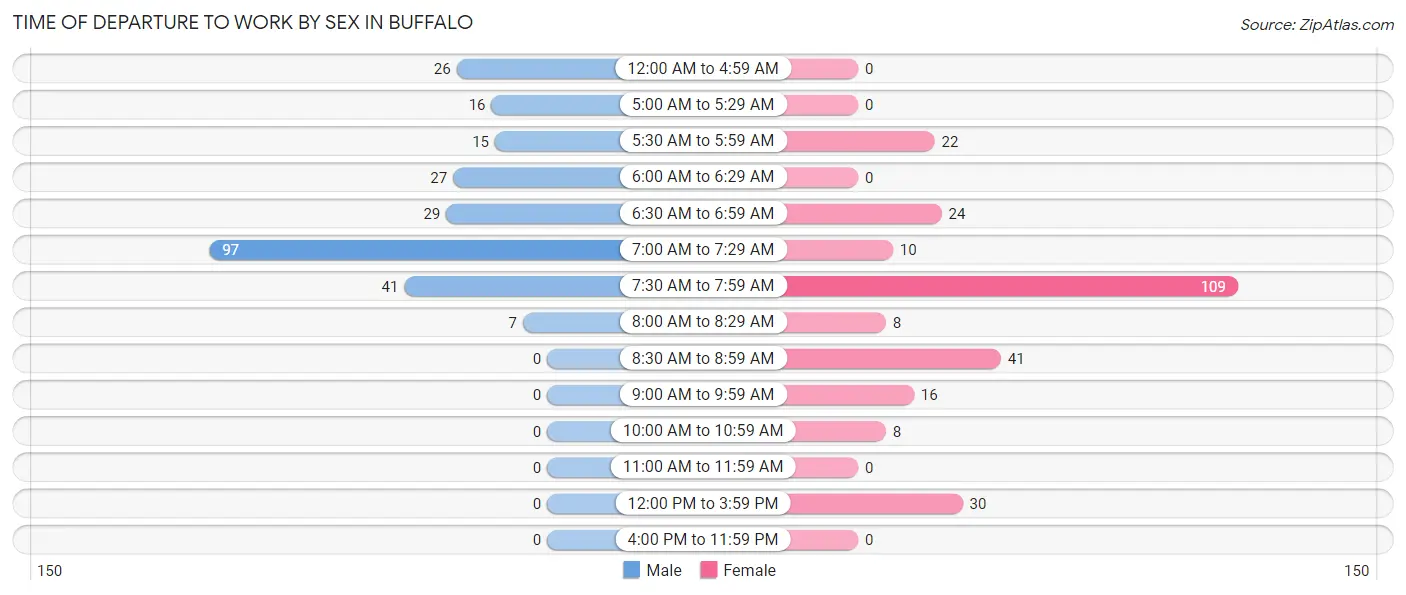
| Time of Departure | Male | Female |
| 12:00 AM to 4:59 AM | 26 (10.1%) | 0 (0.0%) |
| 5:00 AM to 5:29 AM | 16 (6.2%) | 0 (0.0%) |
| 5:30 AM to 5:59 AM | 15 (5.8%) | 22 (8.2%) |
| 6:00 AM to 6:29 AM | 27 (10.5%) | 0 (0.0%) |
| 6:30 AM to 6:59 AM | 29 (11.2%) | 24 (9.0%) |
| 7:00 AM to 7:29 AM | 97 (37.6%) | 10 (3.7%) |
| 7:30 AM to 7:59 AM | 41 (15.9%) | 109 (40.7%) |
| 8:00 AM to 8:29 AM | 7 (2.7%) | 8 (3.0%) |
| 8:30 AM to 8:59 AM | 0 (0.0%) | 41 (15.3%) |
| 9:00 AM to 9:59 AM | 0 (0.0%) | 16 (6.0%) |
| 10:00 AM to 10:59 AM | 0 (0.0%) | 8 (3.0%) |
| 11:00 AM to 11:59 AM | 0 (0.0%) | 0 (0.0%) |
| 12:00 PM to 3:59 PM | 0 (0.0%) | 30 (11.2%) |
| 4:00 PM to 11:59 PM | 0 (0.0%) | 0 (0.0%) |
| Total | 258 (100.0%) | 268 (100.0%) |
Housing Occupancy in Buffalo
Occupancy by Ownership in Buffalo
Of the total 414 dwellings in Buffalo, owner-occupied units account for 349 (84.3%), while renter-occupied units make up 65 (15.7%).
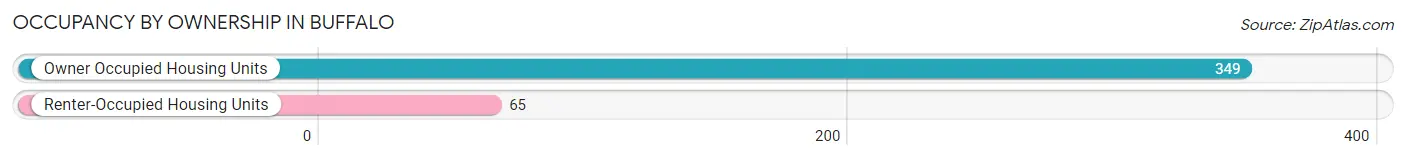
| Occupancy | # Housing Units | % Housing Units |
| Owner Occupied Housing Units | 349 | 84.3% |
| Renter-Occupied Housing Units | 65 | 15.7% |
| Total Occupied Housing Units | 414 | 100.0% |
Occupancy by Household Size in Buffalo
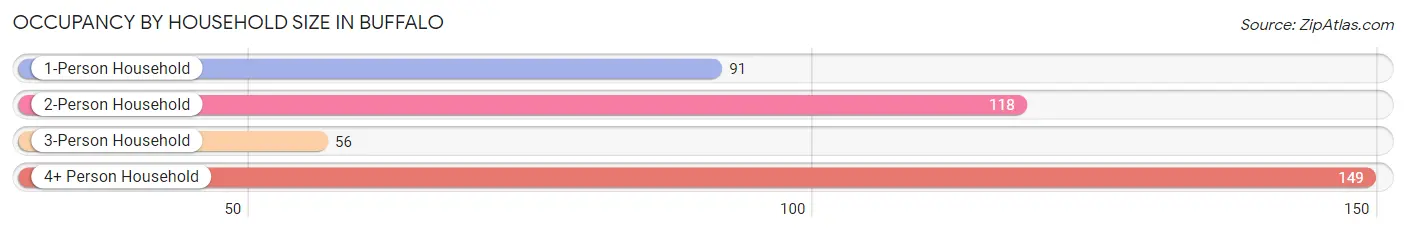
| Household Size | # Housing Units | % Housing Units |
| 1-Person Household | 91 | 22.0% |
| 2-Person Household | 118 | 28.5% |
| 3-Person Household | 56 | 13.5% |
| 4+ Person Household | 149 | 36.0% |
| Total Housing Units | 414 | 100.0% |
Occupancy by Ownership by Household Size in Buffalo
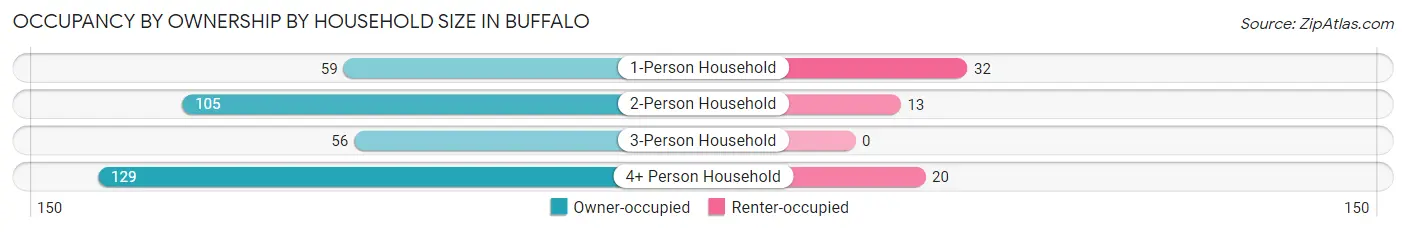
| Household Size | Owner-occupied | Renter-occupied |
| 1-Person Household | 59 (64.8%) | 32 (35.2%) |
| 2-Person Household | 105 (89.0%) | 13 (11.0%) |
| 3-Person Household | 56 (100.0%) | 0 (0.0%) |
| 4+ Person Household | 129 (86.6%) | 20 (13.4%) |
| Total Housing Units | 349 (84.3%) | 65 (15.7%) |
Occupancy by Educational Attainment in Buffalo
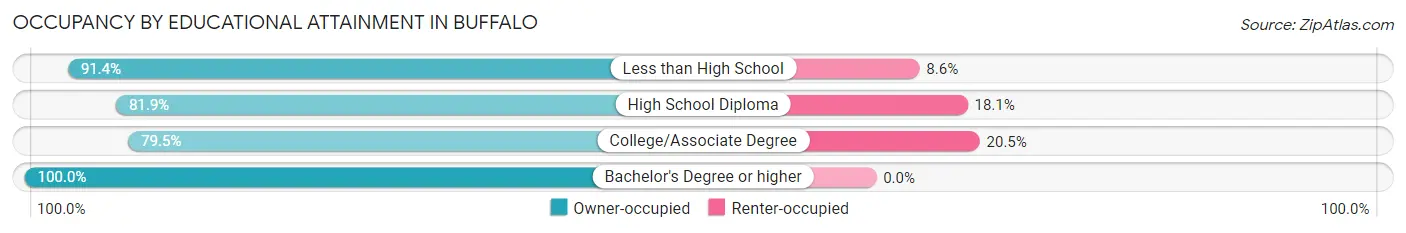
| Household Size | Owner-occupied | Renter-occupied |
| Less than High School | 64 (91.4%) | 6 (8.6%) |
| High School Diploma | 122 (81.9%) | 27 (18.1%) |
| College/Associate Degree | 124 (79.5%) | 32 (20.5%) |
| Bachelor's Degree or higher | 39 (100.0%) | 0 (0.0%) |
Occupancy by Age of Householder in Buffalo
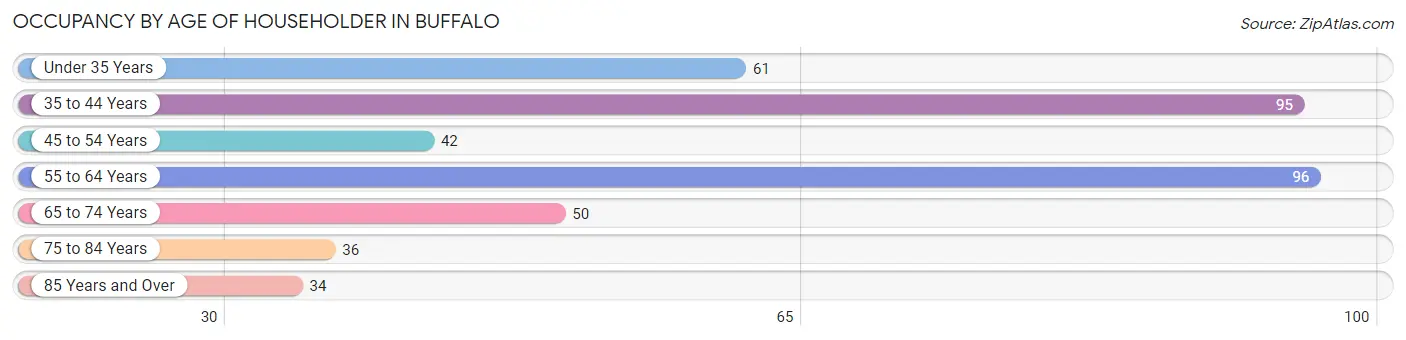
| Age Bracket | # Households | % Households |
| Under 35 Years | 61 | 14.7% |
| 35 to 44 Years | 95 | 23.0% |
| 45 to 54 Years | 42 | 10.1% |
| 55 to 64 Years | 96 | 23.2% |
| 65 to 74 Years | 50 | 12.1% |
| 75 to 84 Years | 36 | 8.7% |
| 85 Years and Over | 34 | 8.2% |
| Total | 414 | 100.0% |
Housing Finances in Buffalo
Median Income by Occupancy in Buffalo
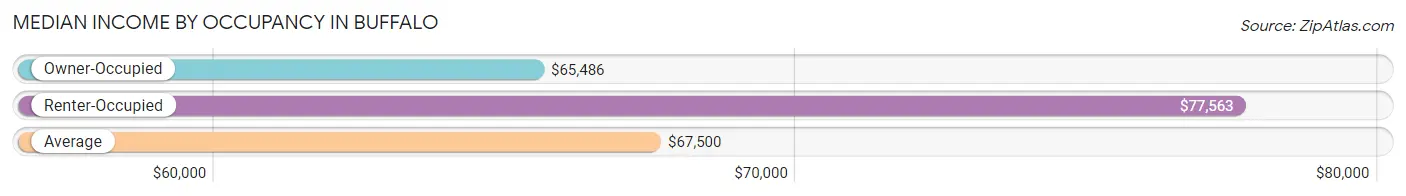
| Occupancy Type | # Households | Median Income |
| Owner-Occupied | 349 (84.3%) | $65,486 |
| Renter-Occupied | 65 (15.7%) | $77,563 |
| Average | 414 (100.0%) | $67,500 |
Occupancy by Householder Income Bracket in Buffalo
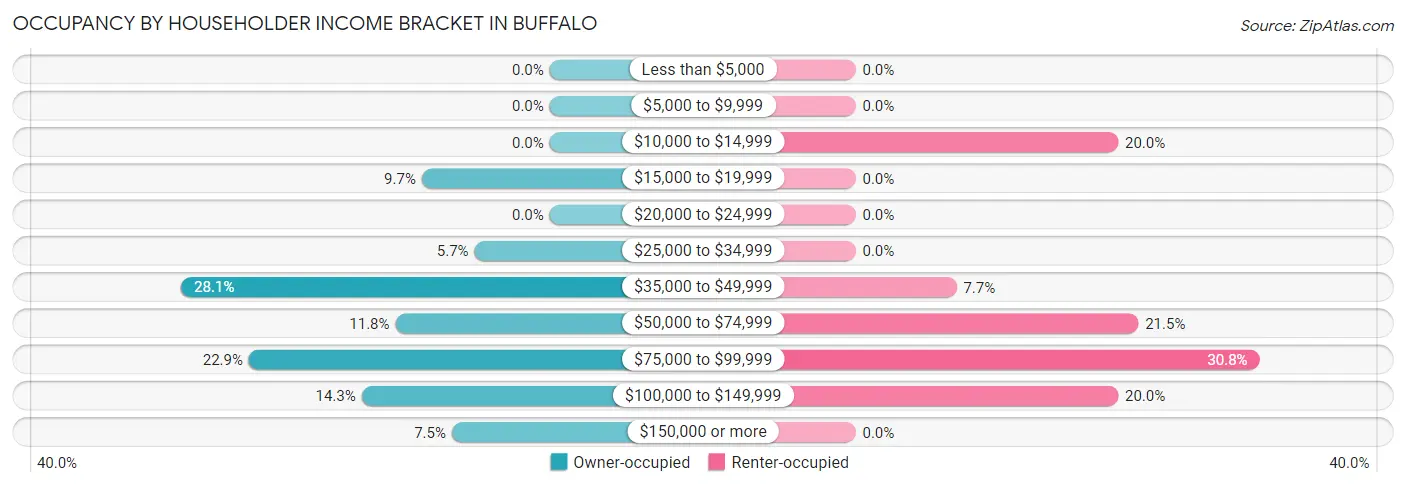
| Income Bracket | Owner-occupied | Renter-occupied |
| Less than $5,000 | 0 (0.0%) | 0 (0.0%) |
| $5,000 to $9,999 | 0 (0.0%) | 0 (0.0%) |
| $10,000 to $14,999 | 0 (0.0%) | 13 (20.0%) |
| $15,000 to $19,999 | 34 (9.7%) | 0 (0.0%) |
| $20,000 to $24,999 | 0 (0.0%) | 0 (0.0%) |
| $25,000 to $34,999 | 20 (5.7%) | 0 (0.0%) |
| $35,000 to $49,999 | 98 (28.1%) | 5 (7.7%) |
| $50,000 to $74,999 | 41 (11.7%) | 14 (21.5%) |
| $75,000 to $99,999 | 80 (22.9%) | 20 (30.8%) |
| $100,000 to $149,999 | 50 (14.3%) | 13 (20.0%) |
| $150,000 or more | 26 (7.4%) | 0 (0.0%) |
| Total | 349 (100.0%) | 65 (100.0%) |
Monthly Housing Cost Tiers in Buffalo
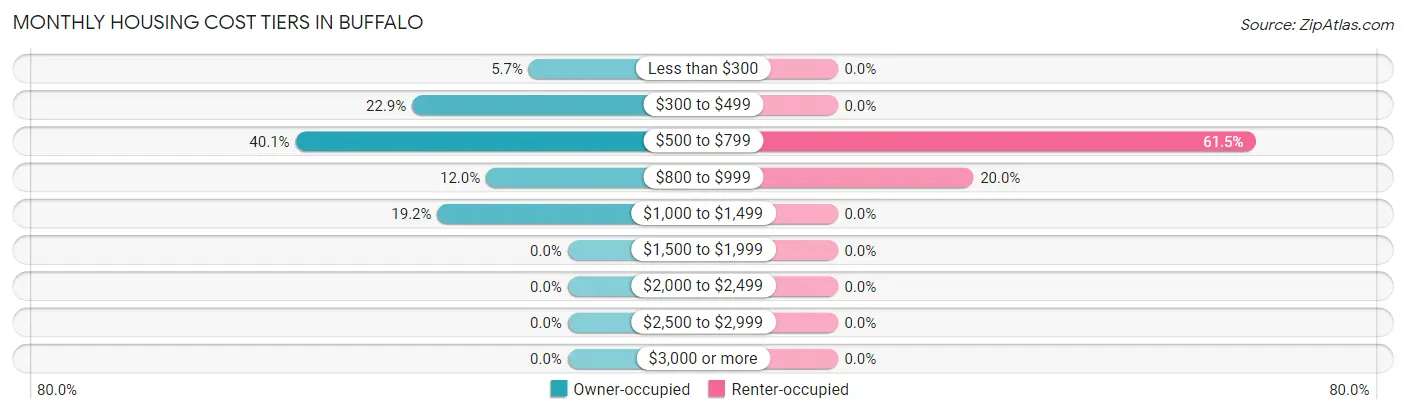
| Monthly Cost | Owner-occupied | Renter-occupied |
| Less than $300 | 20 (5.7%) | 0 (0.0%) |
| $300 to $499 | 80 (22.9%) | 0 (0.0%) |
| $500 to $799 | 140 (40.1%) | 40 (61.5%) |
| $800 to $999 | 42 (12.0%) | 13 (20.0%) |
| $1,000 to $1,499 | 67 (19.2%) | 0 (0.0%) |
| $1,500 to $1,999 | 0 (0.0%) | 0 (0.0%) |
| $2,000 to $2,499 | 0 (0.0%) | 0 (0.0%) |
| $2,500 to $2,999 | 0 (0.0%) | 0 (0.0%) |
| $3,000 or more | 0 (0.0%) | 0 (0.0%) |
| Total | 349 (100.0%) | 65 (100.0%) |
Physical Housing Characteristics in Buffalo
Housing Structures in Buffalo
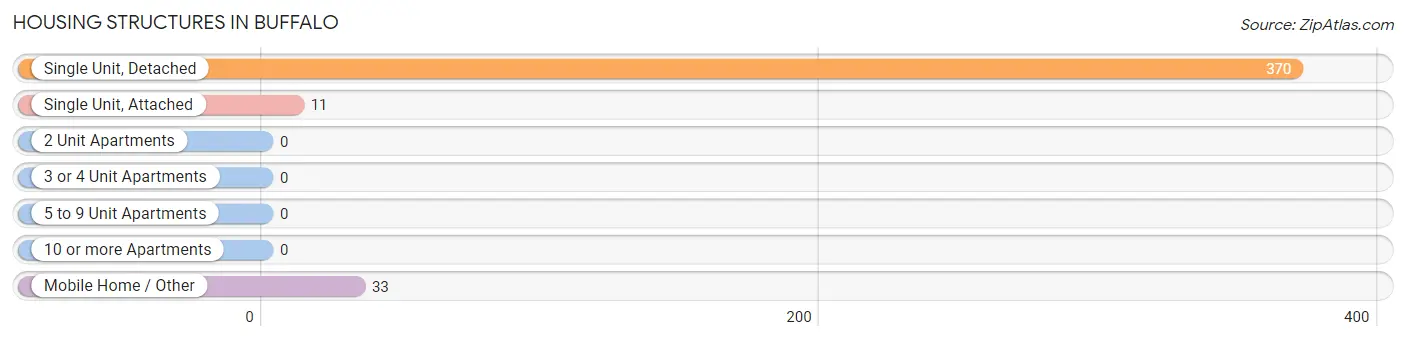
| Structure Type | # Housing Units | % Housing Units |
| Single Unit, Detached | 370 | 89.4% |
| Single Unit, Attached | 11 | 2.7% |
| 2 Unit Apartments | 0 | 0.0% |
| 3 or 4 Unit Apartments | 0 | 0.0% |
| 5 to 9 Unit Apartments | 0 | 0.0% |
| 10 or more Apartments | 0 | 0.0% |
| Mobile Home / Other | 33 | 8.0% |
| Total | 414 | 100.0% |
Housing Structures by Occupancy in Buffalo
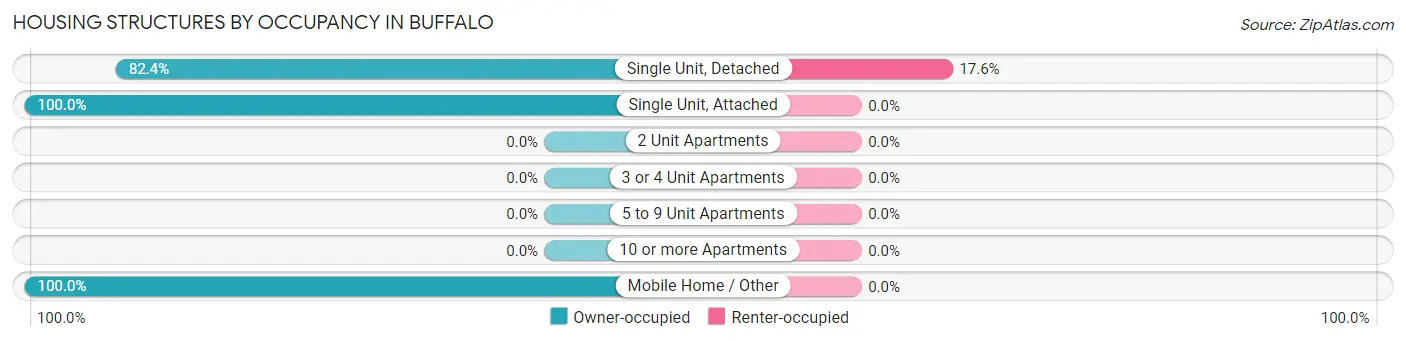
| Structure Type | Owner-occupied | Renter-occupied |
| Single Unit, Detached | 305 (82.4%) | 65 (17.6%) |
| Single Unit, Attached | 11 (100.0%) | 0 (0.0%) |
| 2 Unit Apartments | 0 (0.0%) | 0 (0.0%) |
| 3 or 4 Unit Apartments | 0 (0.0%) | 0 (0.0%) |
| 5 to 9 Unit Apartments | 0 (0.0%) | 0 (0.0%) |
| 10 or more Apartments | 0 (0.0%) | 0 (0.0%) |
| Mobile Home / Other | 33 (100.0%) | 0 (0.0%) |
| Total | 349 (84.3%) | 65 (15.7%) |
Housing Structures by Number of Rooms in Buffalo
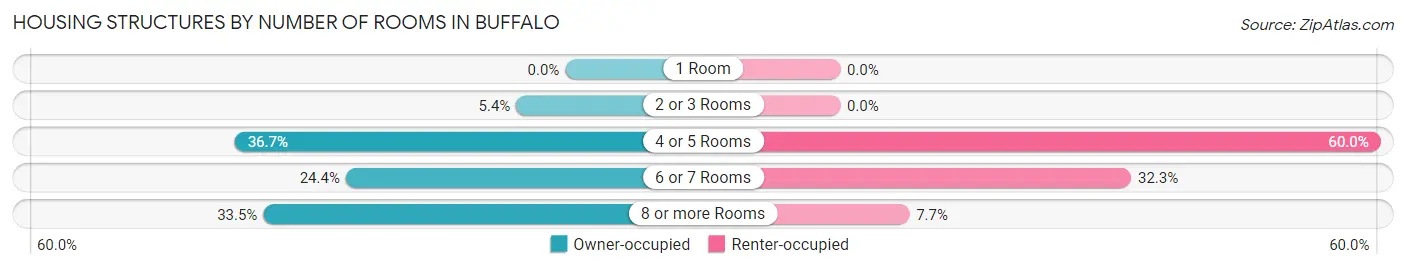
| Number of Rooms | Owner-occupied | Renter-occupied |
| 1 Room | 0 (0.0%) | 0 (0.0%) |
| 2 or 3 Rooms | 19 (5.4%) | 0 (0.0%) |
| 4 or 5 Rooms | 128 (36.7%) | 39 (60.0%) |
| 6 or 7 Rooms | 85 (24.4%) | 21 (32.3%) |
| 8 or more Rooms | 117 (33.5%) | 5 (7.7%) |
| Total | 349 (100.0%) | 65 (100.0%) |
Housing Structure by Heating Type in Buffalo
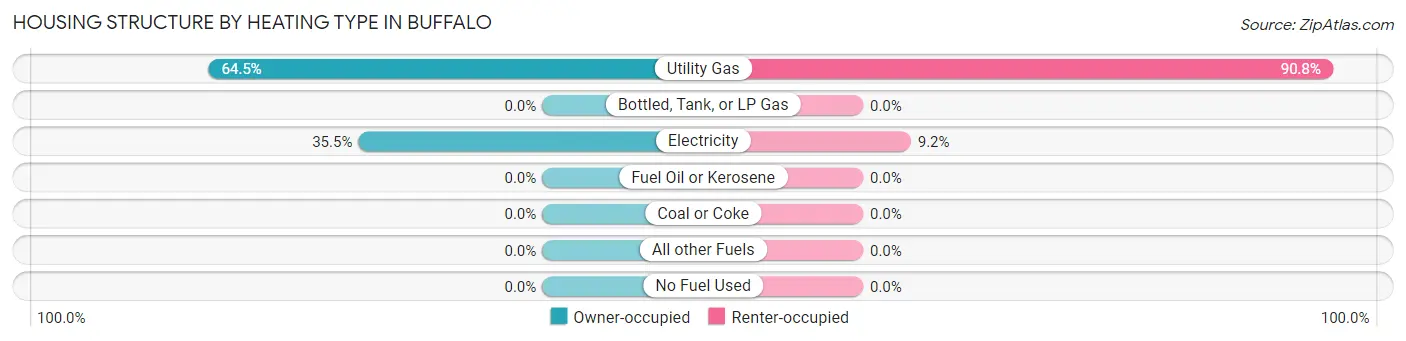
| Heating Type | Owner-occupied | Renter-occupied |
| Utility Gas | 225 (64.5%) | 59 (90.8%) |
| Bottled, Tank, or LP Gas | 0 (0.0%) | 0 (0.0%) |
| Electricity | 124 (35.5%) | 6 (9.2%) |
| Fuel Oil or Kerosene | 0 (0.0%) | 0 (0.0%) |
| Coal or Coke | 0 (0.0%) | 0 (0.0%) |
| All other Fuels | 0 (0.0%) | 0 (0.0%) |
| No Fuel Used | 0 (0.0%) | 0 (0.0%) |
| Total | 349 (100.0%) | 65 (100.0%) |
Household Vehicle Usage in Buffalo
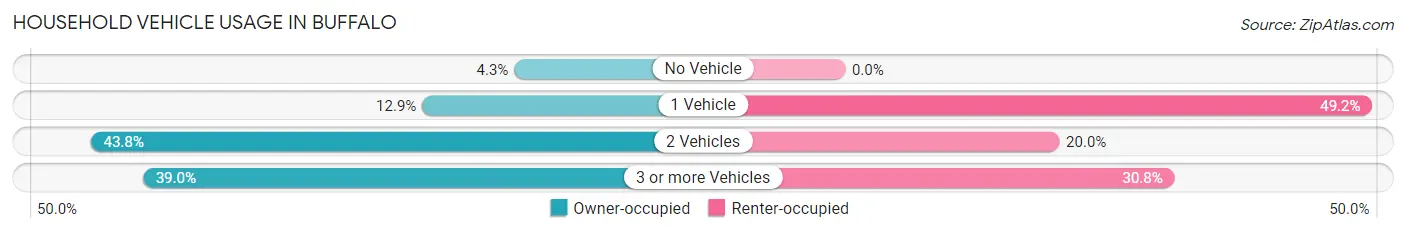
| Vehicles per Household | Owner-occupied | Renter-occupied |
| No Vehicle | 15 (4.3%) | 0 (0.0%) |
| 1 Vehicle | 45 (12.9%) | 32 (49.2%) |
| 2 Vehicles | 153 (43.8%) | 13 (20.0%) |
| 3 or more Vehicles | 136 (39.0%) | 20 (30.8%) |
| Total | 349 (100.0%) | 65 (100.0%) |
Real Estate & Mortgages in Buffalo
Real Estate and Mortgage Overview in Buffalo
| Characteristic | Without Mortgage | With Mortgage |
| Housing Units | 240 | 109 |
| Median Property Value | $93,700 | $76,200 |
| Median Household Income | $47,143 | $6 |
| Monthly Housing Costs | $522 | $0 |
| Real Estate Taxes | $657 | $0 |
Property Value by Mortgage Status in Buffalo
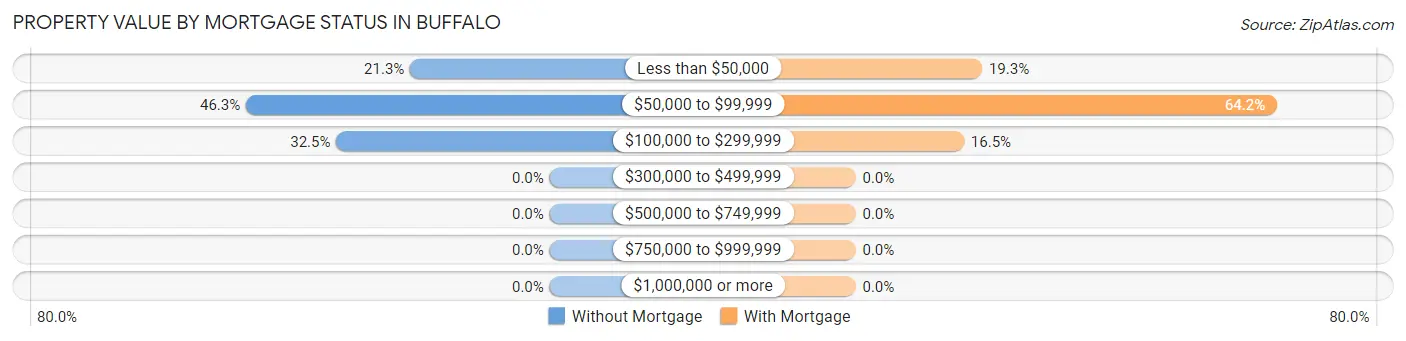
| Property Value | Without Mortgage | With Mortgage |
| Less than $50,000 | 51 (21.2%) | 21 (19.3%) |
| $50,000 to $99,999 | 111 (46.3%) | 70 (64.2%) |
| $100,000 to $299,999 | 78 (32.5%) | 18 (16.5%) |
| $300,000 to $499,999 | 0 (0.0%) | 0 (0.0%) |
| $500,000 to $749,999 | 0 (0.0%) | 0 (0.0%) |
| $750,000 to $999,999 | 0 (0.0%) | 0 (0.0%) |
| $1,000,000 or more | 0 (0.0%) | 0 (0.0%) |
| Total | 240 (100.0%) | 109 (100.0%) |
Household Income by Mortgage Status in Buffalo
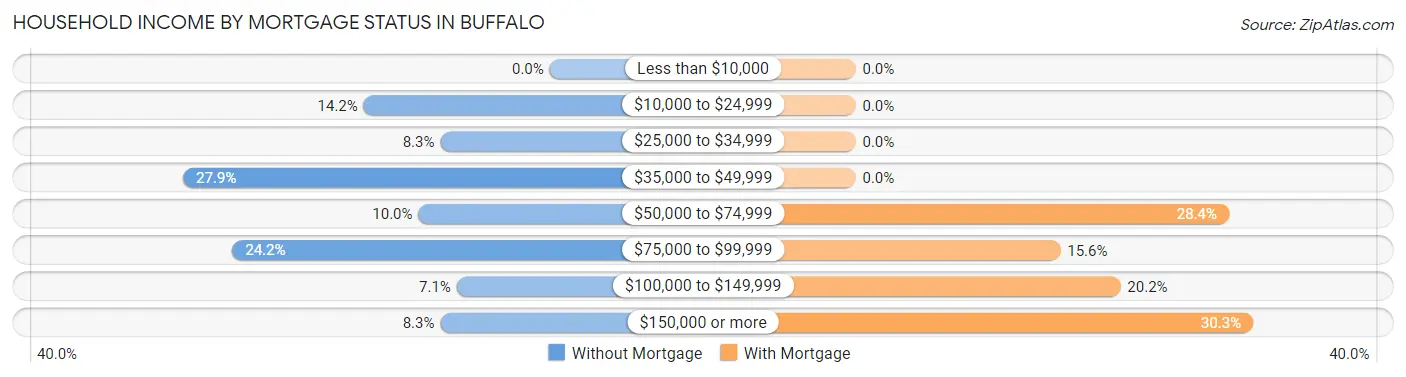
| Household Income | Without Mortgage | With Mortgage |
| Less than $10,000 | 0 (0.0%) | 0 (0.0%) |
| $10,000 to $24,999 | 34 (14.2%) | 0 (0.0%) |
| $25,000 to $34,999 | 20 (8.3%) | 0 (0.0%) |
| $35,000 to $49,999 | 67 (27.9%) | 0 (0.0%) |
| $50,000 to $74,999 | 24 (10.0%) | 31 (28.4%) |
| $75,000 to $99,999 | 58 (24.2%) | 17 (15.6%) |
| $100,000 to $149,999 | 17 (7.1%) | 22 (20.2%) |
| $150,000 or more | 20 (8.3%) | 33 (30.3%) |
| Total | 240 (100.0%) | 109 (100.0%) |
Property Value to Household Income Ratio in Buffalo
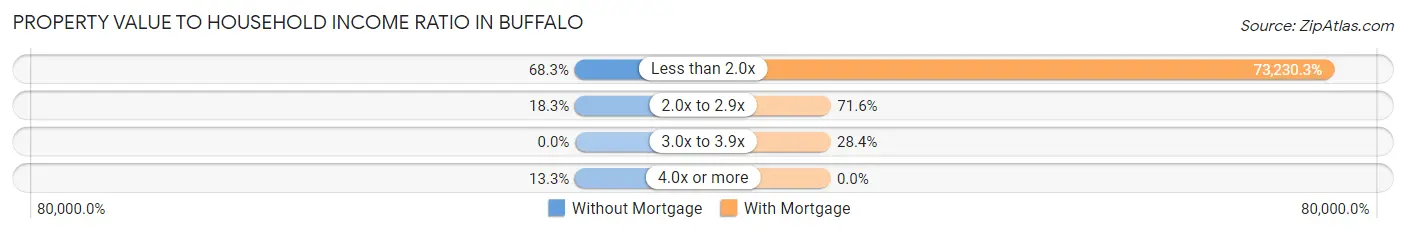
| Value-to-Income Ratio | Without Mortgage | With Mortgage |
| Less than 2.0x | 164 (68.3%) | 79,821 (73,230.3%) |
| 2.0x to 2.9x | 44 (18.3%) | 78 (71.6%) |
| 3.0x to 3.9x | 0 (0.0%) | 31 (28.4%) |
| 4.0x or more | 32 (13.3%) | 0 (0.0%) |
| Total | 240 (100.0%) | 109 (100.0%) |
Real Estate Taxes by Mortgage Status in Buffalo
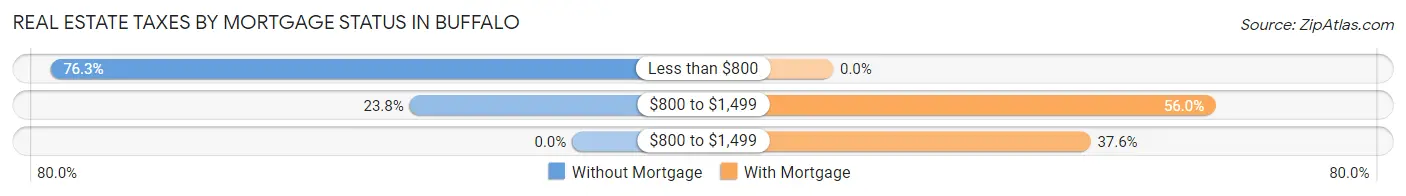
| Property Taxes | Without Mortgage | With Mortgage |
| Less than $800 | 183 (76.2%) | 0 (0.0%) |
| $800 to $1,499 | 57 (23.7%) | 61 (56.0%) |
| $800 to $1,499 | 0 (0.0%) | 41 (37.6%) |
| Total | 240 (100.0%) | 109 (100.0%) |
Health & Disability in Buffalo
Health Insurance Coverage by Age in Buffalo
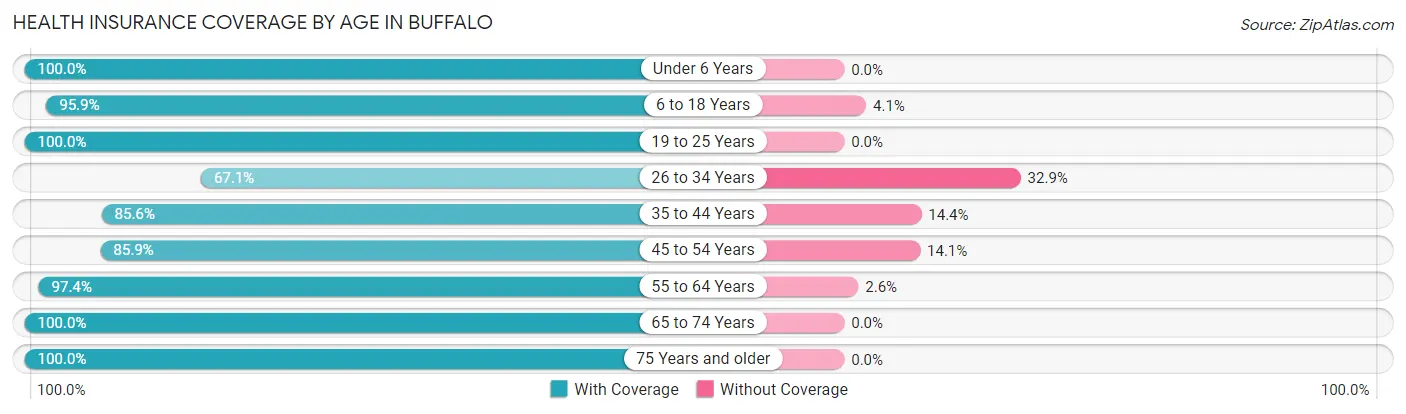
| Age Bracket | With Coverage | Without Coverage |
| Under 6 Years | 107 (100.0%) | 0 (0.0%) |
| 6 to 18 Years | 260 (95.9%) | 11 (4.1%) |
| 19 to 25 Years | 10 (100.0%) | 0 (0.0%) |
| 26 to 34 Years | 100 (67.1%) | 49 (32.9%) |
| 35 to 44 Years | 143 (85.6%) | 24 (14.4%) |
| 45 to 54 Years | 85 (85.9%) | 14 (14.1%) |
| 55 to 64 Years | 223 (97.4%) | 6 (2.6%) |
| 65 to 74 Years | 92 (100.0%) | 0 (0.0%) |
| 75 Years and older | 93 (100.0%) | 0 (0.0%) |
| Total | 1,113 (91.4%) | 104 (8.6%) |
Health Insurance Coverage by Citizenship Status in Buffalo
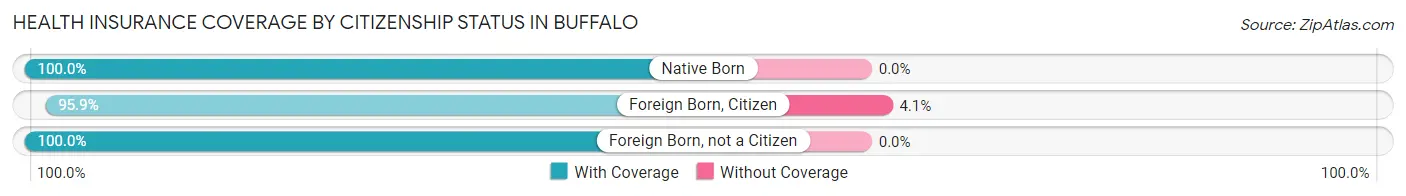
| Citizenship Status | With Coverage | Without Coverage |
| Native Born | 107 (100.0%) | 0 (0.0%) |
| Foreign Born, Citizen | 260 (95.9%) | 11 (4.1%) |
| Foreign Born, not a Citizen | 10 (100.0%) | 0 (0.0%) |
Health Insurance Coverage by Household Income in Buffalo
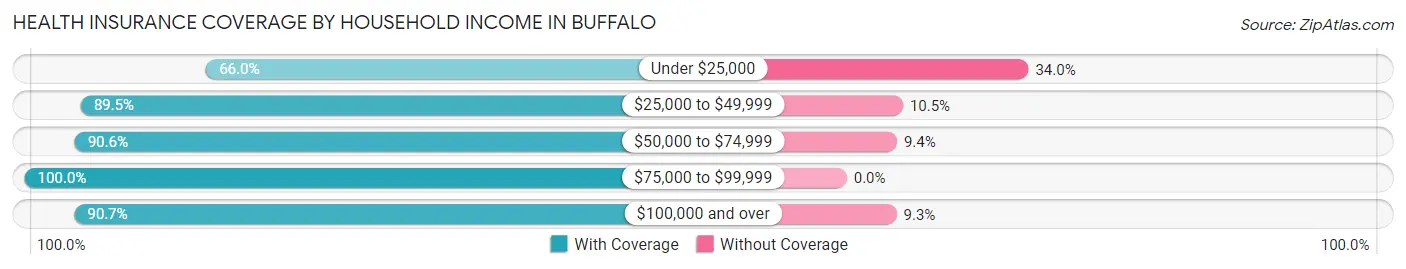
| Household Income | With Coverage | Without Coverage |
| Under $25,000 | 31 (66.0%) | 16 (34.0%) |
| $25,000 to $49,999 | 417 (89.5%) | 49 (10.5%) |
| $50,000 to $74,999 | 135 (90.6%) | 14 (9.4%) |
| $75,000 to $99,999 | 287 (100.0%) | 0 (0.0%) |
| $100,000 and over | 243 (90.7%) | 25 (9.3%) |
Public vs Private Health Insurance Coverage by Age in Buffalo
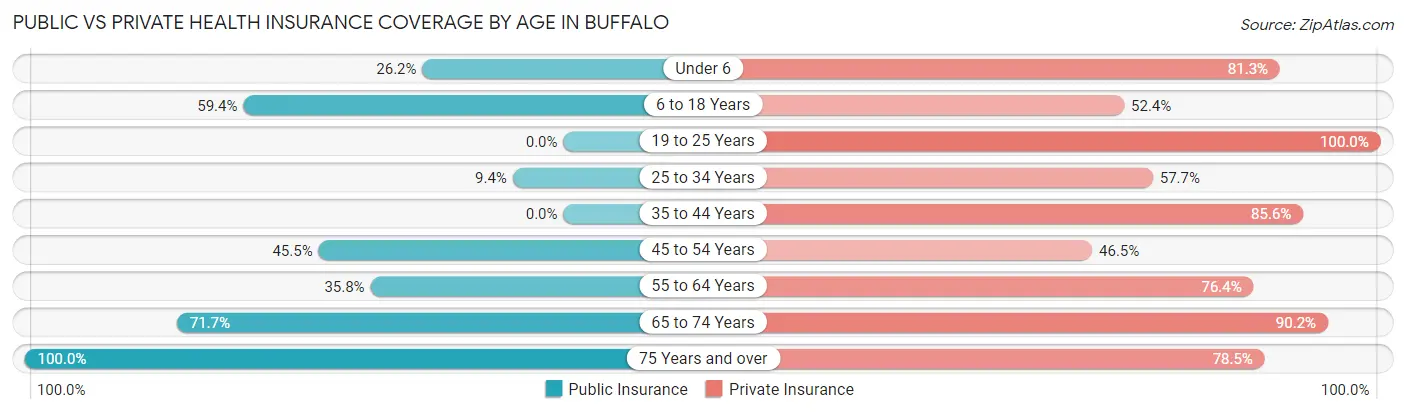
| Age Bracket | Public Insurance | Private Insurance |
| Under 6 | 28 (26.2%) | 87 (81.3%) |
| 6 to 18 Years | 161 (59.4%) | 142 (52.4%) |
| 19 to 25 Years | 0 (0.0%) | 10 (100.0%) |
| 25 to 34 Years | 14 (9.4%) | 86 (57.7%) |
| 35 to 44 Years | 0 (0.0%) | 143 (85.6%) |
| 45 to 54 Years | 45 (45.5%) | 46 (46.5%) |
| 55 to 64 Years | 82 (35.8%) | 175 (76.4%) |
| 65 to 74 Years | 66 (71.7%) | 83 (90.2%) |
| 75 Years and over | 93 (100.0%) | 73 (78.5%) |
| Total | 489 (40.2%) | 845 (69.4%) |
Disability Status by Sex by Age in Buffalo
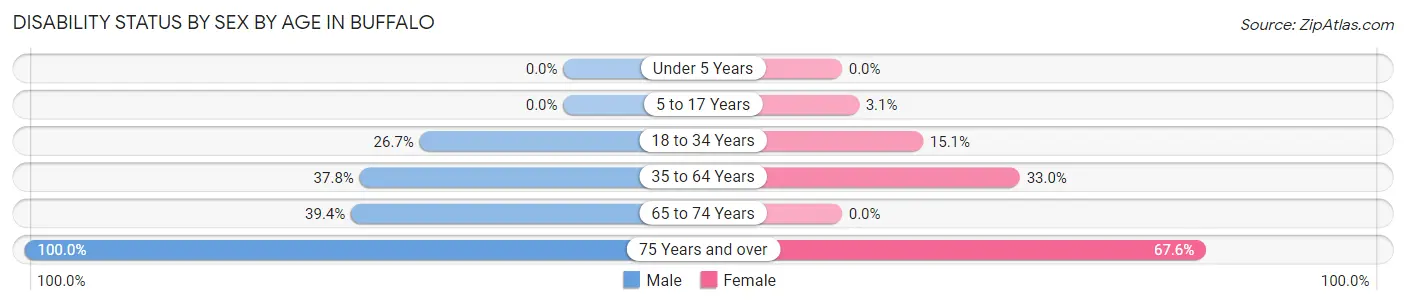
| Age Bracket | Male | Female |
| Under 5 Years | 0 (0.0%) | 0 (0.0%) |
| 5 to 17 Years | 0 (0.0%) | 5 (3.1%) |
| 18 to 34 Years | 20 (26.7%) | 14 (15.0%) |
| 35 to 64 Years | 107 (37.8%) | 70 (33.0%) |
| 65 to 74 Years | 13 (39.4%) | 0 (0.0%) |
| 75 Years and over | 22 (100.0%) | 48 (67.6%) |
Disability Class by Sex by Age in Buffalo
Disability Class: Hearing Difficulty
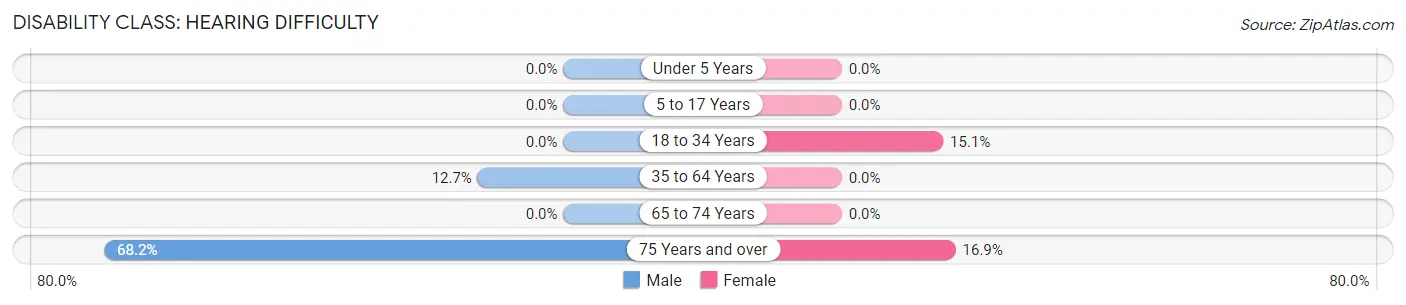
| Age Bracket | Male | Female |
| Under 5 Years | 0 (0.0%) | 0 (0.0%) |
| 5 to 17 Years | 0 (0.0%) | 0 (0.0%) |
| 18 to 34 Years | 0 (0.0%) | 14 (15.0%) |
| 35 to 64 Years | 36 (12.7%) | 0 (0.0%) |
| 65 to 74 Years | 0 (0.0%) | 0 (0.0%) |
| 75 Years and over | 15 (68.2%) | 12 (16.9%) |
Disability Class: Vision Difficulty
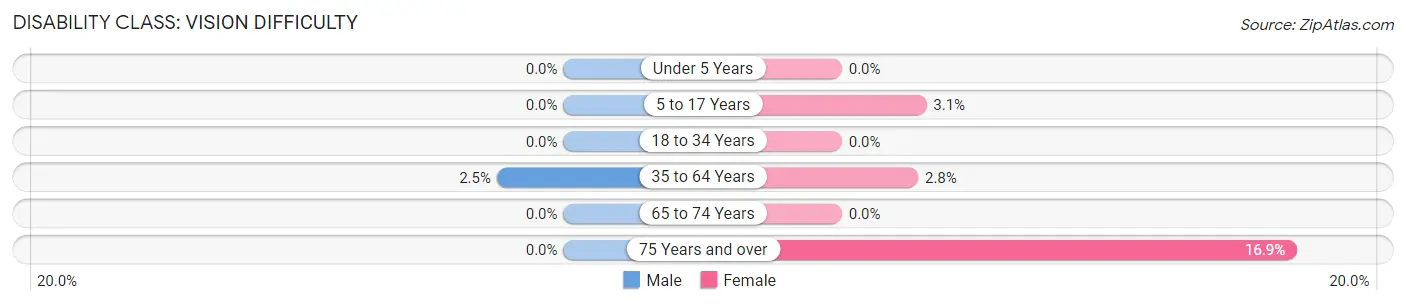
| Age Bracket | Male | Female |
| Under 5 Years | 0 (0.0%) | 0 (0.0%) |
| 5 to 17 Years | 0 (0.0%) | 5 (3.1%) |
| 18 to 34 Years | 0 (0.0%) | 0 (0.0%) |
| 35 to 64 Years | 7 (2.5%) | 6 (2.8%) |
| 65 to 74 Years | 0 (0.0%) | 0 (0.0%) |
| 75 Years and over | 0 (0.0%) | 12 (16.9%) |
Disability Class: Cognitive Difficulty
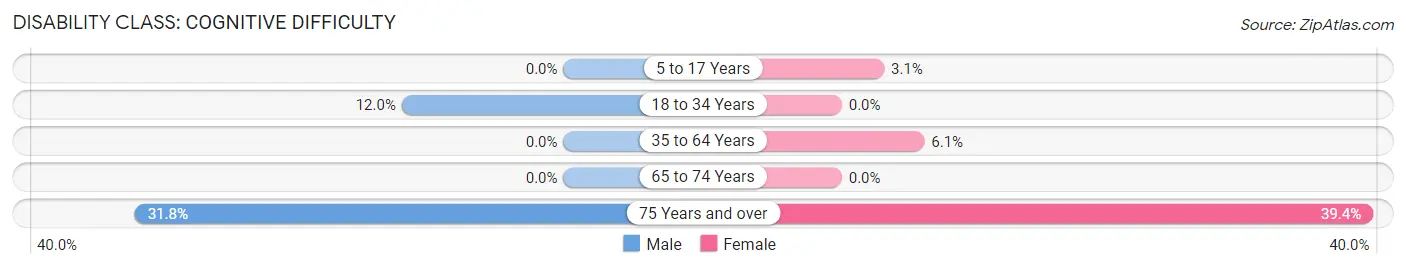
| Age Bracket | Male | Female |
| 5 to 17 Years | 0 (0.0%) | 5 (3.1%) |
| 18 to 34 Years | 9 (12.0%) | 0 (0.0%) |
| 35 to 64 Years | 0 (0.0%) | 13 (6.1%) |
| 65 to 74 Years | 0 (0.0%) | 0 (0.0%) |
| 75 Years and over | 7 (31.8%) | 28 (39.4%) |
Disability Class: Ambulatory Difficulty
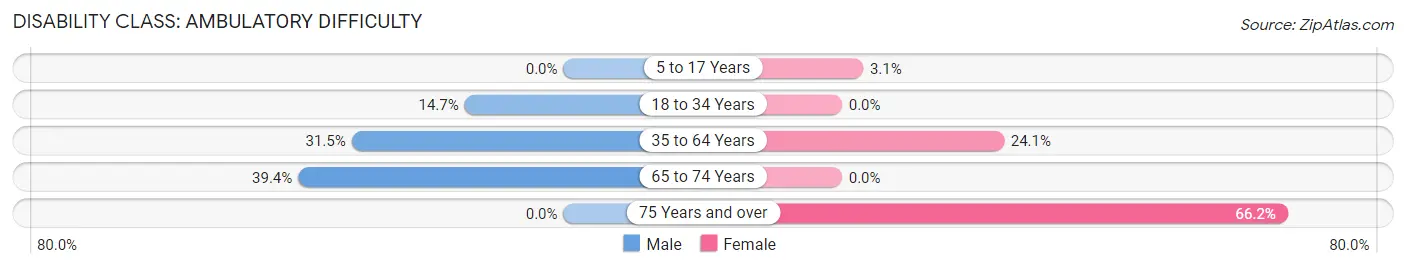
| Age Bracket | Male | Female |
| 5 to 17 Years | 0 (0.0%) | 5 (3.1%) |
| 18 to 34 Years | 11 (14.7%) | 0 (0.0%) |
| 35 to 64 Years | 89 (31.5%) | 51 (24.1%) |
| 65 to 74 Years | 13 (39.4%) | 0 (0.0%) |
| 75 Years and over | 0 (0.0%) | 47 (66.2%) |
Disability Class: Self-Care Difficulty
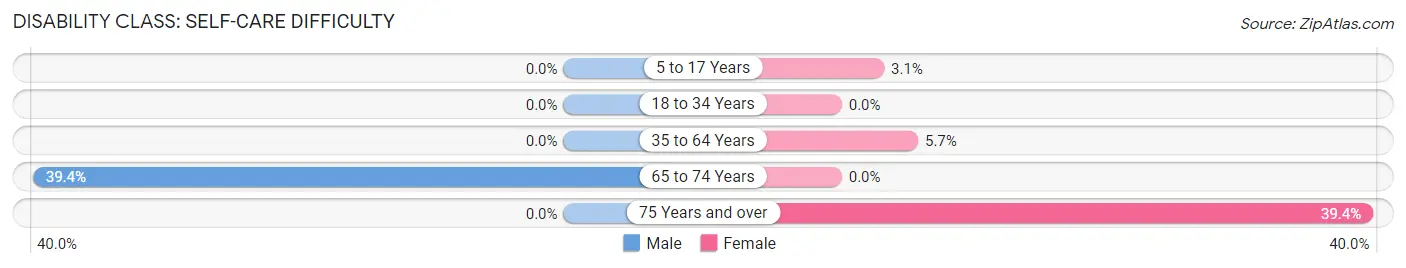
| Age Bracket | Male | Female |
| 5 to 17 Years | 0 (0.0%) | 5 (3.1%) |
| 18 to 34 Years | 0 (0.0%) | 0 (0.0%) |
| 35 to 64 Years | 0 (0.0%) | 12 (5.7%) |
| 65 to 74 Years | 13 (39.4%) | 0 (0.0%) |
| 75 Years and over | 0 (0.0%) | 28 (39.4%) |
Technology Access in Buffalo
Computing Device Access in Buffalo
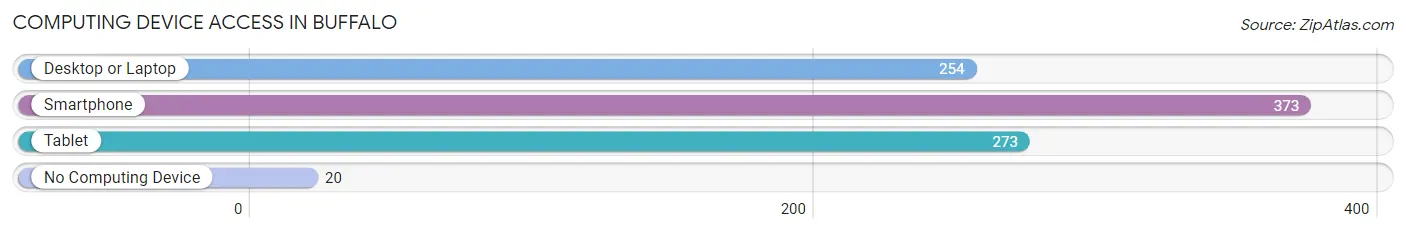
| Device Type | # Households | % Households |
| Desktop or Laptop | 254 | 61.4% |
| Smartphone | 373 | 90.1% |
| Tablet | 273 | 65.9% |
| No Computing Device | 20 | 4.8% |
| Total | 414 | 100.0% |
Internet Access in Buffalo
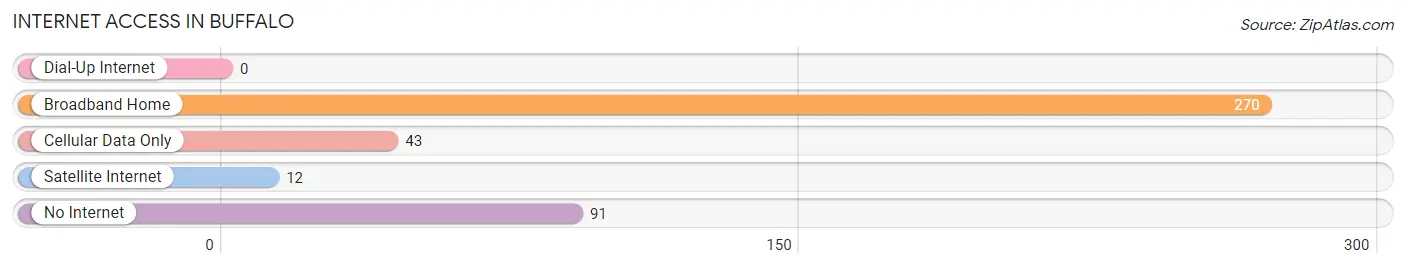
| Internet Type | # Households | % Households |
| Dial-Up Internet | 0 | 0.0% |
| Broadband Home | 270 | 65.2% |
| Cellular Data Only | 43 | 10.4% |
| Satellite Internet | 12 | 2.9% |
| No Internet | 91 | 22.0% |
| Total | 414 | 100.0% |
Buffalo Summary
Buffalo, Oklahoma is a small town located in Harper County, Oklahoma. It is situated in the northwest corner of the state, near the Oklahoma-Kansas border. The town was founded in 1891 and was named after Buffalo Creek, which runs through the area. The population of Buffalo was estimated to be 545 in 2020.
Geography
Buffalo is located in the northwest corner of Oklahoma, near the Oklahoma-Kansas border. It is situated in the Red Bed Plains region of the state, which is characterized by flat terrain and red-colored soil. The town is located at an elevation of 1,541 feet above sea level. The climate in Buffalo is semi-arid, with hot summers and cold winters. The average annual temperature is around 60 degrees Fahrenheit.
Economy
The economy of Buffalo is largely based on agriculture. The town is home to several farms, which produce wheat, corn, and other crops. Buffalo also has a small manufacturing sector, which produces a variety of products, including furniture, clothing, and food products. The town also has a few retail stores, restaurants, and other businesses.
Demographics
As of the 2020 census, the population of Buffalo was estimated to be 545. The racial makeup of the town was 95.2% White, 0.7% African American, 0.4% Native American, 0.2% Asian, 0.1% Pacific Islander, and 3.4% from other races. The median household income in Buffalo was $37,917, and the median age was 44.
History
Buffalo was founded in 1891 and was named after Buffalo Creek, which runs through the area. The town was originally a stop on the Santa Fe Railroad, and it quickly grew into a small farming community. In the early 1900s, the town was home to several businesses, including a bank, a hotel, and a general store.
In the 1920s, Buffalo experienced a period of growth and prosperity. The town was home to several businesses, including a movie theater, a bowling alley, and a grocery store. However, the Great Depression of the 1930s caused the town to decline. In the 1940s, the town was home to a few small businesses, including a gas station and a cafe.
In the 1950s, Buffalo experienced a period of growth and prosperity. The town was home to several businesses, including a hardware store, a grocery store, and a restaurant. In the 1960s, the town was home to several businesses, including a bank, a hotel, and a general store.
In the 1970s, Buffalo experienced a period of decline. The town was home to several businesses, including a gas station and a cafe. In the 1980s, the town was home to a few small businesses, including a hardware store and a grocery store.
In the 1990s, Buffalo experienced a period of growth and prosperity. The town was home to several businesses, including a bank, a hotel, and a general store. In the 2000s, the town was home to several businesses, including a movie theater, a bowling alley, and a grocery store.
Today, Buffalo is a small town with a population of around 545. The town is home to several businesses, including a bank, a hotel, and a general store. The town is also home to several farms, which produce wheat, corn, and other crops.
Common Questions
What is Per Capita Income in Buffalo?
Per Capita income in Buffalo is $24,540.
What is the Median Family Income in Buffalo?
Median Family Income in Buffalo is $84,667.
What is the Median Household income in Buffalo?
Median Household Income in Buffalo is $67,500.
What is Income or Wage Gap in Buffalo?
Income or Wage Gap in Buffalo is 30.4%.
Women in Buffalo earn 69.6 cents for every dollar earned by a man.
What is Inequality or Gini Index in Buffalo?
Inequality or Gini Index in Buffalo is 0.33.
What is the Total Population of Buffalo?
Total Population of Buffalo is 1,273.
What is the Total Male Population of Buffalo?
Total Male Population of Buffalo is 575.
What is the Total Female Population of Buffalo?
Total Female Population of Buffalo is 698.
What is the Ratio of Males per 100 Females in Buffalo?
There are 82.38 Males per 100 Females in Buffalo.
What is the Ratio of Females per 100 Males in Buffalo?
There are 121.39 Females per 100 Males in Buffalo.
What is the Median Population Age in Buffalo?
Median Population Age in Buffalo is 39.4 Years.
What is the Average Family Size in Buffalo
Average Family Size in Buffalo is 3.2 People.
What is the Average Household Size in Buffalo
Average Household Size in Buffalo is 2.9 People.
How Large is the Labor Force in Buffalo?
There are 541 People in the Labor Forcein in Buffalo.
What is the Percentage of People in the Labor Force in Buffalo?
56.9% of People are in the Labor Force in Buffalo.
What is the Unemployment Rate in Buffalo?
Unemployment Rate in Buffalo is 2.8%.