Lenapah, OK Map & Demographics
Lenapah Map
Lenapah Overview
$21,834
PER CAPITA INCOME
$58,393
AVG FAMILY INCOME
$57,656
AVG HOUSEHOLD INCOME
62.9%
WAGE / INCOME GAP [ % ]
37.1¢/ $1
WAGE / INCOME GAP [ $ ]
0.33
INEQUALITY / GINI INDEX
268
TOTAL POPULATION
152
MALE POPULATION
116
FEMALE POPULATION
131.03
MALES / 100 FEMALES
76.32
FEMALES / 100 MALES
28.7
MEDIAN AGE
3.2
AVG FAMILY SIZE
3.0
AVG HOUSEHOLD SIZE
118
LABOR FORCE [ PEOPLE ]
60.5%
PERCENT IN LABOR FORCE
1.7%
UNEMPLOYMENT RATE
Lenapah Zip Codes
Lenapah Area Codes
Income in Lenapah
Income Overview in Lenapah
Per Capita Income in Lenapah is $21,834, while median incomes of families and households are $58,393 and $57,656 respectively.
| Characteristic | Number | Measure |
| Per Capita Income | 268 | $21,834 |
| Median Family Income | 72 | $58,393 |
| Mean Family Income | 72 | $63,851 |
| Median Household Income | 90 | $57,656 |
| Mean Household Income | 90 | $58,943 |
| Income Deficit | 72 | $0 |
| Wage / Income Gap (%) | 268 | 62.86% |
| Wage / Income Gap ($) | 268 | 37.14¢ per $1 |
| Gini / Inequality Index | 268 | 0.33 |
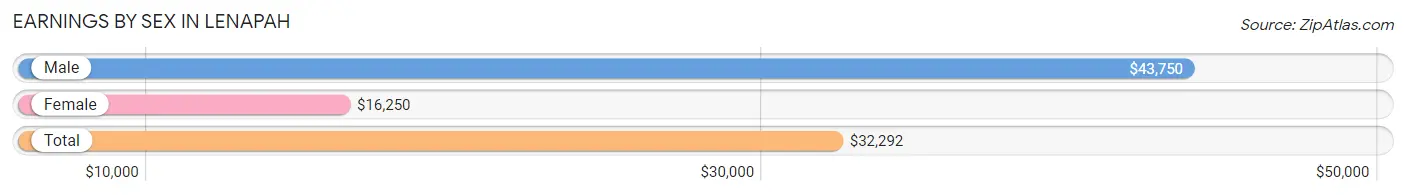
Earnings by Sex in Lenapah
Average Earnings in Lenapah are $32,292, $43,750 for men and $16,250 for women, a difference of 62.9%.
| Sex | Number | Average Earnings |
| Male | 67 (56.3%) | $43,750 |
| Female | 52 (43.7%) | $16,250 |
| Total | 119 (100.0%) | $32,292 |
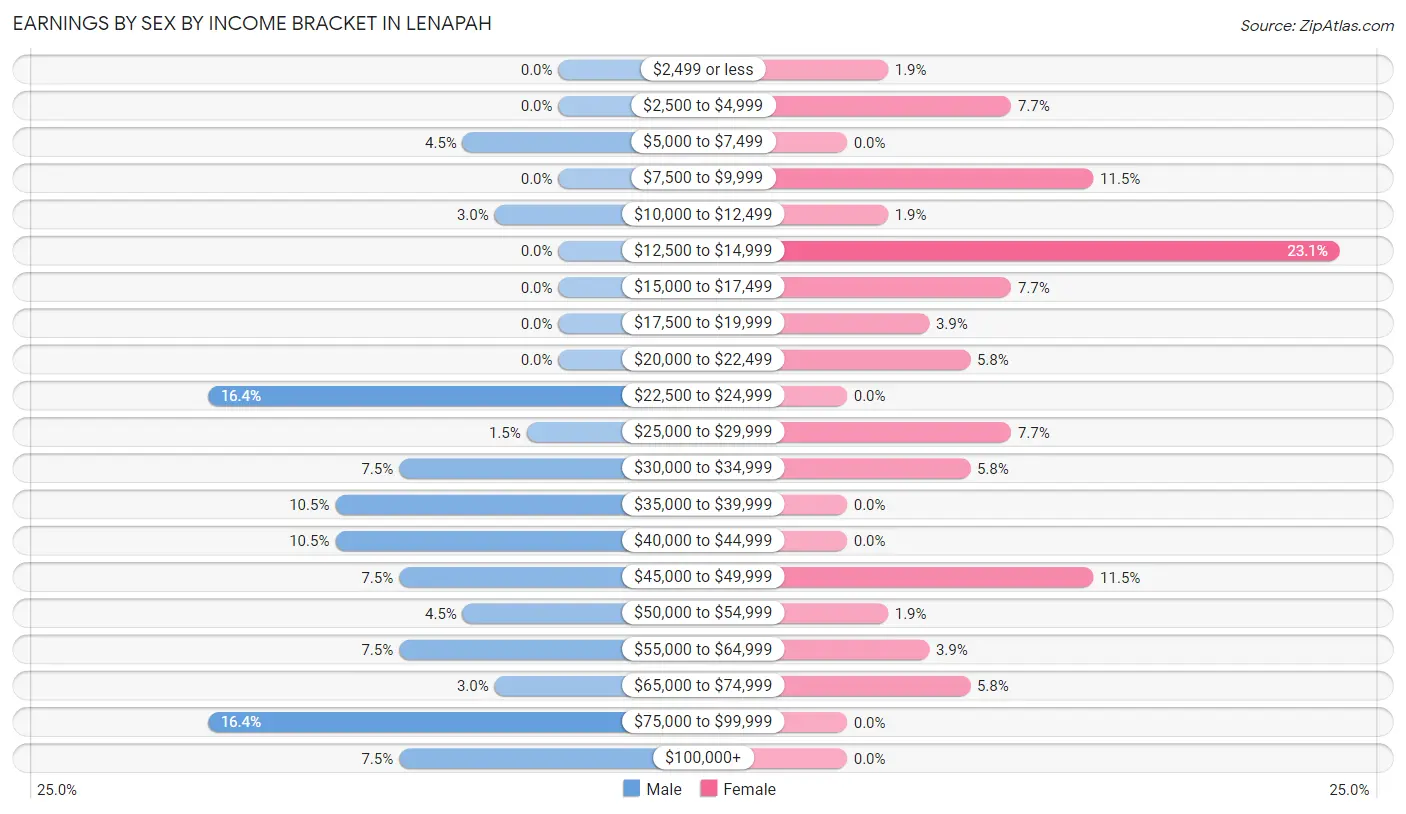
Earnings by Sex by Income Bracket in Lenapah
The most common earnings brackets in Lenapah are $22,500 to $24,999 for men (11 | 16.4%) and $12,500 to $14,999 for women (12 | 23.1%).
| Income | Male | Female |
| $2,499 or less | 0 (0.0%) | 1 (1.9%) |
| $2,500 to $4,999 | 0 (0.0%) | 4 (7.7%) |
| $5,000 to $7,499 | 3 (4.5%) | 0 (0.0%) |
| $7,500 to $9,999 | 0 (0.0%) | 6 (11.5%) |
| $10,000 to $12,499 | 2 (3.0%) | 1 (1.9%) |
| $12,500 to $14,999 | 0 (0.0%) | 12 (23.1%) |
| $15,000 to $17,499 | 0 (0.0%) | 4 (7.7%) |
| $17,500 to $19,999 | 0 (0.0%) | 2 (3.8%) |
| $20,000 to $22,499 | 0 (0.0%) | 3 (5.8%) |
| $22,500 to $24,999 | 11 (16.4%) | 0 (0.0%) |
| $25,000 to $29,999 | 1 (1.5%) | 4 (7.7%) |
| $30,000 to $34,999 | 5 (7.5%) | 3 (5.8%) |
| $35,000 to $39,999 | 7 (10.4%) | 0 (0.0%) |
| $40,000 to $44,999 | 7 (10.4%) | 0 (0.0%) |
| $45,000 to $49,999 | 5 (7.5%) | 6 (11.5%) |
| $50,000 to $54,999 | 3 (4.5%) | 1 (1.9%) |
| $55,000 to $64,999 | 5 (7.5%) | 2 (3.8%) |
| $65,000 to $74,999 | 2 (3.0%) | 3 (5.8%) |
| $75,000 to $99,999 | 11 (16.4%) | 0 (0.0%) |
| $100,000+ | 5 (7.5%) | 0 (0.0%) |
| Total | 67 (100.0%) | 52 (100.0%) |
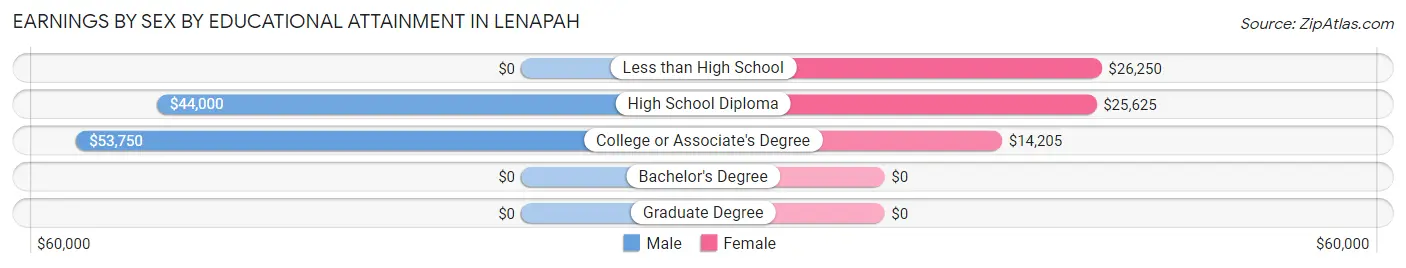
Earnings by Sex by Educational Attainment in Lenapah
Average earnings in Lenapah are $44,000 for men and $18,750 for women, a difference of 57.4%. Men with an educational attainment of college or associate's degree enjoy the highest average annual earnings of $53,750, while those with high school diploma education earn the least with $44,000. Women with an educational attainment of less than high school earn the most with the average annual earnings of $26,250, while those with college or associate's degree education have the smallest earnings of $14,205.
| Educational Attainment | Male Income | Female Income |
| Less than High School | - | - |
| High School Diploma | $44,000 | $25,625 |
| College or Associate's Degree | $53,750 | $14,205 |
| Bachelor's Degree | - | - |
| Graduate Degree | - | - |
| Total | $44,000 | $18,750 |
Family Income in Lenapah
Family Income Brackets in Lenapah
According to the Lenapah family income data, there are 23 families falling into the $50,000 to $74,999 income range, which is the most common income bracket and makes up 31.9% of all families.
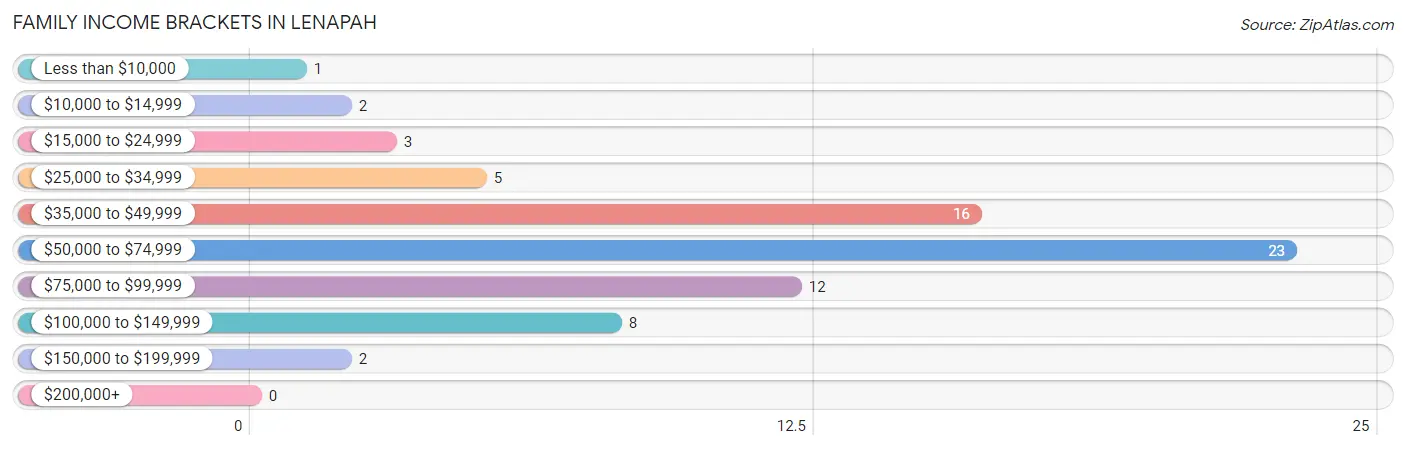
| Income Bracket | # Families | % Families |
| Less than $10,000 | 1 | 1.4% |
| $10,000 to $14,999 | 2 | 2.8% |
| $15,000 to $24,999 | 3 | 4.2% |
| $25,000 to $34,999 | 5 | 6.9% |
| $35,000 to $49,999 | 16 | 22.2% |
| $50,000 to $74,999 | 23 | 31.9% |
| $75,000 to $99,999 | 12 | 16.7% |
| $100,000 to $149,999 | 8 | 11.1% |
| $150,000 to $199,999 | 2 | 2.8% |
| $200,000+ | 0 | 0.0% |
Family Income by Famaliy Size in Lenapah
2-person families (16 | 22.2%) account for the highest median family income in Lenapah with $83,750 per family, while 2-person families (16 | 22.2%) have the highest median income of $41,875 per family member.
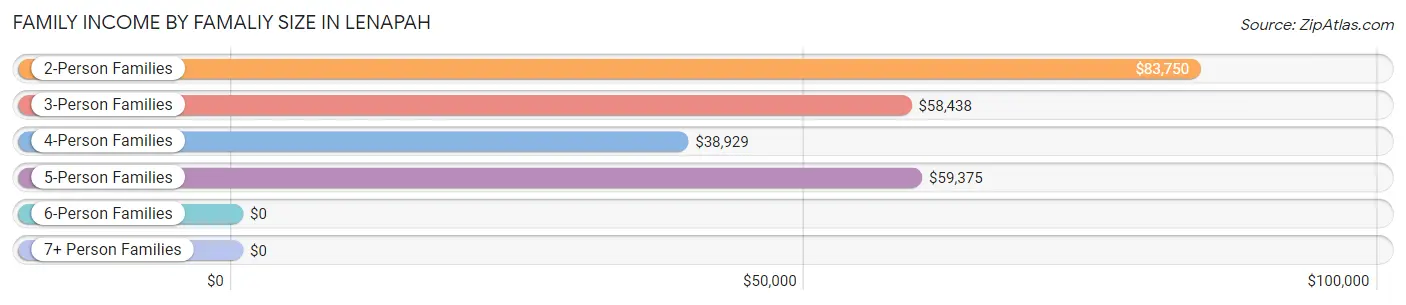
| Income Bracket | # Families | Median Income |
| 2-Person Families | 16 (22.2%) | $83,750 |
| 3-Person Families | 23 (31.9%) | $58,438 |
| 4-Person Families | 20 (27.8%) | $38,929 |
| 5-Person Families | 13 (18.1%) | $59,375 |
| 6-Person Families | 0 (0.0%) | $0 |
| 7+ Person Families | 0 (0.0%) | $0 |
| Total | 72 (100.0%) | $58,393 |
Family Income by Number of Earners in Lenapah
The median family income in Lenapah is $58,393, with families comprising 3+ earners (5) having the highest median family income of $104,375, while families with 1 earner (23) have the lowest median family income of $51,250, accounting for 6.9% and 31.9% of families, respectively.
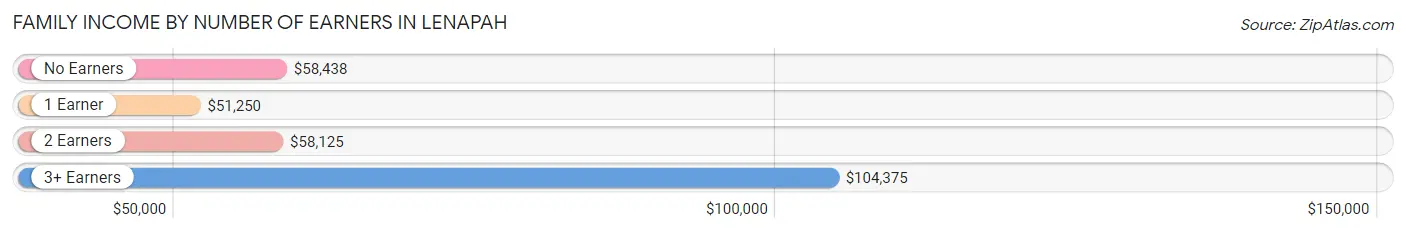
| Number of Earners | # Families | Median Income |
| No Earners | 15 (20.8%) | $58,438 |
| 1 Earner | 23 (31.9%) | $51,250 |
| 2 Earners | 29 (40.3%) | $58,125 |
| 3+ Earners | 5 (6.9%) | $104,375 |
| Total | 72 (100.0%) | $58,393 |
Household Income in Lenapah
Household Income Brackets in Lenapah
With 26 households falling in the category, the $50,000 to $74,999 income range is the most frequent in Lenapah, accounting for 28.9% of all households.
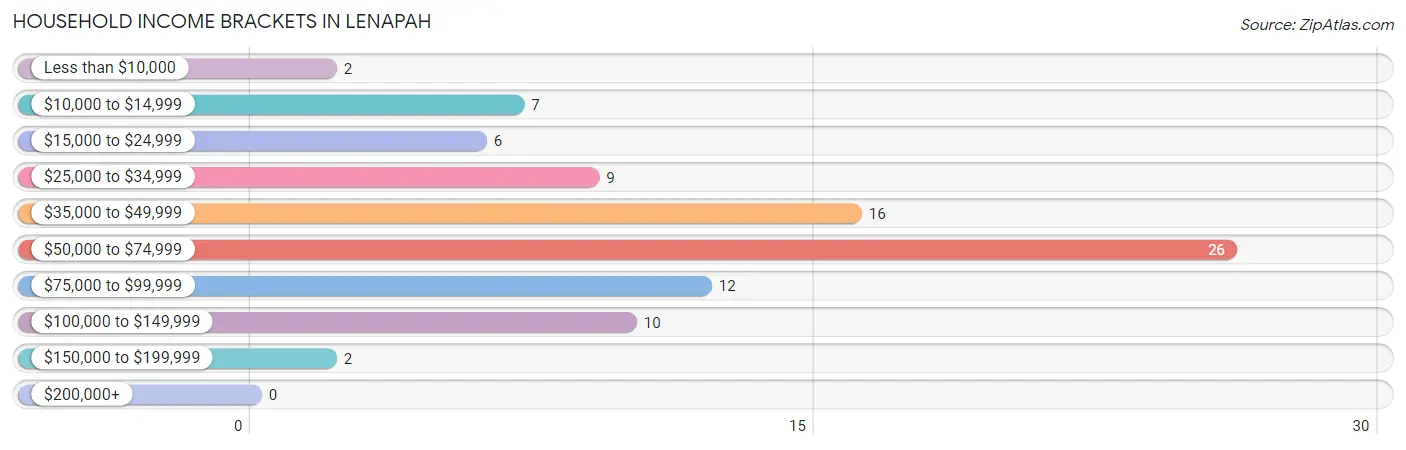
| Income Bracket | # Households | % Households |
| Less than $10,000 | 2 | 2.2% |
| $10,000 to $14,999 | 7 | 7.8% |
| $15,000 to $24,999 | 6 | 6.7% |
| $25,000 to $34,999 | 9 | 10.0% |
| $35,000 to $49,999 | 16 | 17.8% |
| $50,000 to $74,999 | 26 | 28.9% |
| $75,000 to $99,999 | 12 | 13.3% |
| $100,000 to $149,999 | 10 | 11.1% |
| $150,000 to $199,999 | 2 | 2.2% |
| $200,000+ | 0 | 0.0% |
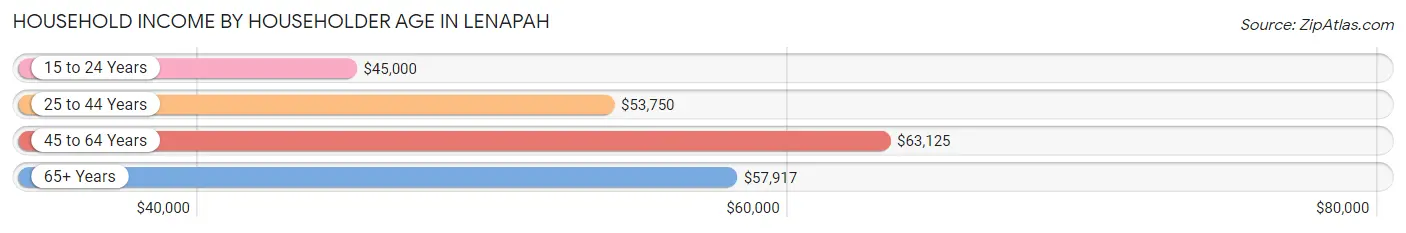
Household Income by Householder Age in Lenapah
The median household income in Lenapah is $57,656, with the highest median household income of $63,125 found in the 45 to 64 years age bracket for the primary householder. A total of 27 households (30.0%) fall into this category. Meanwhile, the 15 to 24 years age bracket for the primary householder has the lowest median household income of $45,000, with 4 households (4.4%) in this group.
| Income Bracket | # Households | Median Income |
| 15 to 24 Years | 4 (4.4%) | $45,000 |
| 25 to 44 Years | 37 (41.1%) | $53,750 |
| 45 to 64 Years | 27 (30.0%) | $63,125 |
| 65+ Years | 22 (24.4%) | $57,917 |
| Total | 90 (100.0%) | $57,656 |
Poverty in Lenapah
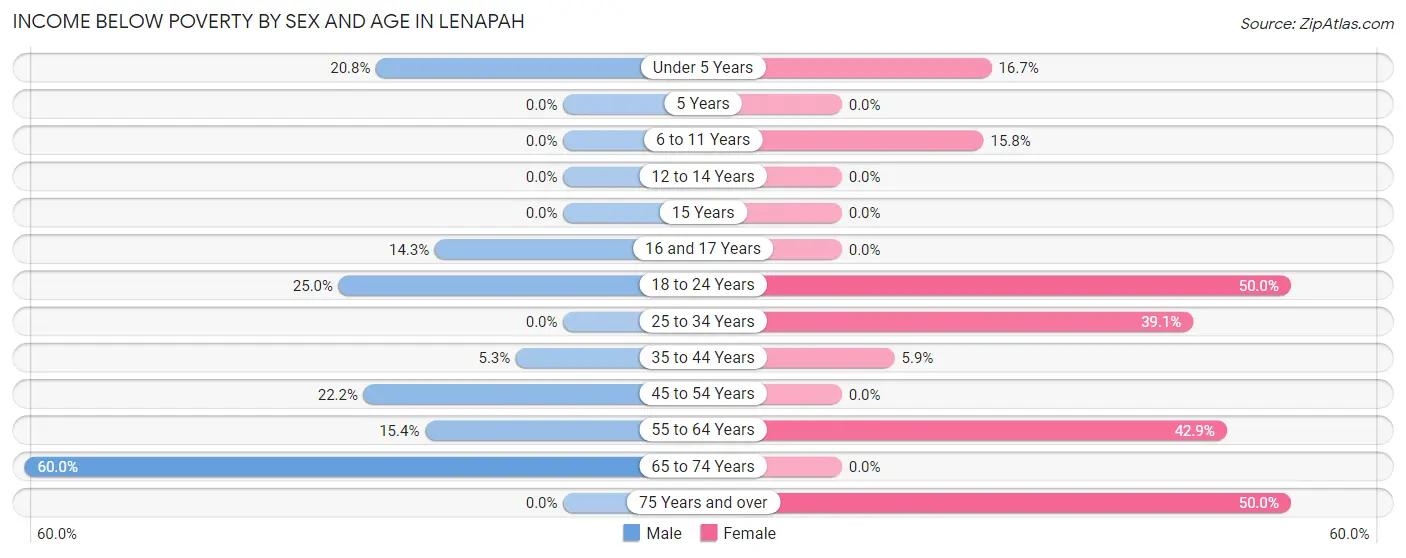
Income Below Poverty by Sex and Age in Lenapah
With 12.5% poverty level for males and 22.4% for females among the residents of Lenapah, 65 to 74 year old males and 18 to 24 year old females are the most vulnerable to poverty, with 3 males (60.0%) and 4 females (50.0%) in their respective age groups living below the poverty level.
| Age Bracket | Male | Female |
| Under 5 Years | 5 (20.8%) | 2 (16.7%) |
| 5 Years | 0 (0.0%) | 0 (0.0%) |
| 6 to 11 Years | 0 (0.0%) | 3 (15.8%) |
| 12 to 14 Years | 0 (0.0%) | 0 (0.0%) |
| 15 Years | 0 (0.0%) | 0 (0.0%) |
| 16 and 17 Years | 2 (14.3%) | 0 (0.0%) |
| 18 to 24 Years | 2 (25.0%) | 4 (50.0%) |
| 25 to 34 Years | 0 (0.0%) | 9 (39.1%) |
| 35 to 44 Years | 1 (5.3%) | 1 (5.9%) |
| 45 to 54 Years | 4 (22.2%) | 0 (0.0%) |
| 55 to 64 Years | 2 (15.4%) | 6 (42.9%) |
| 65 to 74 Years | 3 (60.0%) | 0 (0.0%) |
| 75 Years and over | 0 (0.0%) | 1 (50.0%) |
| Total | 19 (12.5%) | 26 (22.4%) |
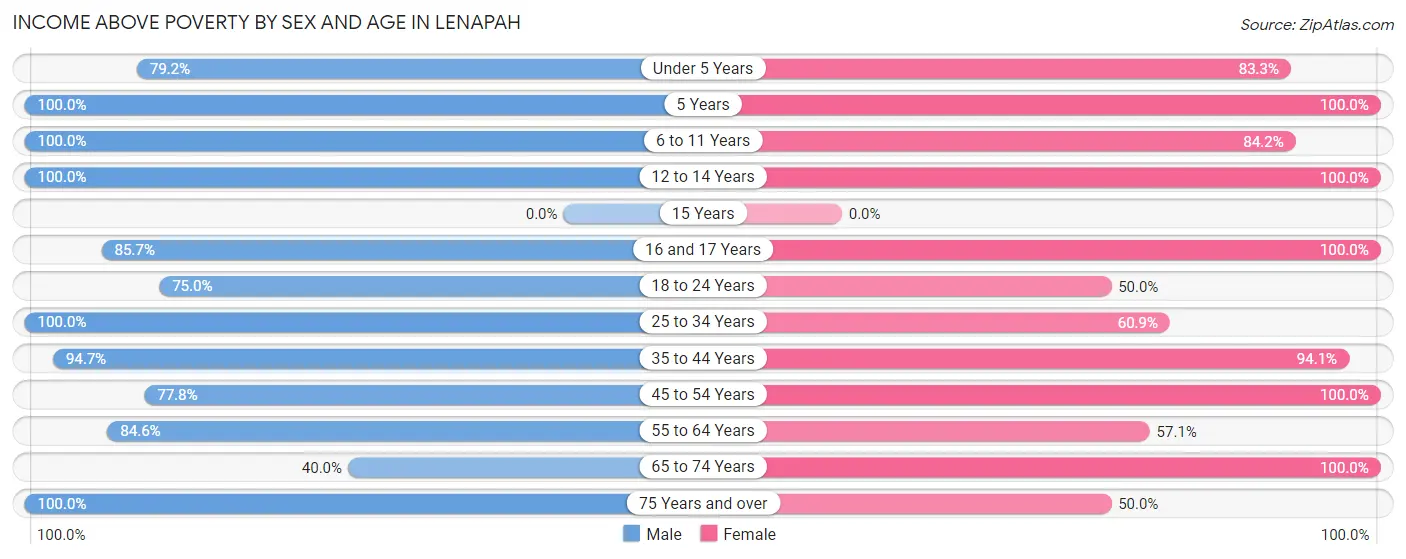
Income Above Poverty by Sex and Age in Lenapah
According to the poverty statistics in Lenapah, males aged 5 years and females aged 5 years are the age groups that are most secure financially, with 100.0% of males and 100.0% of females in these age groups living above the poverty line.
| Age Bracket | Male | Female |
| Under 5 Years | 19 (79.2%) | 10 (83.3%) |
| 5 Years | 2 (100.0%) | 1 (100.0%) |
| 6 to 11 Years | 9 (100.0%) | 16 (84.2%) |
| 12 to 14 Years | 3 (100.0%) | 3 (100.0%) |
| 15 Years | 0 (0.0%) | 0 (0.0%) |
| 16 and 17 Years | 12 (85.7%) | 1 (100.0%) |
| 18 to 24 Years | 6 (75.0%) | 4 (50.0%) |
| 25 to 34 Years | 25 (100.0%) | 14 (60.9%) |
| 35 to 44 Years | 18 (94.7%) | 16 (94.1%) |
| 45 to 54 Years | 14 (77.8%) | 10 (100.0%) |
| 55 to 64 Years | 11 (84.6%) | 8 (57.1%) |
| 65 to 74 Years | 2 (40.0%) | 6 (100.0%) |
| 75 Years and over | 12 (100.0%) | 1 (50.0%) |
| Total | 133 (87.5%) | 90 (77.6%) |
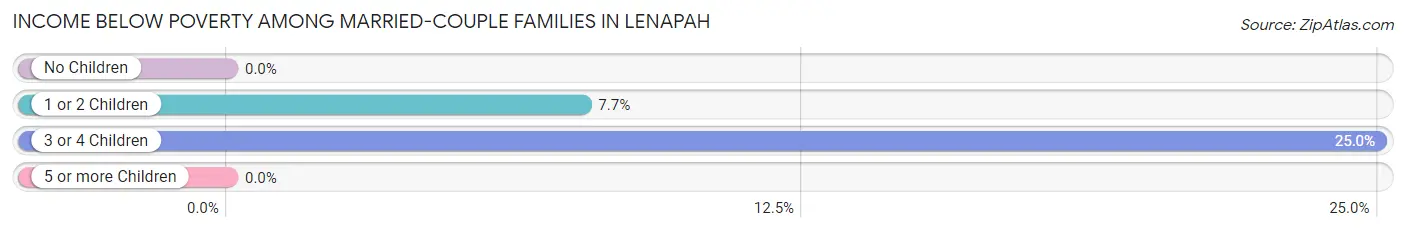
Income Below Poverty Among Married-Couple Families in Lenapah
The poverty statistics for married-couple families in Lenapah show that 5.4% or 3 of the total 56 families live below the poverty line. Families with 3 or 4 children have the highest poverty rate of 25.0%, comprising of 1 families. On the other hand, families with no children have the lowest poverty rate of 0.0%, which includes 0 families.
| Children | Above Poverty | Below Poverty |
| No Children | 26 (100.0%) | 0 (0.0%) |
| 1 or 2 Children | 24 (92.3%) | 2 (7.7%) |
| 3 or 4 Children | 3 (75.0%) | 1 (25.0%) |
| 5 or more Children | 0 (0.0%) | 0 (0.0%) |
| Total | 53 (94.6%) | 3 (5.4%) |
Income Below Poverty Among Single-Parent Households in Lenapah
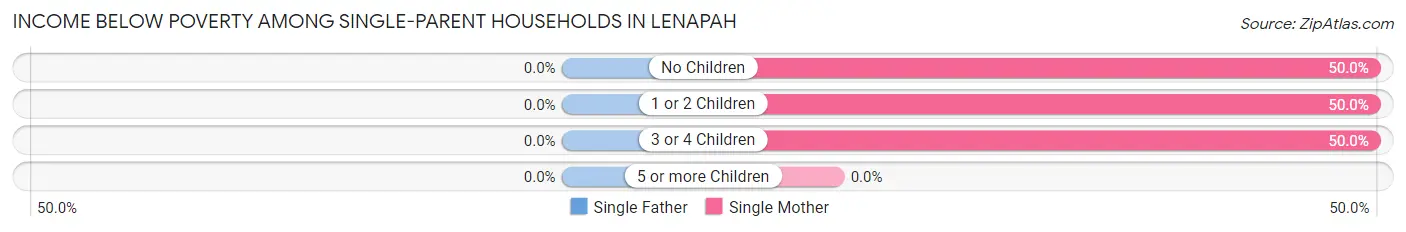
| Children | Single Father | Single Mother |
| No Children | 0 (0.0%) | 1 (50.0%) |
| 1 or 2 Children | 0 (0.0%) | 1 (50.0%) |
| 3 or 4 Children | 0 (0.0%) | 1 (50.0%) |
| 5 or more Children | 0 (0.0%) | 0 (0.0%) |
| Total | 0 (0.0%) | 3 (50.0%) |
Income Below Poverty Among Married-Couple vs Single-Parent Households in Lenapah
The poverty data for Lenapah shows that 3 of the married-couple family households (5.4%) and 3 of the single-parent households (18.8%) are living below the poverty level. Within the married-couple family households, those with 3 or 4 children have the highest poverty rate, with 1 households (25.0%) falling below the poverty line. Among the single-parent households, those with no children have the highest poverty rate, with 1 household (25.0%) living below poverty.
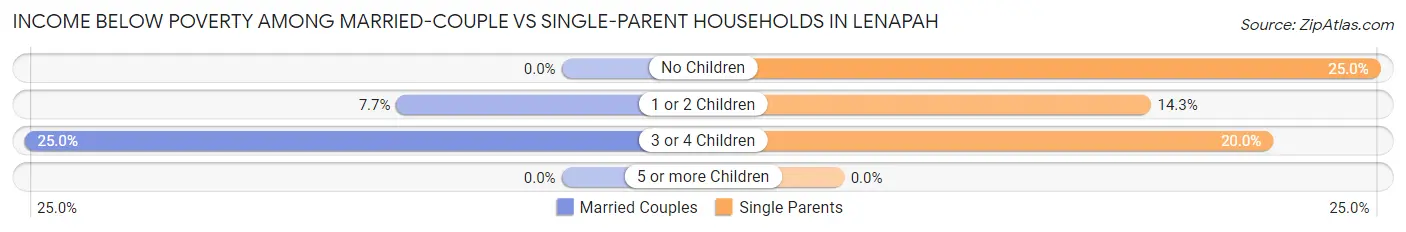
| Children | Married-Couple Families | Single-Parent Households |
| No Children | 0 (0.0%) | 1 (25.0%) |
| 1 or 2 Children | 2 (7.7%) | 1 (14.3%) |
| 3 or 4 Children | 1 (25.0%) | 1 (20.0%) |
| 5 or more Children | 0 (0.0%) | 0 (0.0%) |
| Total | 3 (5.4%) | 3 (18.8%) |
Race in Lenapah
The most populous races in Lenapah are White / Caucasian (116 | 43.3%), Two or more Races (80 | 29.8%), and Native / Alaskan (59 | 22.0%).
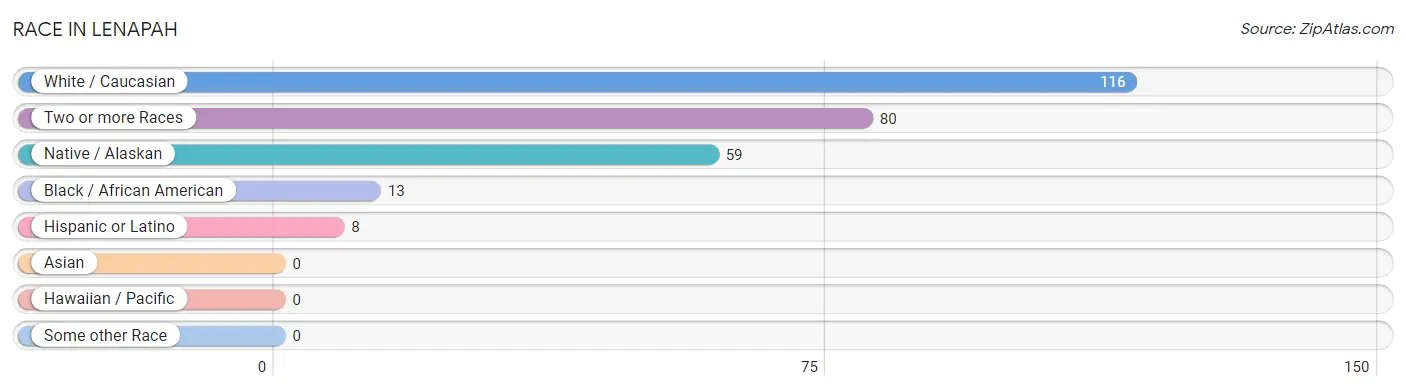
| Race | # Population | % Population |
| Asian | 0 | 0.0% |
| Black / African American | 13 | 4.9% |
| Hawaiian / Pacific | 0 | 0.0% |
| Hispanic or Latino | 8 | 3.0% |
| Native / Alaskan | 59 | 22.0% |
| White / Caucasian | 116 | 43.3% |
| Two or more Races | 80 | 29.8% |
| Some other Race | 0 | 0.0% |
| Total | 268 | 100.0% |
Ancestry in Lenapah
The most populous ancestries reported in Lenapah are Cherokee (113 | 42.2%), Irish (63 | 23.5%), German (54 | 20.2%), Choctaw (27 | 10.1%), and Italian (18 | 6.7%), together accounting for 102.6% of all Lenapah residents.
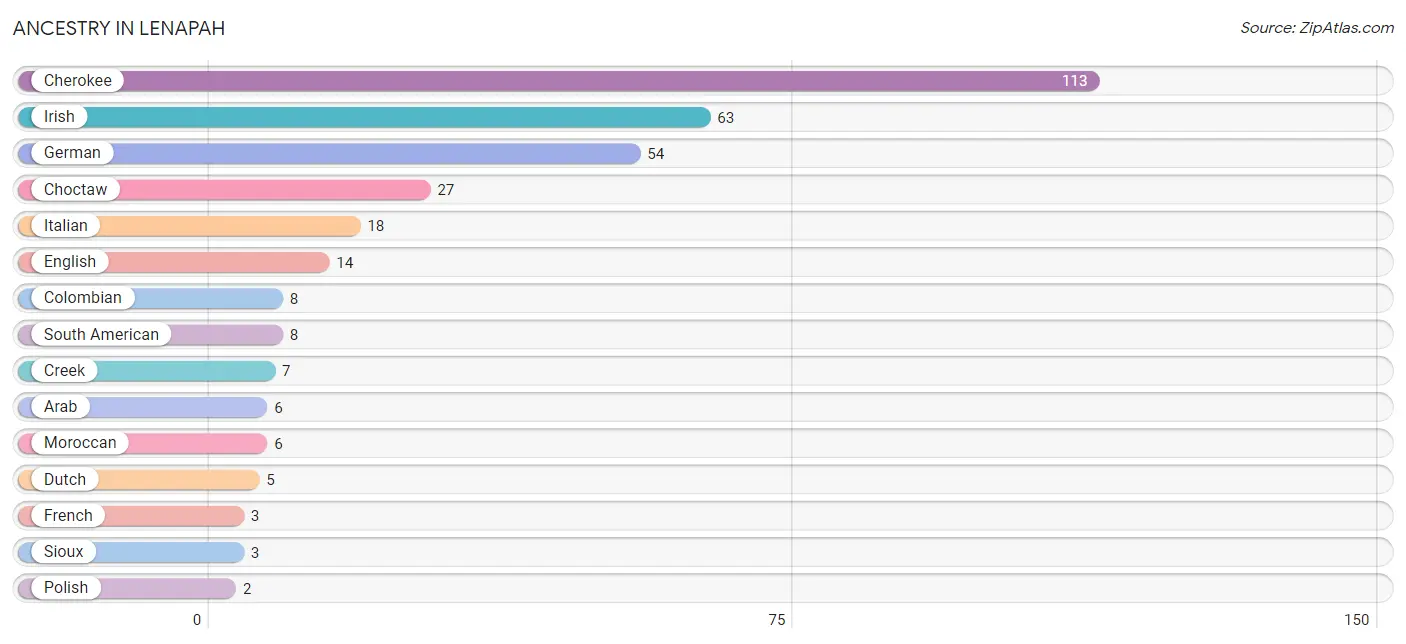
| Ancestry | # Population | % Population |
| Arab | 6 | 2.2% |
| Cherokee | 113 | 42.2% |
| Choctaw | 27 | 10.1% |
| Colombian | 8 | 3.0% |
| Creek | 7 | 2.6% |
| Dutch | 5 | 1.9% |
| Dutch West Indian | 1 | 0.4% |
| English | 14 | 5.2% |
| French | 3 | 1.1% |
| German | 54 | 20.2% |
| Irish | 63 | 23.5% |
| Italian | 18 | 6.7% |
| Moroccan | 6 | 2.2% |
| Osage | 1 | 0.4% |
| Polish | 2 | 0.7% |
| Scottish | 1 | 0.4% |
| Sioux | 3 | 1.1% |
| South American | 8 | 3.0% | View All 18 Rows |
Immigrants in Lenapah
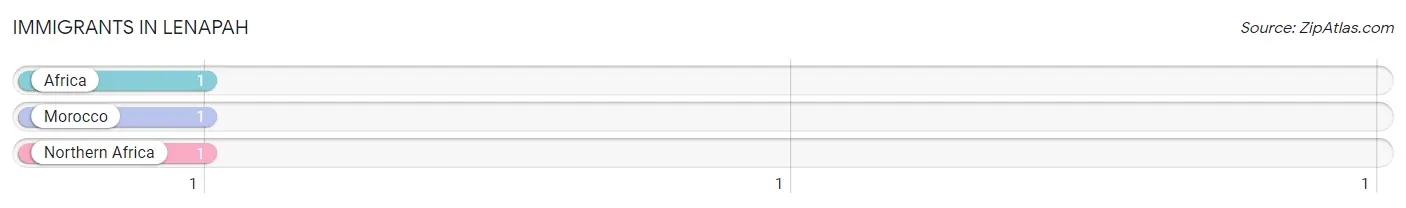
The most numerous immigrant groups reported in Lenapah came from Africa (1 | 0.4%), Morocco (1 | 0.4%), and Northern Africa (1 | 0.4%), together accounting for 1.1% of all Lenapah residents.
| Immigration Origin | # Population | % Population |
| Africa | 1 | 0.4% |
| Morocco | 1 | 0.4% |
| Northern Africa | 1 | 0.4% | View All 3 Rows |
Sex and Age in Lenapah
Sex and Age in Lenapah
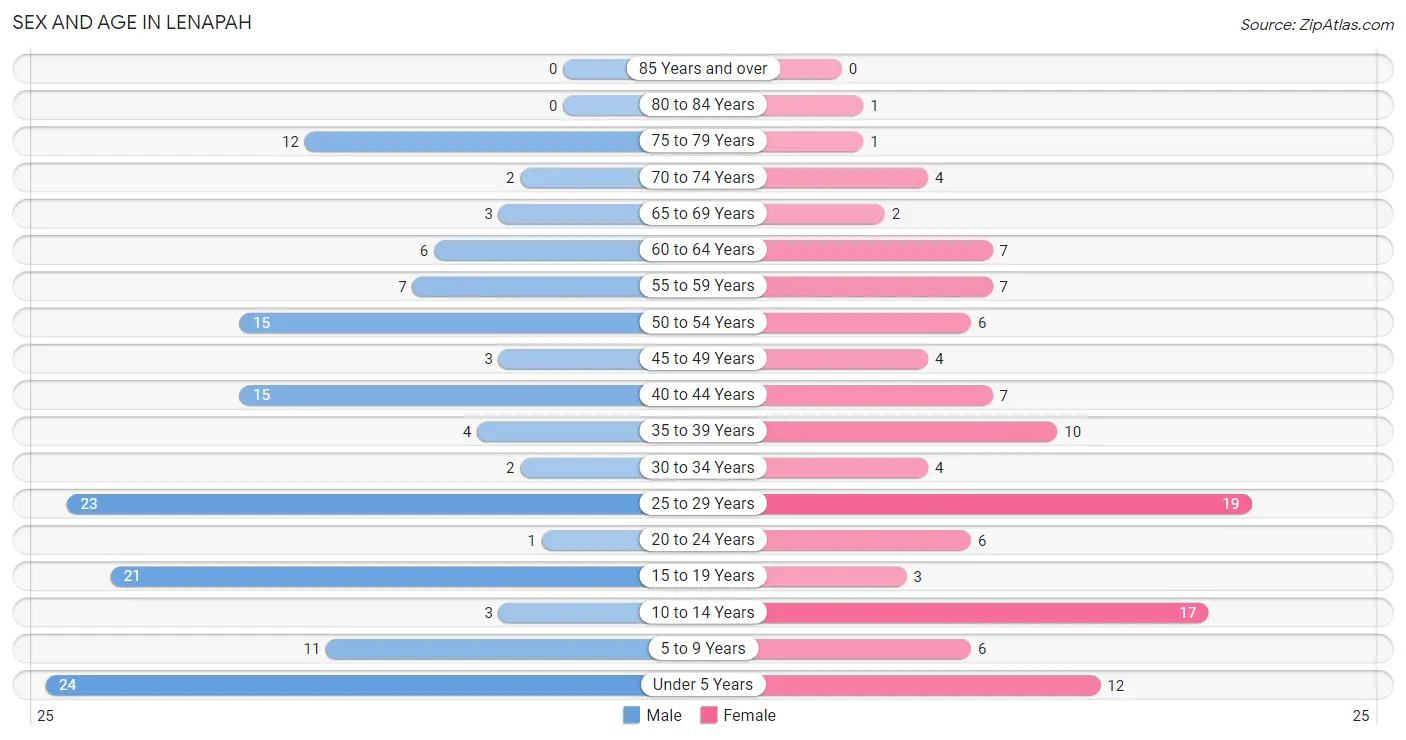
The most populous age groups in Lenapah are Under 5 Years (24 | 15.8%) for men and 25 to 29 Years (19 | 16.4%) for women.
| Age Bracket | Male | Female |
| Under 5 Years | 24 (15.8%) | 12 (10.3%) |
| 5 to 9 Years | 11 (7.2%) | 6 (5.2%) |
| 10 to 14 Years | 3 (2.0%) | 17 (14.7%) |
| 15 to 19 Years | 21 (13.8%) | 3 (2.6%) |
| 20 to 24 Years | 1 (0.7%) | 6 (5.2%) |
| 25 to 29 Years | 23 (15.1%) | 19 (16.4%) |
| 30 to 34 Years | 2 (1.3%) | 4 (3.5%) |
| 35 to 39 Years | 4 (2.6%) | 10 (8.6%) |
| 40 to 44 Years | 15 (9.9%) | 7 (6.0%) |
| 45 to 49 Years | 3 (2.0%) | 4 (3.5%) |
| 50 to 54 Years | 15 (9.9%) | 6 (5.2%) |
| 55 to 59 Years | 7 (4.6%) | 7 (6.0%) |
| 60 to 64 Years | 6 (4.0%) | 7 (6.0%) |
| 65 to 69 Years | 3 (2.0%) | 2 (1.7%) |
| 70 to 74 Years | 2 (1.3%) | 4 (3.5%) |
| 75 to 79 Years | 12 (7.9%) | 1 (0.9%) |
| 80 to 84 Years | 0 (0.0%) | 1 (0.9%) |
| 85 Years and over | 0 (0.0%) | 0 (0.0%) |
| Total | 152 (100.0%) | 116 (100.0%) |
Families and Households in Lenapah
Median Family Size in Lenapah
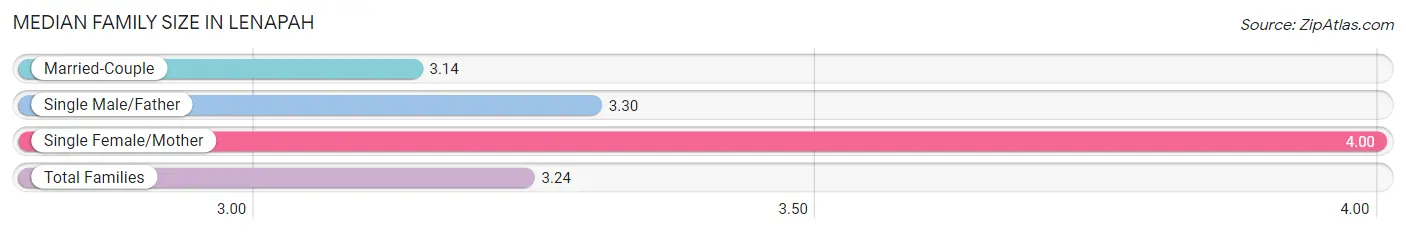
The median family size in Lenapah is 3.24 persons per family, with single female/mother families (6 | 8.3%) accounting for the largest median family size of 4 persons per family. On the other hand, married-couple families (56 | 77.8%) represent the smallest median family size with 3.14 persons per family.
| Family Type | # Families | Family Size |
| Married-Couple | 56 (77.8%) | 3.14 |
| Single Male/Father | 10 (13.9%) | 3.30 |
| Single Female/Mother | 6 (8.3%) | 4.00 |
| Total Families | 72 (100.0%) | 3.24 |
Median Household Size in Lenapah
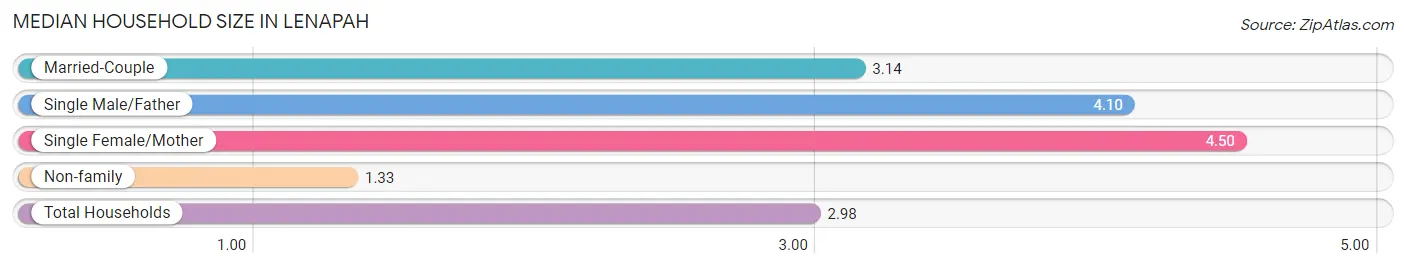
The median household size in Lenapah is 2.98 persons per household, with single female/mother households (6 | 6.7%) accounting for the largest median household size of 4.5 persons per household. non-family households (18 | 20.0%) represent the smallest median household size with 1.33 persons per household.
| Household Type | # Households | Household Size |
| Married-Couple | 56 (62.2%) | 3.14 |
| Single Male/Father | 10 (11.1%) | 4.10 |
| Single Female/Mother | 6 (6.7%) | 4.50 |
| Non-family | 18 (20.0%) | 1.33 |
| Total Households | 90 (100.0%) | 2.98 |
Household Size by Marriage Status in Lenapah
Out of a total of 90 households in Lenapah, 72 (80.0%) are family households, while 18 (20.0%) are nonfamily households. The most numerous type of family households are 3-person households, comprising 22, and the most common type of nonfamily households are 1-person households, comprising 16.
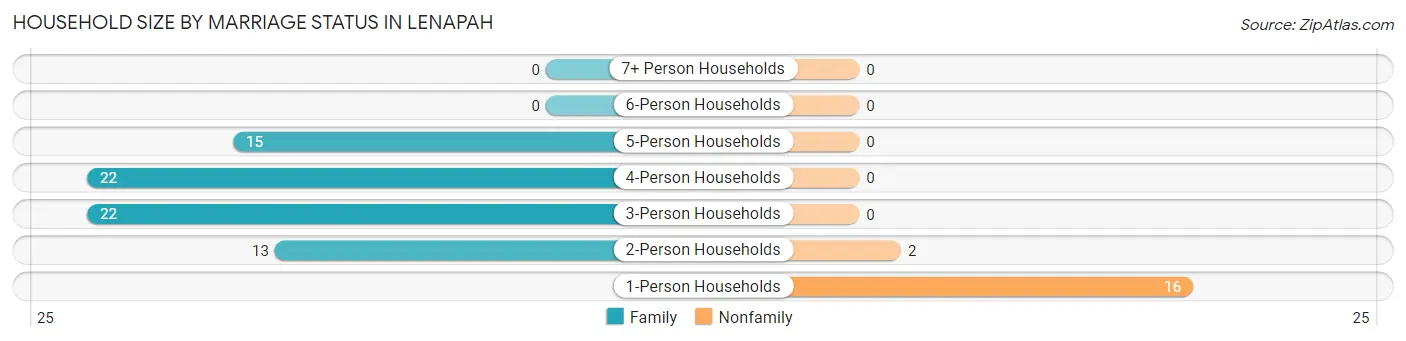
| Household Size | Family Households | Nonfamily Households |
| 1-Person Households | - | 16 (17.8%) |
| 2-Person Households | 13 (14.4%) | 2 (2.2%) |
| 3-Person Households | 22 (24.4%) | 0 (0.0%) |
| 4-Person Households | 22 (24.4%) | 0 (0.0%) |
| 5-Person Households | 15 (16.7%) | 0 (0.0%) |
| 6-Person Households | 0 (0.0%) | 0 (0.0%) |
| 7+ Person Households | 0 (0.0%) | 0 (0.0%) |
| Total | 72 (80.0%) | 18 (20.0%) |
Female Fertility in Lenapah
Fertility by Age in Lenapah
Average fertility rate in Lenapah is 232.0 births per 1,000 women. Women in the age bracket of 20 to 34 years have the highest fertility rate with 379.0 births per 1,000 women. Women in the age bracket of 20 to 34 years acount for 84.6% of all women with births.
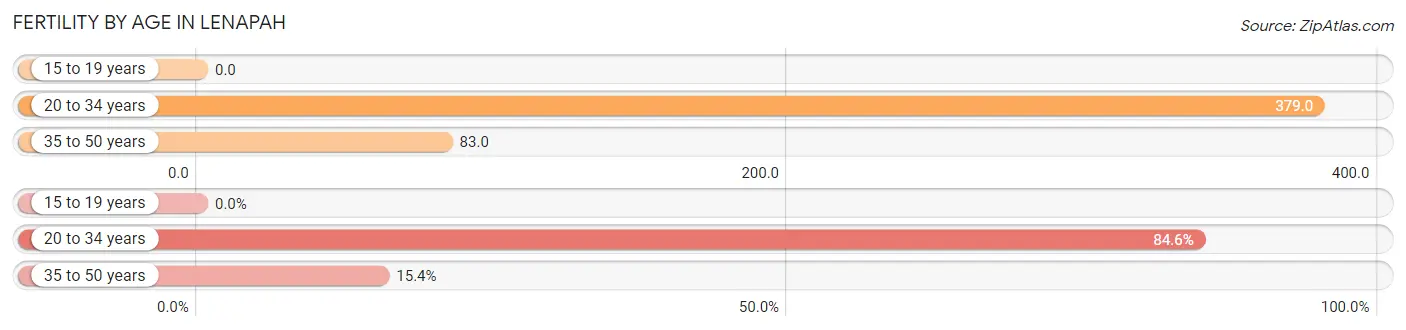
| Age Bracket | Women with Births | Births / 1,000 Women |
| 15 to 19 years | 0 (0.0%) | 0.0 |
| 20 to 34 years | 11 (84.6%) | 379.0 |
| 35 to 50 years | 2 (15.4%) | 83.0 |
| Total | 13 (100.0%) | 232.0 |
Fertility by Age by Marriage Status in Lenapah
61.5% of women with births (13) in Lenapah are married. The highest percentage of unmarried women with births falls into 20 to 34 years age bracket with 45.5% of them unmarried at the time of birth, while the lowest percentage of unmarried women with births belong to 35 to 50 years age bracket with 0.0% of them unmarried.
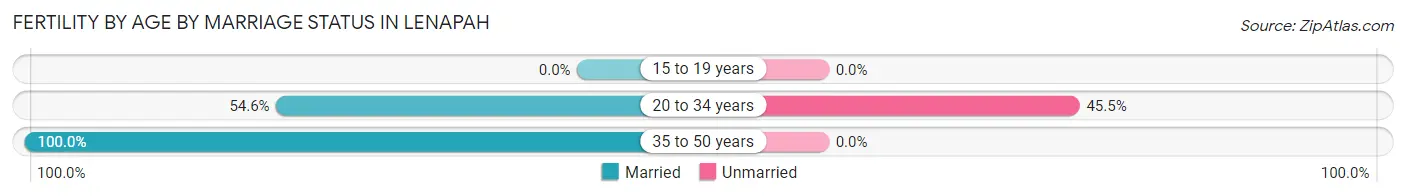
| Age Bracket | Married | Unmarried |
| 15 to 19 years | 0 (0.0%) | 0 (0.0%) |
| 20 to 34 years | 6 (54.5%) | 5 (45.5%) |
| 35 to 50 years | 2 (100.0%) | 0 (0.0%) |
| Total | 8 (61.5%) | 5 (38.5%) |
Fertility by Education in Lenapah
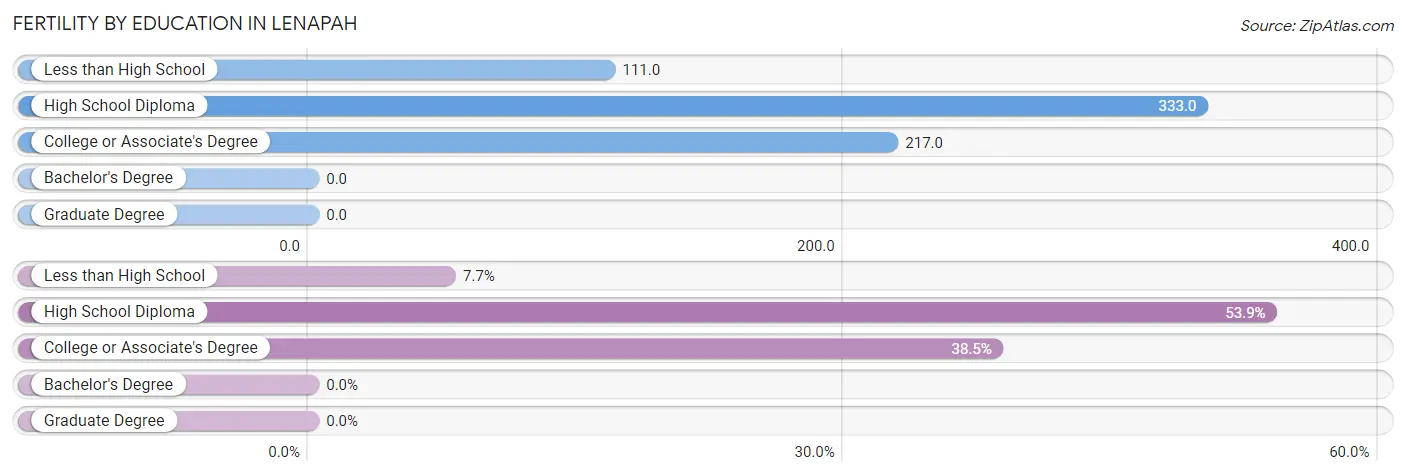
| Educational Attainment | Women with Births | Births / 1,000 Women |
| Less than High School | 1 (7.7%) | 111.0 |
| High School Diploma | 7 (53.8%) | 333.0 |
| College or Associate's Degree | 5 (38.5%) | 217.0 |
| Bachelor's Degree | 0 (0.0%) | 0.0 |
| Graduate Degree | 0 (0.0%) | 0.0 |
| Total | 13 (100.0%) | 232.0 |
Fertility by Education by Marriage Status in Lenapah
38.5% of women with births in Lenapah are unmarried. Women with the educational attainment of less than high school are most likely to be married with 100.0% of them married at childbirth, while women with the educational attainment of high school diploma are least likely to be married with 71.4% of them unmarried at childbirth.
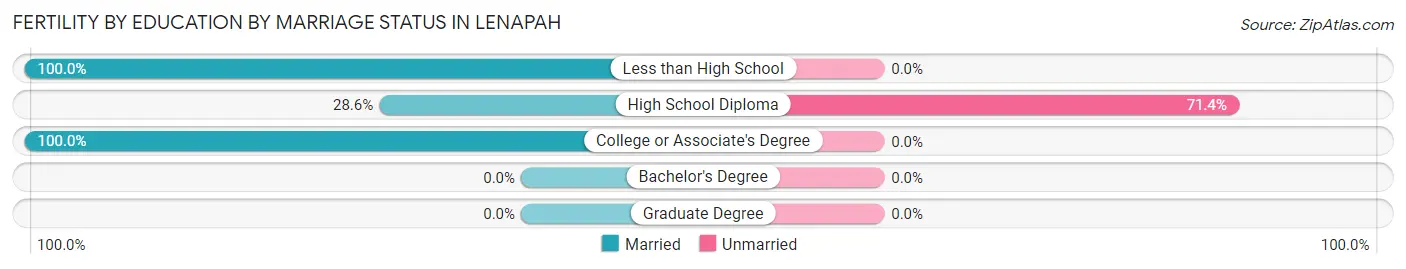
| Educational Attainment | Married | Unmarried |
| Less than High School | 1 (100.0%) | 0 (0.0%) |
| High School Diploma | 2 (28.6%) | 5 (71.4%) |
| College or Associate's Degree | 5 (100.0%) | 0 (0.0%) |
| Bachelor's Degree | 0 (0.0%) | 0 (0.0%) |
| Graduate Degree | 0 (0.0%) | 0 (0.0%) |
| Total | 8 (61.5%) | 5 (38.5%) |
Employment Characteristics in Lenapah
Employment by Class of Employer in Lenapah
Among the 110 employed individuals in Lenapah, private company employees (91 | 82.7%), local government employees (9 | 8.2%), and not-for-profit organizations (3 | 2.7%) make up the most common classes of employment.
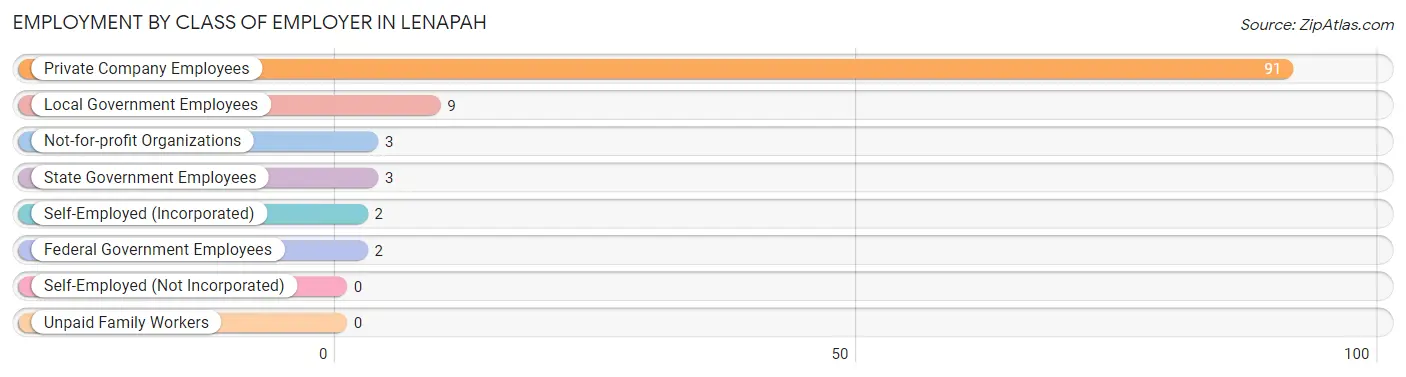
| Employer Class | # Employees | % Employees |
| Private Company Employees | 91 | 82.7% |
| Self-Employed (Incorporated) | 2 | 1.8% |
| Self-Employed (Not Incorporated) | 0 | 0.0% |
| Not-for-profit Organizations | 3 | 2.7% |
| Local Government Employees | 9 | 8.2% |
| State Government Employees | 3 | 2.7% |
| Federal Government Employees | 2 | 1.8% |
| Unpaid Family Workers | 0 | 0.0% |
| Total | 110 | 100.0% |
Employment Status by Age in Lenapah
According to the labor force statistics for Lenapah, out of the total population over 16 years of age (195), 60.5% or 118 individuals are in the labor force, with 1.7% or 2 of them unemployed. The age group with the highest labor force participation rate is 20 to 24 years, with 100.0% or 7 individuals in the labor force. Within the labor force, the 20 to 24 years age range has the highest percentage of unemployed individuals, with 14.3% or 1 of them being unemployed.
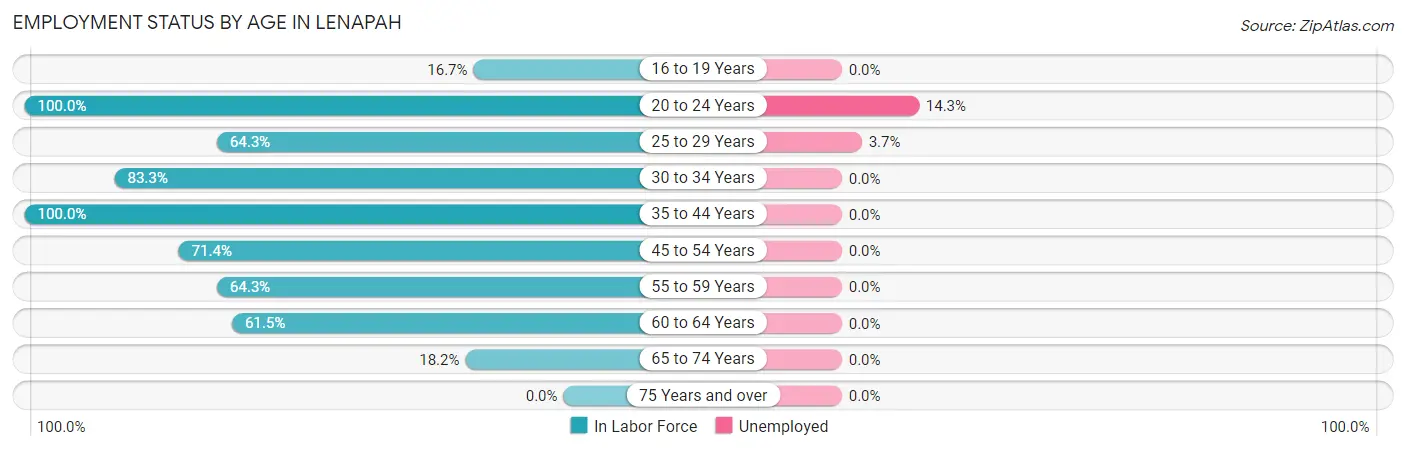
| Age Bracket | In Labor Force | Unemployed |
| 16 to 19 Years | 4 (16.7%) | 0 (0.0%) |
| 20 to 24 Years | 7 (100.0%) | 1 (14.3%) |
| 25 to 29 Years | 27 (64.3%) | 1 (3.7%) |
| 30 to 34 Years | 5 (83.3%) | 0 (0.0%) |
| 35 to 44 Years | 36 (100.0%) | 0 (0.0%) |
| 45 to 54 Years | 20 (71.4%) | 0 (0.0%) |
| 55 to 59 Years | 9 (64.3%) | 0 (0.0%) |
| 60 to 64 Years | 8 (61.5%) | 0 (0.0%) |
| 65 to 74 Years | 2 (18.2%) | 0 (0.0%) |
| 75 Years and over | 0 (0.0%) | 0 (0.0%) |
| Total | 118 (60.5%) | 2 (1.7%) |
Employment Status by Educational Attainment in Lenapah
According to labor force statistics for Lenapah, 75.5% of individuals (105) out of the total population between 25 and 64 years of age (139) are in the labor force, with 1.0% or 1 of them being unemployed. The group with the highest labor force participation rate are those with the educational attainment of bachelor's degree or higher, with 100.0% or 7 individuals in the labor force. Within the labor force, individuals with college / associate degree education have the highest percentage of unemployment, with 2.8% or 1 of them being unemployed.
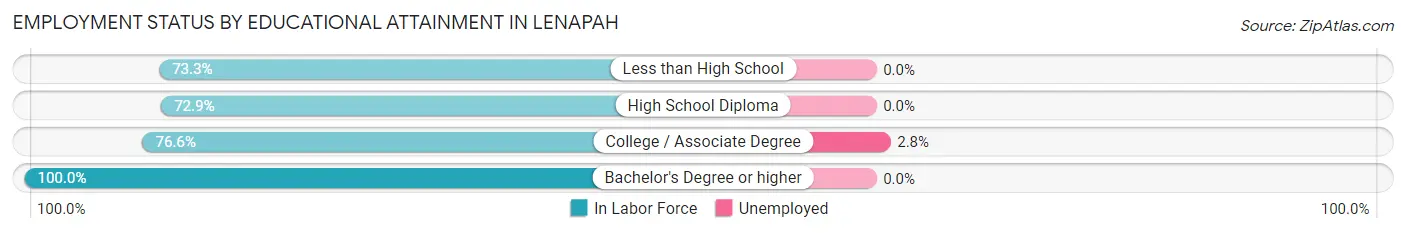
| Educational Attainment | In Labor Force | Unemployed |
| Less than High School | 11 (73.3%) | 0 (0.0%) |
| High School Diploma | 51 (72.9%) | 0 (0.0%) |
| College / Associate Degree | 36 (76.6%) | 1 (2.8%) |
| Bachelor's Degree or higher | 7 (100.0%) | 0 (0.0%) |
| Total | 105 (75.5%) | 1 (1.0%) |
Employment Occupations by Sex in Lenapah
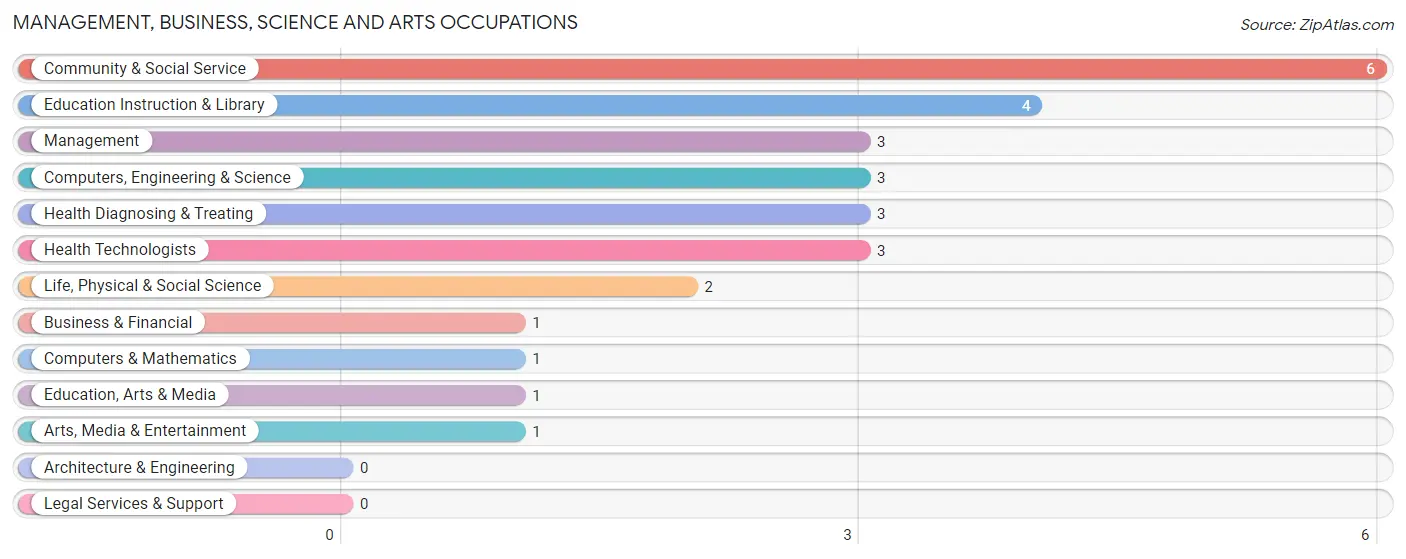
Management, Business, Science and Arts Occupations
The most common Management, Business, Science and Arts occupations in Lenapah are Community & Social Service (6 | 5.2%), Education Instruction & Library (4 | 3.5%), Management (3 | 2.6%), Computers, Engineering & Science (3 | 2.6%), and Health Diagnosing & Treating (3 | 2.6%).
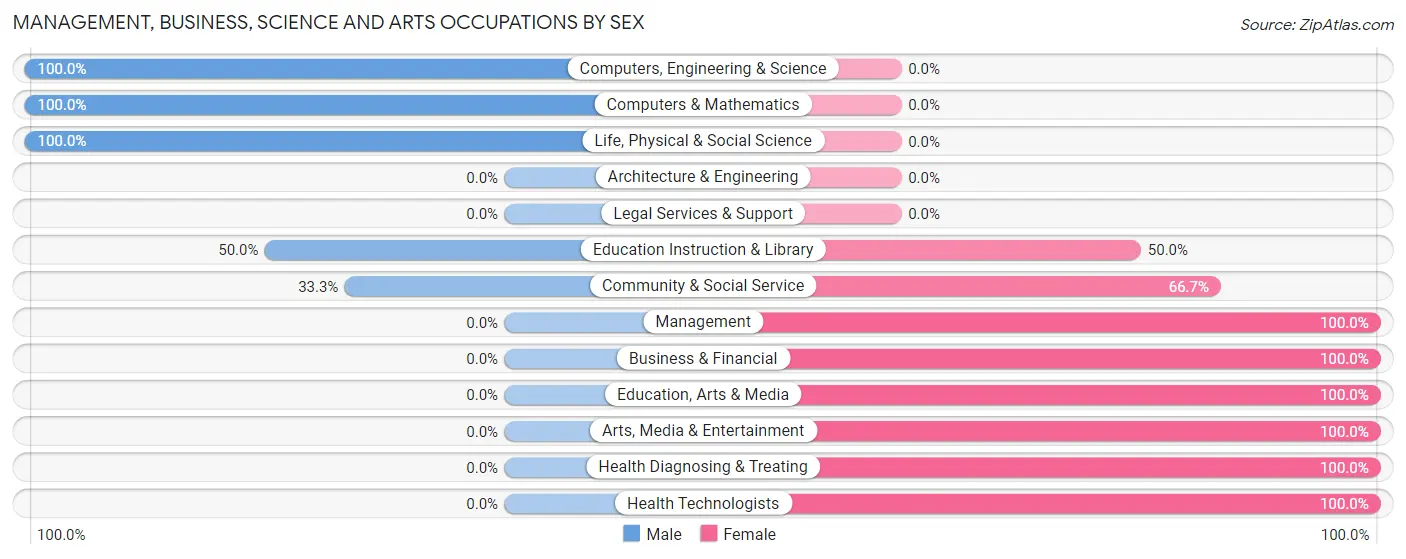
Management, Business, Science and Arts Occupations by Sex
Within the Management, Business, Science and Arts occupations in Lenapah, the most male-oriented occupations are Computers, Engineering & Science (100.0%), Computers & Mathematics (100.0%), and Life, Physical & Social Science (100.0%), while the most female-oriented occupations are Management (100.0%), Business & Financial (100.0%), and Education, Arts & Media (100.0%).
| Occupation | Male | Female |
| Management | 0 (0.0%) | 3 (100.0%) |
| Business & Financial | 0 (0.0%) | 1 (100.0%) |
| Computers, Engineering & Science | 3 (100.0%) | 0 (0.0%) |
| Computers & Mathematics | 1 (100.0%) | 0 (0.0%) |
| Architecture & Engineering | 0 (0.0%) | 0 (0.0%) |
| Life, Physical & Social Science | 2 (100.0%) | 0 (0.0%) |
| Community & Social Service | 2 (33.3%) | 4 (66.7%) |
| Education, Arts & Media | 0 (0.0%) | 1 (100.0%) |
| Legal Services & Support | 0 (0.0%) | 0 (0.0%) |
| Education Instruction & Library | 2 (50.0%) | 2 (50.0%) |
| Arts, Media & Entertainment | 0 (0.0%) | 1 (100.0%) |
| Health Diagnosing & Treating | 0 (0.0%) | 3 (100.0%) |
| Health Technologists | 0 (0.0%) | 3 (100.0%) |
| Total (Category) | 5 (31.2%) | 11 (68.8%) |
| Total (Overall) | 65 (56.0%) | 51 (44.0%) |
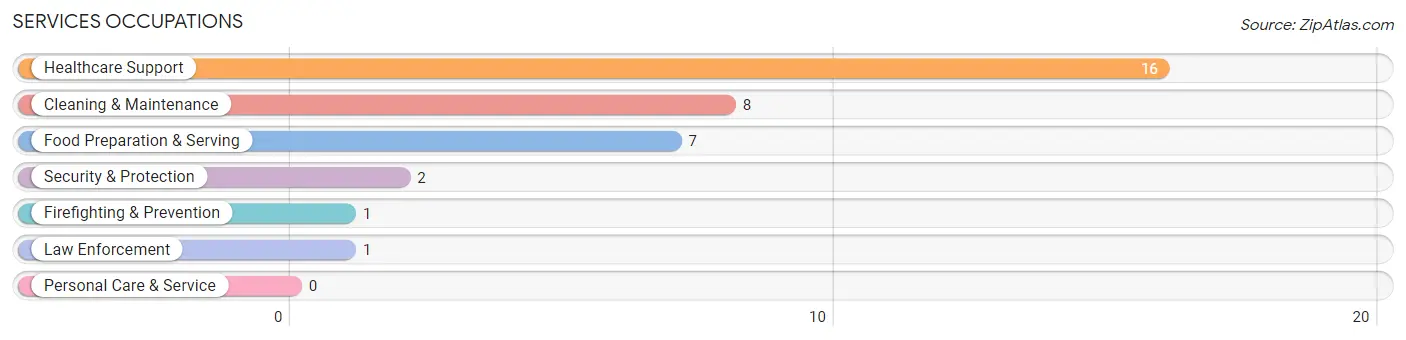
Services Occupations
The most common Services occupations in Lenapah are Healthcare Support (16 | 13.8%), Cleaning & Maintenance (8 | 6.9%), Food Preparation & Serving (7 | 6.0%), Security & Protection (2 | 1.7%), and Firefighting & Prevention (1 | 0.9%).
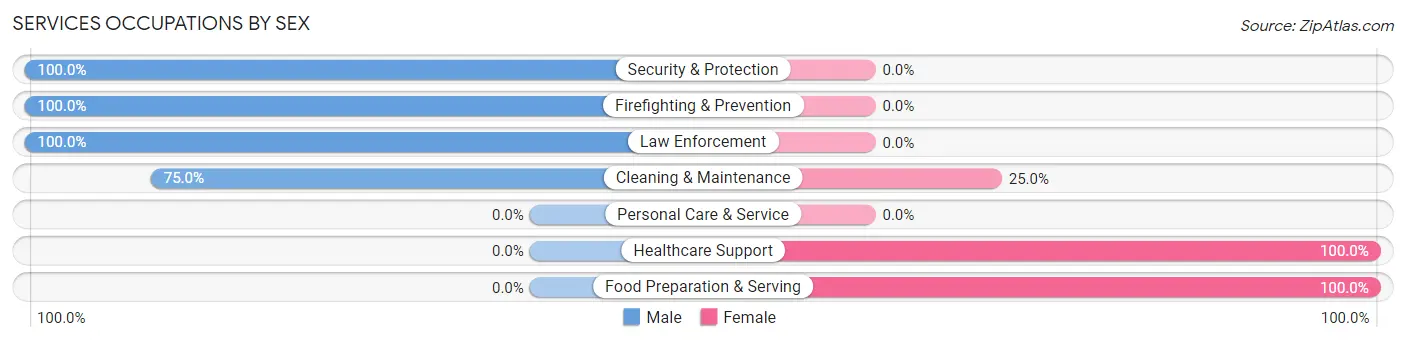
Services Occupations by Sex
Within the Services occupations in Lenapah, the most male-oriented occupations are Security & Protection (100.0%), Firefighting & Prevention (100.0%), and Law Enforcement (100.0%), while the most female-oriented occupations are Healthcare Support (100.0%), Food Preparation & Serving (100.0%), and Cleaning & Maintenance (25.0%).
| Occupation | Male | Female |
| Healthcare Support | 0 (0.0%) | 16 (100.0%) |
| Security & Protection | 2 (100.0%) | 0 (0.0%) |
| Firefighting & Prevention | 1 (100.0%) | 0 (0.0%) |
| Law Enforcement | 1 (100.0%) | 0 (0.0%) |
| Food Preparation & Serving | 0 (0.0%) | 7 (100.0%) |
| Cleaning & Maintenance | 6 (75.0%) | 2 (25.0%) |
| Personal Care & Service | 0 (0.0%) | 0 (0.0%) |
| Total (Category) | 8 (24.2%) | 25 (75.8%) |
| Total (Overall) | 65 (56.0%) | 51 (44.0%) |
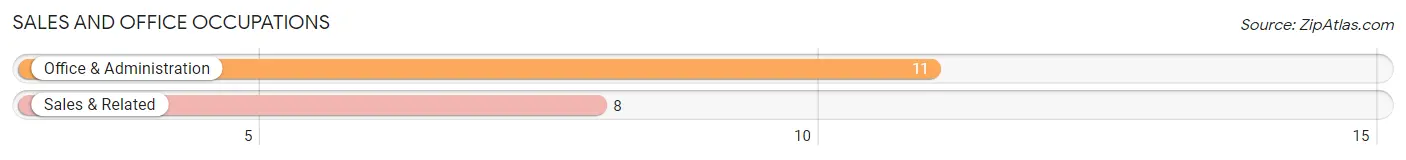
Sales and Office Occupations
The most common Sales and Office occupations in Lenapah are Office & Administration (11 | 9.5%), and Sales & Related (8 | 6.9%).
Sales and Office Occupations by Sex
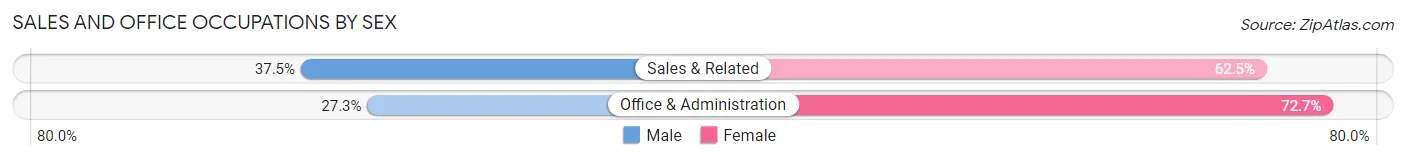
| Occupation | Male | Female |
| Sales & Related | 3 (37.5%) | 5 (62.5%) |
| Office & Administration | 3 (27.3%) | 8 (72.7%) |
| Total (Category) | 6 (31.6%) | 13 (68.4%) |
| Total (Overall) | 65 (56.0%) | 51 (44.0%) |
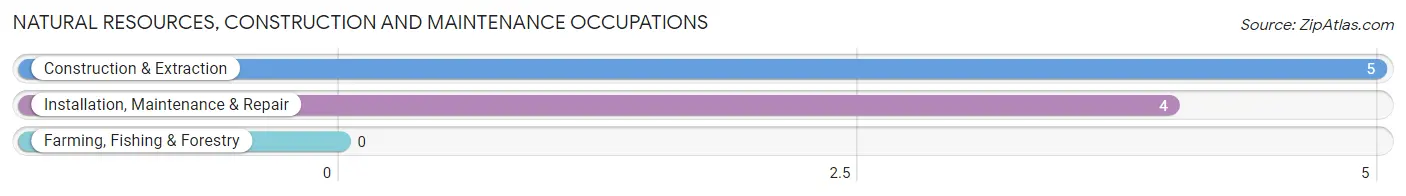
Natural Resources, Construction and Maintenance Occupations
The most common Natural Resources, Construction and Maintenance occupations in Lenapah are Construction & Extraction (5 | 4.3%), and Installation, Maintenance & Repair (4 | 3.5%).
Natural Resources, Construction and Maintenance Occupations by Sex
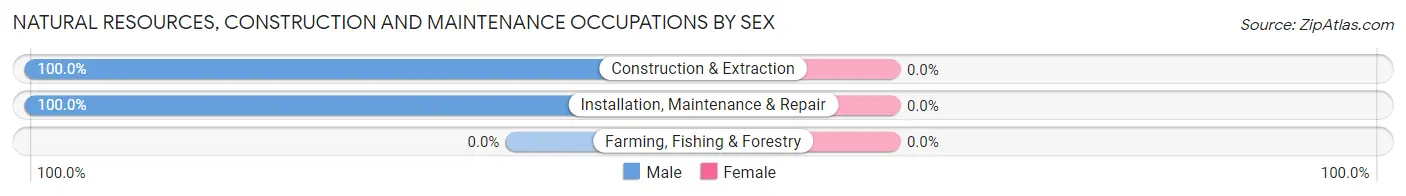
| Occupation | Male | Female |
| Farming, Fishing & Forestry | 0 (0.0%) | 0 (0.0%) |
| Construction & Extraction | 5 (100.0%) | 0 (0.0%) |
| Installation, Maintenance & Repair | 4 (100.0%) | 0 (0.0%) |
| Total (Category) | 9 (100.0%) | 0 (0.0%) |
| Total (Overall) | 65 (56.0%) | 51 (44.0%) |
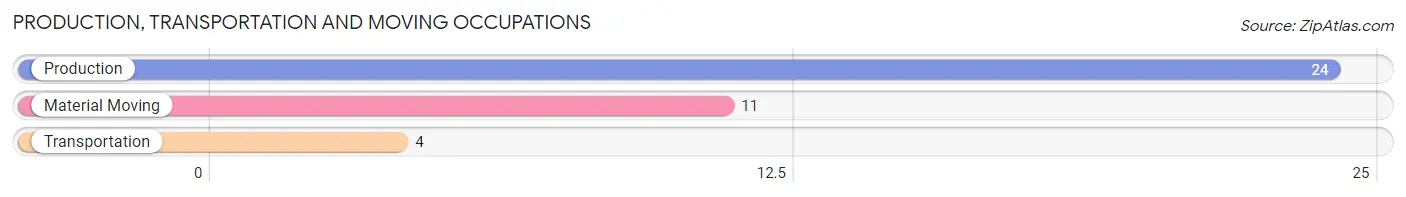
Production, Transportation and Moving Occupations
The most common Production, Transportation and Moving occupations in Lenapah are Production (24 | 20.7%), Material Moving (11 | 9.5%), and Transportation (4 | 3.5%).
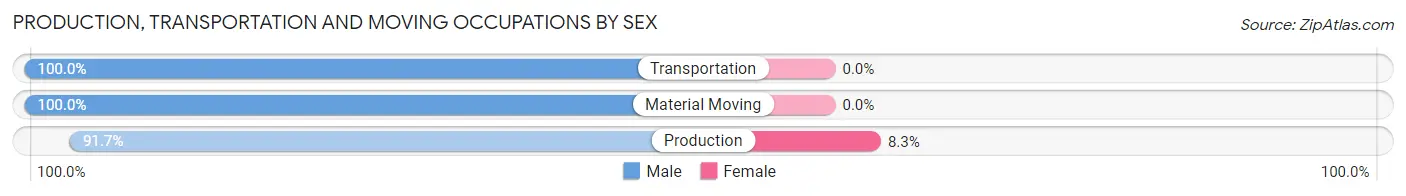
Production, Transportation and Moving Occupations by Sex
| Occupation | Male | Female |
| Production | 22 (91.7%) | 2 (8.3%) |
| Transportation | 4 (100.0%) | 0 (0.0%) |
| Material Moving | 11 (100.0%) | 0 (0.0%) |
| Total (Category) | 37 (94.9%) | 2 (5.1%) |
| Total (Overall) | 65 (56.0%) | 51 (44.0%) |
Employment Industries by Sex in Lenapah
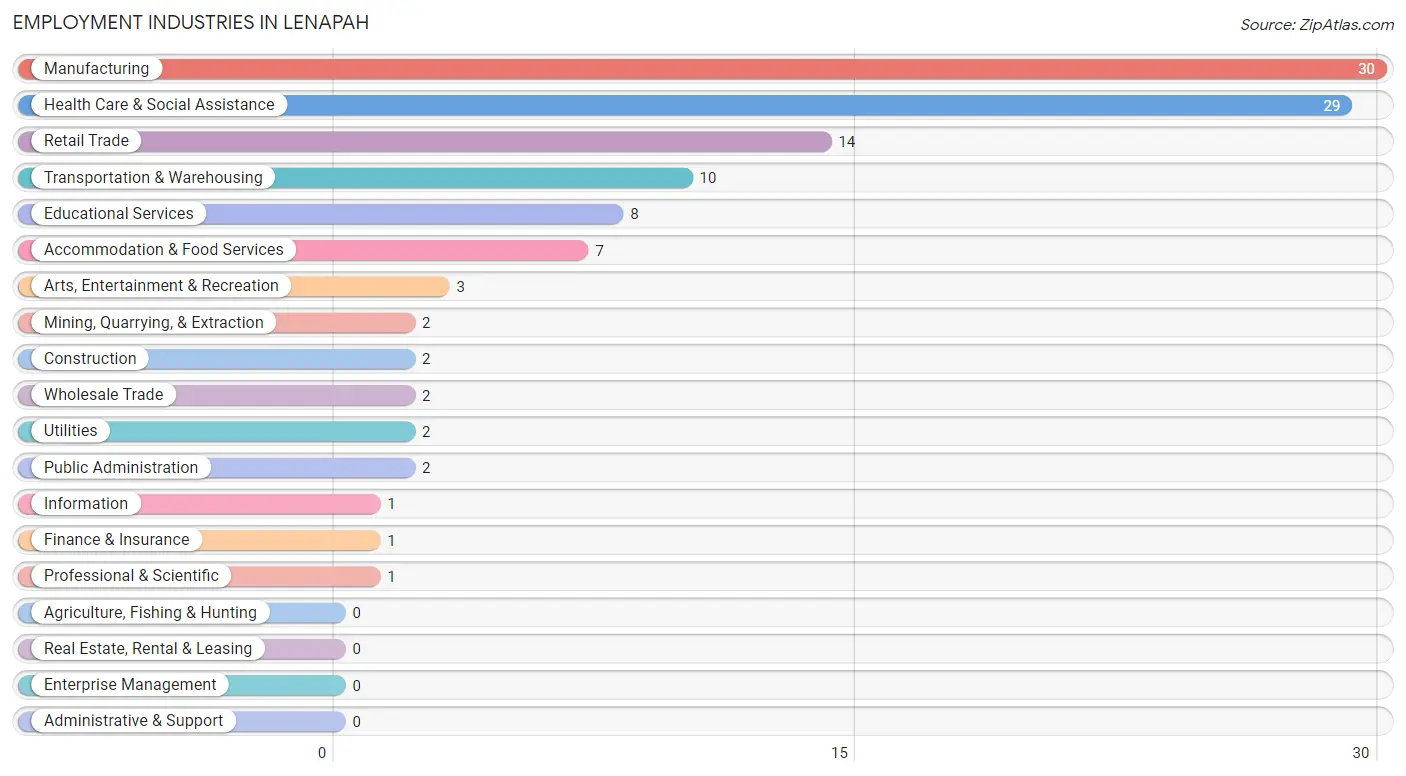
Employment Industries in Lenapah
The major employment industries in Lenapah include Manufacturing (30 | 25.9%), Health Care & Social Assistance (29 | 25.0%), Retail Trade (14 | 12.1%), Transportation & Warehousing (10 | 8.6%), and Educational Services (8 | 6.9%).
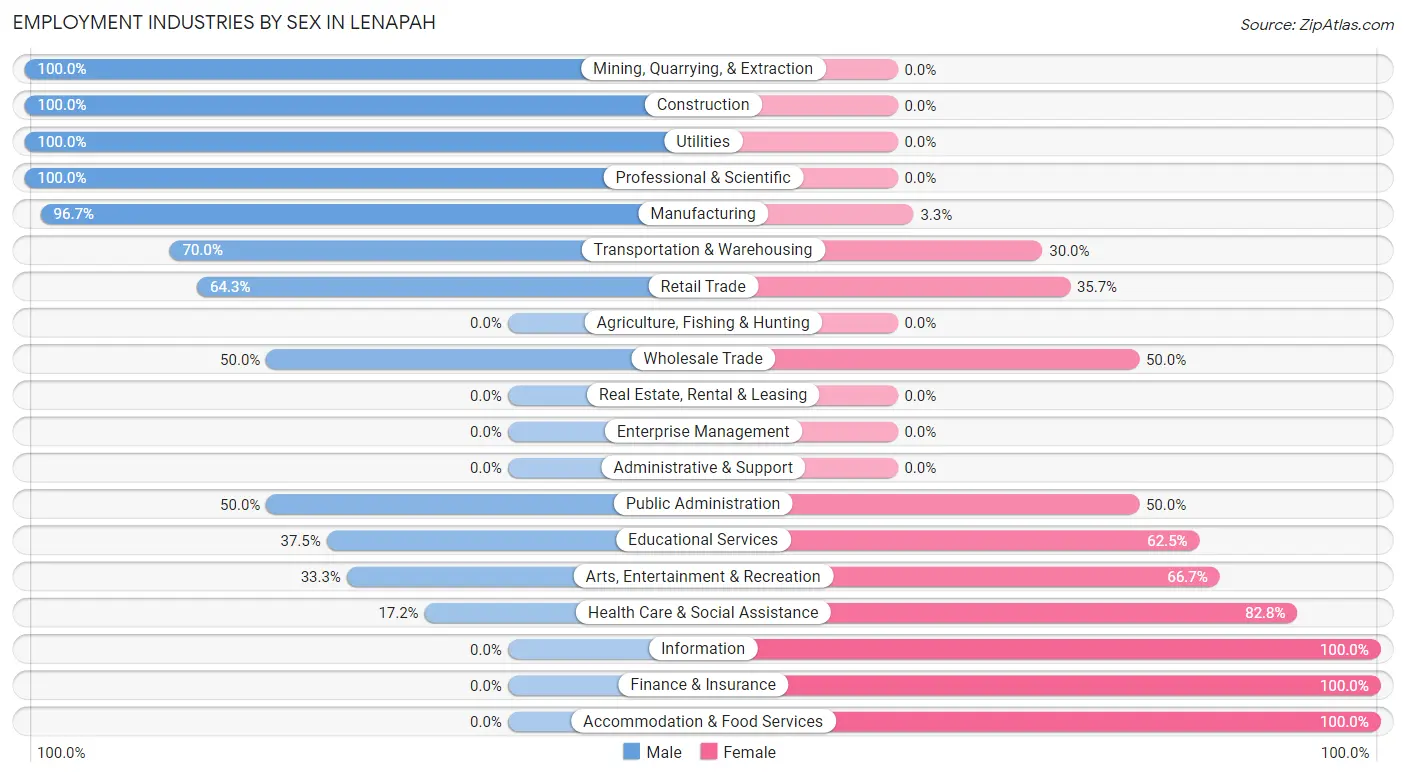
Employment Industries by Sex in Lenapah
The Lenapah industries that see more men than women are Mining, Quarrying, & Extraction (100.0%), Construction (100.0%), and Utilities (100.0%), whereas the industries that tend to have a higher number of women are Information (100.0%), Finance & Insurance (100.0%), and Accommodation & Food Services (100.0%).
| Industry | Male | Female |
| Agriculture, Fishing & Hunting | 0 (0.0%) | 0 (0.0%) |
| Mining, Quarrying, & Extraction | 2 (100.0%) | 0 (0.0%) |
| Construction | 2 (100.0%) | 0 (0.0%) |
| Manufacturing | 29 (96.7%) | 1 (3.3%) |
| Wholesale Trade | 1 (50.0%) | 1 (50.0%) |
| Retail Trade | 9 (64.3%) | 5 (35.7%) |
| Transportation & Warehousing | 7 (70.0%) | 3 (30.0%) |
| Utilities | 2 (100.0%) | 0 (0.0%) |
| Information | 0 (0.0%) | 1 (100.0%) |
| Finance & Insurance | 0 (0.0%) | 1 (100.0%) |
| Real Estate, Rental & Leasing | 0 (0.0%) | 0 (0.0%) |
| Professional & Scientific | 1 (100.0%) | 0 (0.0%) |
| Enterprise Management | 0 (0.0%) | 0 (0.0%) |
| Administrative & Support | 0 (0.0%) | 0 (0.0%) |
| Educational Services | 3 (37.5%) | 5 (62.5%) |
| Health Care & Social Assistance | 5 (17.2%) | 24 (82.8%) |
| Arts, Entertainment & Recreation | 1 (33.3%) | 2 (66.7%) |
| Accommodation & Food Services | 0 (0.0%) | 7 (100.0%) |
| Public Administration | 1 (50.0%) | 1 (50.0%) |
| Total | 65 (56.0%) | 51 (44.0%) |
Education in Lenapah
School Enrollment in Lenapah
The most common levels of schooling among the 68 students in Lenapah are high school (24 | 35.3%), middle school (16 | 23.5%), and nursery / preschool (11 | 16.2%).
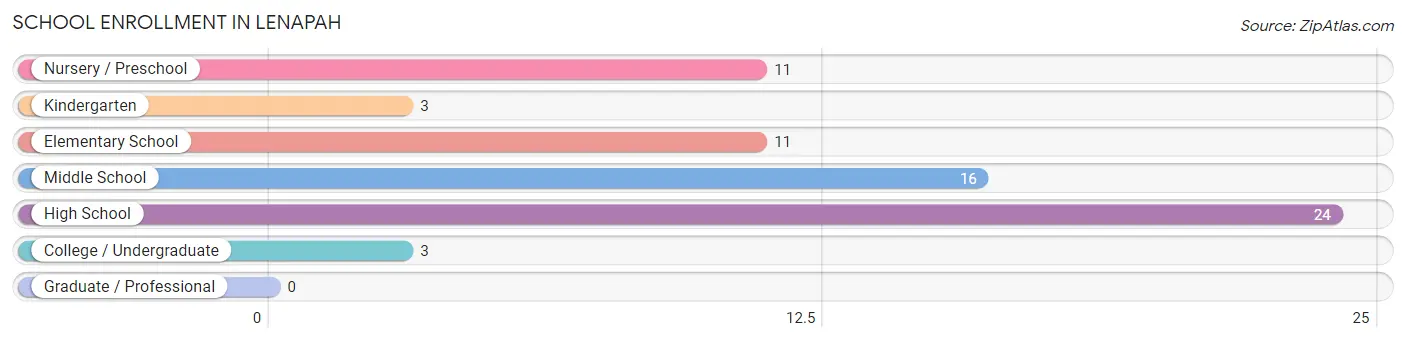
| School Level | # Students | % Students |
| Nursery / Preschool | 11 | 16.2% |
| Kindergarten | 3 | 4.4% |
| Elementary School | 11 | 16.2% |
| Middle School | 16 | 23.5% |
| High School | 24 | 35.3% |
| College / Undergraduate | 3 | 4.4% |
| Graduate / Professional | 0 | 0.0% |
| Total | 68 | 100.0% |
School Enrollment by Age by Funding Source in Lenapah
Out of a total of 68 students who are enrolled in schools in Lenapah, 9 (13.2%) attend a private institution, while the remaining 59 (86.8%) are enrolled in public schools. The age group of 3 to 4 year olds has the highest likelihood of being enrolled in private schools, with 3 (33.3% in the age bracket) enrolled. Conversely, the age group of 15 to 17 year olds has the lowest likelihood of being enrolled in a private school, with 15 (100.0% in the age bracket) attending a public institution.
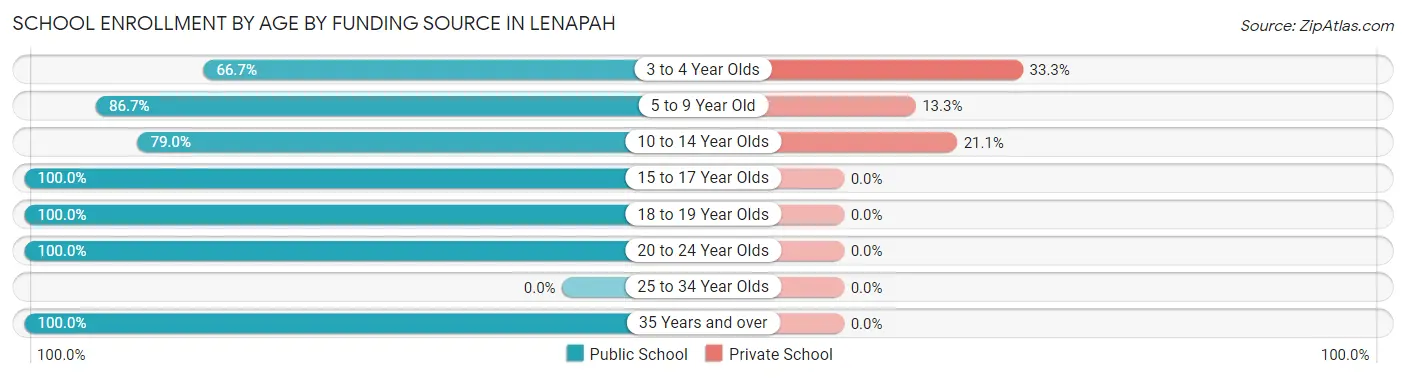
| Age Bracket | Public School | Private School |
| 3 to 4 Year Olds | 6 (66.7%) | 3 (33.3%) |
| 5 to 9 Year Old | 13 (86.7%) | 2 (13.3%) |
| 10 to 14 Year Olds | 15 (78.9%) | 4 (21.0%) |
| 15 to 17 Year Olds | 15 (100.0%) | 0 (0.0%) |
| 18 to 19 Year Olds | 7 (100.0%) | 0 (0.0%) |
| 20 to 24 Year Olds | 1 (100.0%) | 0 (0.0%) |
| 25 to 34 Year Olds | 0 (0.0%) | 0 (0.0%) |
| 35 Years and over | 2 (100.0%) | 0 (0.0%) |
| Total | 59 (86.8%) | 9 (13.2%) |
Educational Attainment by Field of Study in Lenapah
Science & technology (3 | 42.9%), education (2 | 28.6%), computers & mathematics (1 | 14.3%), and arts & humanities (1 | 14.3%) are the most common fields of study among 7 individuals in Lenapah who have obtained a bachelor's degree or higher.
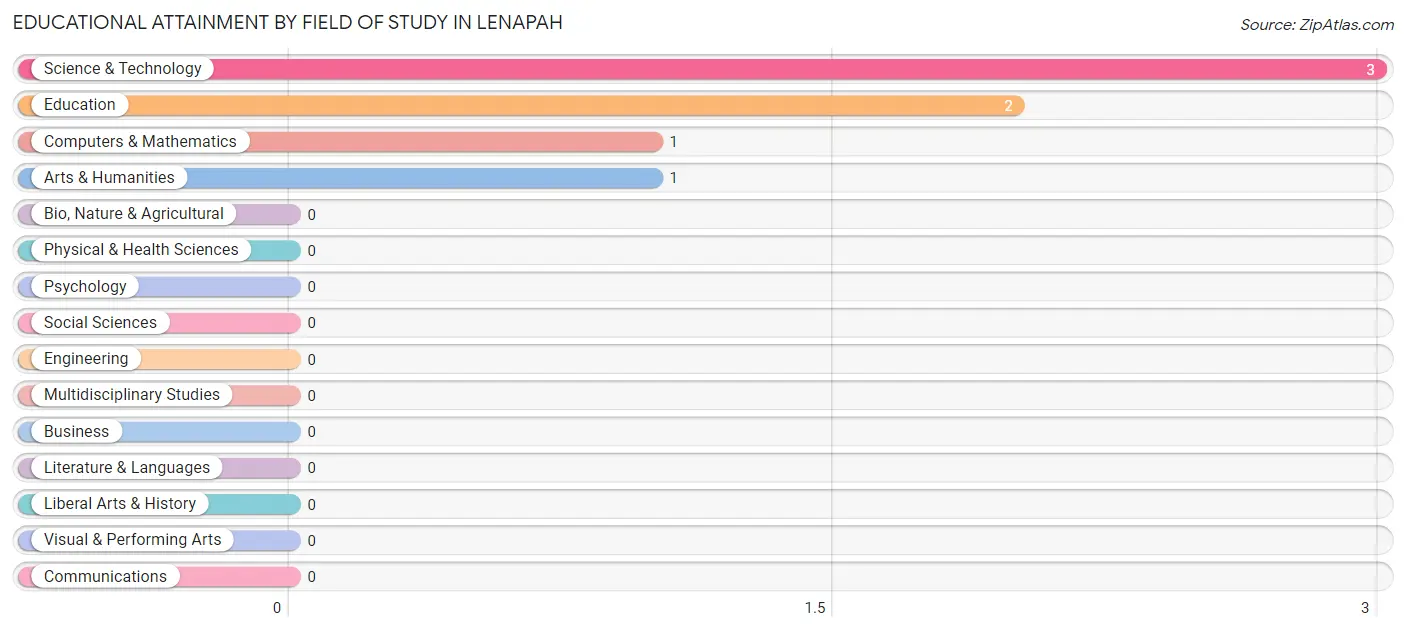
| Field of Study | # Graduates | % Graduates |
| Computers & Mathematics | 1 | 14.3% |
| Bio, Nature & Agricultural | 0 | 0.0% |
| Physical & Health Sciences | 0 | 0.0% |
| Psychology | 0 | 0.0% |
| Social Sciences | 0 | 0.0% |
| Engineering | 0 | 0.0% |
| Multidisciplinary Studies | 0 | 0.0% |
| Science & Technology | 3 | 42.9% |
| Business | 0 | 0.0% |
| Education | 2 | 28.6% |
| Literature & Languages | 0 | 0.0% |
| Liberal Arts & History | 0 | 0.0% |
| Visual & Performing Arts | 0 | 0.0% |
| Communications | 0 | 0.0% |
| Arts & Humanities | 1 | 14.3% |
| Total | 7 | 100.0% |
Transportation & Commute in Lenapah
Vehicle Availability by Sex in Lenapah
The most prevalent vehicle ownership categories in Lenapah are males with 3 vehicles (25, accounting for 38.5%) and females with 3 vehicles (18, making up 55.6%).
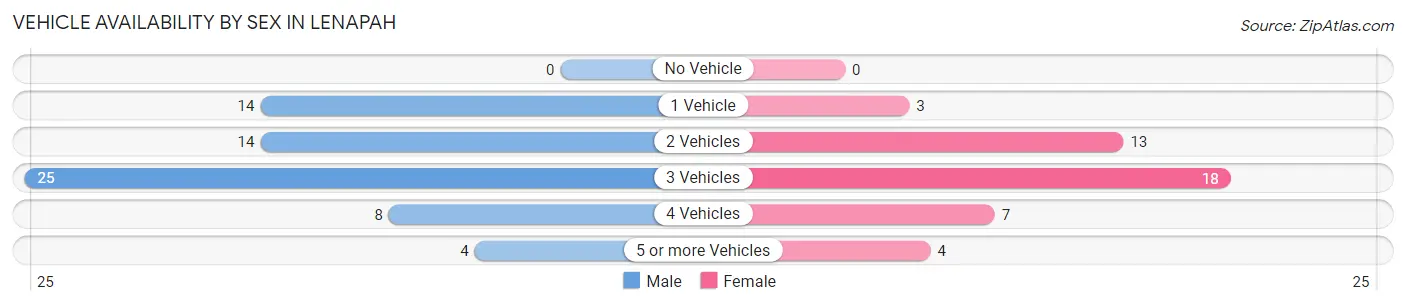
| Vehicles Available | Male | Female |
| No Vehicle | 0 (0.0%) | 0 (0.0%) |
| 1 Vehicle | 14 (21.5%) | 3 (6.7%) |
| 2 Vehicles | 14 (21.5%) | 13 (28.9%) |
| 3 Vehicles | 25 (38.5%) | 18 (40.0%) |
| 4 Vehicles | 8 (12.3%) | 7 (15.6%) |
| 5 or more Vehicles | 4 (6.1%) | 4 (8.9%) |
| Total | 65 (100.0%) | 45 (100.0%) |
Commute Time in Lenapah
The most frequently occuring commute durations in Lenapah are 20 to 24 minutes (22 commuters, 21.8%), 45 to 59 minutes (19 commuters, 18.8%), and 30 to 34 minutes (16 commuters, 15.8%).
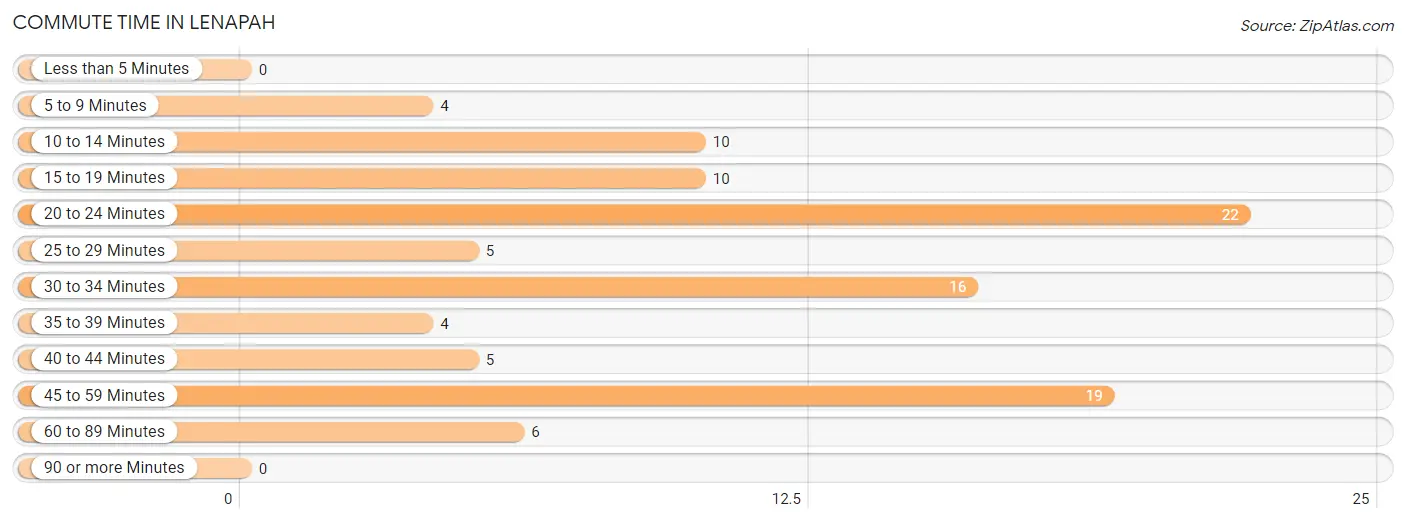
| Commute Time | # Commuters | % Commuters |
| Less than 5 Minutes | 0 | 0.0% |
| 5 to 9 Minutes | 4 | 4.0% |
| 10 to 14 Minutes | 10 | 9.9% |
| 15 to 19 Minutes | 10 | 9.9% |
| 20 to 24 Minutes | 22 | 21.8% |
| 25 to 29 Minutes | 5 | 5.0% |
| 30 to 34 Minutes | 16 | 15.8% |
| 35 to 39 Minutes | 4 | 4.0% |
| 40 to 44 Minutes | 5 | 5.0% |
| 45 to 59 Minutes | 19 | 18.8% |
| 60 to 89 Minutes | 6 | 5.9% |
| 90 or more Minutes | 0 | 0.0% |
Commute Time by Sex in Lenapah
The most common commute times in Lenapah are 45 to 59 minutes (17 commuters, 27.9%) for males and 30 to 34 minutes (10 commuters, 25.0%) for females.
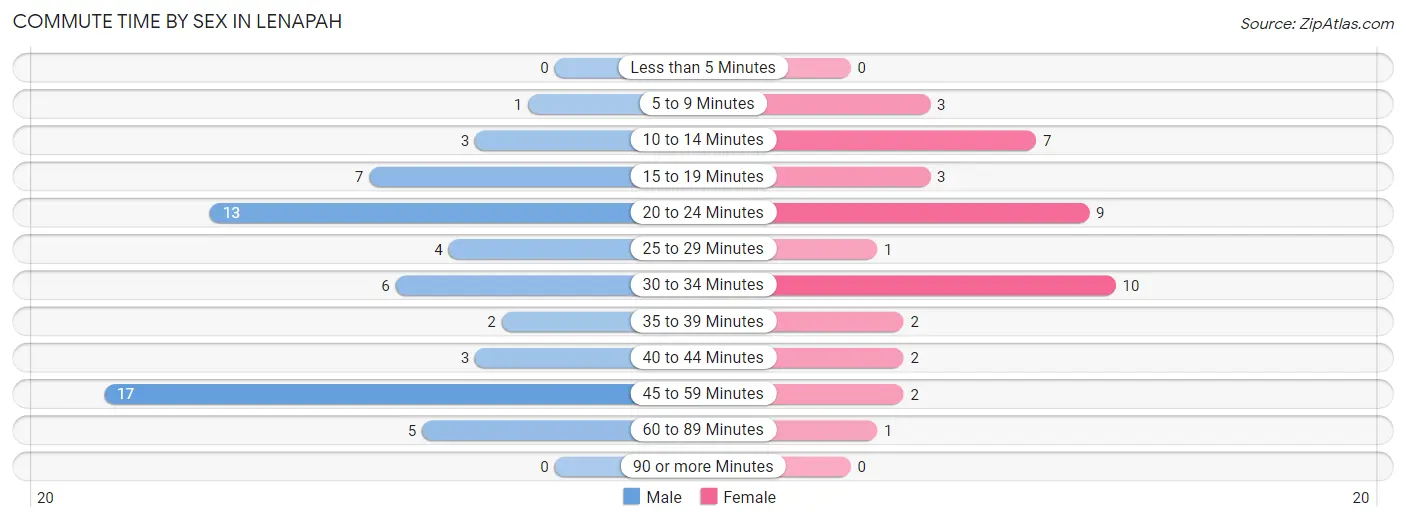
| Commute Time | Male | Female |
| Less than 5 Minutes | 0 (0.0%) | 0 (0.0%) |
| 5 to 9 Minutes | 1 (1.6%) | 3 (7.5%) |
| 10 to 14 Minutes | 3 (4.9%) | 7 (17.5%) |
| 15 to 19 Minutes | 7 (11.5%) | 3 (7.5%) |
| 20 to 24 Minutes | 13 (21.3%) | 9 (22.5%) |
| 25 to 29 Minutes | 4 (6.6%) | 1 (2.5%) |
| 30 to 34 Minutes | 6 (9.8%) | 10 (25.0%) |
| 35 to 39 Minutes | 2 (3.3%) | 2 (5.0%) |
| 40 to 44 Minutes | 3 (4.9%) | 2 (5.0%) |
| 45 to 59 Minutes | 17 (27.9%) | 2 (5.0%) |
| 60 to 89 Minutes | 5 (8.2%) | 1 (2.5%) |
| 90 or more Minutes | 0 (0.0%) | 0 (0.0%) |
Time of Departure to Work by Sex in Lenapah
The most frequent times of departure to work in Lenapah are 12:00 AM to 4:59 AM (20, 32.8%) for males and 7:00 AM to 7:29 AM (8, 20.0%) for females.
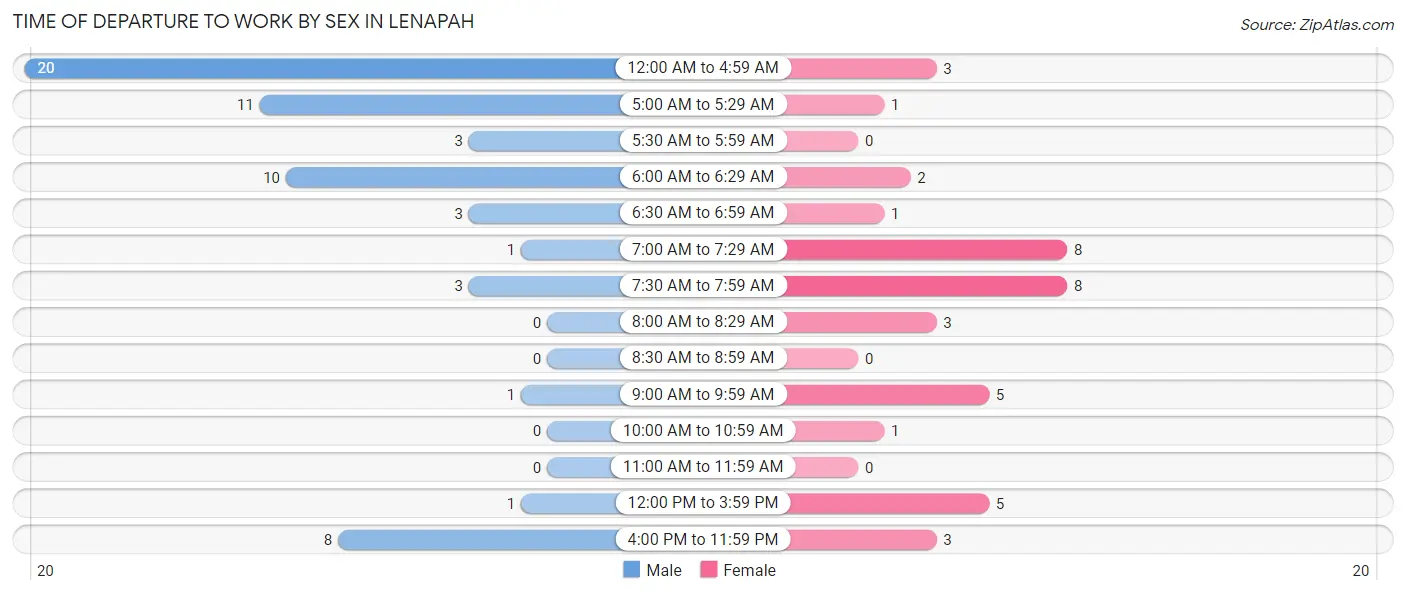
| Time of Departure | Male | Female |
| 12:00 AM to 4:59 AM | 20 (32.8%) | 3 (7.5%) |
| 5:00 AM to 5:29 AM | 11 (18.0%) | 1 (2.5%) |
| 5:30 AM to 5:59 AM | 3 (4.9%) | 0 (0.0%) |
| 6:00 AM to 6:29 AM | 10 (16.4%) | 2 (5.0%) |
| 6:30 AM to 6:59 AM | 3 (4.9%) | 1 (2.5%) |
| 7:00 AM to 7:29 AM | 1 (1.6%) | 8 (20.0%) |
| 7:30 AM to 7:59 AM | 3 (4.9%) | 8 (20.0%) |
| 8:00 AM to 8:29 AM | 0 (0.0%) | 3 (7.5%) |
| 8:30 AM to 8:59 AM | 0 (0.0%) | 0 (0.0%) |
| 9:00 AM to 9:59 AM | 1 (1.6%) | 5 (12.5%) |
| 10:00 AM to 10:59 AM | 0 (0.0%) | 1 (2.5%) |
| 11:00 AM to 11:59 AM | 0 (0.0%) | 0 (0.0%) |
| 12:00 PM to 3:59 PM | 1 (1.6%) | 5 (12.5%) |
| 4:00 PM to 11:59 PM | 8 (13.1%) | 3 (7.5%) |
| Total | 61 (100.0%) | 40 (100.0%) |
Housing Occupancy in Lenapah
Occupancy by Ownership in Lenapah
Of the total 90 dwellings in Lenapah, owner-occupied units account for 64 (71.1%), while renter-occupied units make up 26 (28.9%).
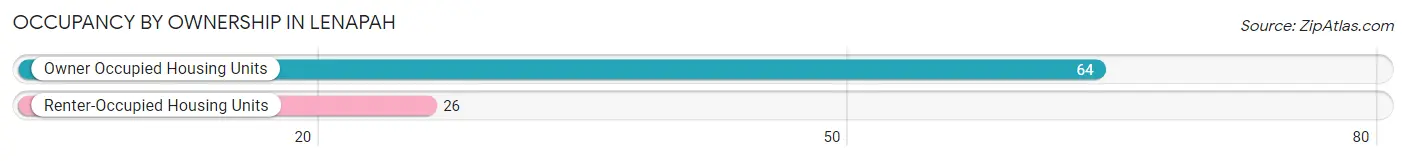
| Occupancy | # Housing Units | % Housing Units |
| Owner Occupied Housing Units | 64 | 71.1% |
| Renter-Occupied Housing Units | 26 | 28.9% |
| Total Occupied Housing Units | 90 | 100.0% |
Occupancy by Household Size in Lenapah
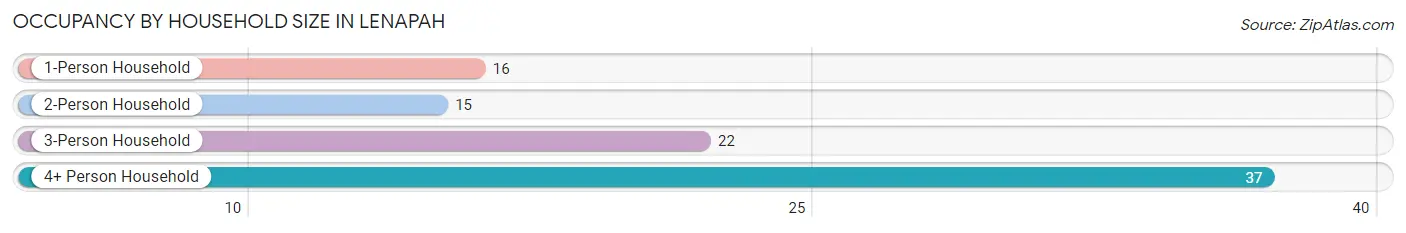
| Household Size | # Housing Units | % Housing Units |
| 1-Person Household | 16 | 17.8% |
| 2-Person Household | 15 | 16.7% |
| 3-Person Household | 22 | 24.4% |
| 4+ Person Household | 37 | 41.1% |
| Total Housing Units | 90 | 100.0% |
Occupancy by Ownership by Household Size in Lenapah
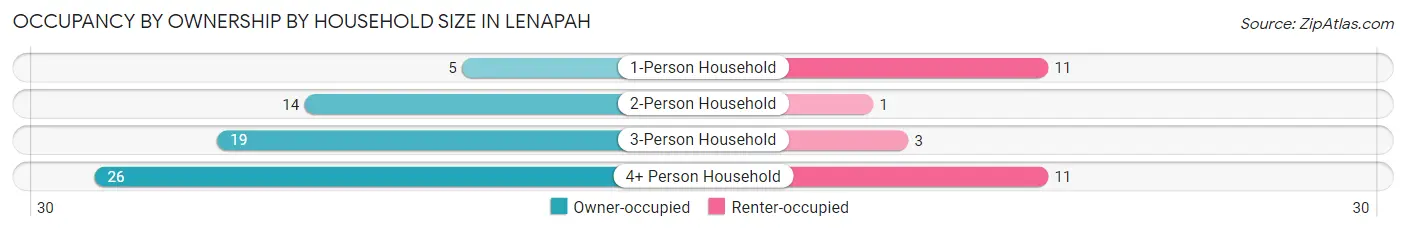
| Household Size | Owner-occupied | Renter-occupied |
| 1-Person Household | 5 (31.2%) | 11 (68.8%) |
| 2-Person Household | 14 (93.3%) | 1 (6.7%) |
| 3-Person Household | 19 (86.4%) | 3 (13.6%) |
| 4+ Person Household | 26 (70.3%) | 11 (29.7%) |
| Total Housing Units | 64 (71.1%) | 26 (28.9%) |
Occupancy by Educational Attainment in Lenapah
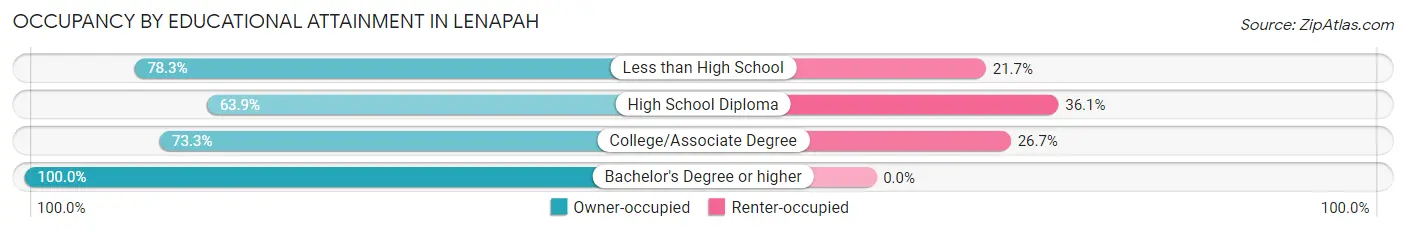
| Household Size | Owner-occupied | Renter-occupied |
| Less than High School | 18 (78.3%) | 5 (21.7%) |
| High School Diploma | 23 (63.9%) | 13 (36.1%) |
| College/Associate Degree | 22 (73.3%) | 8 (26.7%) |
| Bachelor's Degree or higher | 1 (100.0%) | 0 (0.0%) |
Occupancy by Age of Householder in Lenapah
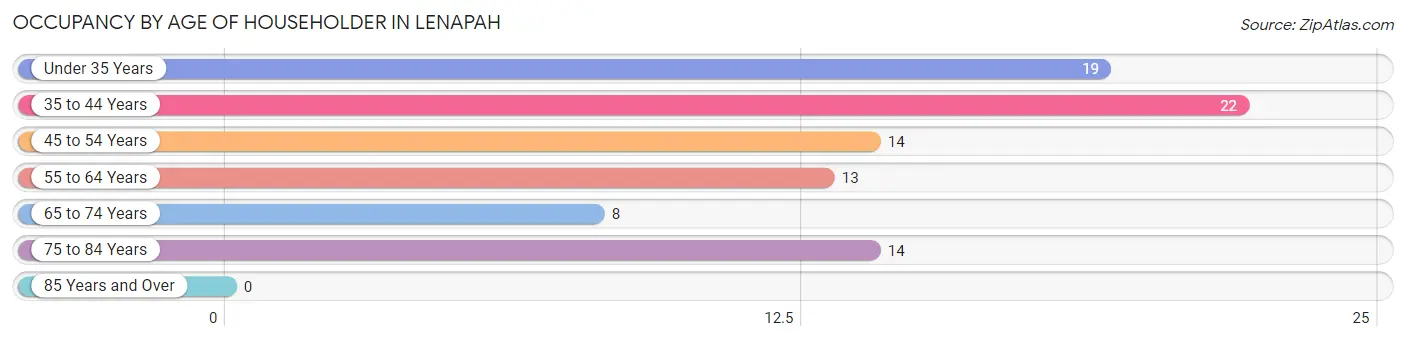
| Age Bracket | # Households | % Households |
| Under 35 Years | 19 | 21.1% |
| 35 to 44 Years | 22 | 24.4% |
| 45 to 54 Years | 14 | 15.6% |
| 55 to 64 Years | 13 | 14.4% |
| 65 to 74 Years | 8 | 8.9% |
| 75 to 84 Years | 14 | 15.6% |
| 85 Years and Over | 0 | 0.0% |
| Total | 90 | 100.0% |
Housing Finances in Lenapah
Median Income by Occupancy in Lenapah
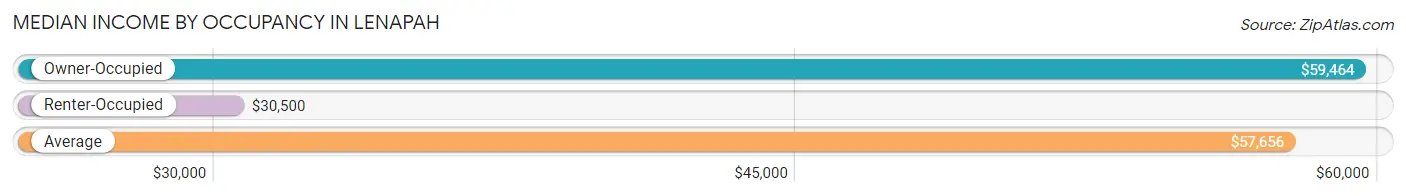
| Occupancy Type | # Households | Median Income |
| Owner-Occupied | 64 (71.1%) | $59,464 |
| Renter-Occupied | 26 (28.9%) | $30,500 |
| Average | 90 (100.0%) | $57,656 |
Occupancy by Householder Income Bracket in Lenapah
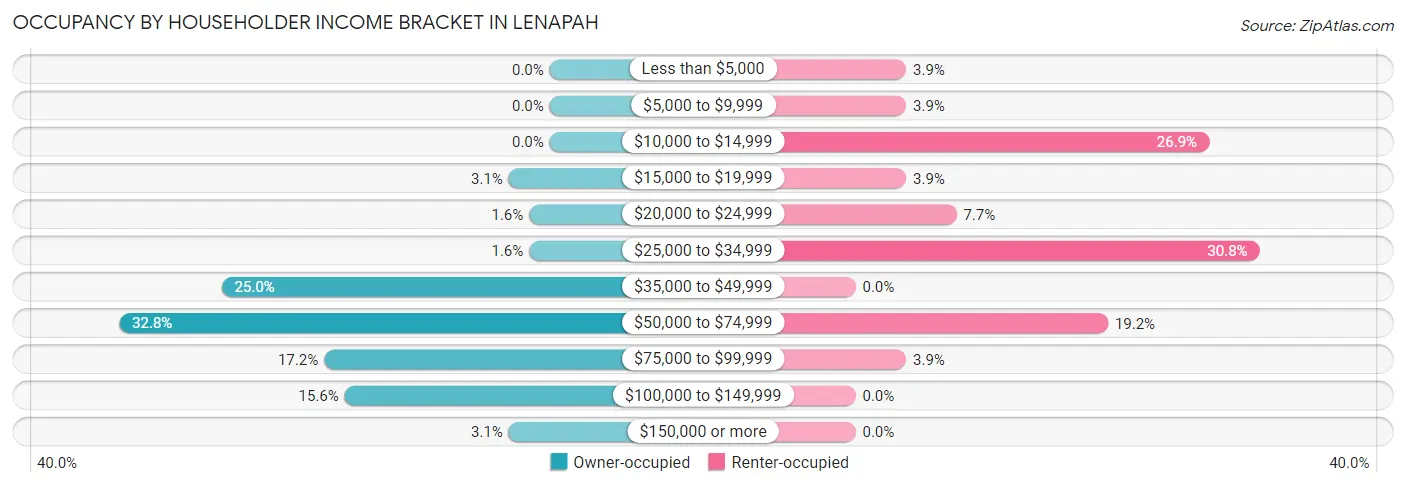
| Income Bracket | Owner-occupied | Renter-occupied |
| Less than $5,000 | 0 (0.0%) | 1 (3.8%) |
| $5,000 to $9,999 | 0 (0.0%) | 1 (3.8%) |
| $10,000 to $14,999 | 0 (0.0%) | 7 (26.9%) |
| $15,000 to $19,999 | 2 (3.1%) | 1 (3.8%) |
| $20,000 to $24,999 | 1 (1.6%) | 2 (7.7%) |
| $25,000 to $34,999 | 1 (1.6%) | 8 (30.8%) |
| $35,000 to $49,999 | 16 (25.0%) | 0 (0.0%) |
| $50,000 to $74,999 | 21 (32.8%) | 5 (19.2%) |
| $75,000 to $99,999 | 11 (17.2%) | 1 (3.8%) |
| $100,000 to $149,999 | 10 (15.6%) | 0 (0.0%) |
| $150,000 or more | 2 (3.1%) | 0 (0.0%) |
| Total | 64 (100.0%) | 26 (100.0%) |
Monthly Housing Cost Tiers in Lenapah
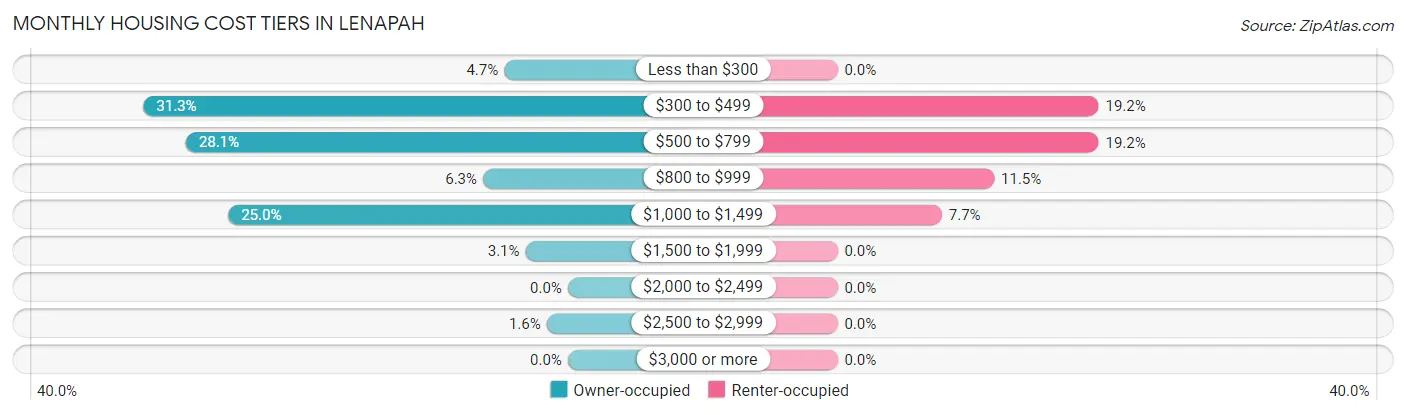
| Monthly Cost | Owner-occupied | Renter-occupied |
| Less than $300 | 3 (4.7%) | 0 (0.0%) |
| $300 to $499 | 20 (31.2%) | 5 (19.2%) |
| $500 to $799 | 18 (28.1%) | 5 (19.2%) |
| $800 to $999 | 4 (6.2%) | 3 (11.5%) |
| $1,000 to $1,499 | 16 (25.0%) | 2 (7.7%) |
| $1,500 to $1,999 | 2 (3.1%) | 0 (0.0%) |
| $2,000 to $2,499 | 0 (0.0%) | 0 (0.0%) |
| $2,500 to $2,999 | 1 (1.6%) | 0 (0.0%) |
| $3,000 or more | 0 (0.0%) | 0 (0.0%) |
| Total | 64 (100.0%) | 26 (100.0%) |
Physical Housing Characteristics in Lenapah
Housing Structures in Lenapah
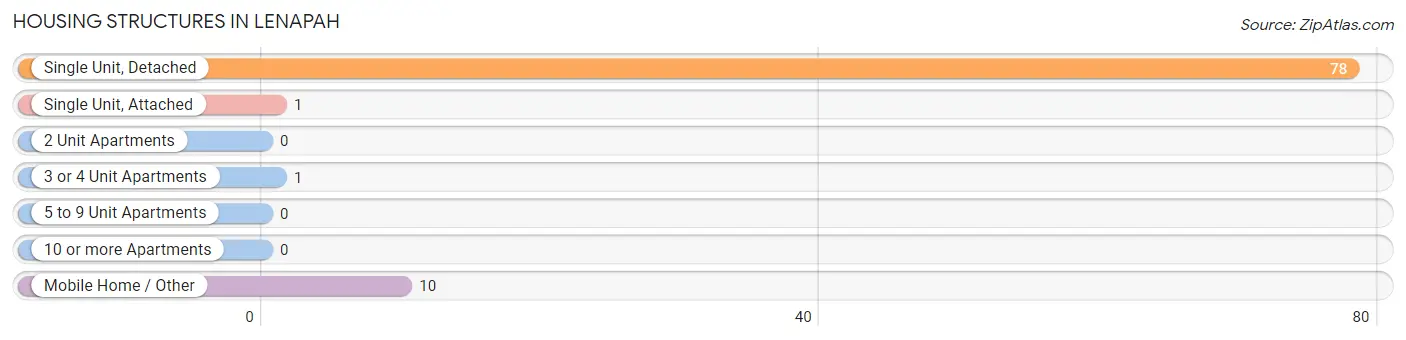
| Structure Type | # Housing Units | % Housing Units |
| Single Unit, Detached | 78 | 86.7% |
| Single Unit, Attached | 1 | 1.1% |
| 2 Unit Apartments | 0 | 0.0% |
| 3 or 4 Unit Apartments | 1 | 1.1% |
| 5 to 9 Unit Apartments | 0 | 0.0% |
| 10 or more Apartments | 0 | 0.0% |
| Mobile Home / Other | 10 | 11.1% |
| Total | 90 | 100.0% |
Housing Structures by Occupancy in Lenapah
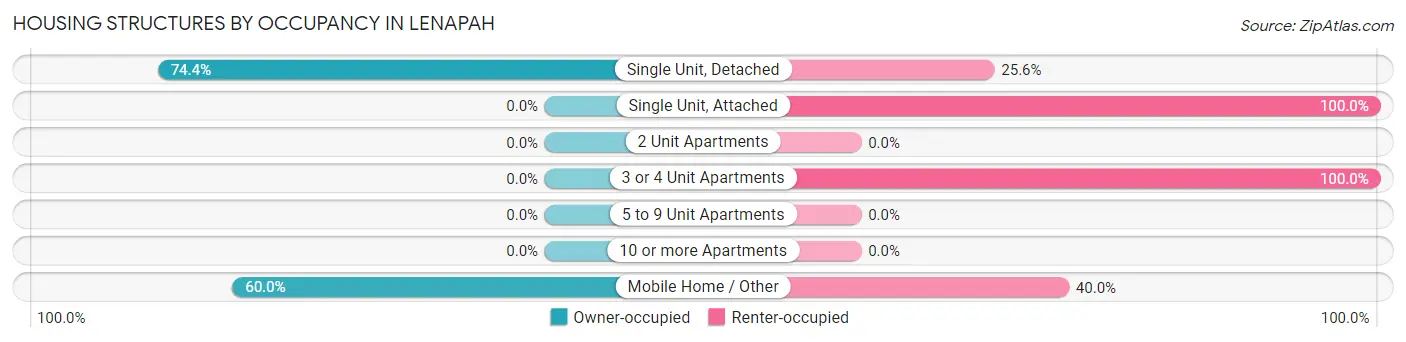
| Structure Type | Owner-occupied | Renter-occupied |
| Single Unit, Detached | 58 (74.4%) | 20 (25.6%) |
| Single Unit, Attached | 0 (0.0%) | 1 (100.0%) |
| 2 Unit Apartments | 0 (0.0%) | 0 (0.0%) |
| 3 or 4 Unit Apartments | 0 (0.0%) | 1 (100.0%) |
| 5 to 9 Unit Apartments | 0 (0.0%) | 0 (0.0%) |
| 10 or more Apartments | 0 (0.0%) | 0 (0.0%) |
| Mobile Home / Other | 6 (60.0%) | 4 (40.0%) |
| Total | 64 (71.1%) | 26 (28.9%) |
Housing Structures by Number of Rooms in Lenapah
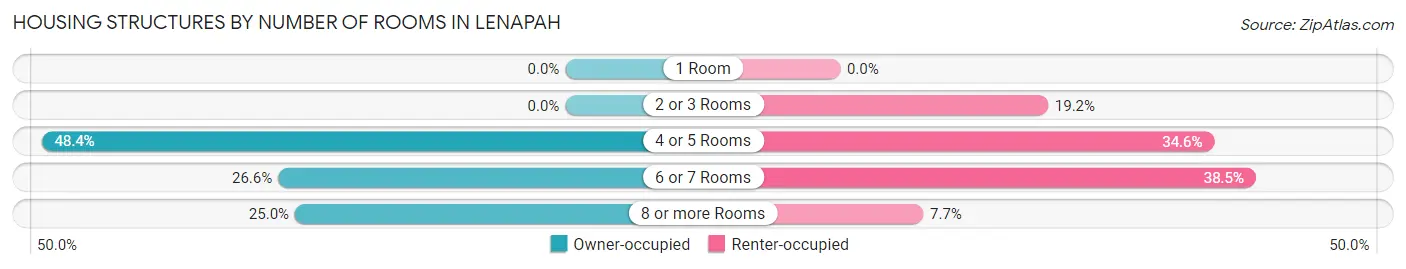
| Number of Rooms | Owner-occupied | Renter-occupied |
| 1 Room | 0 (0.0%) | 0 (0.0%) |
| 2 or 3 Rooms | 0 (0.0%) | 5 (19.2%) |
| 4 or 5 Rooms | 31 (48.4%) | 9 (34.6%) |
| 6 or 7 Rooms | 17 (26.6%) | 10 (38.5%) |
| 8 or more Rooms | 16 (25.0%) | 2 (7.7%) |
| Total | 64 (100.0%) | 26 (100.0%) |
Housing Structure by Heating Type in Lenapah
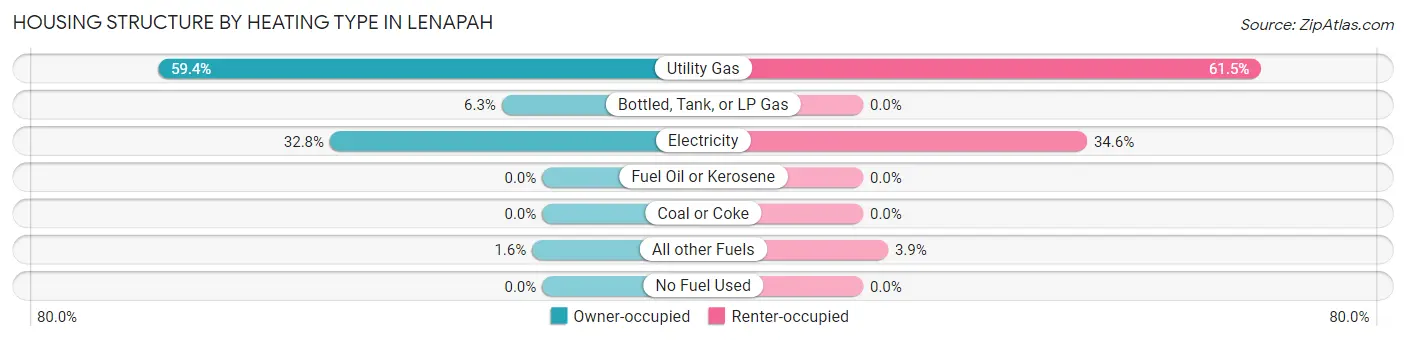
| Heating Type | Owner-occupied | Renter-occupied |
| Utility Gas | 38 (59.4%) | 16 (61.5%) |
| Bottled, Tank, or LP Gas | 4 (6.2%) | 0 (0.0%) |
| Electricity | 21 (32.8%) | 9 (34.6%) |
| Fuel Oil or Kerosene | 0 (0.0%) | 0 (0.0%) |
| Coal or Coke | 0 (0.0%) | 0 (0.0%) |
| All other Fuels | 1 (1.6%) | 1 (3.8%) |
| No Fuel Used | 0 (0.0%) | 0 (0.0%) |
| Total | 64 (100.0%) | 26 (100.0%) |
Household Vehicle Usage in Lenapah
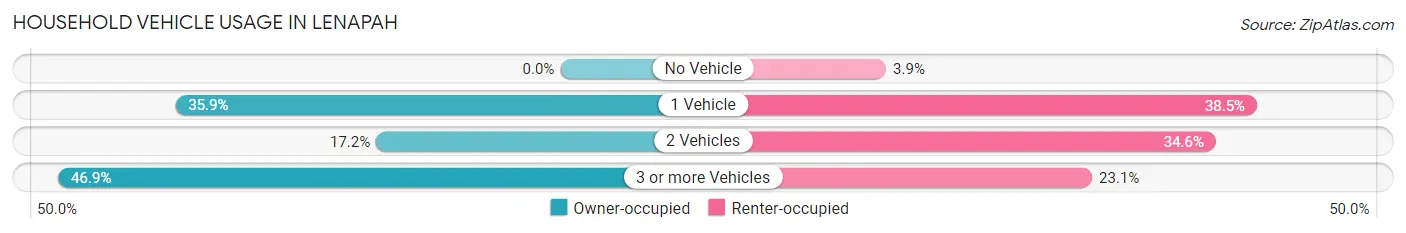
| Vehicles per Household | Owner-occupied | Renter-occupied |
| No Vehicle | 0 (0.0%) | 1 (3.8%) |
| 1 Vehicle | 23 (35.9%) | 10 (38.5%) |
| 2 Vehicles | 11 (17.2%) | 9 (34.6%) |
| 3 or more Vehicles | 30 (46.9%) | 6 (23.1%) |
| Total | 64 (100.0%) | 26 (100.0%) |
Real Estate & Mortgages in Lenapah
Real Estate and Mortgage Overview in Lenapah
| Characteristic | Without Mortgage | With Mortgage |
| Housing Units | 31 | 33 |
| Median Property Value | $36,700 | $83,800 |
| Median Household Income | $58,482 | $2 |
| Monthly Housing Costs | $358 | $0 |
| Real Estate Taxes | $199 | $2 |
Property Value by Mortgage Status in Lenapah
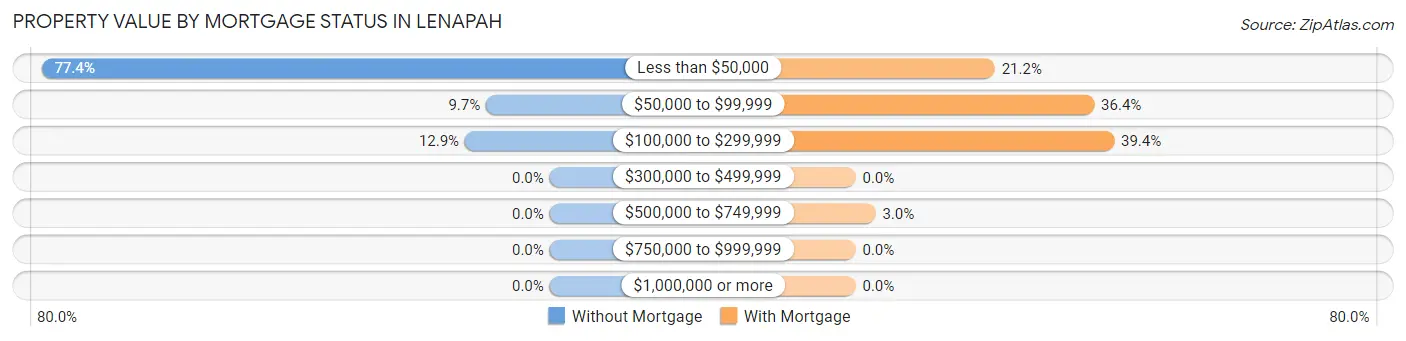
| Property Value | Without Mortgage | With Mortgage |
| Less than $50,000 | 24 (77.4%) | 7 (21.2%) |
| $50,000 to $99,999 | 3 (9.7%) | 12 (36.4%) |
| $100,000 to $299,999 | 4 (12.9%) | 13 (39.4%) |
| $300,000 to $499,999 | 0 (0.0%) | 0 (0.0%) |
| $500,000 to $749,999 | 0 (0.0%) | 1 (3.0%) |
| $750,000 to $999,999 | 0 (0.0%) | 0 (0.0%) |
| $1,000,000 or more | 0 (0.0%) | 0 (0.0%) |
| Total | 31 (100.0%) | 33 (100.0%) |
Household Income by Mortgage Status in Lenapah
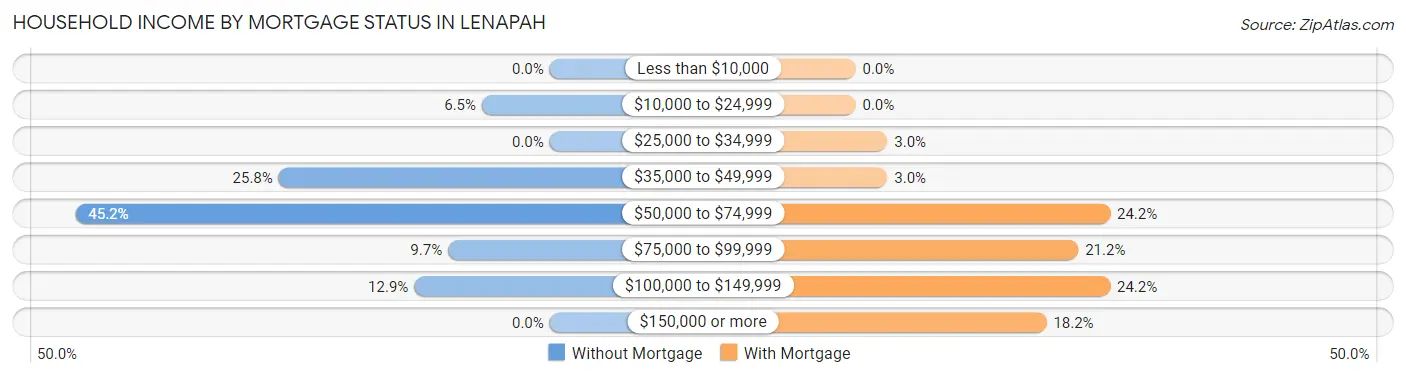
| Household Income | Without Mortgage | With Mortgage |
| Less than $10,000 | 0 (0.0%) | 0 (0.0%) |
| $10,000 to $24,999 | 2 (6.5%) | 0 (0.0%) |
| $25,000 to $34,999 | 0 (0.0%) | 1 (3.0%) |
| $35,000 to $49,999 | 8 (25.8%) | 1 (3.0%) |
| $50,000 to $74,999 | 14 (45.2%) | 8 (24.2%) |
| $75,000 to $99,999 | 3 (9.7%) | 7 (21.2%) |
| $100,000 to $149,999 | 4 (12.9%) | 8 (24.2%) |
| $150,000 or more | 0 (0.0%) | 6 (18.2%) |
| Total | 31 (100.0%) | 33 (100.0%) |
Property Value to Household Income Ratio in Lenapah
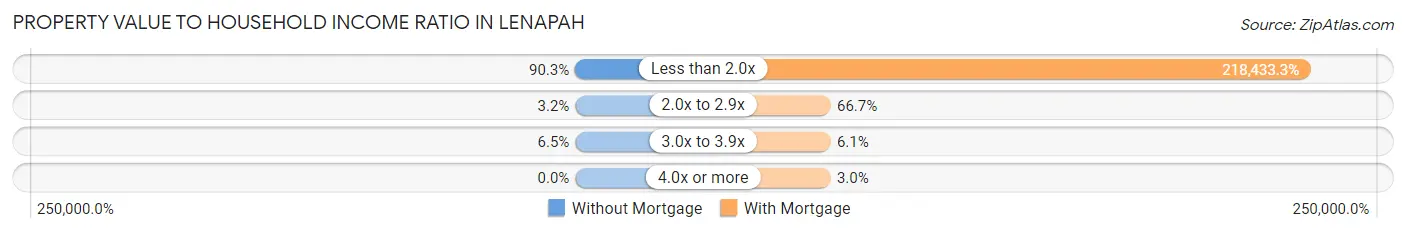
| Value-to-Income Ratio | Without Mortgage | With Mortgage |
| Less than 2.0x | 28 (90.3%) | 72,083 (218,433.3%) |
| 2.0x to 2.9x | 1 (3.2%) | 22 (66.7%) |
| 3.0x to 3.9x | 2 (6.5%) | 2 (6.1%) |
| 4.0x or more | 0 (0.0%) | 1 (3.0%) |
| Total | 31 (100.0%) | 33 (100.0%) |
Real Estate Taxes by Mortgage Status in Lenapah
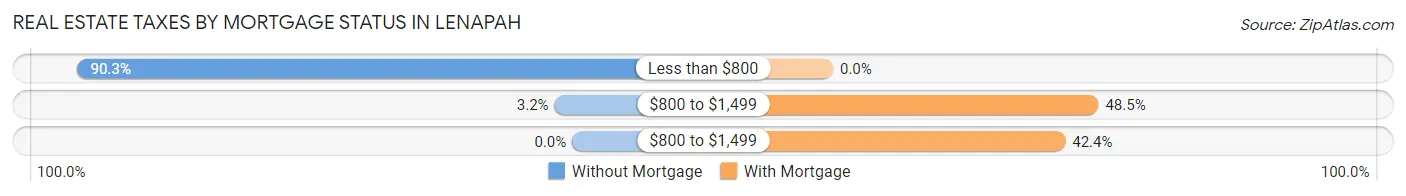
| Property Taxes | Without Mortgage | With Mortgage |
| Less than $800 | 28 (90.3%) | 0 (0.0%) |
| $800 to $1,499 | 1 (3.2%) | 16 (48.5%) |
| $800 to $1,499 | 0 (0.0%) | 14 (42.4%) |
| Total | 31 (100.0%) | 33 (100.0%) |
Health & Disability in Lenapah
Health Insurance Coverage by Age in Lenapah
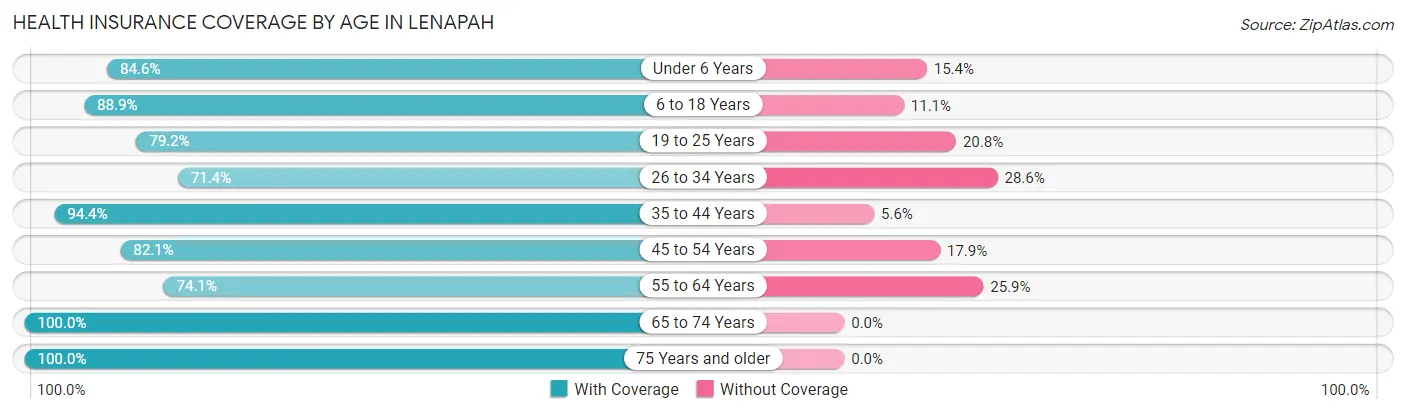
| Age Bracket | With Coverage | Without Coverage |
| Under 6 Years | 33 (84.6%) | 6 (15.4%) |
| 6 to 18 Years | 48 (88.9%) | 6 (11.1%) |
| 19 to 25 Years | 19 (79.2%) | 5 (20.8%) |
| 26 to 34 Years | 25 (71.4%) | 10 (28.6%) |
| 35 to 44 Years | 34 (94.4%) | 2 (5.6%) |
| 45 to 54 Years | 23 (82.1%) | 5 (17.9%) |
| 55 to 64 Years | 20 (74.1%) | 7 (25.9%) |
| 65 to 74 Years | 11 (100.0%) | 0 (0.0%) |
| 75 Years and older | 14 (100.0%) | 0 (0.0%) |
| Total | 227 (84.7%) | 41 (15.3%) |
Health Insurance Coverage by Citizenship Status in Lenapah
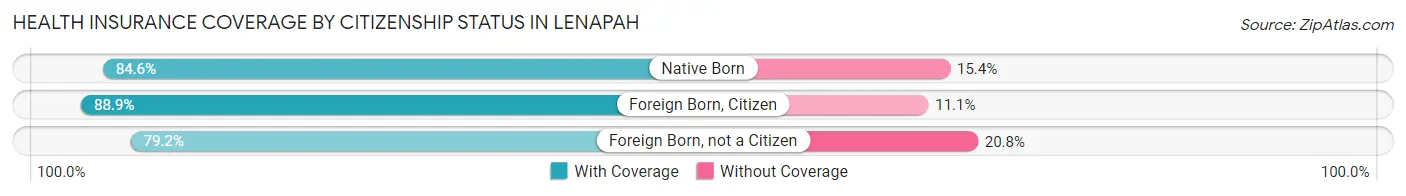
| Citizenship Status | With Coverage | Without Coverage |
| Native Born | 33 (84.6%) | 6 (15.4%) |
| Foreign Born, Citizen | 48 (88.9%) | 6 (11.1%) |
| Foreign Born, not a Citizen | 19 (79.2%) | 5 (20.8%) |
Health Insurance Coverage by Household Income in Lenapah
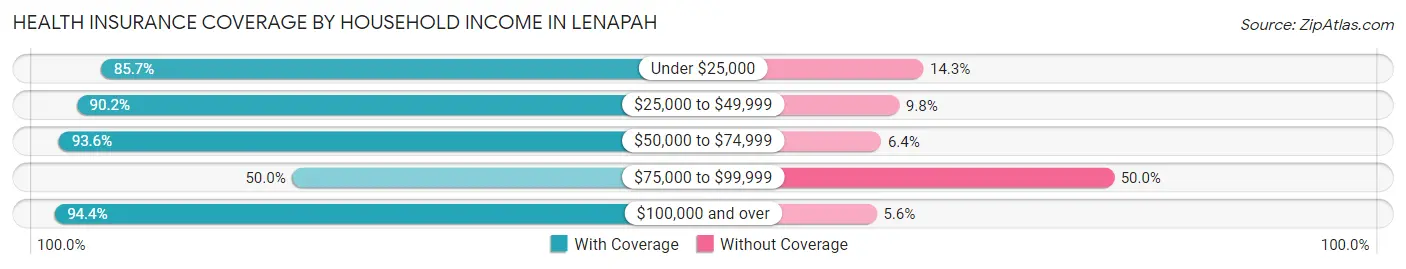
| Household Income | With Coverage | Without Coverage |
| Under $25,000 | 24 (85.7%) | 4 (14.3%) |
| $25,000 to $49,999 | 74 (90.2%) | 8 (9.8%) |
| $50,000 to $74,999 | 73 (93.6%) | 5 (6.4%) |
| $75,000 to $99,999 | 22 (50.0%) | 22 (50.0%) |
| $100,000 and over | 34 (94.4%) | 2 (5.6%) |
Public vs Private Health Insurance Coverage by Age in Lenapah
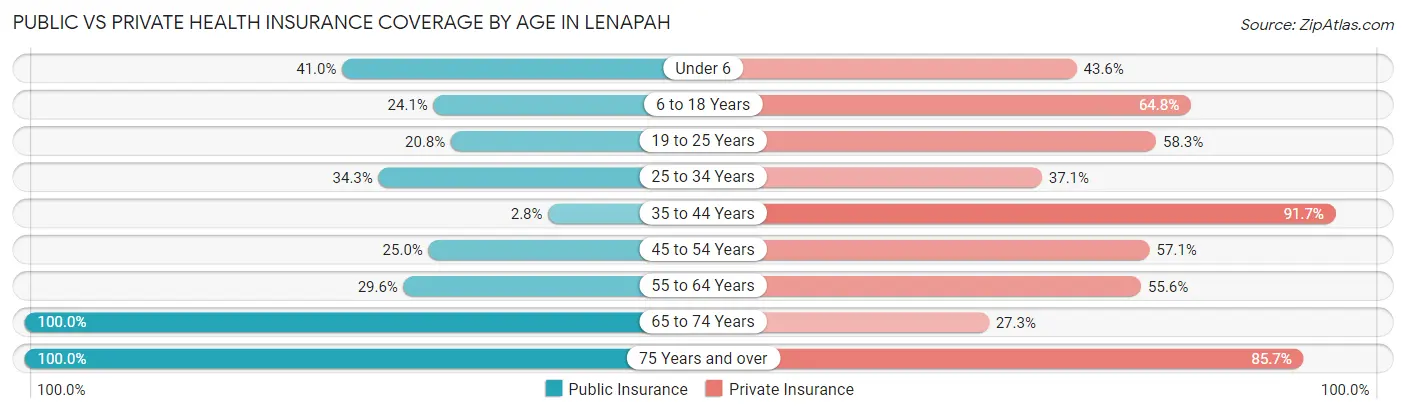
| Age Bracket | Public Insurance | Private Insurance |
| Under 6 | 16 (41.0%) | 17 (43.6%) |
| 6 to 18 Years | 13 (24.1%) | 35 (64.8%) |
| 19 to 25 Years | 5 (20.8%) | 14 (58.3%) |
| 25 to 34 Years | 12 (34.3%) | 13 (37.1%) |
| 35 to 44 Years | 1 (2.8%) | 33 (91.7%) |
| 45 to 54 Years | 7 (25.0%) | 16 (57.1%) |
| 55 to 64 Years | 8 (29.6%) | 15 (55.6%) |
| 65 to 74 Years | 11 (100.0%) | 3 (27.3%) |
| 75 Years and over | 14 (100.0%) | 12 (85.7%) |
| Total | 87 (32.5%) | 158 (59.0%) |
Disability Status by Sex by Age in Lenapah
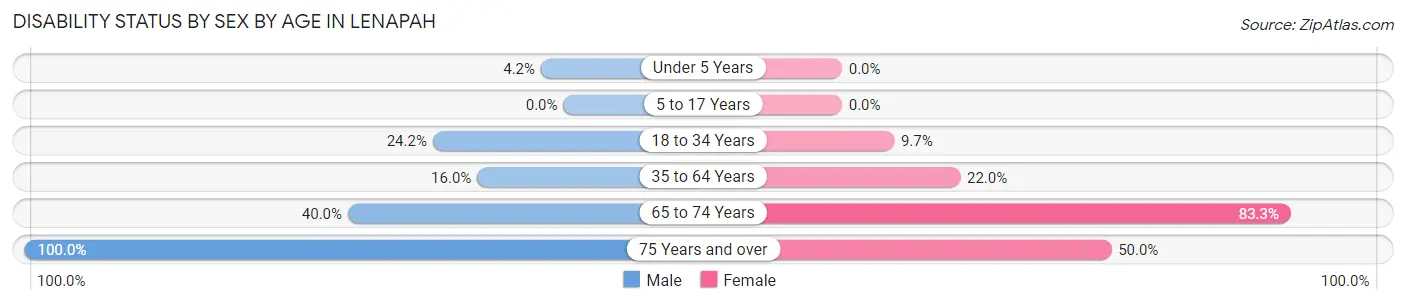
| Age Bracket | Male | Female |
| Under 5 Years | 1 (4.2%) | 0 (0.0%) |
| 5 to 17 Years | 0 (0.0%) | 0 (0.0%) |
| 18 to 34 Years | 8 (24.2%) | 3 (9.7%) |
| 35 to 64 Years | 8 (16.0%) | 9 (22.0%) |
| 65 to 74 Years | 2 (40.0%) | 5 (83.3%) |
| 75 Years and over | 12 (100.0%) | 1 (50.0%) |
Disability Class by Sex by Age in Lenapah
Disability Class: Hearing Difficulty
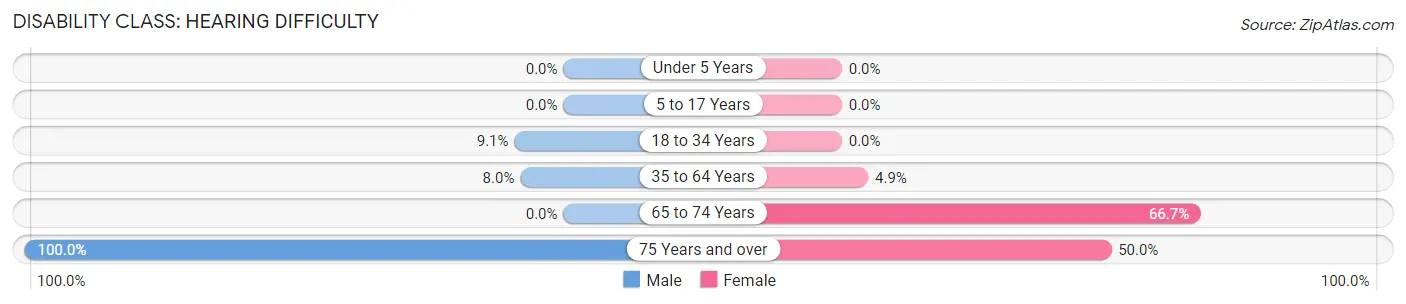
| Age Bracket | Male | Female |
| Under 5 Years | 0 (0.0%) | 0 (0.0%) |
| 5 to 17 Years | 0 (0.0%) | 0 (0.0%) |
| 18 to 34 Years | 3 (9.1%) | 0 (0.0%) |
| 35 to 64 Years | 4 (8.0%) | 2 (4.9%) |
| 65 to 74 Years | 0 (0.0%) | 4 (66.7%) |
| 75 Years and over | 12 (100.0%) | 1 (50.0%) |
Disability Class: Vision Difficulty
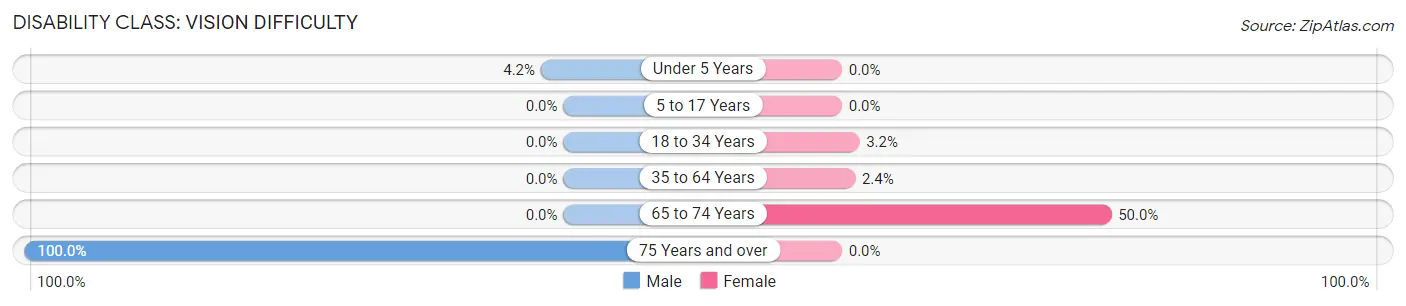
| Age Bracket | Male | Female |
| Under 5 Years | 1 (4.2%) | 0 (0.0%) |
| 5 to 17 Years | 0 (0.0%) | 0 (0.0%) |
| 18 to 34 Years | 0 (0.0%) | 1 (3.2%) |
| 35 to 64 Years | 0 (0.0%) | 1 (2.4%) |
| 65 to 74 Years | 0 (0.0%) | 3 (50.0%) |
| 75 Years and over | 12 (100.0%) | 0 (0.0%) |
Disability Class: Cognitive Difficulty
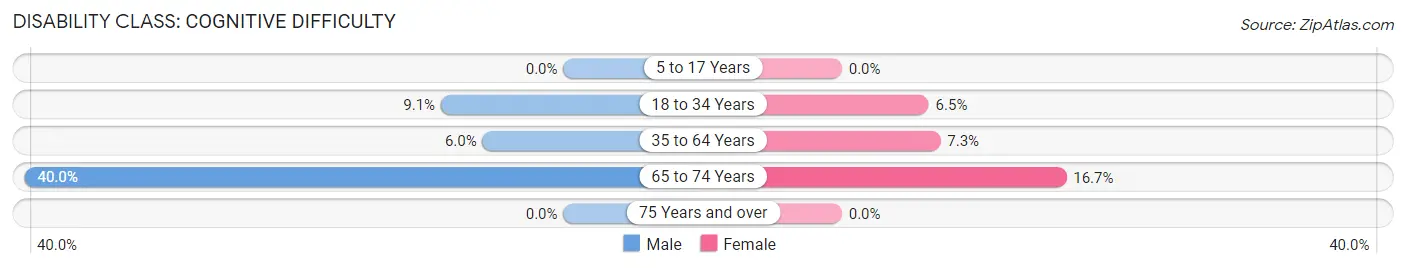
| Age Bracket | Male | Female |
| 5 to 17 Years | 0 (0.0%) | 0 (0.0%) |
| 18 to 34 Years | 3 (9.1%) | 2 (6.5%) |
| 35 to 64 Years | 3 (6.0%) | 3 (7.3%) |
| 65 to 74 Years | 2 (40.0%) | 1 (16.7%) |
| 75 Years and over | 0 (0.0%) | 0 (0.0%) |
Disability Class: Ambulatory Difficulty
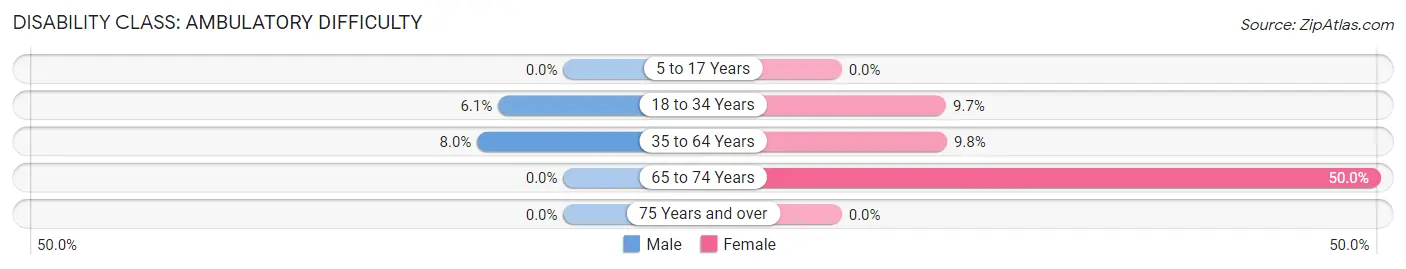
| Age Bracket | Male | Female |
| 5 to 17 Years | 0 (0.0%) | 0 (0.0%) |
| 18 to 34 Years | 2 (6.1%) | 3 (9.7%) |
| 35 to 64 Years | 4 (8.0%) | 4 (9.8%) |
| 65 to 74 Years | 0 (0.0%) | 3 (50.0%) |
| 75 Years and over | 0 (0.0%) | 0 (0.0%) |
Disability Class: Self-Care Difficulty
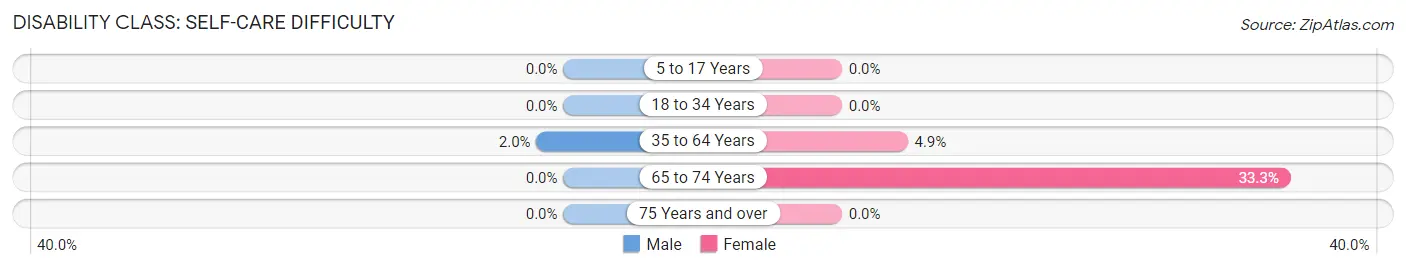
| Age Bracket | Male | Female |
| 5 to 17 Years | 0 (0.0%) | 0 (0.0%) |
| 18 to 34 Years | 0 (0.0%) | 0 (0.0%) |
| 35 to 64 Years | 1 (2.0%) | 2 (4.9%) |
| 65 to 74 Years | 0 (0.0%) | 2 (33.3%) |
| 75 Years and over | 0 (0.0%) | 0 (0.0%) |
Technology Access in Lenapah
Computing Device Access in Lenapah
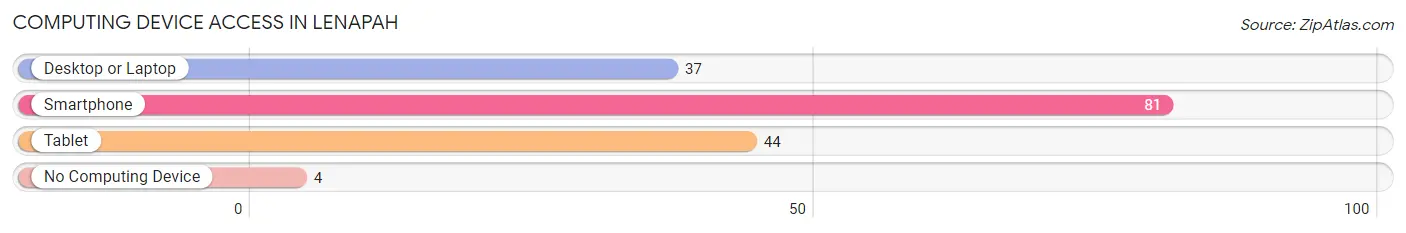
| Device Type | # Households | % Households |
| Desktop or Laptop | 37 | 41.1% |
| Smartphone | 81 | 90.0% |
| Tablet | 44 | 48.9% |
| No Computing Device | 4 | 4.4% |
| Total | 90 | 100.0% |
Internet Access in Lenapah
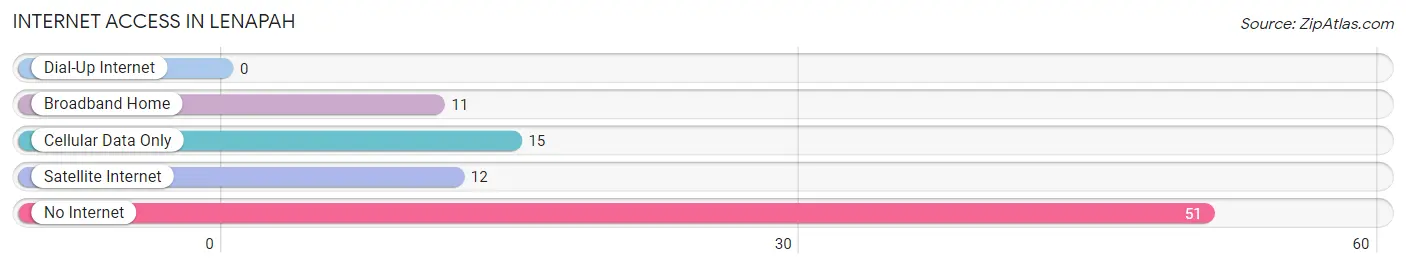
| Internet Type | # Households | % Households |
| Dial-Up Internet | 0 | 0.0% |
| Broadband Home | 11 | 12.2% |
| Cellular Data Only | 15 | 16.7% |
| Satellite Internet | 12 | 13.3% |
| No Internet | 51 | 56.7% |
| Total | 90 | 100.0% |
Lenapah Summary
Lenapah is a small town located in the northeastern corner of Oklahoma, in Nowata County. It is situated on the banks of the Verdigris River, and is surrounded by rolling hills and wooded areas. The town was founded in 1891 by the Lenapah Townsite Company, and was named after the Lenapah Creek, which runs through the area. The town was originally a trading post for the local Native American tribes, and was later used as a stop on the Missouri-Kansas-Texas Railroad.
Lenapah is located in the Ozark Highlands region of Oklahoma, and is part of the Tulsa Metropolitan Statistical Area. The town has a population of approximately 1,000 people, and is home to a variety of businesses, including a grocery store, a hardware store, a bank, and a post office. The town is also home to a number of churches, including the First Baptist Church, the First United Methodist Church, and the Church of the Nazarene.
Geography
Lenapah is located in the northeastern corner of Oklahoma, in Nowata County. It is situated on the banks of the Verdigris River, and is surrounded by rolling hills and wooded areas. The town is located at an elevation of 890 feet above sea level, and has an average annual temperature of 61 degrees Fahrenheit. The town is located in the Ozark Highlands region of Oklahoma, and is part of the Tulsa Metropolitan Statistical Area.
Economy
The economy of Lenapah is largely based on agriculture and tourism. The town is home to a variety of businesses, including a grocery store, a hardware store, a bank, and a post office. The town is also home to a number of churches, including the First Baptist Church, the First United Methodist Church, and the Church of the Nazarene.
The town is also home to a number of tourist attractions, including the Lenapah Historical Museum, the Lenapah Wildlife Refuge, and the Lenapah Creek Nature Trail. The town is also home to a number of festivals and events, including the Lenapah Rodeo, the Lenapah Music Festival, and the Lenapah Arts and Crafts Festival.
Demographics
As of the 2010 census, the population of Lenapah was 1,000 people. The racial makeup of the town was 95.2% White, 0.7% African American, 0.7% Native American, 0.3% Asian, 0.1% Pacific Islander, and 2.1% from other races. The median household income in the town was $30,000, and the median family income was $35,000. The per capita income in the town was $14,000.
Conclusion
Lenapah is a small town located in the northeastern corner of Oklahoma, in Nowata County. It is situated on the banks of the Verdigris River, and is surrounded by rolling hills and wooded areas. The town was founded in 1891 by the Lenapah Townsite Company, and was named after the Lenapah Creek, which runs through the area. The town has a population of approximately 1,000 people, and is home to a variety of businesses, including a grocery store, a hardware store, a bank, and a post office. The economy of Lenapah is largely based on agriculture and tourism, and the town is home to a number of tourist attractions, including the Lenapah Historical Museum, the Lenapah Wildlife Refuge, and the Lenapah Creek Nature Trail. The racial makeup of the town is 95.2% White, 0.7% African American, 0.7% Native American, 0.3% Asian, 0.1% Pacific Islander, and 2.1% from other races. The median household income in the town was $30,000, and the median family income was $35,000.
Common Questions
What is Per Capita Income in Lenapah?
Per Capita income in Lenapah is $21,834.
What is the Median Family Income in Lenapah?
Median Family Income in Lenapah is $58,393.
What is the Median Household income in Lenapah?
Median Household Income in Lenapah is $57,656.
What is Income or Wage Gap in Lenapah?
Income or Wage Gap in Lenapah is 62.9%.
Women in Lenapah earn 37.1 cents for every dollar earned by a man.
What is Inequality or Gini Index in Lenapah?
Inequality or Gini Index in Lenapah is 0.33.
What is the Total Population of Lenapah?
Total Population of Lenapah is 268.
What is the Total Male Population of Lenapah?
Total Male Population of Lenapah is 152.
What is the Total Female Population of Lenapah?
Total Female Population of Lenapah is 116.
What is the Ratio of Males per 100 Females in Lenapah?
There are 131.03 Males per 100 Females in Lenapah.
What is the Ratio of Females per 100 Males in Lenapah?
There are 76.32 Females per 100 Males in Lenapah.
What is the Median Population Age in Lenapah?
Median Population Age in Lenapah is 28.7 Years.
What is the Average Family Size in Lenapah
Average Family Size in Lenapah is 3.2 People.
What is the Average Household Size in Lenapah
Average Household Size in Lenapah is 3.0 People.
How Large is the Labor Force in Lenapah?
There are 118 People in the Labor Forcein in Lenapah.
What is the Percentage of People in the Labor Force in Lenapah?
60.5% of People are in the Labor Force in Lenapah.
What is the Unemployment Rate in Lenapah?
Unemployment Rate in Lenapah is 1.7%.