Agra, OK Map & Demographics
Agra Map
Agra Overview
$24,049
PER CAPITA INCOME
$98,438
AVG FAMILY INCOME
$60,208
AVG HOUSEHOLD INCOME
32.7%
WAGE / INCOME GAP [ % ]
67.3¢/ $1
WAGE / INCOME GAP [ $ ]
0.46
INEQUALITY / GINI INDEX
594
TOTAL POPULATION
251
MALE POPULATION
343
FEMALE POPULATION
73.18
MALES / 100 FEMALES
136.65
FEMALES / 100 MALES
24.5
MEDIAN AGE
4.5
AVG FAMILY SIZE
3.8
AVG HOUSEHOLD SIZE
200
LABOR FORCE [ PEOPLE ]
58.3%
PERCENT IN LABOR FORCE
1.5%
UNEMPLOYMENT RATE
Agra Zip Codes
Agra Area Codes
Income in Agra
Income Overview in Agra
Per Capita Income in Agra is $24,049, while median incomes of families and households are $98,438 and $60,208 respectively.
| Characteristic | Number | Measure |
| Per Capita Income | 594 | $24,049 |
| Median Family Income | 119 | $98,438 |
| Mean Family Income | 119 | $96,503 |
| Median Household Income | 155 | $60,208 |
| Mean Household Income | 155 | $84,023 |
| Income Deficit | 119 | $0 |
| Wage / Income Gap (%) | 594 | 32.71% |
| Wage / Income Gap ($) | 594 | 67.29¢ per $1 |
| Gini / Inequality Index | 594 | 0.46 |
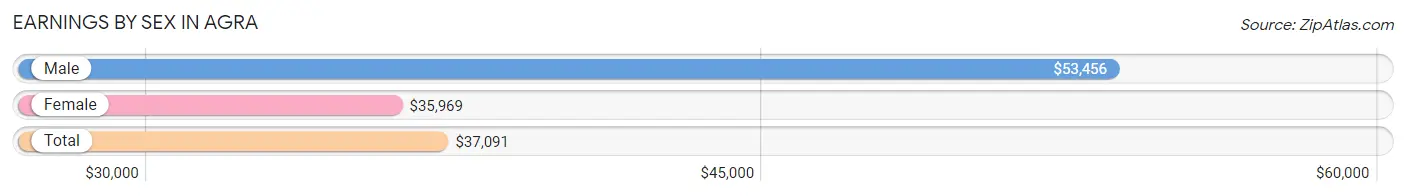
Earnings by Sex in Agra
Average Earnings in Agra are $37,091, $53,456 for men and $35,969 for women, a difference of 32.7%.
| Sex | Number | Average Earnings |
| Male | 103 (50.2%) | $53,456 |
| Female | 102 (49.8%) | $35,969 |
| Total | 205 (100.0%) | $37,091 |
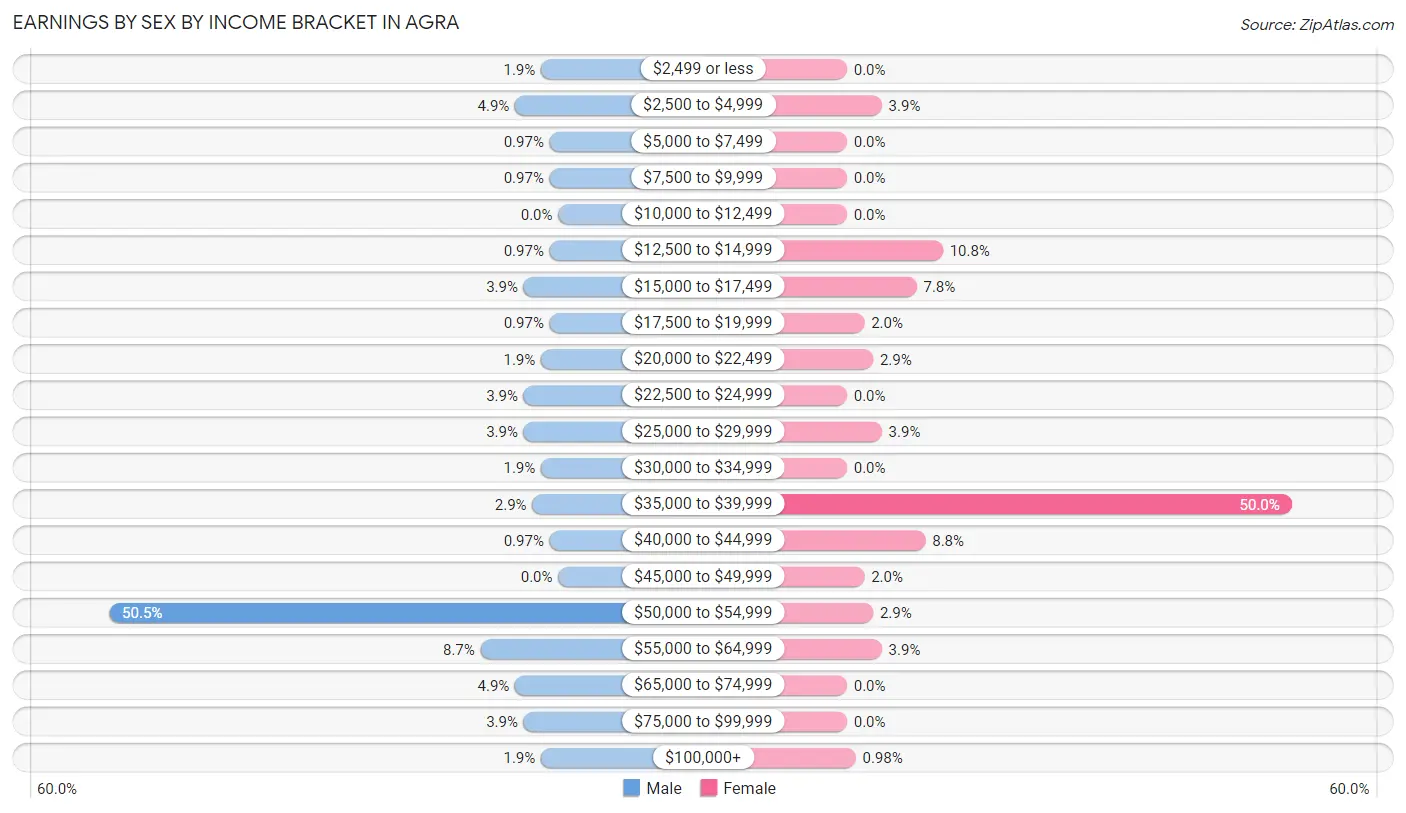
Earnings by Sex by Income Bracket in Agra
The most common earnings brackets in Agra are $50,000 to $54,999 for men (52 | 50.5%) and $35,000 to $39,999 for women (51 | 50.0%).
| Income | Male | Female |
| $2,499 or less | 2 (1.9%) | 0 (0.0%) |
| $2,500 to $4,999 | 5 (4.9%) | 4 (3.9%) |
| $5,000 to $7,499 | 1 (1.0%) | 0 (0.0%) |
| $7,500 to $9,999 | 1 (1.0%) | 0 (0.0%) |
| $10,000 to $12,499 | 0 (0.0%) | 0 (0.0%) |
| $12,500 to $14,999 | 1 (1.0%) | 11 (10.8%) |
| $15,000 to $17,499 | 4 (3.9%) | 8 (7.8%) |
| $17,500 to $19,999 | 1 (1.0%) | 2 (2.0%) |
| $20,000 to $22,499 | 2 (1.9%) | 3 (2.9%) |
| $22,500 to $24,999 | 4 (3.9%) | 0 (0.0%) |
| $25,000 to $29,999 | 4 (3.9%) | 4 (3.9%) |
| $30,000 to $34,999 | 2 (1.9%) | 0 (0.0%) |
| $35,000 to $39,999 | 3 (2.9%) | 51 (50.0%) |
| $40,000 to $44,999 | 1 (1.0%) | 9 (8.8%) |
| $45,000 to $49,999 | 0 (0.0%) | 2 (2.0%) |
| $50,000 to $54,999 | 52 (50.5%) | 3 (2.9%) |
| $55,000 to $64,999 | 9 (8.7%) | 4 (3.9%) |
| $65,000 to $74,999 | 5 (4.9%) | 0 (0.0%) |
| $75,000 to $99,999 | 4 (3.9%) | 0 (0.0%) |
| $100,000+ | 2 (1.9%) | 1 (1.0%) |
| Total | 103 (100.0%) | 102 (100.0%) |
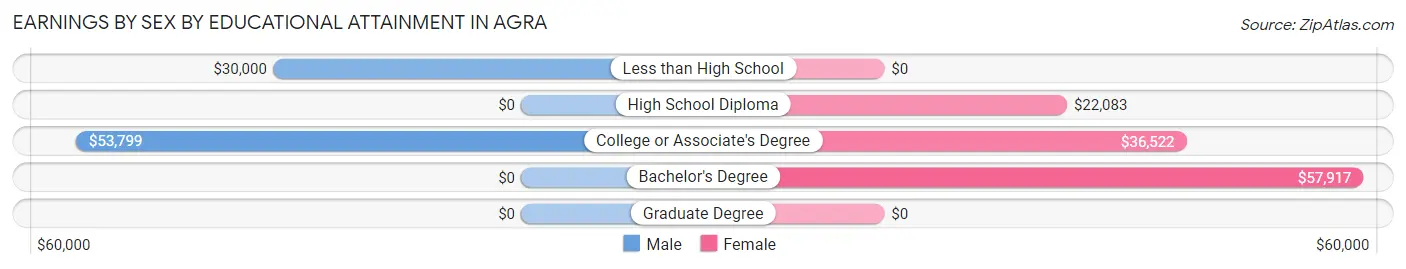
Earnings by Sex by Educational Attainment in Agra
Average earnings in Agra are $53,676 for men and $36,327 for women, a difference of 32.3%. Men with an educational attainment of college or associate's degree enjoy the highest average annual earnings of $53,799, while those with less than high school education earn the least with $30,000. Women with an educational attainment of bachelor's degree earn the most with the average annual earnings of $57,917, while those with high school diploma education have the smallest earnings of $22,083.
| Educational Attainment | Male Income | Female Income |
| Less than High School | $30,000 | $0 |
| High School Diploma | - | - |
| College or Associate's Degree | $53,799 | $36,522 |
| Bachelor's Degree | - | - |
| Graduate Degree | - | - |
| Total | $53,676 | $36,327 |
Family Income in Agra
Family Income Brackets in Agra
According to the Agra family income data, there are 55 families falling into the $100,000 to $149,999 income range, which is the most common income bracket and makes up 46.2% of all families. Conversely, the less than $10,000 income bracket is the least frequent group with only 1 families (0.8%) belonging to this category.
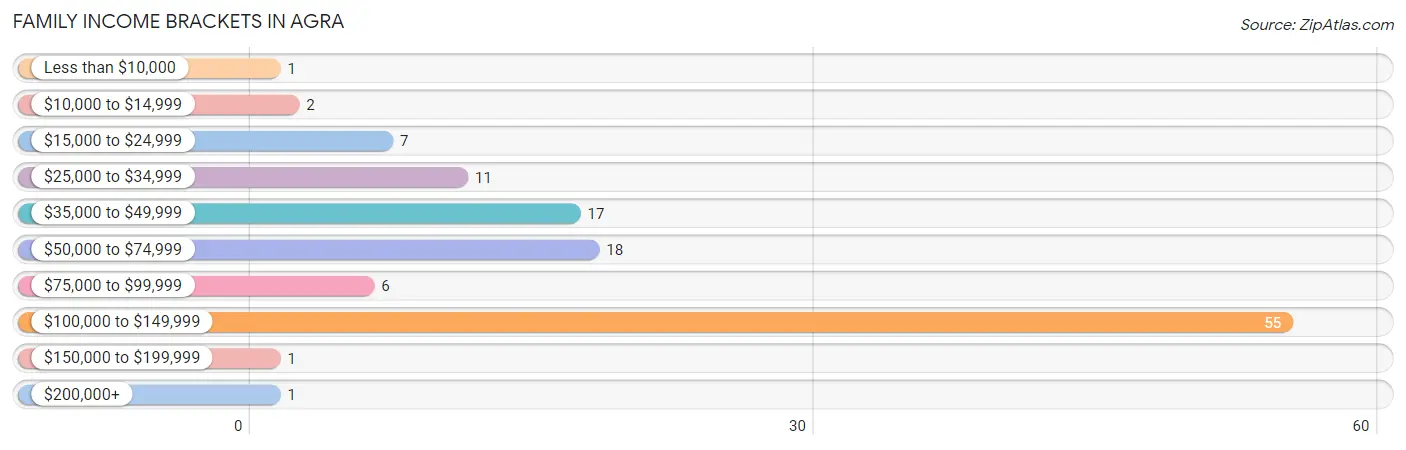
| Income Bracket | # Families | % Families |
| Less than $10,000 | 1 | 0.8% |
| $10,000 to $14,999 | 2 | 1.7% |
| $15,000 to $24,999 | 7 | 5.9% |
| $25,000 to $34,999 | 11 | 9.2% |
| $35,000 to $49,999 | 17 | 14.3% |
| $50,000 to $74,999 | 18 | 15.1% |
| $75,000 to $99,999 | 6 | 5.0% |
| $100,000 to $149,999 | 55 | 46.2% |
| $150,000 to $199,999 | 1 | 0.8% |
| $200,000+ | 1 | 0.8% |
Family Income by Famaliy Size in Agra
5-person families (5 | 4.2%) account for the highest median family income in Agra with $138,125 per family, while 5-person families (5 | 4.2%) have the highest median income of $27,625 per family member.
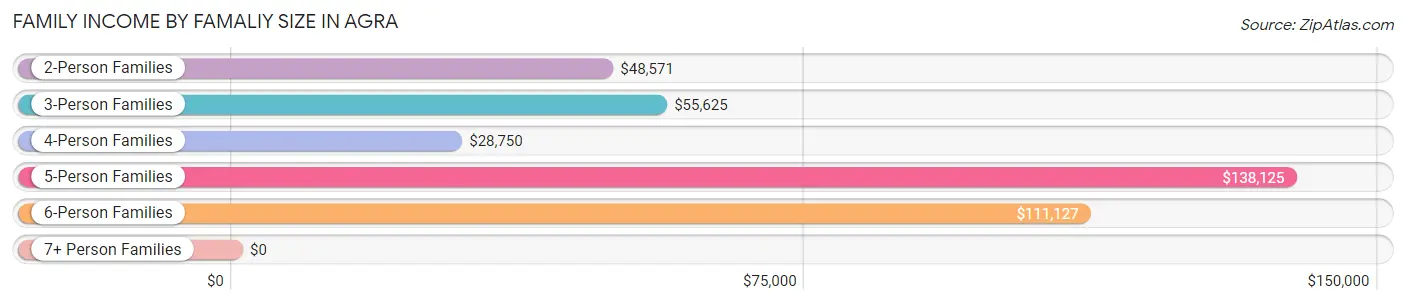
| Income Bracket | # Families | Median Income |
| 2-Person Families | 34 (28.6%) | $48,571 |
| 3-Person Families | 15 (12.6%) | $55,625 |
| 4-Person Families | 9 (7.6%) | $28,750 |
| 5-Person Families | 5 (4.2%) | $138,125 |
| 6-Person Families | 56 (47.1%) | $111,127 |
| 7+ Person Families | 0 (0.0%) | $0 |
| Total | 119 (100.0%) | $98,438 |
Family Income by Number of Earners in Agra
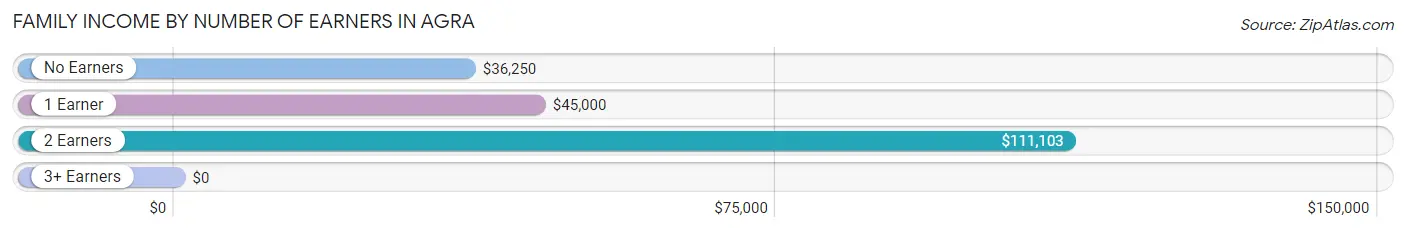
| Number of Earners | # Families | Median Income |
| No Earners | 15 (12.6%) | $36,250 |
| 1 Earner | 38 (31.9%) | $45,000 |
| 2 Earners | 65 (54.6%) | $111,103 |
| 3+ Earners | 1 (0.8%) | $0 |
| Total | 119 (100.0%) | $98,438 |
Household Income in Agra
Household Income Brackets in Agra
With 56 households falling in the category, the $100,000 to $149,999 income range is the most frequent in Agra, accounting for 36.1% of all households. In contrast, only 2 households (1.3%) fall into the $150,000 to $199,999 income bracket, making it the least populous group.
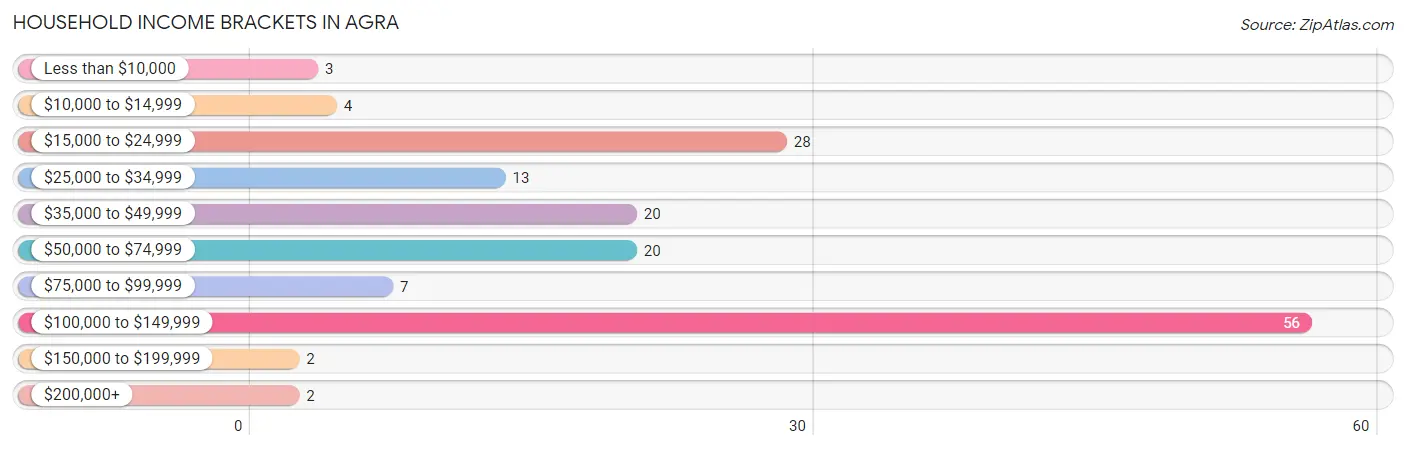
| Income Bracket | # Households | % Households |
| Less than $10,000 | 3 | 1.9% |
| $10,000 to $14,999 | 4 | 2.6% |
| $15,000 to $24,999 | 28 | 18.1% |
| $25,000 to $34,999 | 13 | 8.4% |
| $35,000 to $49,999 | 20 | 12.9% |
| $50,000 to $74,999 | 20 | 12.9% |
| $75,000 to $99,999 | 7 | 4.5% |
| $100,000 to $149,999 | 56 | 36.1% |
| $150,000 to $199,999 | 2 | 1.3% |
| $200,000+ | 2 | 1.3% |
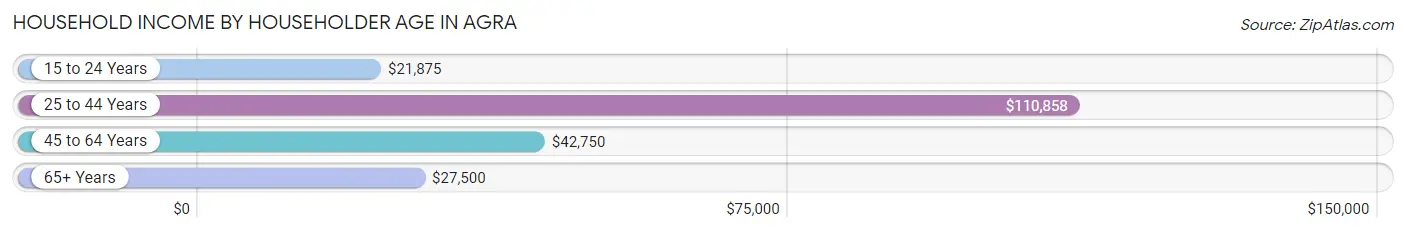
Household Income by Householder Age in Agra
The median household income in Agra is $60,208, with the highest median household income of $110,858 found in the 25 to 44 years age bracket for the primary householder. A total of 73 households (47.1%) fall into this category. Meanwhile, the 15 to 24 years age bracket for the primary householder has the lowest median household income of $21,875, with 5 households (3.2%) in this group.
| Income Bracket | # Households | Median Income |
| 15 to 24 Years | 5 (3.2%) | $21,875 |
| 25 to 44 Years | 73 (47.1%) | $110,858 |
| 45 to 64 Years | 43 (27.7%) | $42,750 |
| 65+ Years | 34 (21.9%) | $27,500 |
| Total | 155 (100.0%) | $60,208 |
Poverty in Agra
Income Below Poverty by Sex and Age in Agra
With 10.8% poverty level for males and 9.3% for females among the residents of Agra, 5 year old males and 5 year old females are the most vulnerable to poverty, with 1 males (100.0%) and 2 females (100.0%) in their respective age groups living below the poverty level.
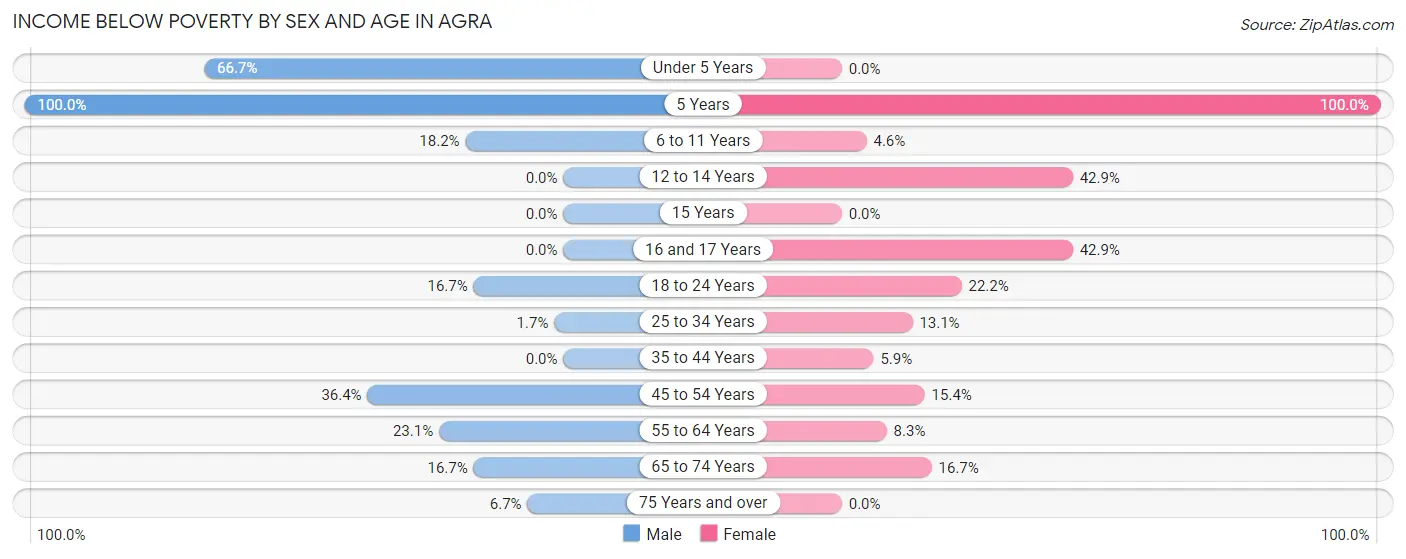
| Age Bracket | Male | Female |
| Under 5 Years | 6 (66.7%) | 0 (0.0%) |
| 5 Years | 1 (100.0%) | 2 (100.0%) |
| 6 to 11 Years | 2 (18.2%) | 5 (4.6%) |
| 12 to 14 Years | 0 (0.0%) | 3 (42.9%) |
| 15 Years | 0 (0.0%) | 0 (0.0%) |
| 16 and 17 Years | 0 (0.0%) | 3 (42.9%) |
| 18 to 24 Years | 3 (16.7%) | 4 (22.2%) |
| 25 to 34 Years | 1 (1.7%) | 8 (13.1%) |
| 35 to 44 Years | 0 (0.0%) | 1 (5.9%) |
| 45 to 54 Years | 4 (36.4%) | 2 (15.4%) |
| 55 to 64 Years | 6 (23.1%) | 2 (8.3%) |
| 65 to 74 Years | 2 (16.7%) | 2 (16.7%) |
| 75 Years and over | 2 (6.7%) | 0 (0.0%) |
| Total | 27 (10.8%) | 32 (9.3%) |
Income Above Poverty by Sex and Age in Agra
According to the poverty statistics in Agra, males aged 12 to 14 years and females aged under 5 years are the age groups that are most secure financially, with 100.0% of males and 100.0% of females in these age groups living above the poverty line.
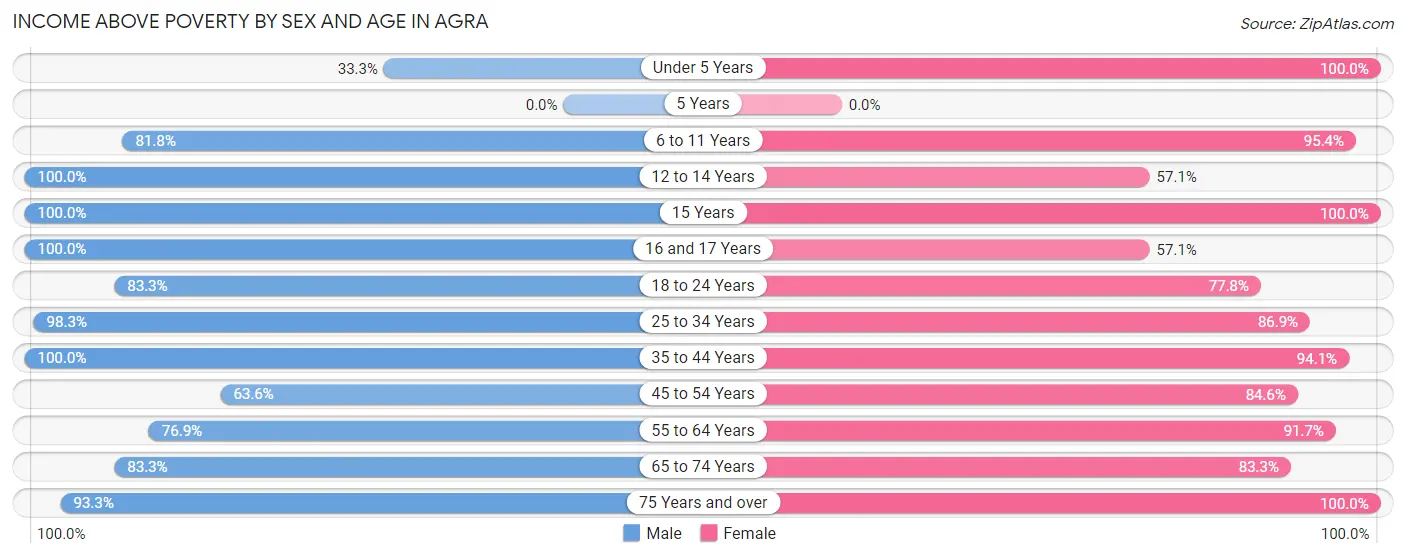
| Age Bracket | Male | Female |
| Under 5 Years | 3 (33.3%) | 47 (100.0%) |
| 5 Years | 0 (0.0%) | 0 (0.0%) |
| 6 to 11 Years | 9 (81.8%) | 104 (95.4%) |
| 12 to 14 Years | 56 (100.0%) | 4 (57.1%) |
| 15 Years | 1 (100.0%) | 8 (100.0%) |
| 16 and 17 Years | 4 (100.0%) | 4 (57.1%) |
| 18 to 24 Years | 15 (83.3%) | 14 (77.8%) |
| 25 to 34 Years | 58 (98.3%) | 53 (86.9%) |
| 35 to 44 Years | 13 (100.0%) | 16 (94.1%) |
| 45 to 54 Years | 7 (63.6%) | 11 (84.6%) |
| 55 to 64 Years | 20 (76.9%) | 22 (91.7%) |
| 65 to 74 Years | 10 (83.3%) | 10 (83.3%) |
| 75 Years and over | 28 (93.3%) | 18 (100.0%) |
| Total | 224 (89.2%) | 311 (90.7%) |
Income Below Poverty Among Married-Couple Families in Agra
The poverty statistics for married-couple families in Agra show that 8.1% or 8 of the total 99 families live below the poverty line. Families with 1 or 2 children have the highest poverty rate of 36.4%, comprising of 4 families. On the other hand, families with no children have the lowest poverty rate of 3.1%, which includes 1 families.
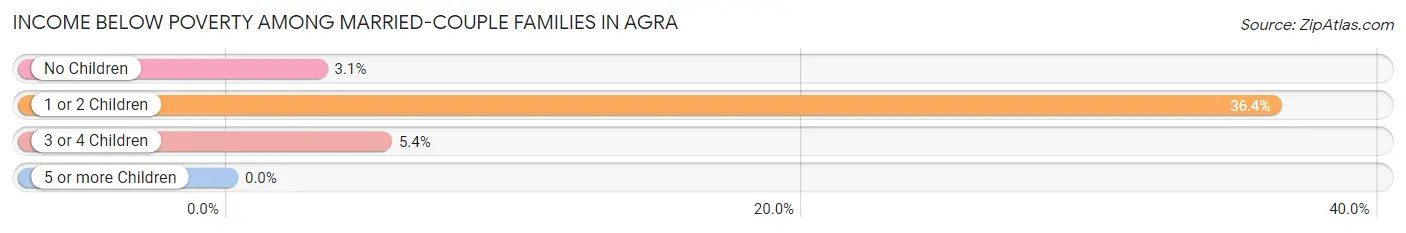
| Children | Above Poverty | Below Poverty |
| No Children | 31 (96.9%) | 1 (3.1%) |
| 1 or 2 Children | 7 (63.6%) | 4 (36.4%) |
| 3 or 4 Children | 53 (94.6%) | 3 (5.4%) |
| 5 or more Children | 0 (0.0%) | 0 (0.0%) |
| Total | 91 (91.9%) | 8 (8.1%) |
Income Below Poverty Among Single-Parent Households in Agra
According to the poverty data in Agra, 40.0% or 2 single-father households and 13.3% or 2 single-mother households are living below the poverty line. Among single-father households, those with 1 or 2 children have the highest poverty rate, with 2 households (50.0%) experiencing poverty. Likewise, among single-mother households, those with 1 or 2 children have the highest poverty rate, with 2 households (28.6%) falling below the poverty line.
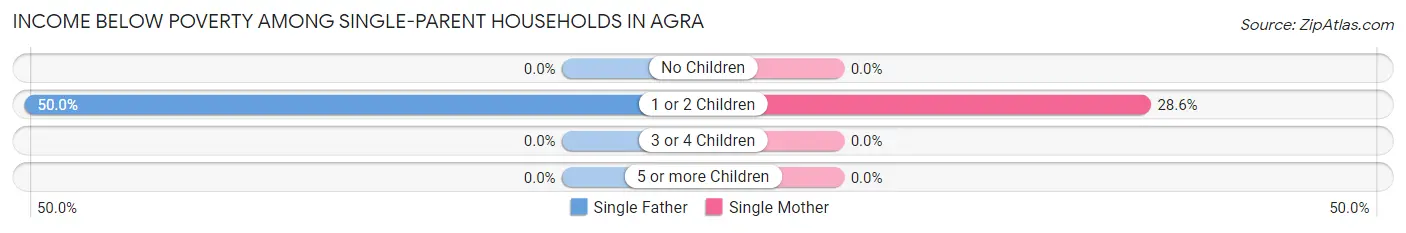
| Children | Single Father | Single Mother |
| No Children | 0 (0.0%) | 0 (0.0%) |
| 1 or 2 Children | 2 (50.0%) | 2 (28.6%) |
| 3 or 4 Children | 0 (0.0%) | 0 (0.0%) |
| 5 or more Children | 0 (0.0%) | 0 (0.0%) |
| Total | 2 (40.0%) | 2 (13.3%) |
Income Below Poverty Among Married-Couple vs Single-Parent Households in Agra
The poverty data for Agra shows that 8 of the married-couple family households (8.1%) and 4 of the single-parent households (20.0%) are living below the poverty level. Within the married-couple family households, those with 1 or 2 children have the highest poverty rate, with 4 households (36.4%) falling below the poverty line. Among the single-parent households, those with 1 or 2 children have the highest poverty rate, with 4 household (36.4%) living below poverty.
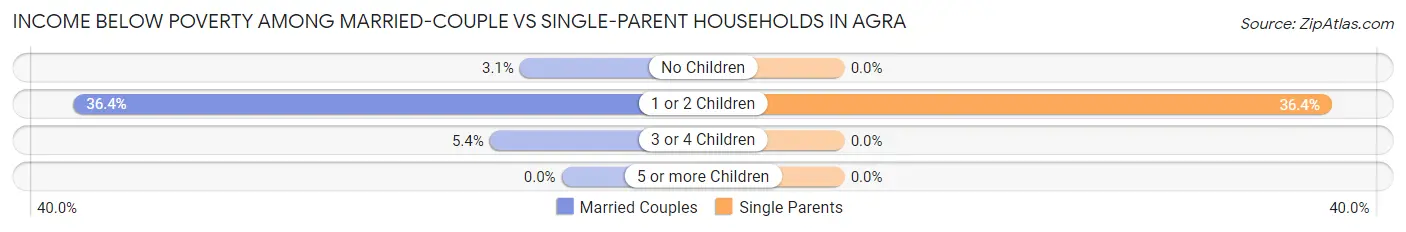
| Children | Married-Couple Families | Single-Parent Households |
| No Children | 1 (3.1%) | 0 (0.0%) |
| 1 or 2 Children | 4 (36.4%) | 4 (36.4%) |
| 3 or 4 Children | 3 (5.4%) | 0 (0.0%) |
| 5 or more Children | 0 (0.0%) | 0 (0.0%) |
| Total | 8 (8.1%) | 4 (20.0%) |
Race in Agra
The most populous races in Agra are White / Caucasian (552 | 92.9%), Hispanic or Latino (54 | 9.1%), and Native / Alaskan (27 | 4.5%).
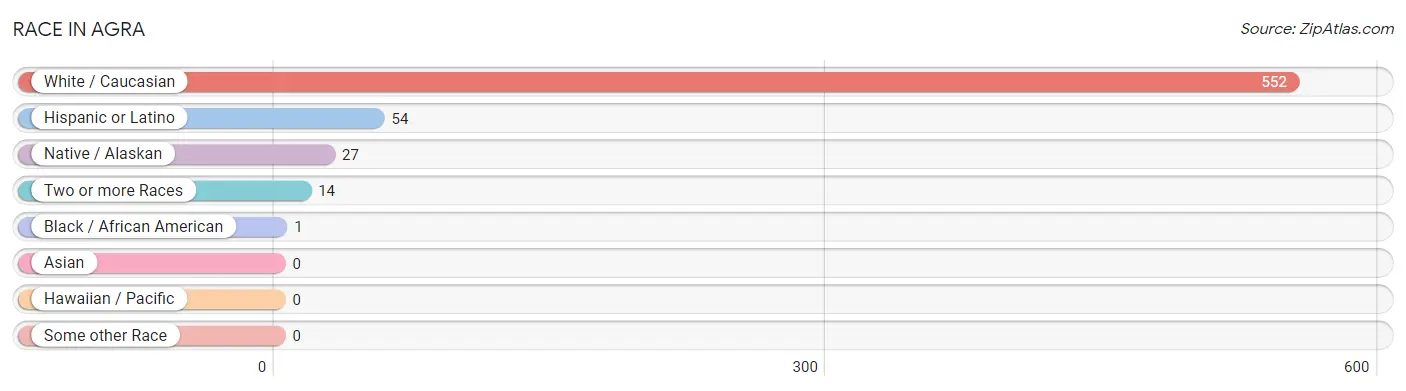
| Race | # Population | % Population |
| Asian | 0 | 0.0% |
| Black / African American | 1 | 0.2% |
| Hawaiian / Pacific | 0 | 0.0% |
| Hispanic or Latino | 54 | 9.1% |
| Native / Alaskan | 27 | 4.5% |
| White / Caucasian | 552 | 92.9% |
| Two or more Races | 14 | 2.4% |
| Some other Race | 0 | 0.0% |
| Total | 594 | 100.0% |
Ancestry in Agra
The most populous ancestries reported in Agra are Irish (57 | 9.6%), Mexican (54 | 9.1%), German (46 | 7.7%), Cherokee (17 | 2.9%), and Italian (17 | 2.9%), together accounting for 32.2% of all Agra residents.
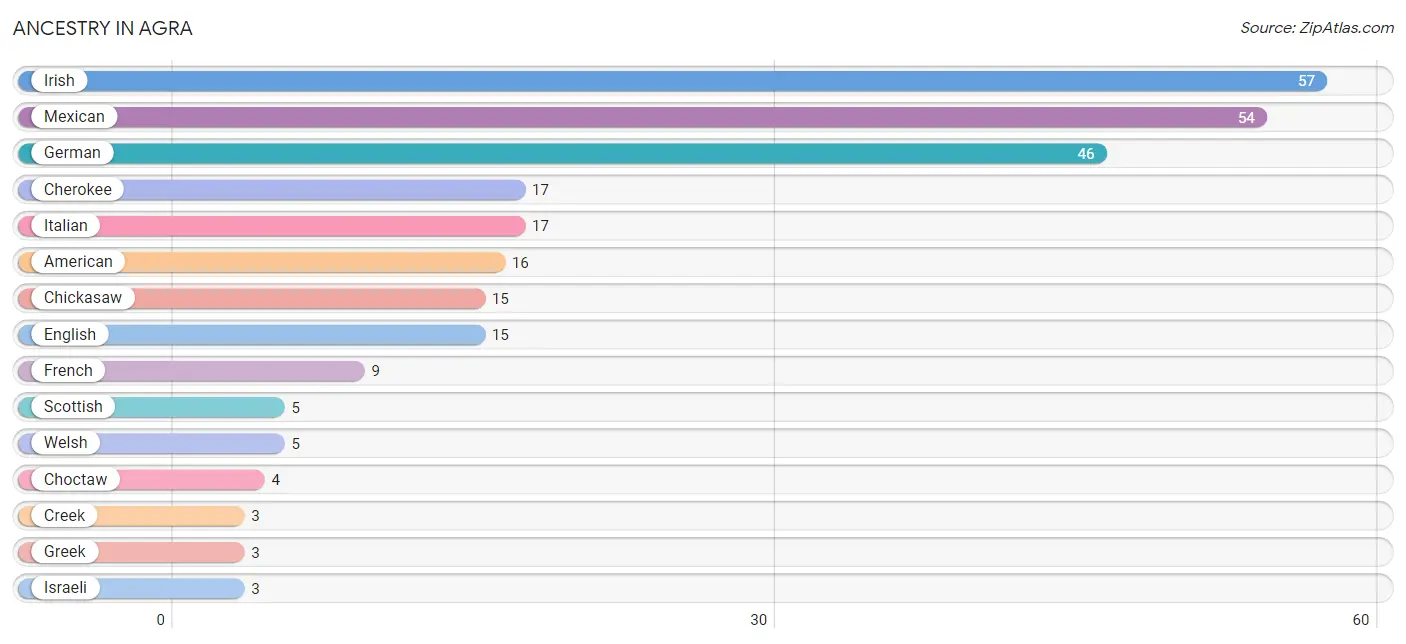
| Ancestry | # Population | % Population |
| American | 16 | 2.7% |
| Cherokee | 17 | 2.9% |
| Chickasaw | 15 | 2.5% |
| Choctaw | 4 | 0.7% |
| Creek | 3 | 0.5% |
| English | 15 | 2.5% |
| French | 9 | 1.5% |
| French Canadian | 2 | 0.3% |
| German | 46 | 7.7% |
| Greek | 3 | 0.5% |
| Irish | 57 | 9.6% |
| Israeli | 3 | 0.5% |
| Italian | 17 | 2.9% |
| Mexican | 54 | 9.1% |
| Polish | 1 | 0.2% |
| Russian | 1 | 0.2% |
| Scottish | 5 | 0.8% |
| Swiss | 2 | 0.3% |
| Welsh | 5 | 0.8% | View All 19 Rows |
Immigrants in Agra

| Immigration Origin | # Population | % Population | View All 0 Rows |
Sex and Age in Agra
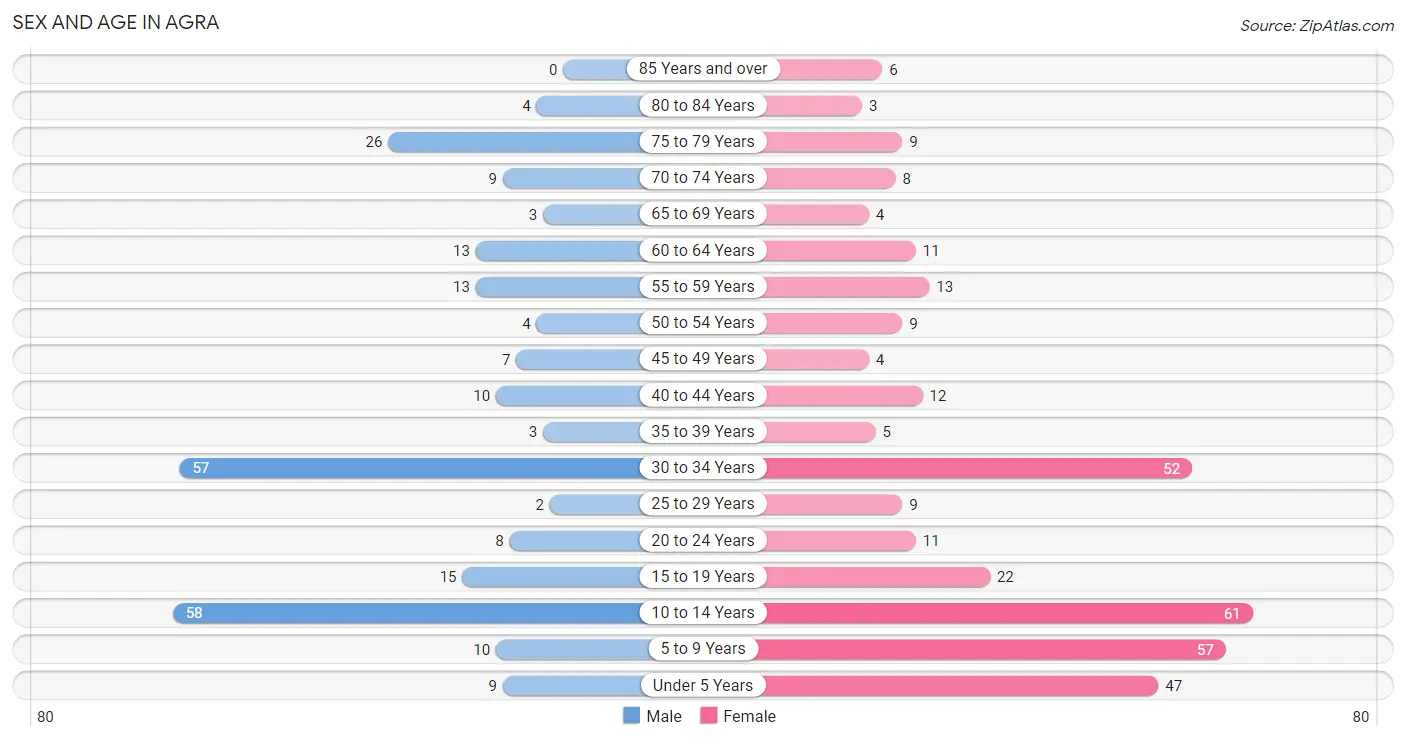
Sex and Age in Agra
The most populous age groups in Agra are 10 to 14 Years (58 | 23.1%) for men and 10 to 14 Years (61 | 17.8%) for women.
| Age Bracket | Male | Female |
| Under 5 Years | 9 (3.6%) | 47 (13.7%) |
| 5 to 9 Years | 10 (4.0%) | 57 (16.6%) |
| 10 to 14 Years | 58 (23.1%) | 61 (17.8%) |
| 15 to 19 Years | 15 (6.0%) | 22 (6.4%) |
| 20 to 24 Years | 8 (3.2%) | 11 (3.2%) |
| 25 to 29 Years | 2 (0.8%) | 9 (2.6%) |
| 30 to 34 Years | 57 (22.7%) | 52 (15.2%) |
| 35 to 39 Years | 3 (1.2%) | 5 (1.5%) |
| 40 to 44 Years | 10 (4.0%) | 12 (3.5%) |
| 45 to 49 Years | 7 (2.8%) | 4 (1.2%) |
| 50 to 54 Years | 4 (1.6%) | 9 (2.6%) |
| 55 to 59 Years | 13 (5.2%) | 13 (3.8%) |
| 60 to 64 Years | 13 (5.2%) | 11 (3.2%) |
| 65 to 69 Years | 3 (1.2%) | 4 (1.2%) |
| 70 to 74 Years | 9 (3.6%) | 8 (2.3%) |
| 75 to 79 Years | 26 (10.4%) | 9 (2.6%) |
| 80 to 84 Years | 4 (1.6%) | 3 (0.9%) |
| 85 Years and over | 0 (0.0%) | 6 (1.8%) |
| Total | 251 (100.0%) | 343 (100.0%) |
Families and Households in Agra
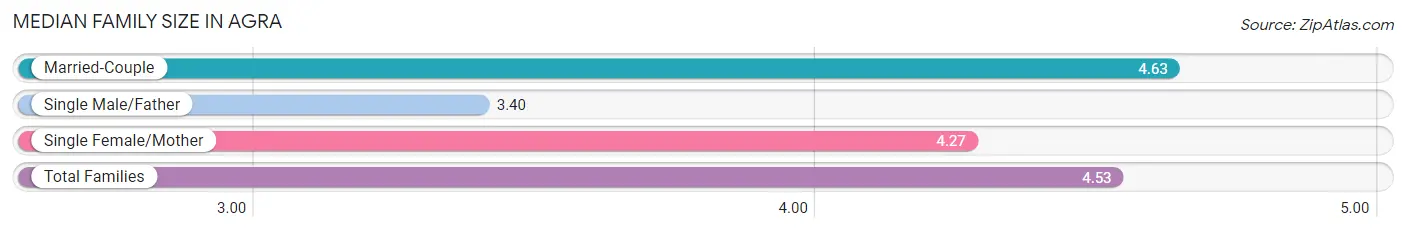
Median Family Size in Agra
The median family size in Agra is 4.53 persons per family, with married-couple families (99 | 83.2%) accounting for the largest median family size of 4.63 persons per family. On the other hand, single male/father families (5 | 4.2%) represent the smallest median family size with 3.40 persons per family.
| Family Type | # Families | Family Size |
| Married-Couple | 99 (83.2%) | 4.63 |
| Single Male/Father | 5 (4.2%) | 3.40 |
| Single Female/Mother | 15 (12.6%) | 4.27 |
| Total Families | 119 (100.0%) | 4.53 |
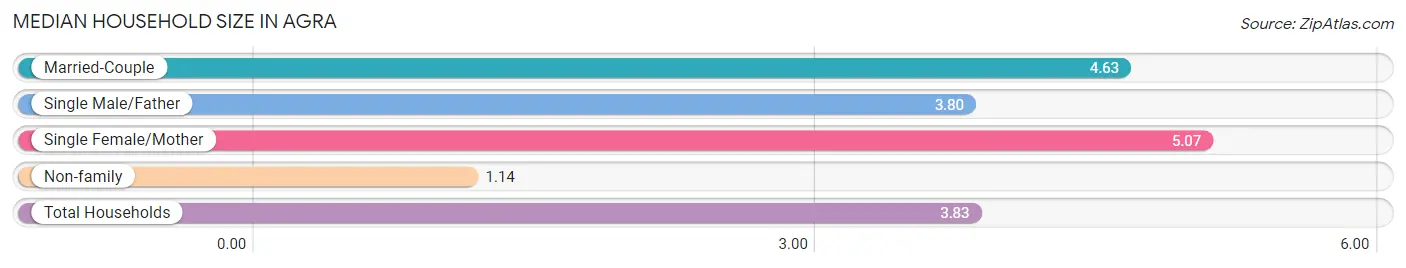
Median Household Size in Agra
The median household size in Agra is 3.83 persons per household, with single female/mother households (15 | 9.7%) accounting for the largest median household size of 5.07 persons per household. non-family households (36 | 23.2%) represent the smallest median household size with 1.14 persons per household.
| Household Type | # Households | Household Size |
| Married-Couple | 99 (63.9%) | 4.63 |
| Single Male/Father | 5 (3.2%) | 3.80 |
| Single Female/Mother | 15 (9.7%) | 5.07 |
| Non-family | 36 (23.2%) | 1.14 |
| Total Households | 155 (100.0%) | 3.83 |
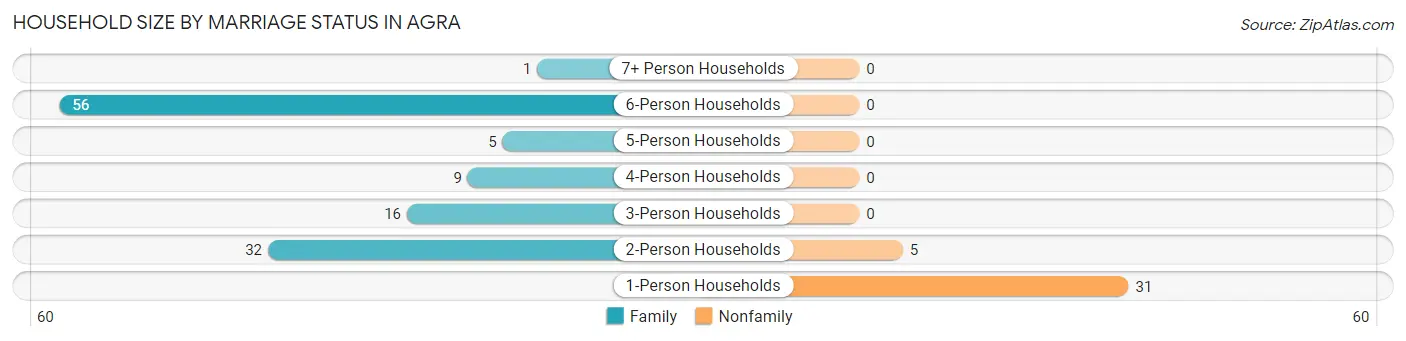
Household Size by Marriage Status in Agra
Out of a total of 155 households in Agra, 119 (76.8%) are family households, while 36 (23.2%) are nonfamily households. The most numerous type of family households are 6-person households, comprising 56, and the most common type of nonfamily households are 1-person households, comprising 31.
| Household Size | Family Households | Nonfamily Households |
| 1-Person Households | - | 31 (20.0%) |
| 2-Person Households | 32 (20.6%) | 5 (3.2%) |
| 3-Person Households | 16 (10.3%) | 0 (0.0%) |
| 4-Person Households | 9 (5.8%) | 0 (0.0%) |
| 5-Person Households | 5 (3.2%) | 0 (0.0%) |
| 6-Person Households | 56 (36.1%) | 0 (0.0%) |
| 7+ Person Households | 1 (0.6%) | 0 (0.0%) |
| Total | 119 (76.8%) | 36 (23.2%) |
Female Fertility in Agra
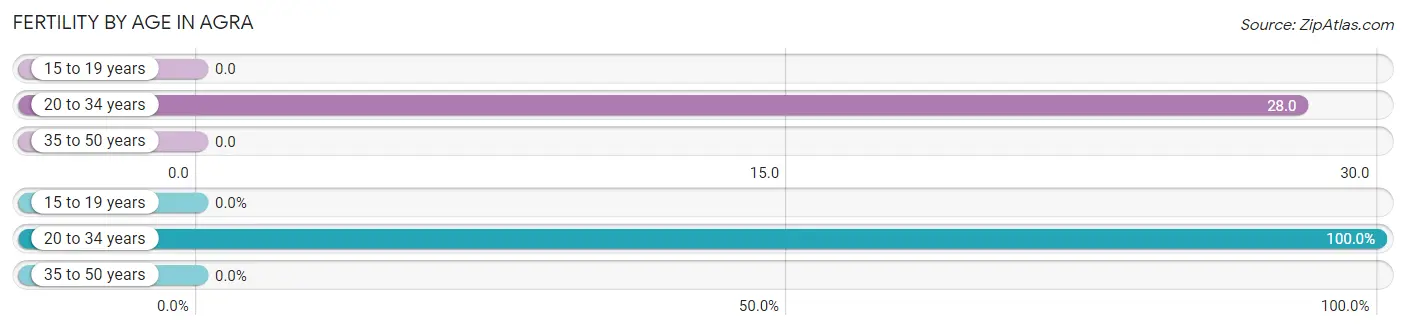
Fertility by Age in Agra
Average fertility rate in Agra is 17.0 births per 1,000 women. Women in the age bracket of 20 to 34 years have the highest fertility rate with 28.0 births per 1,000 women. Women in the age bracket of 20 to 34 years acount for 100.0% of all women with births.
| Age Bracket | Women with Births | Births / 1,000 Women |
| 15 to 19 years | 0 (0.0%) | 0.0 |
| 20 to 34 years | 2 (100.0%) | 28.0 |
| 35 to 50 years | 0 (0.0%) | 0.0 |
| Total | 2 (100.0%) | 17.0 |
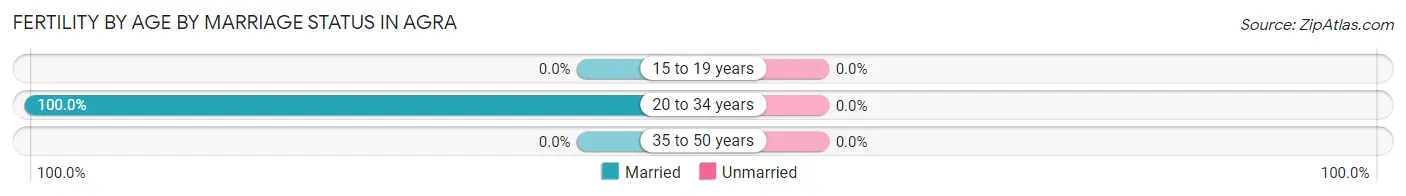
Fertility by Age by Marriage Status in Agra
| Age Bracket | Married | Unmarried |
| 15 to 19 years | 0 (0.0%) | 0 (0.0%) |
| 20 to 34 years | 2 (100.0%) | 0 (0.0%) |
| 35 to 50 years | 0 (0.0%) | 0 (0.0%) |
| Total | 2 (100.0%) | 0 (0.0%) |
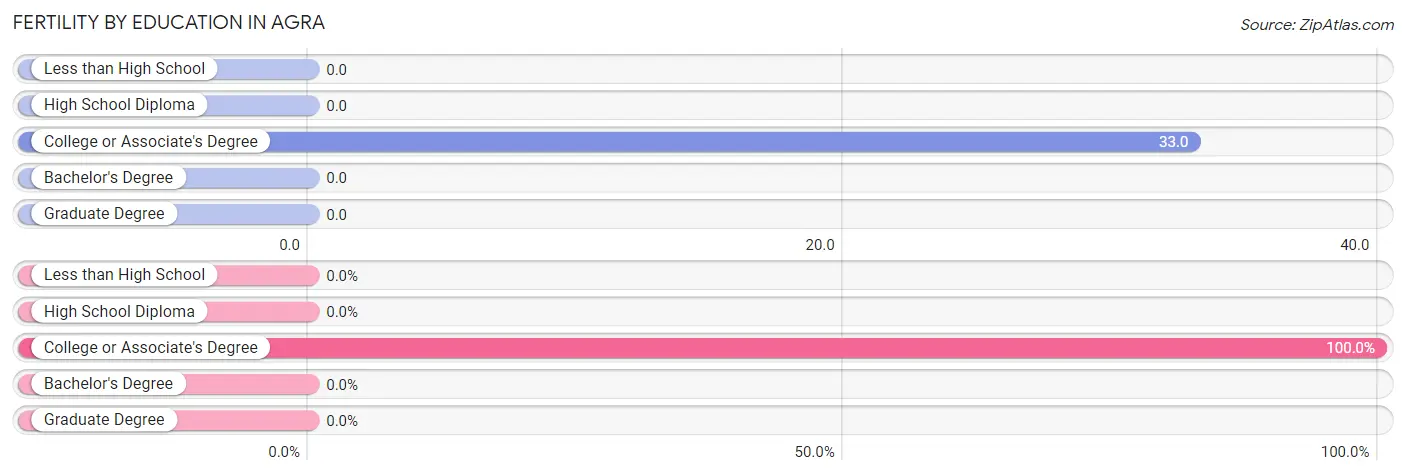
Fertility by Education in Agra
| Educational Attainment | Women with Births | Births / 1,000 Women |
| Less than High School | 0 (0.0%) | 0.0 |
| High School Diploma | 0 (0.0%) | 0.0 |
| College or Associate's Degree | 2 (100.0%) | 33.0 |
| Bachelor's Degree | 0 (0.0%) | 0.0 |
| Graduate Degree | 0 (0.0%) | 0.0 |
| Total | 2 (100.0%) | 17.0 |
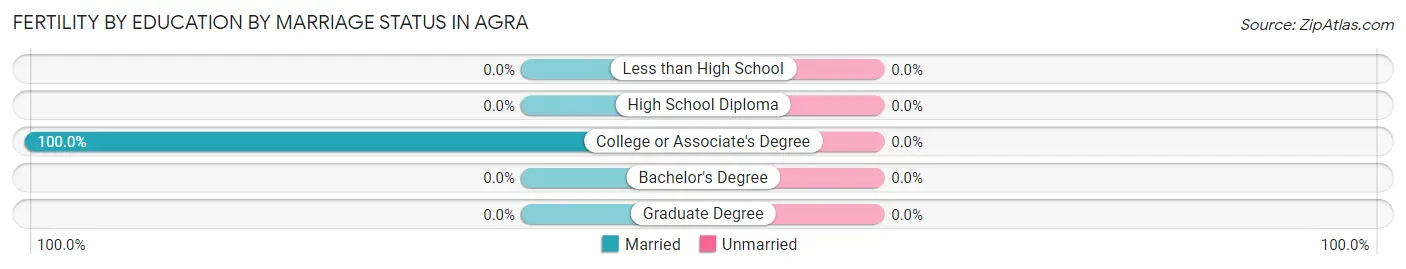
Fertility by Education by Marriage Status in Agra
| Educational Attainment | Married | Unmarried |
| Less than High School | 0 (0.0%) | 0 (0.0%) |
| High School Diploma | 0 (0.0%) | 0 (0.0%) |
| College or Associate's Degree | 2 (100.0%) | 0 (0.0%) |
| Bachelor's Degree | 0 (0.0%) | 0 (0.0%) |
| Graduate Degree | 0 (0.0%) | 0 (0.0%) |
| Total | 2 (100.0%) | 0 (0.0%) |
Employment Characteristics in Agra
Employment by Class of Employer in Agra
Among the 196 employed individuals in Agra, private company employees (119 | 60.7%), not-for-profit organizations (49 | 25.0%), and self-employed (not incorporated) (10 | 5.1%) make up the most common classes of employment.
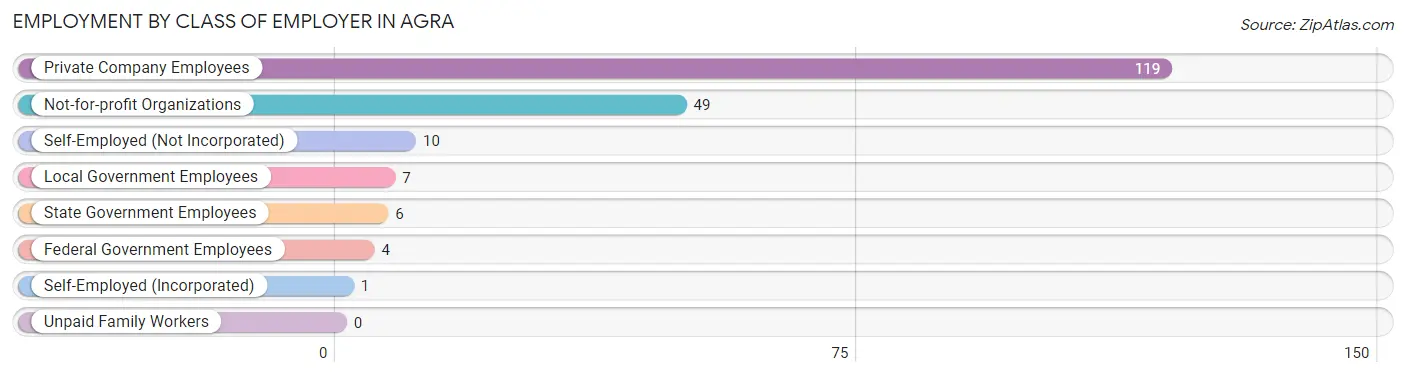
| Employer Class | # Employees | % Employees |
| Private Company Employees | 119 | 60.7% |
| Self-Employed (Incorporated) | 1 | 0.5% |
| Self-Employed (Not Incorporated) | 10 | 5.1% |
| Not-for-profit Organizations | 49 | 25.0% |
| Local Government Employees | 7 | 3.6% |
| State Government Employees | 6 | 3.1% |
| Federal Government Employees | 4 | 2.0% |
| Unpaid Family Workers | 0 | 0.0% |
| Total | 196 | 100.0% |
Employment Status by Age in Agra
According to the labor force statistics for Agra, out of the total population over 16 years of age (343), 58.3% or 200 individuals are in the labor force, with 1.5% or 3 of them unemployed. The age group with the highest labor force participation rate is 20 to 24 years, with 100.0% or 19 individuals in the labor force. Within the labor force, the 35 to 44 years age range has the highest percentage of unemployed individuals, with 7.7% or 2 of them being unemployed.
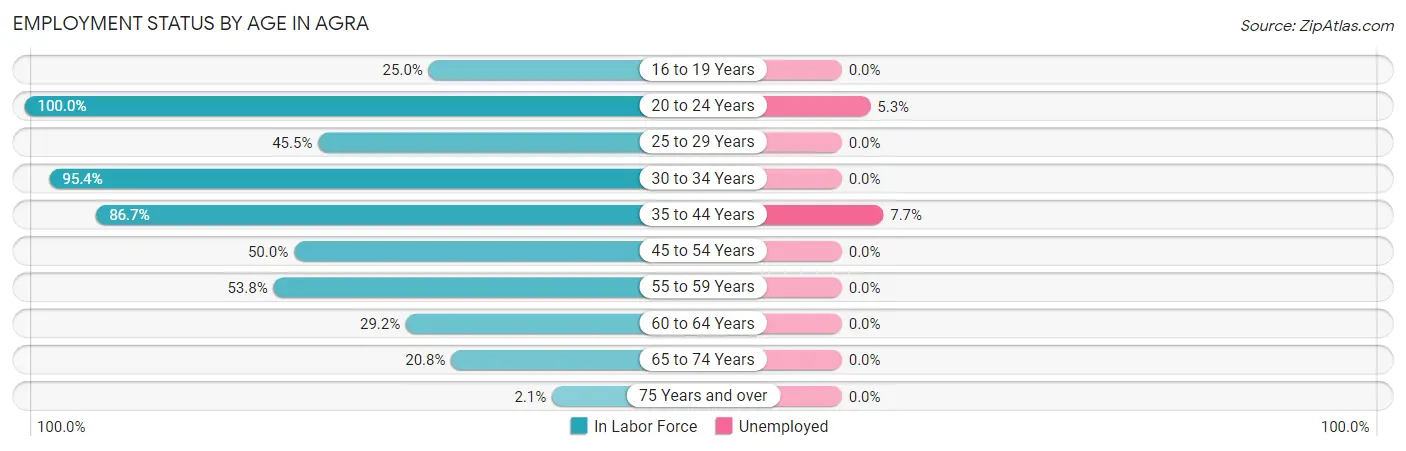
| Age Bracket | In Labor Force | Unemployed |
| 16 to 19 Years | 7 (25.0%) | 0 (0.0%) |
| 20 to 24 Years | 19 (100.0%) | 1 (5.3%) |
| 25 to 29 Years | 5 (45.5%) | 0 (0.0%) |
| 30 to 34 Years | 104 (95.4%) | 0 (0.0%) |
| 35 to 44 Years | 26 (86.7%) | 2 (7.7%) |
| 45 to 54 Years | 12 (50.0%) | 0 (0.0%) |
| 55 to 59 Years | 14 (53.8%) | 0 (0.0%) |
| 60 to 64 Years | 7 (29.2%) | 0 (0.0%) |
| 65 to 74 Years | 5 (20.8%) | 0 (0.0%) |
| 75 Years and over | 1 (2.1%) | 0 (0.0%) |
| Total | 200 (58.3%) | 3 (1.5%) |
Employment Status by Educational Attainment in Agra
According to labor force statistics for Agra, 75.0% of individuals (168) out of the total population between 25 and 64 years of age (224) are in the labor force, with 1.2% or 2 of them being unemployed. The group with the highest labor force participation rate are those with the educational attainment of bachelor's degree or higher, with 91.7% or 11 individuals in the labor force. Within the labor force, individuals with bachelor's degree or higher education have the highest percentage of unemployment, with 9.1% or 1 of them being unemployed.
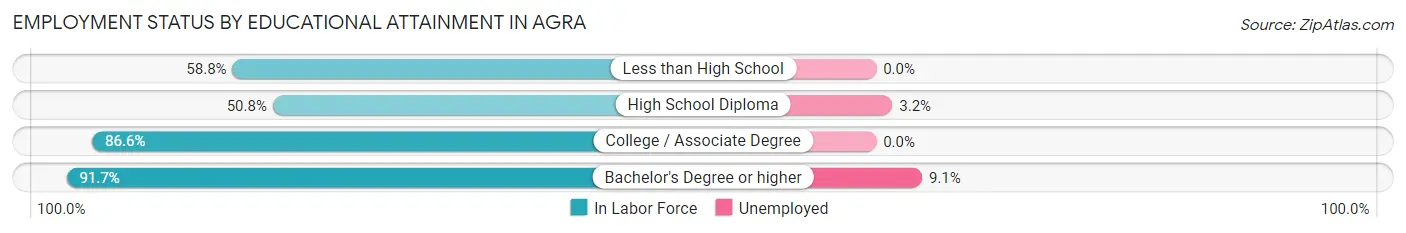
| Educational Attainment | In Labor Force | Unemployed |
| Less than High School | 10 (58.8%) | 0 (0.0%) |
| High School Diploma | 31 (50.8%) | 2 (3.2%) |
| College / Associate Degree | 116 (86.6%) | 0 (0.0%) |
| Bachelor's Degree or higher | 11 (91.7%) | 1 (9.1%) |
| Total | 168 (75.0%) | 3 (1.2%) |
Employment Occupations by Sex in Agra
Management, Business, Science and Arts Occupations
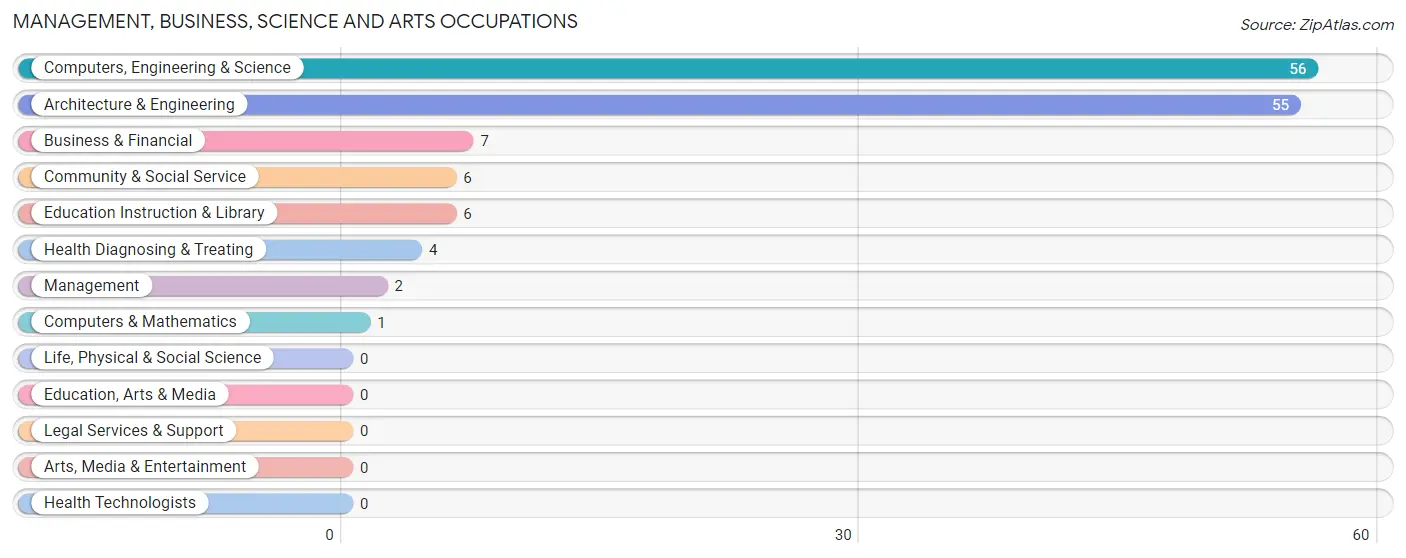
The most common Management, Business, Science and Arts occupations in Agra are Computers, Engineering & Science (56 | 28.4%), Architecture & Engineering (55 | 27.9%), Business & Financial (7 | 3.5%), Community & Social Service (6 | 3.0%), and Education Instruction & Library (6 | 3.0%).
Management, Business, Science and Arts Occupations by Sex
Within the Management, Business, Science and Arts occupations in Agra, the most male-oriented occupations are Computers, Engineering & Science (100.0%), Computers & Mathematics (100.0%), and Architecture & Engineering (100.0%), while the most female-oriented occupations are Management (100.0%), Business & Financial (100.0%), and Community & Social Service (50.0%).
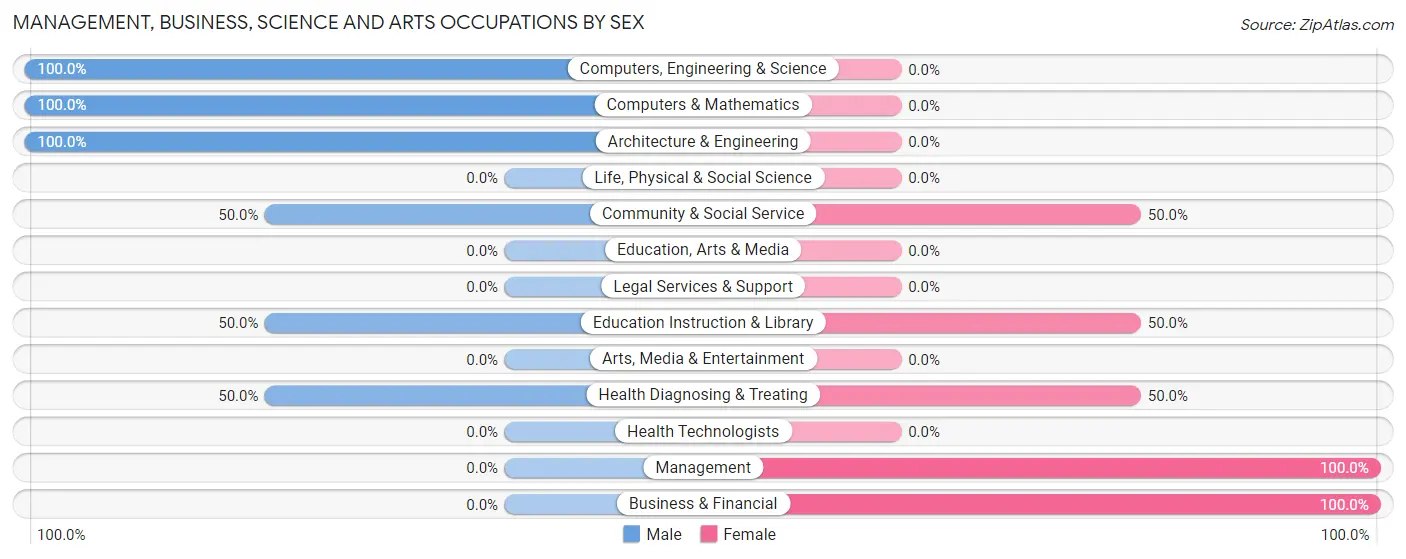
| Occupation | Male | Female |
| Management | 0 (0.0%) | 2 (100.0%) |
| Business & Financial | 0 (0.0%) | 7 (100.0%) |
| Computers, Engineering & Science | 56 (100.0%) | 0 (0.0%) |
| Computers & Mathematics | 1 (100.0%) | 0 (0.0%) |
| Architecture & Engineering | 55 (100.0%) | 0 (0.0%) |
| Life, Physical & Social Science | 0 (0.0%) | 0 (0.0%) |
| Community & Social Service | 3 (50.0%) | 3 (50.0%) |
| Education, Arts & Media | 0 (0.0%) | 0 (0.0%) |
| Legal Services & Support | 0 (0.0%) | 0 (0.0%) |
| Education Instruction & Library | 3 (50.0%) | 3 (50.0%) |
| Arts, Media & Entertainment | 0 (0.0%) | 0 (0.0%) |
| Health Diagnosing & Treating | 2 (50.0%) | 2 (50.0%) |
| Health Technologists | 0 (0.0%) | 0 (0.0%) |
| Total (Category) | 61 (81.3%) | 14 (18.7%) |
| Total (Overall) | 100 (50.8%) | 97 (49.2%) |
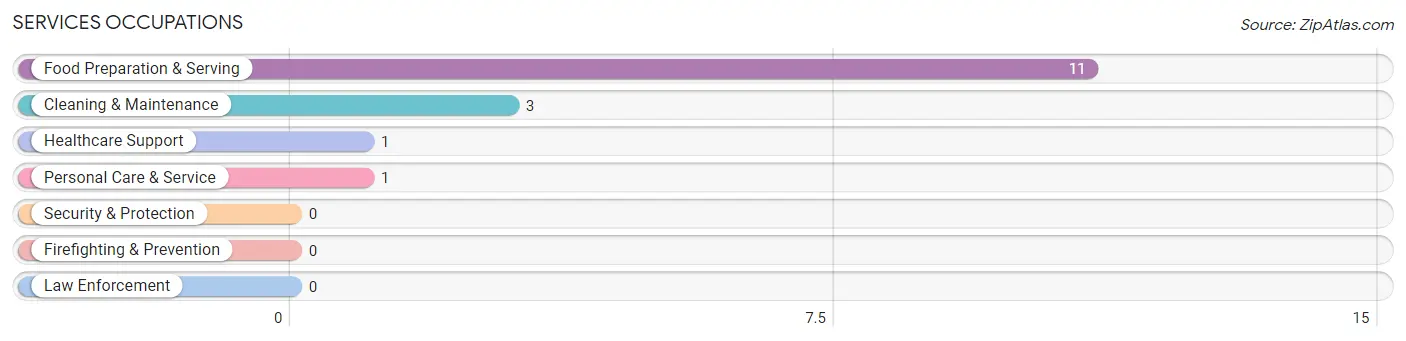
Services Occupations
The most common Services occupations in Agra are Food Preparation & Serving (11 | 5.6%), Cleaning & Maintenance (3 | 1.5%), Healthcare Support (1 | 0.5%), and Personal Care & Service (1 | 0.5%).
Services Occupations by Sex
Within the Services occupations in Agra, the most male-oriented occupations are Cleaning & Maintenance (100.0%), Personal Care & Service (100.0%), and Food Preparation & Serving (9.1%), while the most female-oriented occupations are Healthcare Support (100.0%), and Food Preparation & Serving (90.9%).
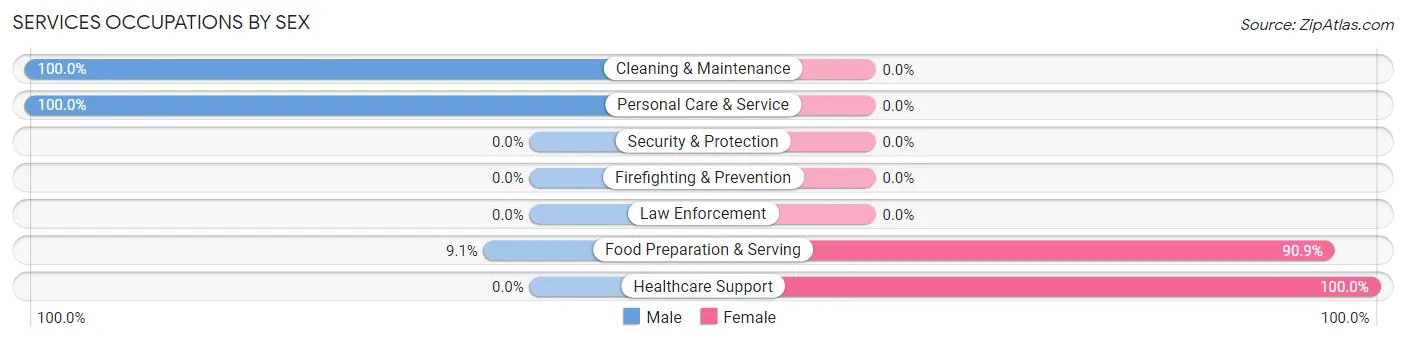
| Occupation | Male | Female |
| Healthcare Support | 0 (0.0%) | 1 (100.0%) |
| Security & Protection | 0 (0.0%) | 0 (0.0%) |
| Firefighting & Prevention | 0 (0.0%) | 0 (0.0%) |
| Law Enforcement | 0 (0.0%) | 0 (0.0%) |
| Food Preparation & Serving | 1 (9.1%) | 10 (90.9%) |
| Cleaning & Maintenance | 3 (100.0%) | 0 (0.0%) |
| Personal Care & Service | 1 (100.0%) | 0 (0.0%) |
| Total (Category) | 5 (31.2%) | 11 (68.8%) |
| Total (Overall) | 100 (50.8%) | 97 (49.2%) |
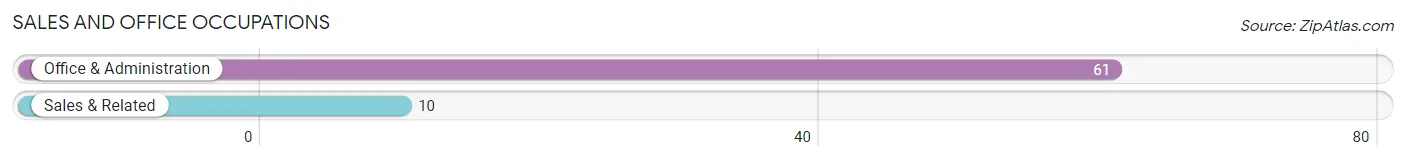
Sales and Office Occupations
The most common Sales and Office occupations in Agra are Office & Administration (61 | 31.0%), and Sales & Related (10 | 5.1%).
Sales and Office Occupations by Sex

| Occupation | Male | Female |
| Sales & Related | 0 (0.0%) | 10 (100.0%) |
| Office & Administration | 2 (3.3%) | 59 (96.7%) |
| Total (Category) | 2 (2.8%) | 69 (97.2%) |
| Total (Overall) | 100 (50.8%) | 97 (49.2%) |
Natural Resources, Construction and Maintenance Occupations
The most common Natural Resources, Construction and Maintenance occupations in Agra are Installation, Maintenance & Repair (11 | 5.6%), and Construction & Extraction (8 | 4.1%).
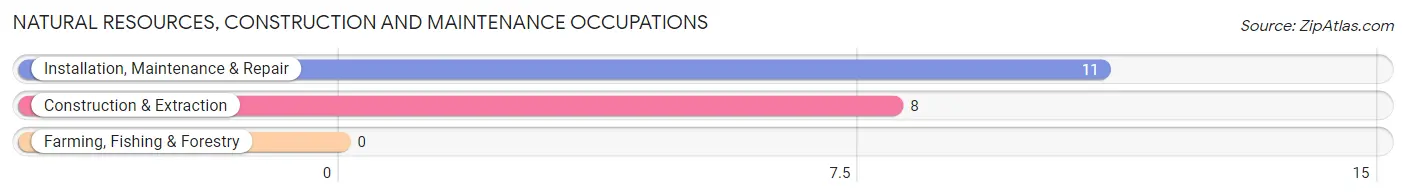
Natural Resources, Construction and Maintenance Occupations by Sex
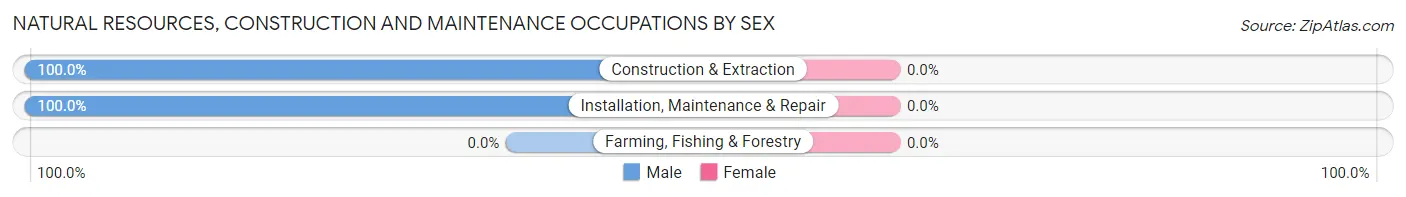
| Occupation | Male | Female |
| Farming, Fishing & Forestry | 0 (0.0%) | 0 (0.0%) |
| Construction & Extraction | 8 (100.0%) | 0 (0.0%) |
| Installation, Maintenance & Repair | 11 (100.0%) | 0 (0.0%) |
| Total (Category) | 19 (100.0%) | 0 (0.0%) |
| Total (Overall) | 100 (50.8%) | 97 (49.2%) |
Production, Transportation and Moving Occupations
The most common Production, Transportation and Moving occupations in Agra are Material Moving (7 | 3.5%), Production (6 | 3.0%), and Transportation (3 | 1.5%).
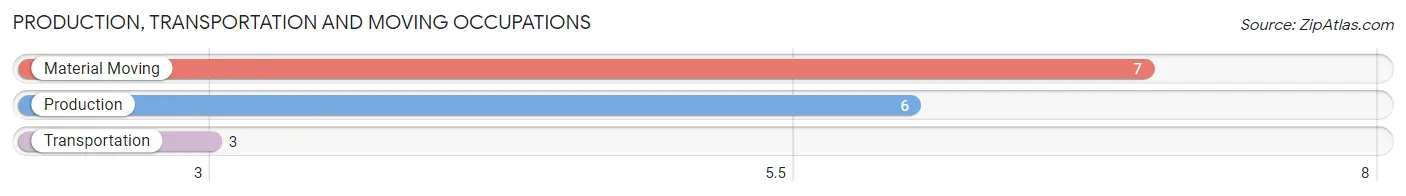
Production, Transportation and Moving Occupations by Sex
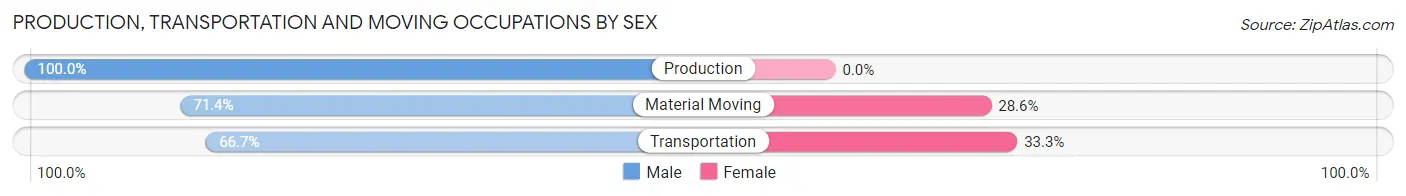
| Occupation | Male | Female |
| Production | 6 (100.0%) | 0 (0.0%) |
| Transportation | 2 (66.7%) | 1 (33.3%) |
| Material Moving | 5 (71.4%) | 2 (28.6%) |
| Total (Category) | 13 (81.2%) | 3 (18.8%) |
| Total (Overall) | 100 (50.8%) | 97 (49.2%) |
Employment Industries by Sex in Agra
Employment Industries in Agra
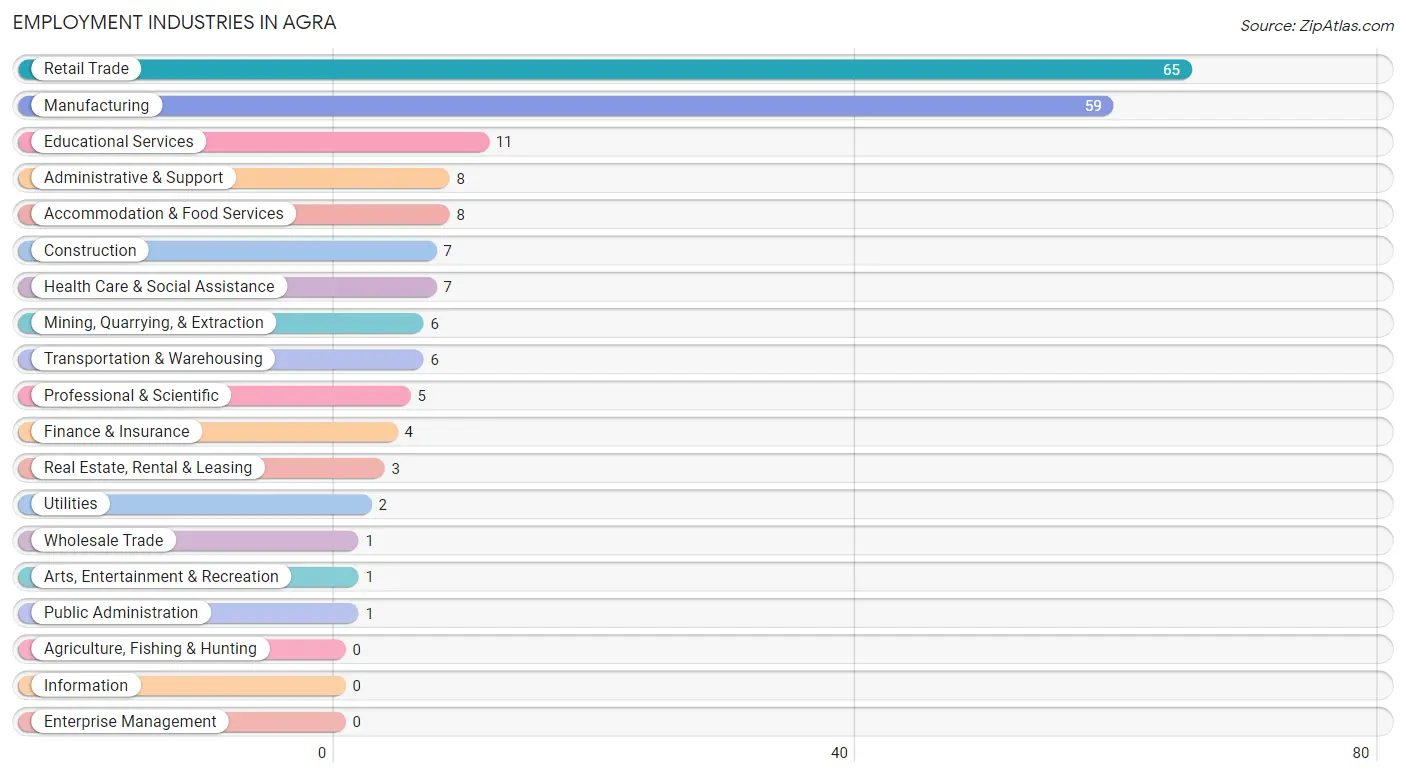
The major employment industries in Agra include Retail Trade (65 | 33.0%), Manufacturing (59 | 29.9%), Educational Services (11 | 5.6%), Administrative & Support (8 | 4.1%), and Accommodation & Food Services (8 | 4.1%).
Employment Industries by Sex in Agra
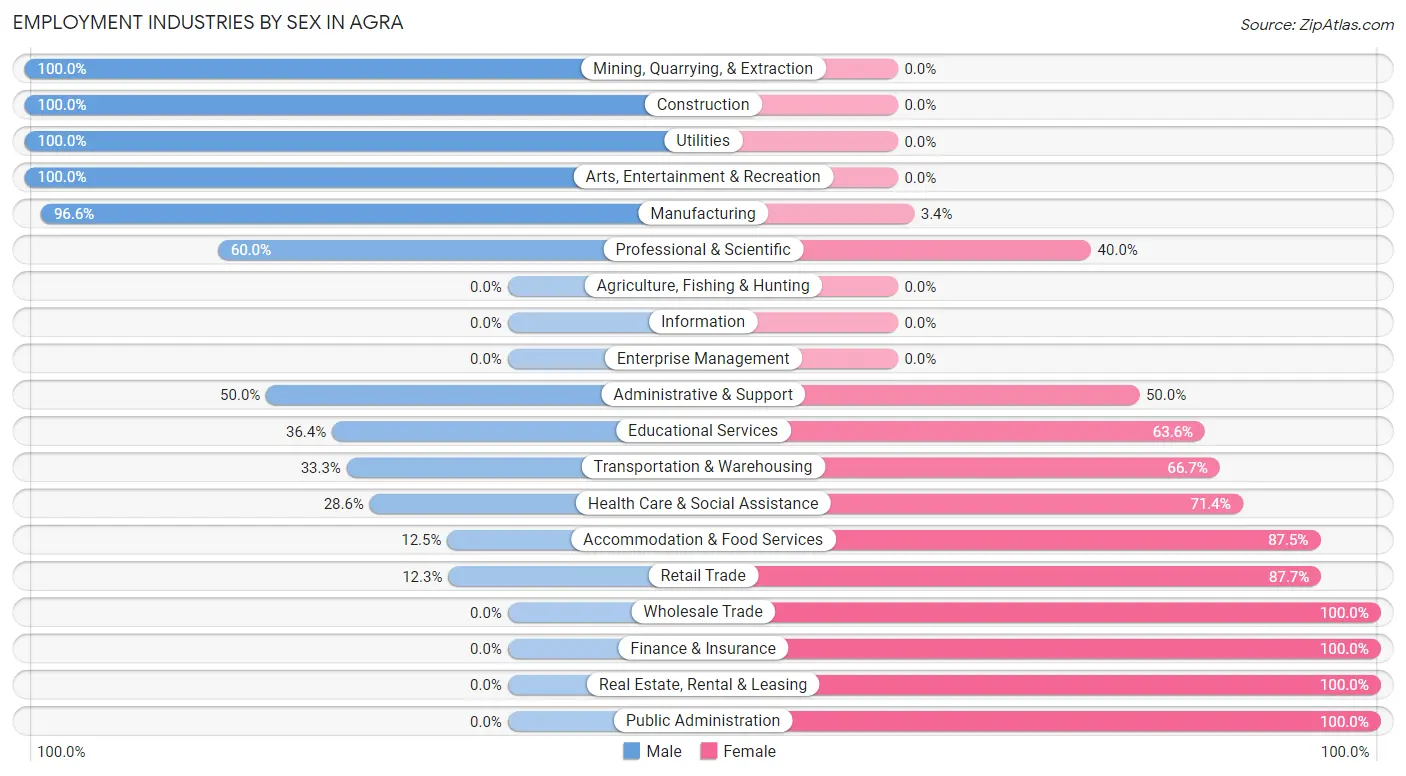
The Agra industries that see more men than women are Mining, Quarrying, & Extraction (100.0%), Construction (100.0%), and Utilities (100.0%), whereas the industries that tend to have a higher number of women are Wholesale Trade (100.0%), Finance & Insurance (100.0%), and Real Estate, Rental & Leasing (100.0%).
| Industry | Male | Female |
| Agriculture, Fishing & Hunting | 0 (0.0%) | 0 (0.0%) |
| Mining, Quarrying, & Extraction | 6 (100.0%) | 0 (0.0%) |
| Construction | 7 (100.0%) | 0 (0.0%) |
| Manufacturing | 57 (96.6%) | 2 (3.4%) |
| Wholesale Trade | 0 (0.0%) | 1 (100.0%) |
| Retail Trade | 8 (12.3%) | 57 (87.7%) |
| Transportation & Warehousing | 2 (33.3%) | 4 (66.7%) |
| Utilities | 2 (100.0%) | 0 (0.0%) |
| Information | 0 (0.0%) | 0 (0.0%) |
| Finance & Insurance | 0 (0.0%) | 4 (100.0%) |
| Real Estate, Rental & Leasing | 0 (0.0%) | 3 (100.0%) |
| Professional & Scientific | 3 (60.0%) | 2 (40.0%) |
| Enterprise Management | 0 (0.0%) | 0 (0.0%) |
| Administrative & Support | 4 (50.0%) | 4 (50.0%) |
| Educational Services | 4 (36.4%) | 7 (63.6%) |
| Health Care & Social Assistance | 2 (28.6%) | 5 (71.4%) |
| Arts, Entertainment & Recreation | 1 (100.0%) | 0 (0.0%) |
| Accommodation & Food Services | 1 (12.5%) | 7 (87.5%) |
| Public Administration | 0 (0.0%) | 1 (100.0%) |
| Total | 100 (50.8%) | 97 (49.2%) |
Education in Agra
School Enrollment in Agra
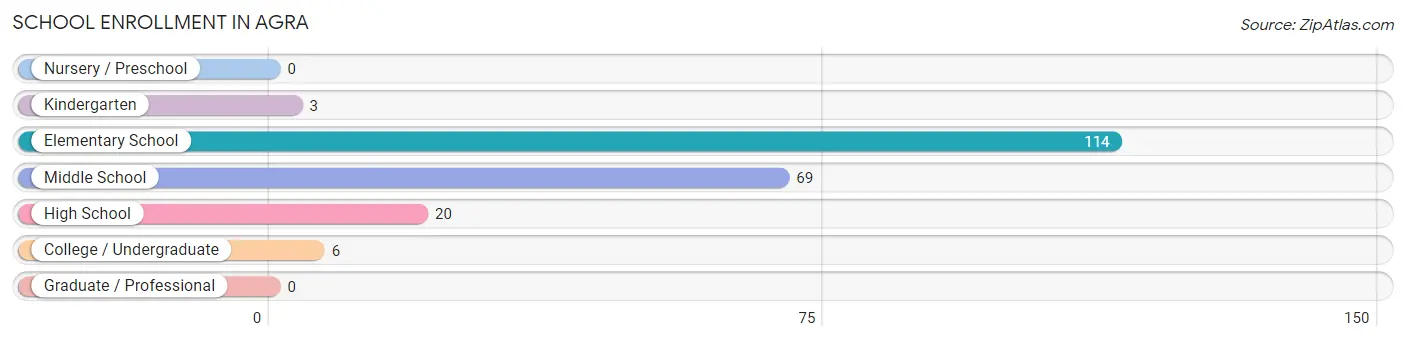
The most common levels of schooling among the 212 students in Agra are elementary school (114 | 53.8%), middle school (69 | 32.6%), and high school (20 | 9.4%).
| School Level | # Students | % Students |
| Nursery / Preschool | 0 | 0.0% |
| Kindergarten | 3 | 1.4% |
| Elementary School | 114 | 53.8% |
| Middle School | 69 | 32.6% |
| High School | 20 | 9.4% |
| College / Undergraduate | 6 | 2.8% |
| Graduate / Professional | 0 | 0.0% |
| Total | 212 | 100.0% |
School Enrollment by Age by Funding Source in Agra
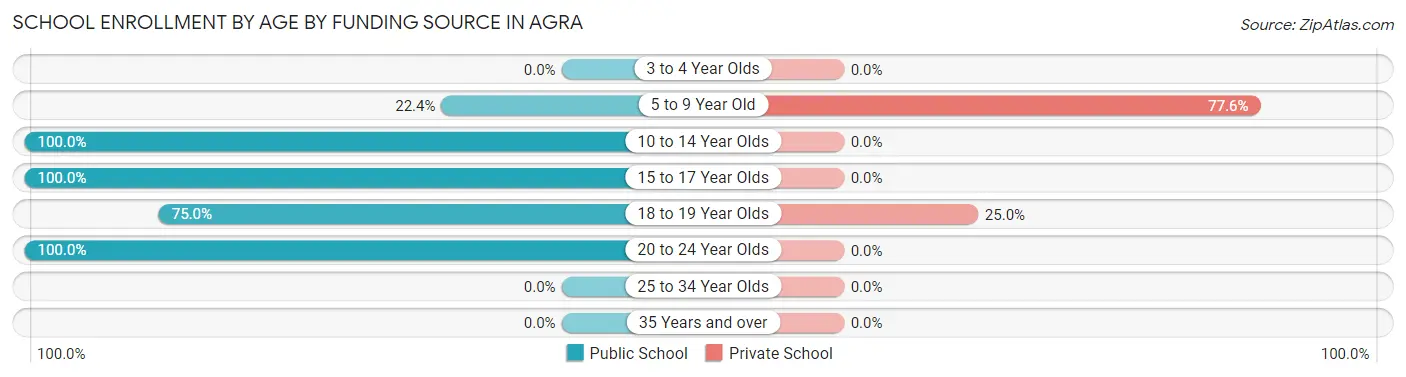
Out of a total of 212 students who are enrolled in schools in Agra, 54 (25.5%) attend a private institution, while the remaining 158 (74.5%) are enrolled in public schools. The age group of 5 to 9 year old has the highest likelihood of being enrolled in private schools, with 52 (77.6% in the age bracket) enrolled. Conversely, the age group of 10 to 14 year olds has the lowest likelihood of being enrolled in a private school, with 119 (100.0% in the age bracket) attending a public institution.
| Age Bracket | Public School | Private School |
| 3 to 4 Year Olds | 0 (0.0%) | 0 (0.0%) |
| 5 to 9 Year Old | 15 (22.4%) | 52 (77.6%) |
| 10 to 14 Year Olds | 119 (100.0%) | 0 (0.0%) |
| 15 to 17 Year Olds | 17 (100.0%) | 0 (0.0%) |
| 18 to 19 Year Olds | 6 (75.0%) | 2 (25.0%) |
| 20 to 24 Year Olds | 1 (100.0%) | 0 (0.0%) |
| 25 to 34 Year Olds | 0 (0.0%) | 0 (0.0%) |
| 35 Years and over | 0 (0.0%) | 0 (0.0%) |
| Total | 158 (74.5%) | 54 (25.5%) |
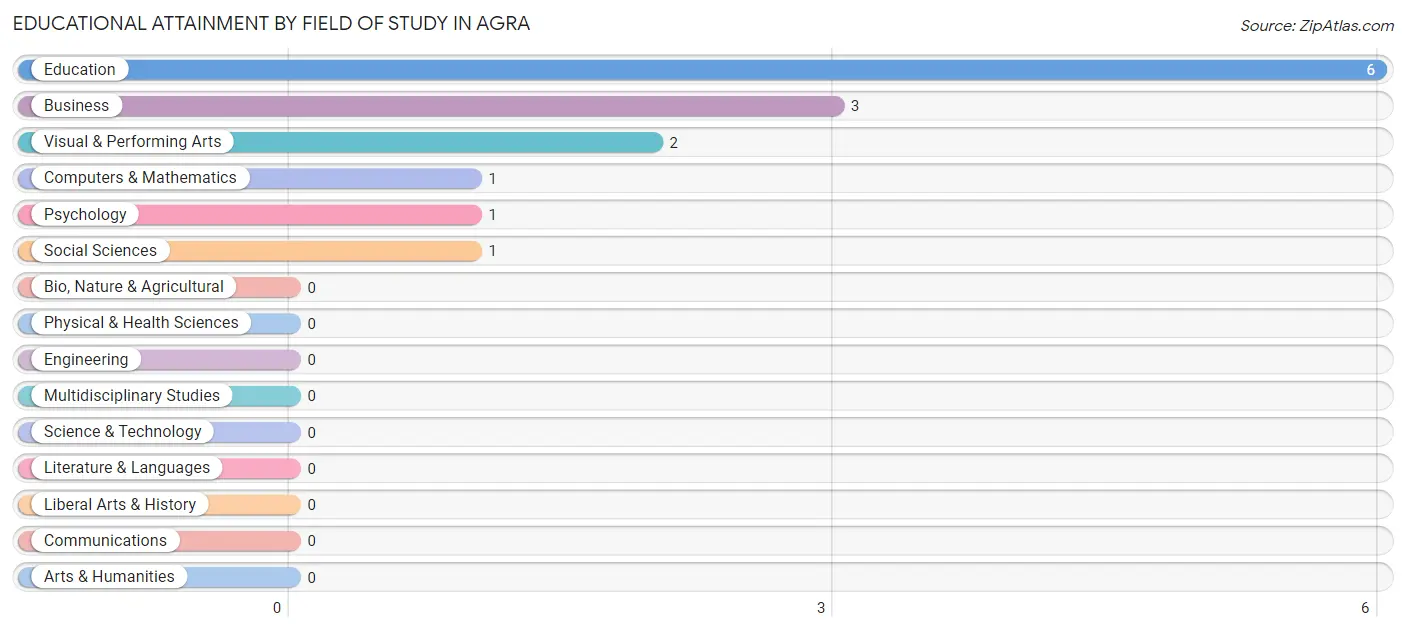
Educational Attainment by Field of Study in Agra
Education (6 | 42.9%), business (3 | 21.4%), visual & performing arts (2 | 14.3%), computers & mathematics (1 | 7.1%), and psychology (1 | 7.1%) are the most common fields of study among 14 individuals in Agra who have obtained a bachelor's degree or higher.
| Field of Study | # Graduates | % Graduates |
| Computers & Mathematics | 1 | 7.1% |
| Bio, Nature & Agricultural | 0 | 0.0% |
| Physical & Health Sciences | 0 | 0.0% |
| Psychology | 1 | 7.1% |
| Social Sciences | 1 | 7.1% |
| Engineering | 0 | 0.0% |
| Multidisciplinary Studies | 0 | 0.0% |
| Science & Technology | 0 | 0.0% |
| Business | 3 | 21.4% |
| Education | 6 | 42.9% |
| Literature & Languages | 0 | 0.0% |
| Liberal Arts & History | 0 | 0.0% |
| Visual & Performing Arts | 2 | 14.3% |
| Communications | 0 | 0.0% |
| Arts & Humanities | 0 | 0.0% |
| Total | 14 | 100.0% |
Transportation & Commute in Agra
Vehicle Availability by Sex in Agra
The most prevalent vehicle ownership categories in Agra are males with 2 vehicles (70, accounting for 70.7%) and females with 2 vehicles (63, making up 72.2%).

| Vehicles Available | Male | Female |
| No Vehicle | 0 (0.0%) | 0 (0.0%) |
| 1 Vehicle | 8 (8.1%) | 11 (11.3%) |
| 2 Vehicles | 70 (70.7%) | 63 (64.9%) |
| 3 Vehicles | 16 (16.2%) | 20 (20.6%) |
| 4 Vehicles | 3 (3.0%) | 3 (3.1%) |
| 5 or more Vehicles | 2 (2.0%) | 0 (0.0%) |
| Total | 99 (100.0%) | 97 (100.0%) |
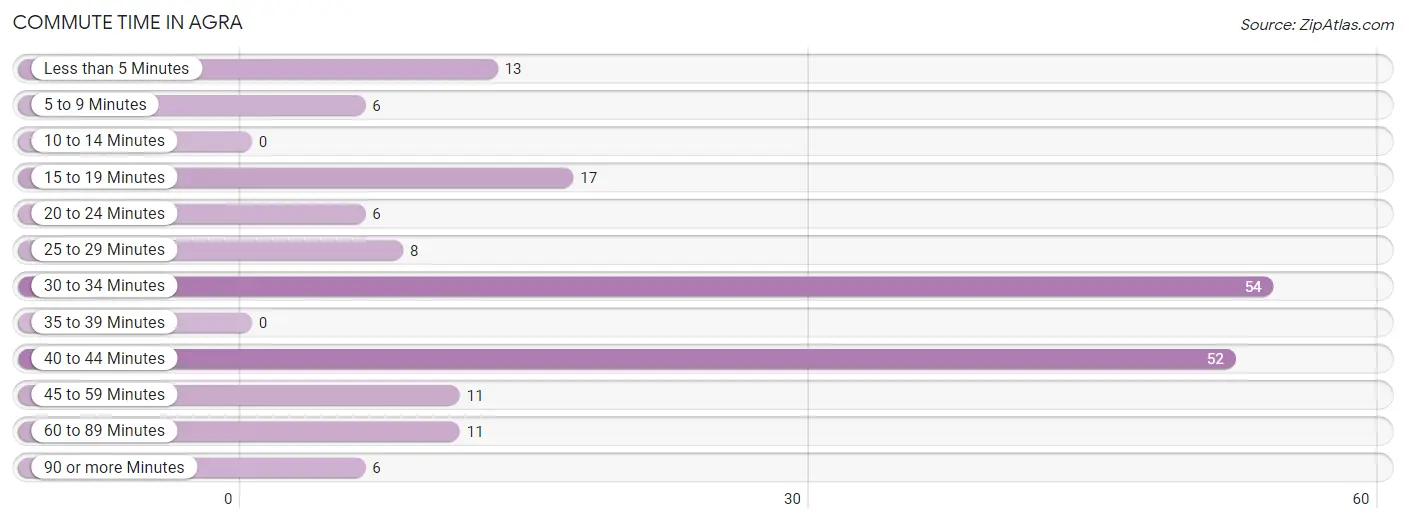
Commute Time in Agra
The most frequently occuring commute durations in Agra are 30 to 34 minutes (54 commuters, 29.3%), 40 to 44 minutes (52 commuters, 28.3%), and 15 to 19 minutes (17 commuters, 9.2%).
| Commute Time | # Commuters | % Commuters |
| Less than 5 Minutes | 13 | 7.1% |
| 5 to 9 Minutes | 6 | 3.3% |
| 10 to 14 Minutes | 0 | 0.0% |
| 15 to 19 Minutes | 17 | 9.2% |
| 20 to 24 Minutes | 6 | 3.3% |
| 25 to 29 Minutes | 8 | 4.3% |
| 30 to 34 Minutes | 54 | 29.3% |
| 35 to 39 Minutes | 0 | 0.0% |
| 40 to 44 Minutes | 52 | 28.3% |
| 45 to 59 Minutes | 11 | 6.0% |
| 60 to 89 Minutes | 11 | 6.0% |
| 90 or more Minutes | 6 | 3.3% |
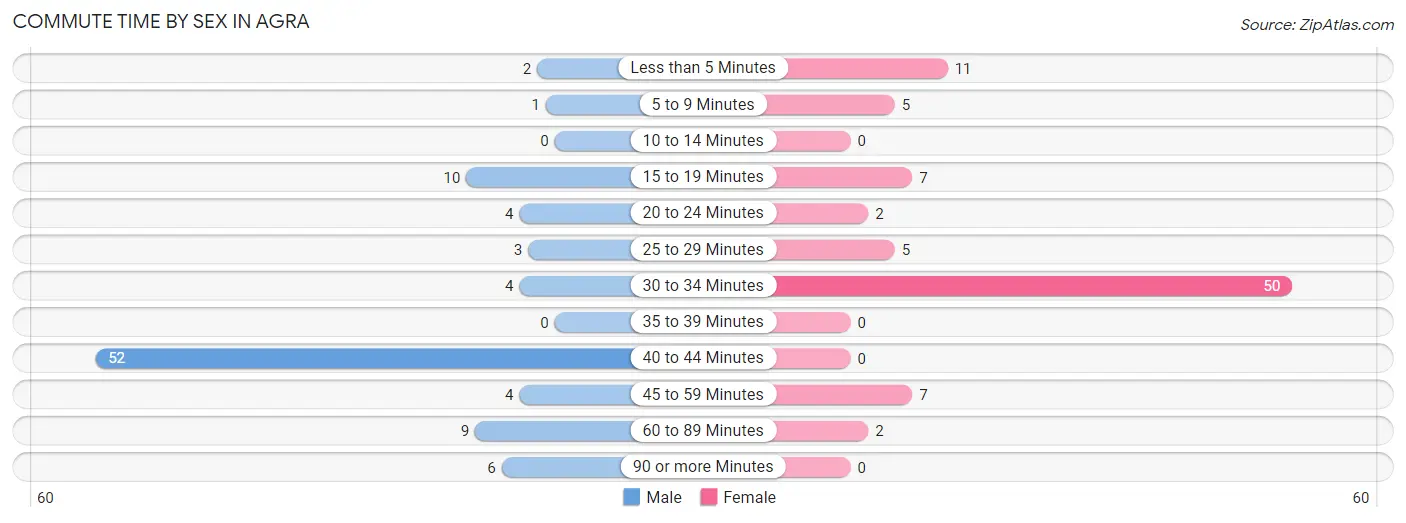
Commute Time by Sex in Agra
The most common commute times in Agra are 40 to 44 minutes (52 commuters, 54.7%) for males and 30 to 34 minutes (50 commuters, 56.2%) for females.
| Commute Time | Male | Female |
| Less than 5 Minutes | 2 (2.1%) | 11 (12.4%) |
| 5 to 9 Minutes | 1 (1.1%) | 5 (5.6%) |
| 10 to 14 Minutes | 0 (0.0%) | 0 (0.0%) |
| 15 to 19 Minutes | 10 (10.5%) | 7 (7.9%) |
| 20 to 24 Minutes | 4 (4.2%) | 2 (2.2%) |
| 25 to 29 Minutes | 3 (3.2%) | 5 (5.6%) |
| 30 to 34 Minutes | 4 (4.2%) | 50 (56.2%) |
| 35 to 39 Minutes | 0 (0.0%) | 0 (0.0%) |
| 40 to 44 Minutes | 52 (54.7%) | 0 (0.0%) |
| 45 to 59 Minutes | 4 (4.2%) | 7 (7.9%) |
| 60 to 89 Minutes | 9 (9.5%) | 2 (2.2%) |
| 90 or more Minutes | 6 (6.3%) | 0 (0.0%) |
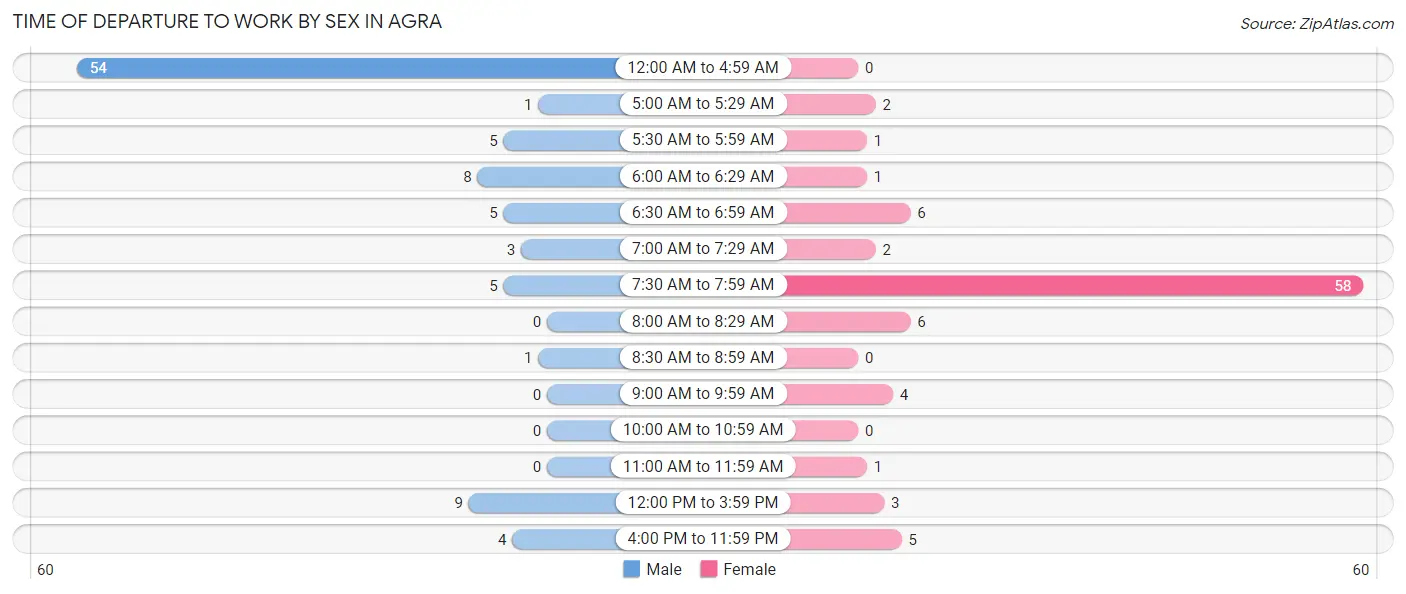
Time of Departure to Work by Sex in Agra
The most frequent times of departure to work in Agra are 12:00 AM to 4:59 AM (54, 56.8%) for males and 7:30 AM to 7:59 AM (58, 65.2%) for females.
| Time of Departure | Male | Female |
| 12:00 AM to 4:59 AM | 54 (56.8%) | 0 (0.0%) |
| 5:00 AM to 5:29 AM | 1 (1.1%) | 2 (2.2%) |
| 5:30 AM to 5:59 AM | 5 (5.3%) | 1 (1.1%) |
| 6:00 AM to 6:29 AM | 8 (8.4%) | 1 (1.1%) |
| 6:30 AM to 6:59 AM | 5 (5.3%) | 6 (6.7%) |
| 7:00 AM to 7:29 AM | 3 (3.2%) | 2 (2.2%) |
| 7:30 AM to 7:59 AM | 5 (5.3%) | 58 (65.2%) |
| 8:00 AM to 8:29 AM | 0 (0.0%) | 6 (6.7%) |
| 8:30 AM to 8:59 AM | 1 (1.1%) | 0 (0.0%) |
| 9:00 AM to 9:59 AM | 0 (0.0%) | 4 (4.5%) |
| 10:00 AM to 10:59 AM | 0 (0.0%) | 0 (0.0%) |
| 11:00 AM to 11:59 AM | 0 (0.0%) | 1 (1.1%) |
| 12:00 PM to 3:59 PM | 9 (9.5%) | 3 (3.4%) |
| 4:00 PM to 11:59 PM | 4 (4.2%) | 5 (5.6%) |
| Total | 95 (100.0%) | 89 (100.0%) |
Housing Occupancy in Agra
Occupancy by Ownership in Agra
Of the total 155 dwellings in Agra, owner-occupied units account for 122 (78.7%), while renter-occupied units make up 33 (21.3%).
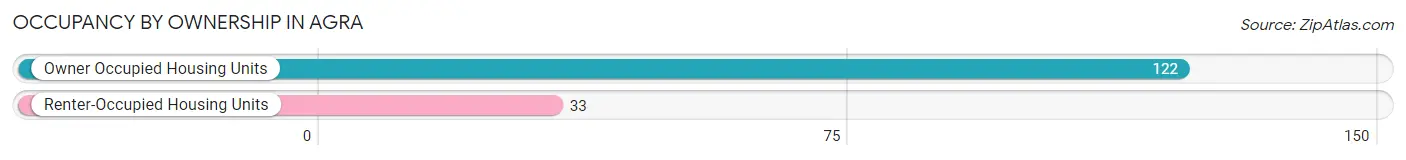
| Occupancy | # Housing Units | % Housing Units |
| Owner Occupied Housing Units | 122 | 78.7% |
| Renter-Occupied Housing Units | 33 | 21.3% |
| Total Occupied Housing Units | 155 | 100.0% |
Occupancy by Household Size in Agra
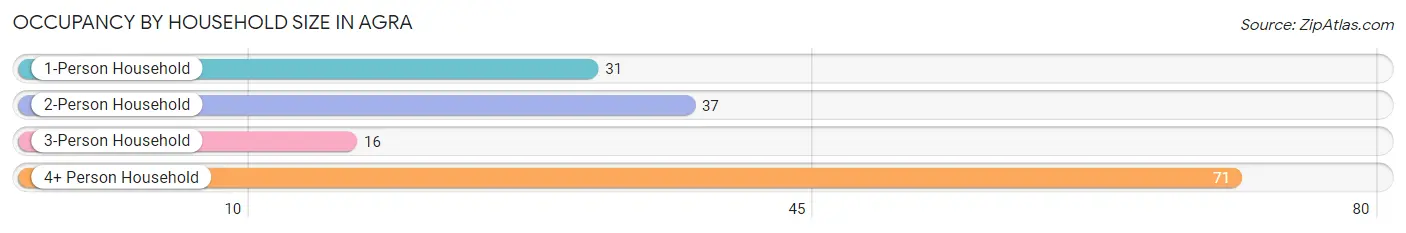
| Household Size | # Housing Units | % Housing Units |
| 1-Person Household | 31 | 20.0% |
| 2-Person Household | 37 | 23.9% |
| 3-Person Household | 16 | 10.3% |
| 4+ Person Household | 71 | 45.8% |
| Total Housing Units | 155 | 100.0% |
Occupancy by Ownership by Household Size in Agra
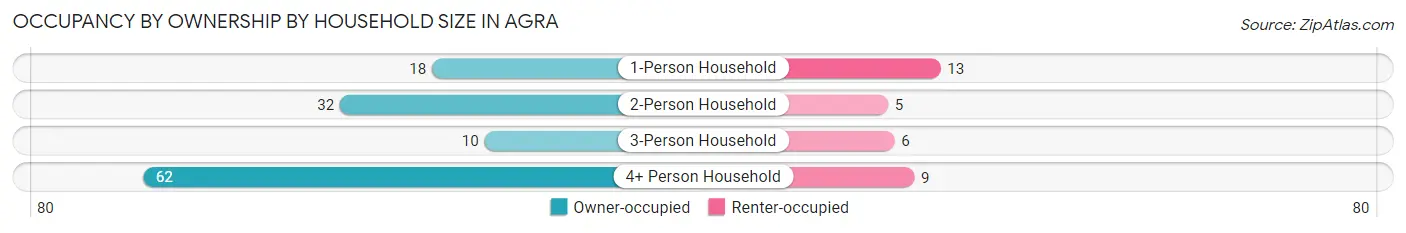
| Household Size | Owner-occupied | Renter-occupied |
| 1-Person Household | 18 (58.1%) | 13 (41.9%) |
| 2-Person Household | 32 (86.5%) | 5 (13.5%) |
| 3-Person Household | 10 (62.5%) | 6 (37.5%) |
| 4+ Person Household | 62 (87.3%) | 9 (12.7%) |
| Total Housing Units | 122 (78.7%) | 33 (21.3%) |
Occupancy by Educational Attainment in Agra
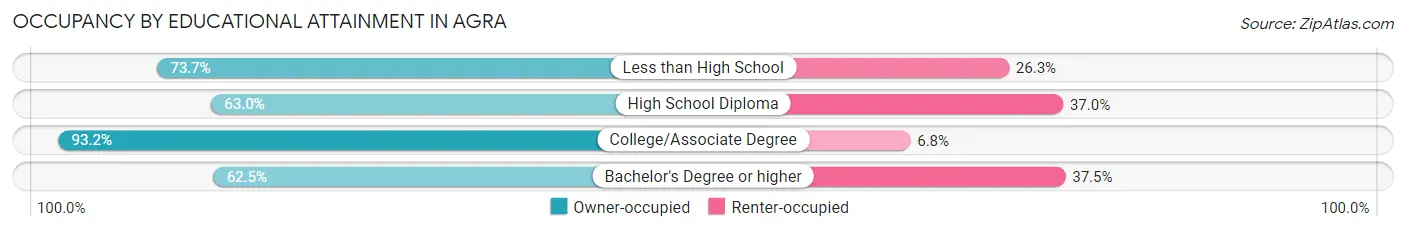
| Household Size | Owner-occupied | Renter-occupied |
| Less than High School | 14 (73.7%) | 5 (26.3%) |
| High School Diploma | 34 (63.0%) | 20 (37.0%) |
| College/Associate Degree | 69 (93.2%) | 5 (6.8%) |
| Bachelor's Degree or higher | 5 (62.5%) | 3 (37.5%) |
Occupancy by Age of Householder in Agra
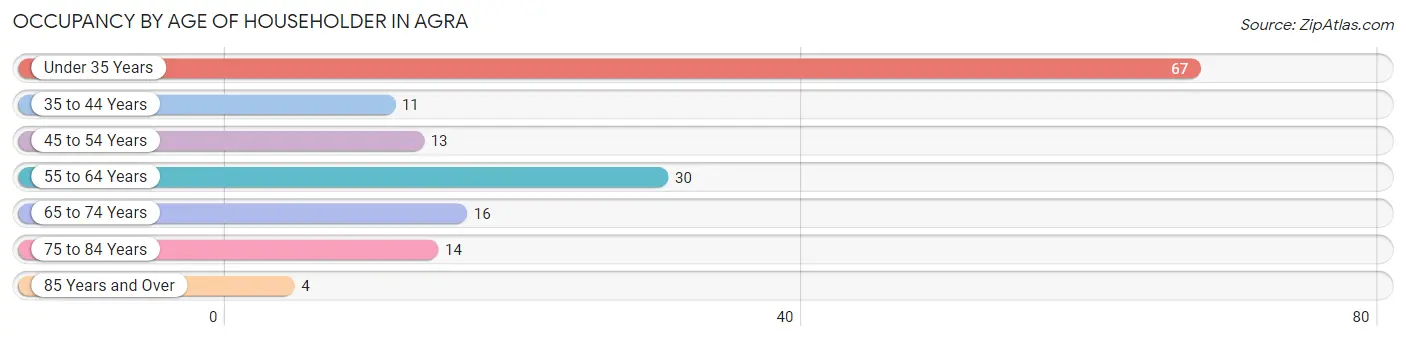
| Age Bracket | # Households | % Households |
| Under 35 Years | 67 | 43.2% |
| 35 to 44 Years | 11 | 7.1% |
| 45 to 54 Years | 13 | 8.4% |
| 55 to 64 Years | 30 | 19.4% |
| 65 to 74 Years | 16 | 10.3% |
| 75 to 84 Years | 14 | 9.0% |
| 85 Years and Over | 4 | 2.6% |
| Total | 155 | 100.0% |
Housing Finances in Agra
Median Income by Occupancy in Agra
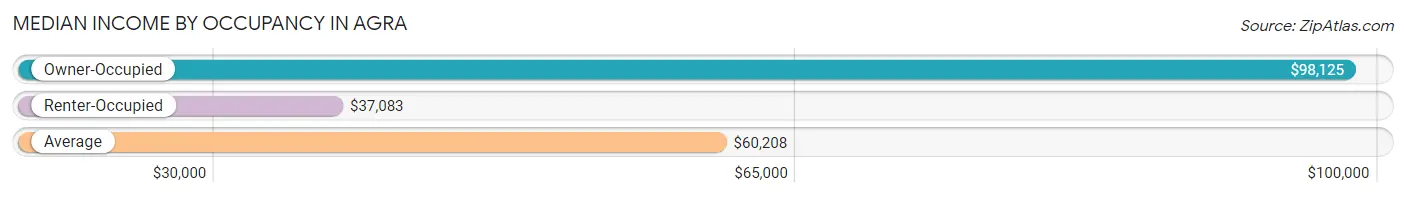
| Occupancy Type | # Households | Median Income |
| Owner-Occupied | 122 (78.7%) | $98,125 |
| Renter-Occupied | 33 (21.3%) | $37,083 |
| Average | 155 (100.0%) | $60,208 |
Occupancy by Householder Income Bracket in Agra
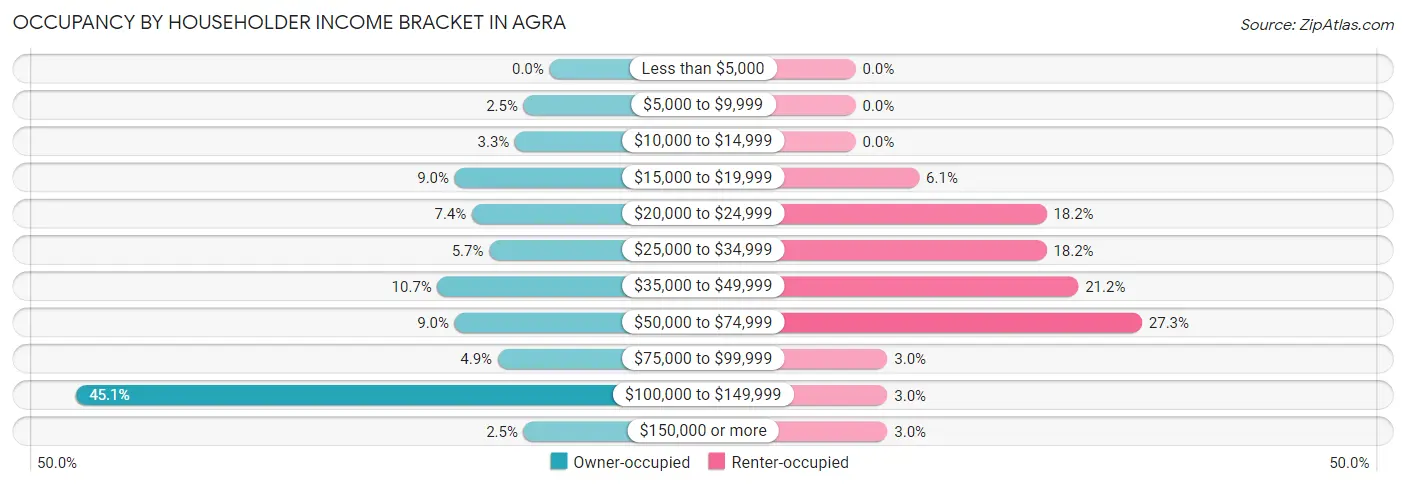
| Income Bracket | Owner-occupied | Renter-occupied |
| Less than $5,000 | 0 (0.0%) | 0 (0.0%) |
| $5,000 to $9,999 | 3 (2.5%) | 0 (0.0%) |
| $10,000 to $14,999 | 4 (3.3%) | 0 (0.0%) |
| $15,000 to $19,999 | 11 (9.0%) | 2 (6.1%) |
| $20,000 to $24,999 | 9 (7.4%) | 6 (18.2%) |
| $25,000 to $34,999 | 7 (5.7%) | 6 (18.2%) |
| $35,000 to $49,999 | 13 (10.7%) | 7 (21.2%) |
| $50,000 to $74,999 | 11 (9.0%) | 9 (27.3%) |
| $75,000 to $99,999 | 6 (4.9%) | 1 (3.0%) |
| $100,000 to $149,999 | 55 (45.1%) | 1 (3.0%) |
| $150,000 or more | 3 (2.5%) | 1 (3.0%) |
| Total | 122 (100.0%) | 33 (100.0%) |
Monthly Housing Cost Tiers in Agra
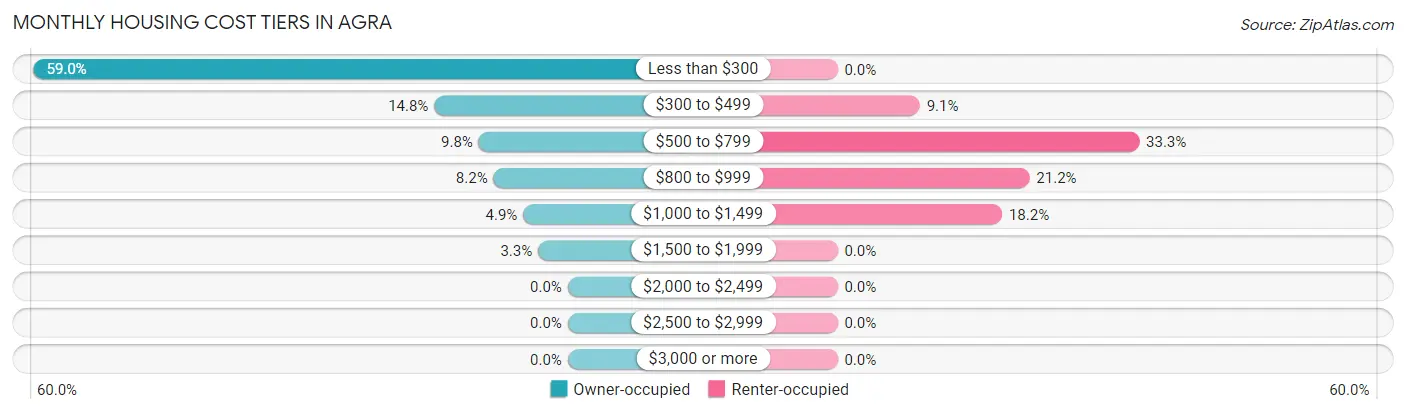
| Monthly Cost | Owner-occupied | Renter-occupied |
| Less than $300 | 72 (59.0%) | 0 (0.0%) |
| $300 to $499 | 18 (14.7%) | 3 (9.1%) |
| $500 to $799 | 12 (9.8%) | 11 (33.3%) |
| $800 to $999 | 10 (8.2%) | 7 (21.2%) |
| $1,000 to $1,499 | 6 (4.9%) | 6 (18.2%) |
| $1,500 to $1,999 | 4 (3.3%) | 0 (0.0%) |
| $2,000 to $2,499 | 0 (0.0%) | 0 (0.0%) |
| $2,500 to $2,999 | 0 (0.0%) | 0 (0.0%) |
| $3,000 or more | 0 (0.0%) | 0 (0.0%) |
| Total | 122 (100.0%) | 33 (100.0%) |
Physical Housing Characteristics in Agra
Housing Structures in Agra
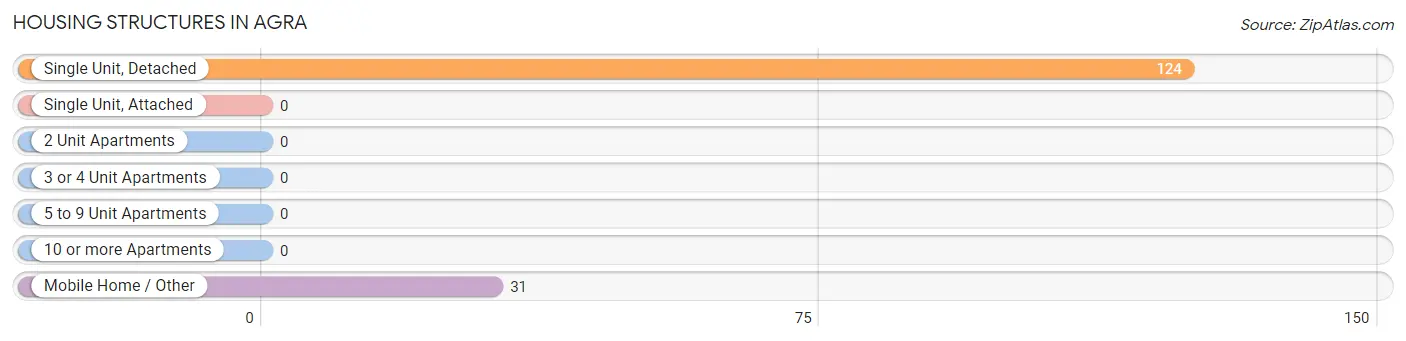
| Structure Type | # Housing Units | % Housing Units |
| Single Unit, Detached | 124 | 80.0% |
| Single Unit, Attached | 0 | 0.0% |
| 2 Unit Apartments | 0 | 0.0% |
| 3 or 4 Unit Apartments | 0 | 0.0% |
| 5 to 9 Unit Apartments | 0 | 0.0% |
| 10 or more Apartments | 0 | 0.0% |
| Mobile Home / Other | 31 | 20.0% |
| Total | 155 | 100.0% |
Housing Structures by Occupancy in Agra
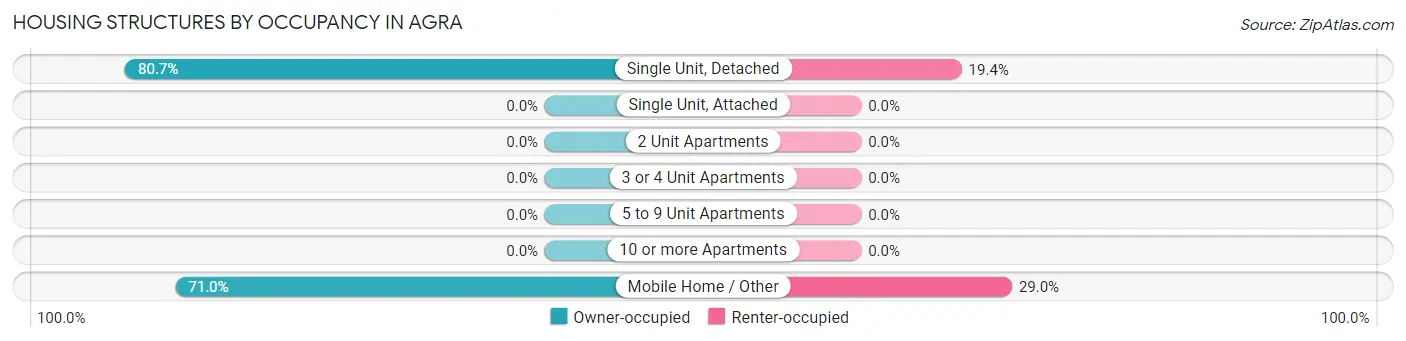
| Structure Type | Owner-occupied | Renter-occupied |
| Single Unit, Detached | 100 (80.6%) | 24 (19.4%) |
| Single Unit, Attached | 0 (0.0%) | 0 (0.0%) |
| 2 Unit Apartments | 0 (0.0%) | 0 (0.0%) |
| 3 or 4 Unit Apartments | 0 (0.0%) | 0 (0.0%) |
| 5 to 9 Unit Apartments | 0 (0.0%) | 0 (0.0%) |
| 10 or more Apartments | 0 (0.0%) | 0 (0.0%) |
| Mobile Home / Other | 22 (71.0%) | 9 (29.0%) |
| Total | 122 (78.7%) | 33 (21.3%) |
Housing Structures by Number of Rooms in Agra
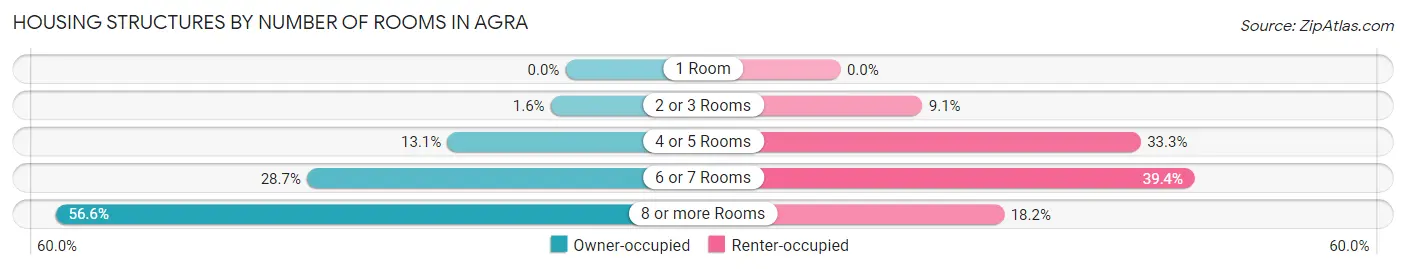
| Number of Rooms | Owner-occupied | Renter-occupied |
| 1 Room | 0 (0.0%) | 0 (0.0%) |
| 2 or 3 Rooms | 2 (1.6%) | 3 (9.1%) |
| 4 or 5 Rooms | 16 (13.1%) | 11 (33.3%) |
| 6 or 7 Rooms | 35 (28.7%) | 13 (39.4%) |
| 8 or more Rooms | 69 (56.6%) | 6 (18.2%) |
| Total | 122 (100.0%) | 33 (100.0%) |
Housing Structure by Heating Type in Agra
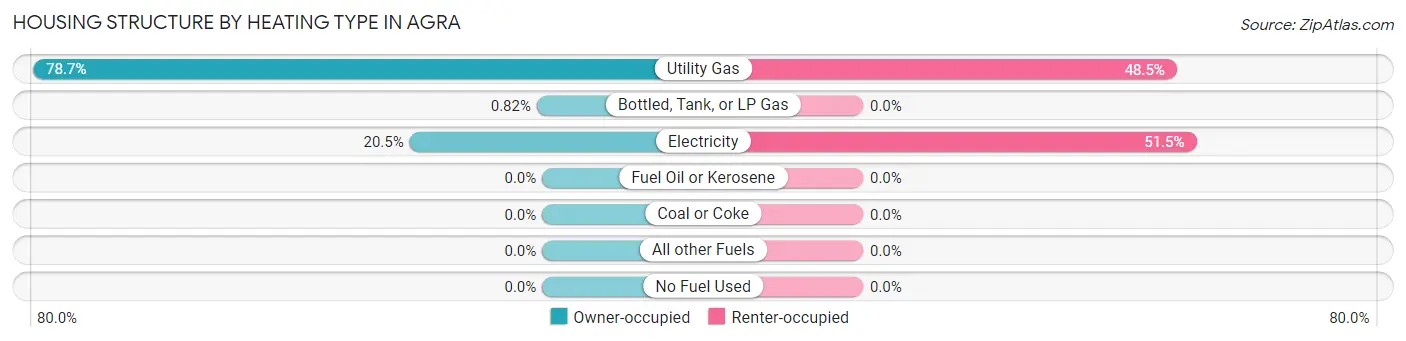
| Heating Type | Owner-occupied | Renter-occupied |
| Utility Gas | 96 (78.7%) | 16 (48.5%) |
| Bottled, Tank, or LP Gas | 1 (0.8%) | 0 (0.0%) |
| Electricity | 25 (20.5%) | 17 (51.5%) |
| Fuel Oil or Kerosene | 0 (0.0%) | 0 (0.0%) |
| Coal or Coke | 0 (0.0%) | 0 (0.0%) |
| All other Fuels | 0 (0.0%) | 0 (0.0%) |
| No Fuel Used | 0 (0.0%) | 0 (0.0%) |
| Total | 122 (100.0%) | 33 (100.0%) |
Household Vehicle Usage in Agra
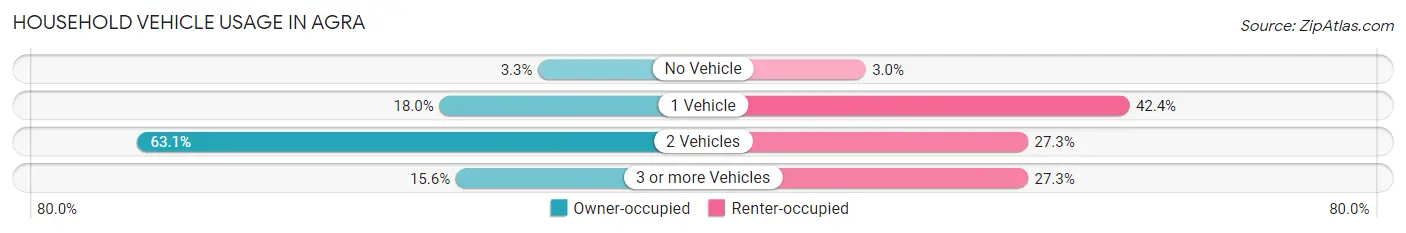
| Vehicles per Household | Owner-occupied | Renter-occupied |
| No Vehicle | 4 (3.3%) | 1 (3.0%) |
| 1 Vehicle | 22 (18.0%) | 14 (42.4%) |
| 2 Vehicles | 77 (63.1%) | 9 (27.3%) |
| 3 or more Vehicles | 19 (15.6%) | 9 (27.3%) |
| Total | 122 (100.0%) | 33 (100.0%) |
Real Estate & Mortgages in Agra
Real Estate and Mortgage Overview in Agra
| Characteristic | Without Mortgage | With Mortgage |
| Housing Units | 98 | 24 |
| Median Property Value | $202,900 | $86,000 |
| Median Household Income | $110,245 | $2 |
| Monthly Housing Costs | $236 | $0 |
| Real Estate Taxes | $360 | $3 |
Property Value by Mortgage Status in Agra
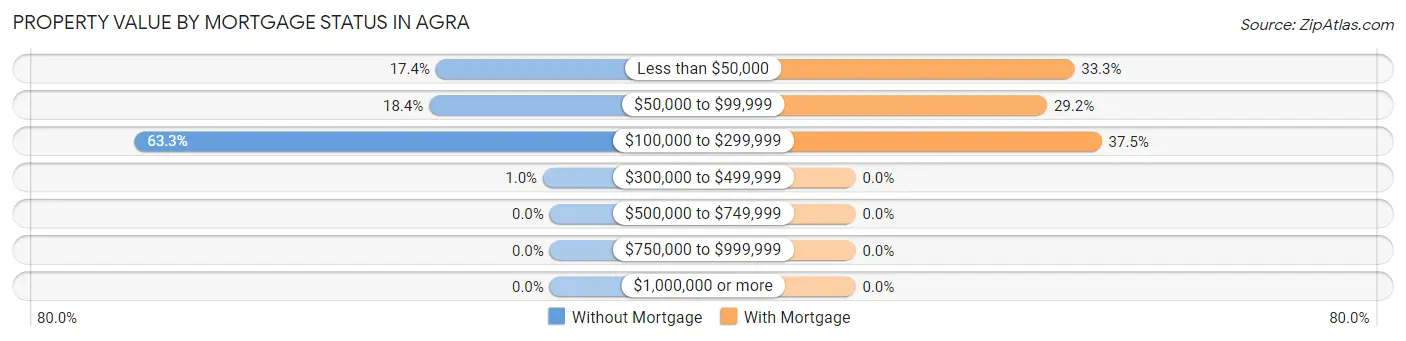
| Property Value | Without Mortgage | With Mortgage |
| Less than $50,000 | 17 (17.3%) | 8 (33.3%) |
| $50,000 to $99,999 | 18 (18.4%) | 7 (29.2%) |
| $100,000 to $299,999 | 62 (63.3%) | 9 (37.5%) |
| $300,000 to $499,999 | 1 (1.0%) | 0 (0.0%) |
| $500,000 to $749,999 | 0 (0.0%) | 0 (0.0%) |
| $750,000 to $999,999 | 0 (0.0%) | 0 (0.0%) |
| $1,000,000 or more | 0 (0.0%) | 0 (0.0%) |
| Total | 98 (100.0%) | 24 (100.0%) |
Household Income by Mortgage Status in Agra
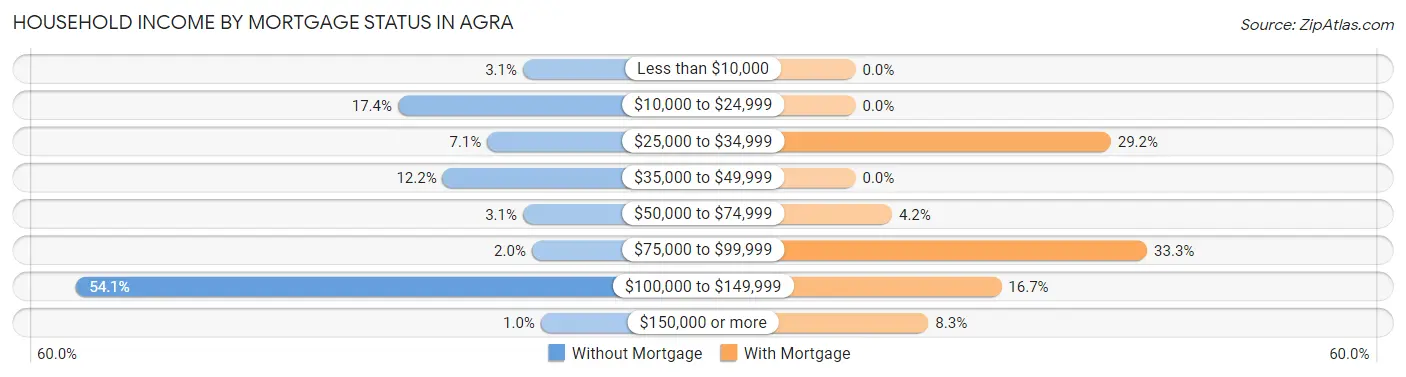
| Household Income | Without Mortgage | With Mortgage |
| Less than $10,000 | 3 (3.1%) | 0 (0.0%) |
| $10,000 to $24,999 | 17 (17.3%) | 0 (0.0%) |
| $25,000 to $34,999 | 7 (7.1%) | 7 (29.2%) |
| $35,000 to $49,999 | 12 (12.2%) | 0 (0.0%) |
| $50,000 to $74,999 | 3 (3.1%) | 1 (4.2%) |
| $75,000 to $99,999 | 2 (2.0%) | 8 (33.3%) |
| $100,000 to $149,999 | 53 (54.1%) | 4 (16.7%) |
| $150,000 or more | 1 (1.0%) | 2 (8.3%) |
| Total | 98 (100.0%) | 24 (100.0%) |
Property Value to Household Income Ratio in Agra
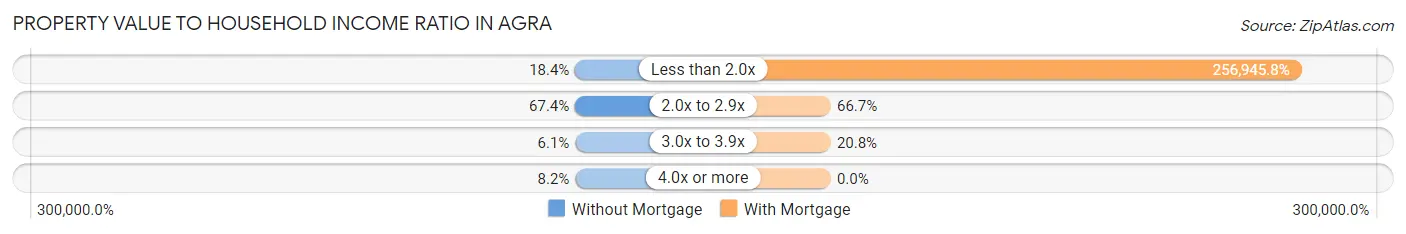
| Value-to-Income Ratio | Without Mortgage | With Mortgage |
| Less than 2.0x | 18 (18.4%) | 61,667 (256,945.8%) |
| 2.0x to 2.9x | 66 (67.3%) | 16 (66.7%) |
| 3.0x to 3.9x | 6 (6.1%) | 5 (20.8%) |
| 4.0x or more | 8 (8.2%) | 0 (0.0%) |
| Total | 98 (100.0%) | 24 (100.0%) |
Real Estate Taxes by Mortgage Status in Agra
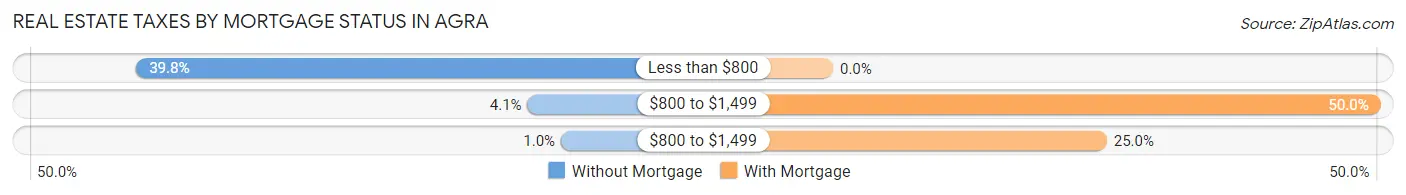
| Property Taxes | Without Mortgage | With Mortgage |
| Less than $800 | 39 (39.8%) | 0 (0.0%) |
| $800 to $1,499 | 4 (4.1%) | 12 (50.0%) |
| $800 to $1,499 | 1 (1.0%) | 6 (25.0%) |
| Total | 98 (100.0%) | 24 (100.0%) |
Health & Disability in Agra
Health Insurance Coverage by Age in Agra
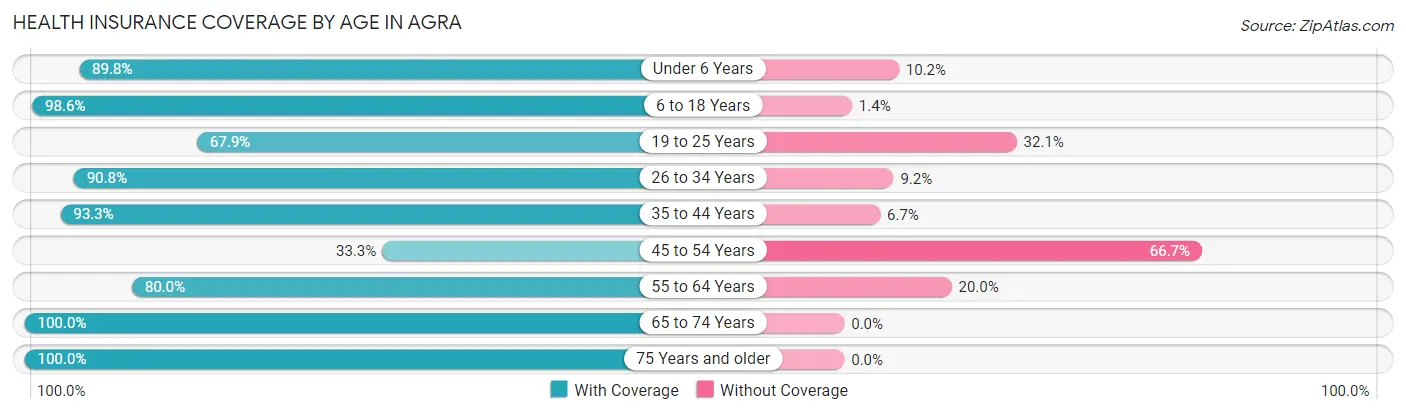
| Age Bracket | With Coverage | Without Coverage |
| Under 6 Years | 53 (89.8%) | 6 (10.2%) |
| 6 to 18 Years | 208 (98.6%) | 3 (1.4%) |
| 19 to 25 Years | 19 (67.9%) | 9 (32.1%) |
| 26 to 34 Years | 109 (90.8%) | 11 (9.2%) |
| 35 to 44 Years | 28 (93.3%) | 2 (6.7%) |
| 45 to 54 Years | 8 (33.3%) | 16 (66.7%) |
| 55 to 64 Years | 40 (80.0%) | 10 (20.0%) |
| 65 to 74 Years | 24 (100.0%) | 0 (0.0%) |
| 75 Years and older | 48 (100.0%) | 0 (0.0%) |
| Total | 537 (90.4%) | 57 (9.6%) |
Health Insurance Coverage by Citizenship Status in Agra
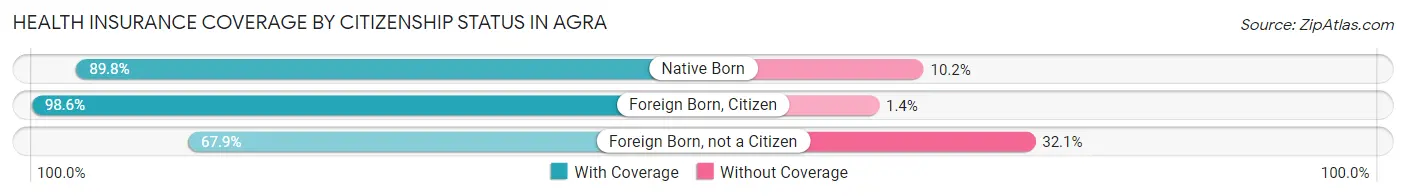
| Citizenship Status | With Coverage | Without Coverage |
| Native Born | 53 (89.8%) | 6 (10.2%) |
| Foreign Born, Citizen | 208 (98.6%) | 3 (1.4%) |
| Foreign Born, not a Citizen | 19 (67.9%) | 9 (32.1%) |
Health Insurance Coverage by Household Income in Agra
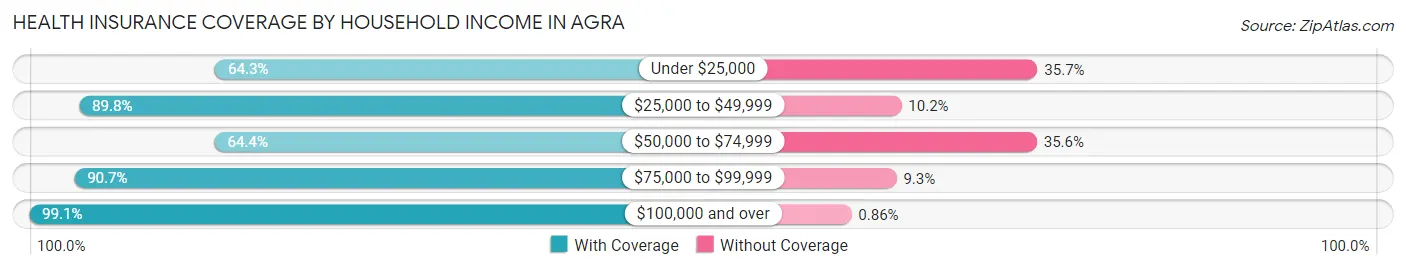
| Household Income | With Coverage | Without Coverage |
| Under $25,000 | 36 (64.3%) | 20 (35.7%) |
| $25,000 to $49,999 | 79 (89.8%) | 9 (10.2%) |
| $50,000 to $74,999 | 38 (64.4%) | 21 (35.6%) |
| $75,000 to $99,999 | 39 (90.7%) | 4 (9.3%) |
| $100,000 and over | 345 (99.1%) | 3 (0.9%) |
Public vs Private Health Insurance Coverage by Age in Agra
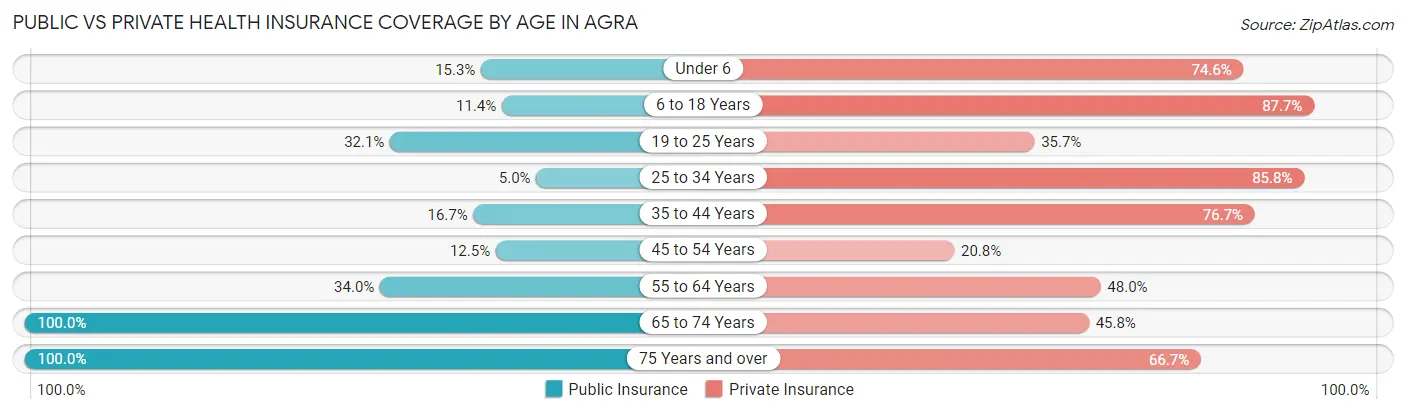
| Age Bracket | Public Insurance | Private Insurance |
| Under 6 | 9 (15.2%) | 44 (74.6%) |
| 6 to 18 Years | 24 (11.4%) | 185 (87.7%) |
| 19 to 25 Years | 9 (32.1%) | 10 (35.7%) |
| 25 to 34 Years | 6 (5.0%) | 103 (85.8%) |
| 35 to 44 Years | 5 (16.7%) | 23 (76.7%) |
| 45 to 54 Years | 3 (12.5%) | 5 (20.8%) |
| 55 to 64 Years | 17 (34.0%) | 24 (48.0%) |
| 65 to 74 Years | 24 (100.0%) | 11 (45.8%) |
| 75 Years and over | 48 (100.0%) | 32 (66.7%) |
| Total | 145 (24.4%) | 437 (73.6%) |
Disability Status by Sex by Age in Agra
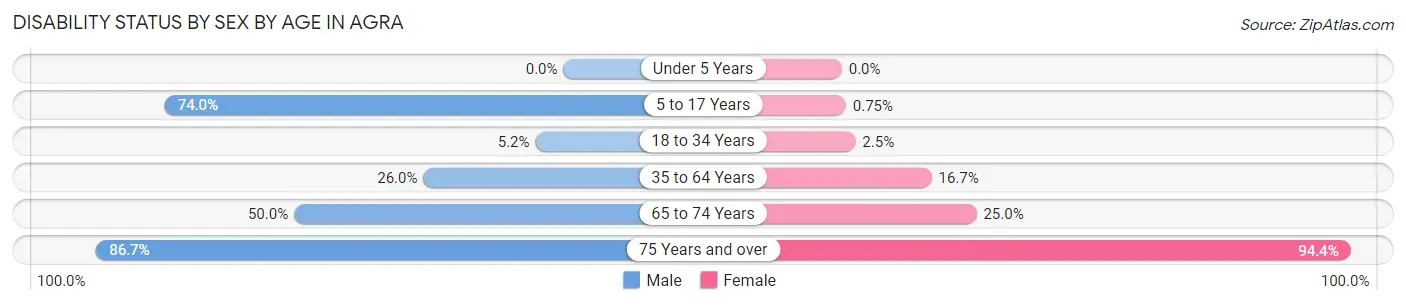
| Age Bracket | Male | Female |
| Under 5 Years | 0 (0.0%) | 0 (0.0%) |
| 5 to 17 Years | 54 (74.0%) | 1 (0.7%) |
| 18 to 34 Years | 4 (5.2%) | 2 (2.5%) |
| 35 to 64 Years | 13 (26.0%) | 9 (16.7%) |
| 65 to 74 Years | 6 (50.0%) | 3 (25.0%) |
| 75 Years and over | 26 (86.7%) | 17 (94.4%) |
Disability Class by Sex by Age in Agra
Disability Class: Hearing Difficulty
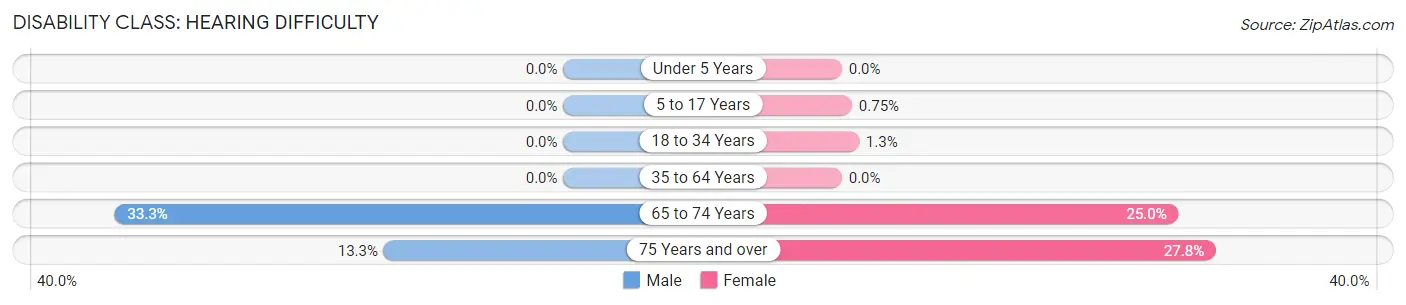
| Age Bracket | Male | Female |
| Under 5 Years | 0 (0.0%) | 0 (0.0%) |
| 5 to 17 Years | 0 (0.0%) | 1 (0.7%) |
| 18 to 34 Years | 0 (0.0%) | 1 (1.3%) |
| 35 to 64 Years | 0 (0.0%) | 0 (0.0%) |
| 65 to 74 Years | 4 (33.3%) | 3 (25.0%) |
| 75 Years and over | 4 (13.3%) | 5 (27.8%) |
Disability Class: Vision Difficulty
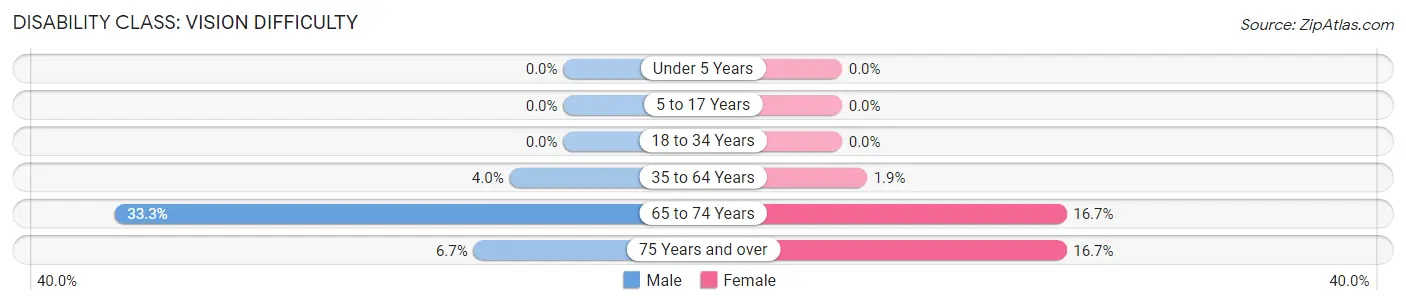
| Age Bracket | Male | Female |
| Under 5 Years | 0 (0.0%) | 0 (0.0%) |
| 5 to 17 Years | 0 (0.0%) | 0 (0.0%) |
| 18 to 34 Years | 0 (0.0%) | 0 (0.0%) |
| 35 to 64 Years | 2 (4.0%) | 1 (1.8%) |
| 65 to 74 Years | 4 (33.3%) | 2 (16.7%) |
| 75 Years and over | 2 (6.7%) | 3 (16.7%) |
Disability Class: Cognitive Difficulty
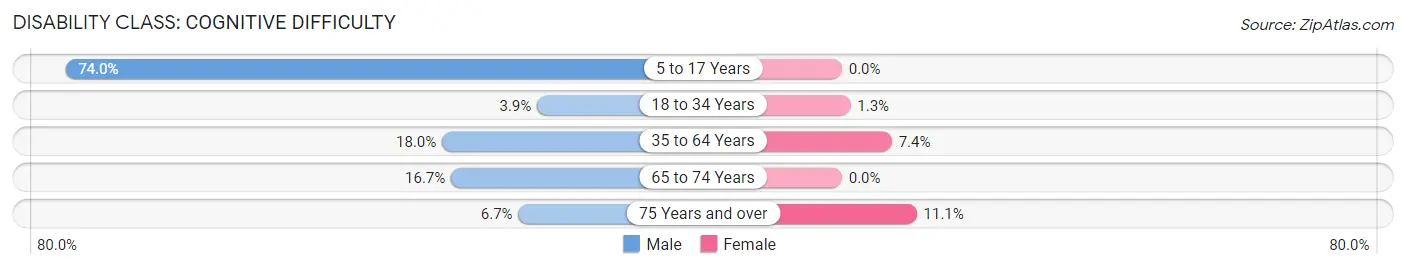
| Age Bracket | Male | Female |
| 5 to 17 Years | 54 (74.0%) | 0 (0.0%) |
| 18 to 34 Years | 3 (3.9%) | 1 (1.3%) |
| 35 to 64 Years | 9 (18.0%) | 4 (7.4%) |
| 65 to 74 Years | 2 (16.7%) | 0 (0.0%) |
| 75 Years and over | 2 (6.7%) | 2 (11.1%) |
Disability Class: Ambulatory Difficulty
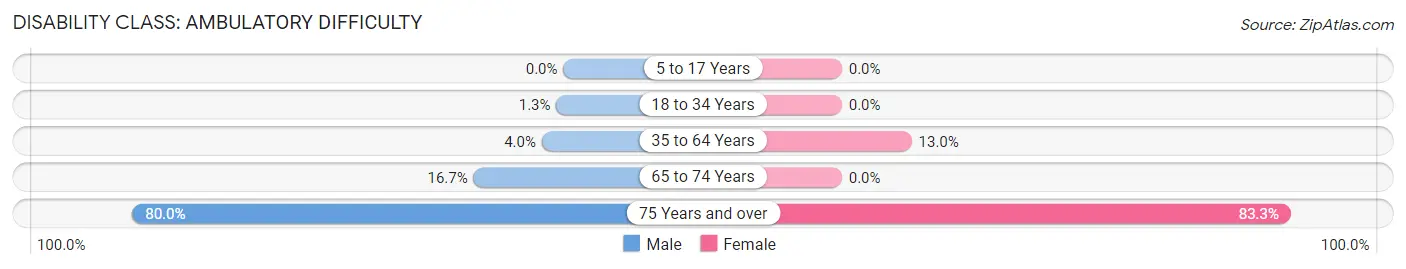
| Age Bracket | Male | Female |
| 5 to 17 Years | 0 (0.0%) | 0 (0.0%) |
| 18 to 34 Years | 1 (1.3%) | 0 (0.0%) |
| 35 to 64 Years | 2 (4.0%) | 7 (13.0%) |
| 65 to 74 Years | 2 (16.7%) | 0 (0.0%) |
| 75 Years and over | 24 (80.0%) | 15 (83.3%) |
Disability Class: Self-Care Difficulty
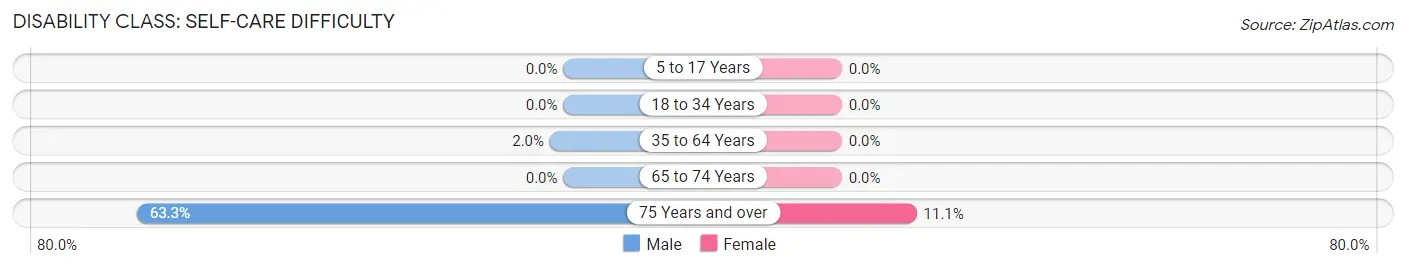
| Age Bracket | Male | Female |
| 5 to 17 Years | 0 (0.0%) | 0 (0.0%) |
| 18 to 34 Years | 0 (0.0%) | 0 (0.0%) |
| 35 to 64 Years | 1 (2.0%) | 0 (0.0%) |
| 65 to 74 Years | 0 (0.0%) | 0 (0.0%) |
| 75 Years and over | 19 (63.3%) | 2 (11.1%) |
Technology Access in Agra
Computing Device Access in Agra
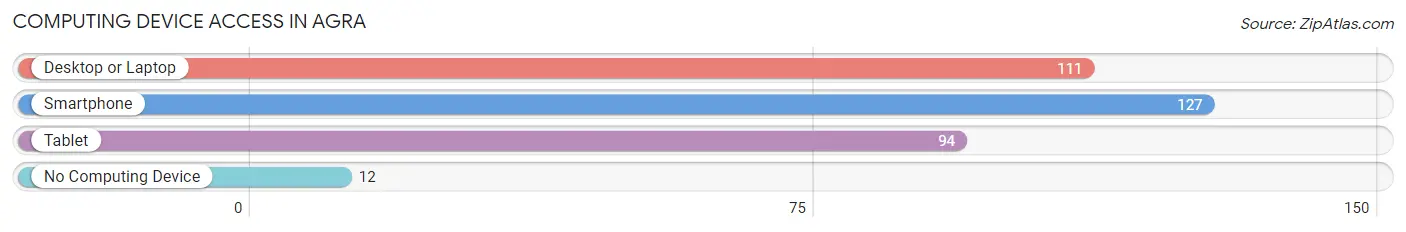
| Device Type | # Households | % Households |
| Desktop or Laptop | 111 | 71.6% |
| Smartphone | 127 | 81.9% |
| Tablet | 94 | 60.7% |
| No Computing Device | 12 | 7.7% |
| Total | 155 | 100.0% |
Internet Access in Agra
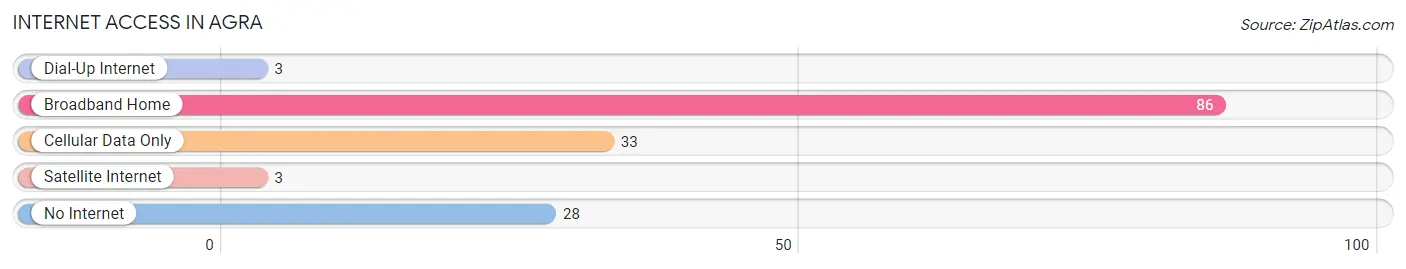
| Internet Type | # Households | % Households |
| Dial-Up Internet | 3 | 1.9% |
| Broadband Home | 86 | 55.5% |
| Cellular Data Only | 33 | 21.3% |
| Satellite Internet | 3 | 1.9% |
| No Internet | 28 | 18.1% |
| Total | 155 | 100.0% |
Agra Summary
Agra, Oklahoma is a small town located in Lincoln County, Oklahoma. It is situated on the banks of the Cimarron River, approximately 30 miles northwest of Oklahoma City. The town was founded in 1891 and was named after the city of Agra in India. As of the 2010 census, the population of Agra was 545.
History
Agra was founded in 1891 by the Choctaw Nation. The town was named after the city of Agra in India, which was the capital of the Mughal Empire from 1556 to 1658. The town was originally located in the former Indian Territory, and was part of the Choctaw Nation.
Agra was a stop on the Atchison, Topeka and Santa Fe Railway, which was built in 1891. The town was also a stop on the Oklahoma Central Railway, which was built in 1901.
Agra was incorporated in 1901. The town was home to a number of businesses, including a bank, a hotel, a livery stable, a blacksmith shop, a general store, and a cotton gin.
Geography
Agra is located in Lincoln County, Oklahoma, approximately 30 miles northwest of Oklahoma City. The town is situated on the banks of the Cimarron River. The town has a total area of 0.6 square miles, all of which is land.
Economy
Agra’s economy is largely based on agriculture. The town is home to a number of farms, which produce a variety of crops, including wheat, corn, soybeans, and cotton. The town is also home to a number of businesses, including a bank, a hotel, a livery stable, a blacksmith shop, a general store, and a cotton gin.
Demographics
As of the 2010 census, the population of Agra was 545. The town has a total area of 0.6 square miles, all of which is land. The median household income in Agra is $31,250, and the median family income is $37,500. The town has a poverty rate of 22.3%. The racial makeup of Agra is 95.3% White, 0.7% African American, 0.2% Native American, 0.2% Asian, 0.2% from other races, and 3.4% from two or more races.
Agra is served by the Agra Public Schools, which includes Agra Elementary School, Agra Middle School, and Agra High School. The town is also home to a number of churches, including the First Baptist Church, the First United Methodist Church, and the Church of Christ.
Agra is a small town with a rich history and a strong agricultural economy. The town is home to a number of businesses, churches, and schools, and is a great place to live and work.
Common Questions
What is Per Capita Income in Agra?
Per Capita income in Agra is $24,049.
What is the Median Family Income in Agra?
Median Family Income in Agra is $98,438.
What is the Median Household income in Agra?
Median Household Income in Agra is $60,208.
What is Income or Wage Gap in Agra?
Income or Wage Gap in Agra is 32.7%.
Women in Agra earn 67.3 cents for every dollar earned by a man.
What is Inequality or Gini Index in Agra?
Inequality or Gini Index in Agra is 0.46.
What is the Total Population of Agra?
Total Population of Agra is 594.
What is the Total Male Population of Agra?
Total Male Population of Agra is 251.
What is the Total Female Population of Agra?
Total Female Population of Agra is 343.
What is the Ratio of Males per 100 Females in Agra?
There are 73.18 Males per 100 Females in Agra.
What is the Ratio of Females per 100 Males in Agra?
There are 136.65 Females per 100 Males in Agra.
What is the Median Population Age in Agra?
Median Population Age in Agra is 24.5 Years.
What is the Average Family Size in Agra
Average Family Size in Agra is 4.5 People.
What is the Average Household Size in Agra
Average Household Size in Agra is 3.8 People.
How Large is the Labor Force in Agra?
There are 200 People in the Labor Forcein in Agra.
What is the Percentage of People in the Labor Force in Agra?
58.3% of People are in the Labor Force in Agra.
What is the Unemployment Rate in Agra?
Unemployment Rate in Agra is 1.5%.