Canton, OK Map & Demographics
Canton Map
Canton Overview
$23,316
PER CAPITA INCOME
$65,375
AVG FAMILY INCOME
$59,297
AVG HOUSEHOLD INCOME
49.5%
WAGE / INCOME GAP [ % ]
50.5¢/ $1
WAGE / INCOME GAP [ $ ]
0.33
INEQUALITY / GINI INDEX
520
TOTAL POPULATION
226
MALE POPULATION
294
FEMALE POPULATION
76.87
MALES / 100 FEMALES
130.09
FEMALES / 100 MALES
26.0
MEDIAN AGE
3.9
AVG FAMILY SIZE
2.9
AVG HOUSEHOLD SIZE
184
LABOR FORCE [ PEOPLE ]
52.0%
PERCENT IN LABOR FORCE
18.5%
UNEMPLOYMENT RATE
Canton Zip Codes
Canton Area Codes
Income in Canton
Income Overview in Canton
Per Capita Income in Canton is $23,316, while median incomes of families and households are $65,375 and $59,297 respectively.
| Characteristic | Number | Measure |
| Per Capita Income | 520 | $23,316 |
| Median Family Income | 115 | $65,375 |
| Mean Family Income | 115 | $80,342 |
| Median Household Income | 179 | $59,297 |
| Mean Household Income | 179 | $67,340 |
| Income Deficit | 115 | $0 |
| Wage / Income Gap (%) | 520 | 49.53% |
| Wage / Income Gap ($) | 520 | 50.47¢ per $1 |
| Gini / Inequality Index | 520 | 0.33 |
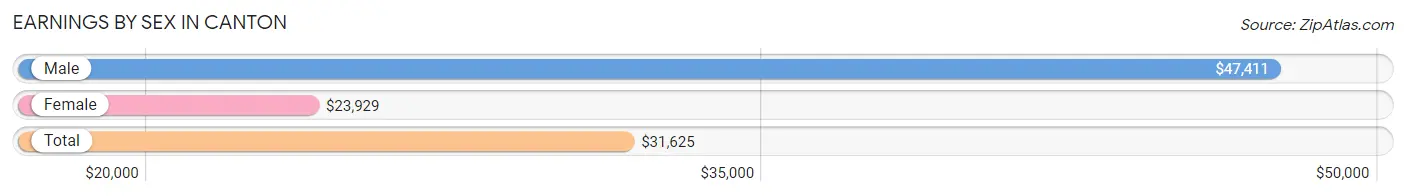
Earnings by Sex in Canton
Average Earnings in Canton are $31,625, $47,411 for men and $23,929 for women, a difference of 49.5%.
| Sex | Number | Average Earnings |
| Male | 105 (50.7%) | $47,411 |
| Female | 102 (49.3%) | $23,929 |
| Total | 207 (100.0%) | $31,625 |
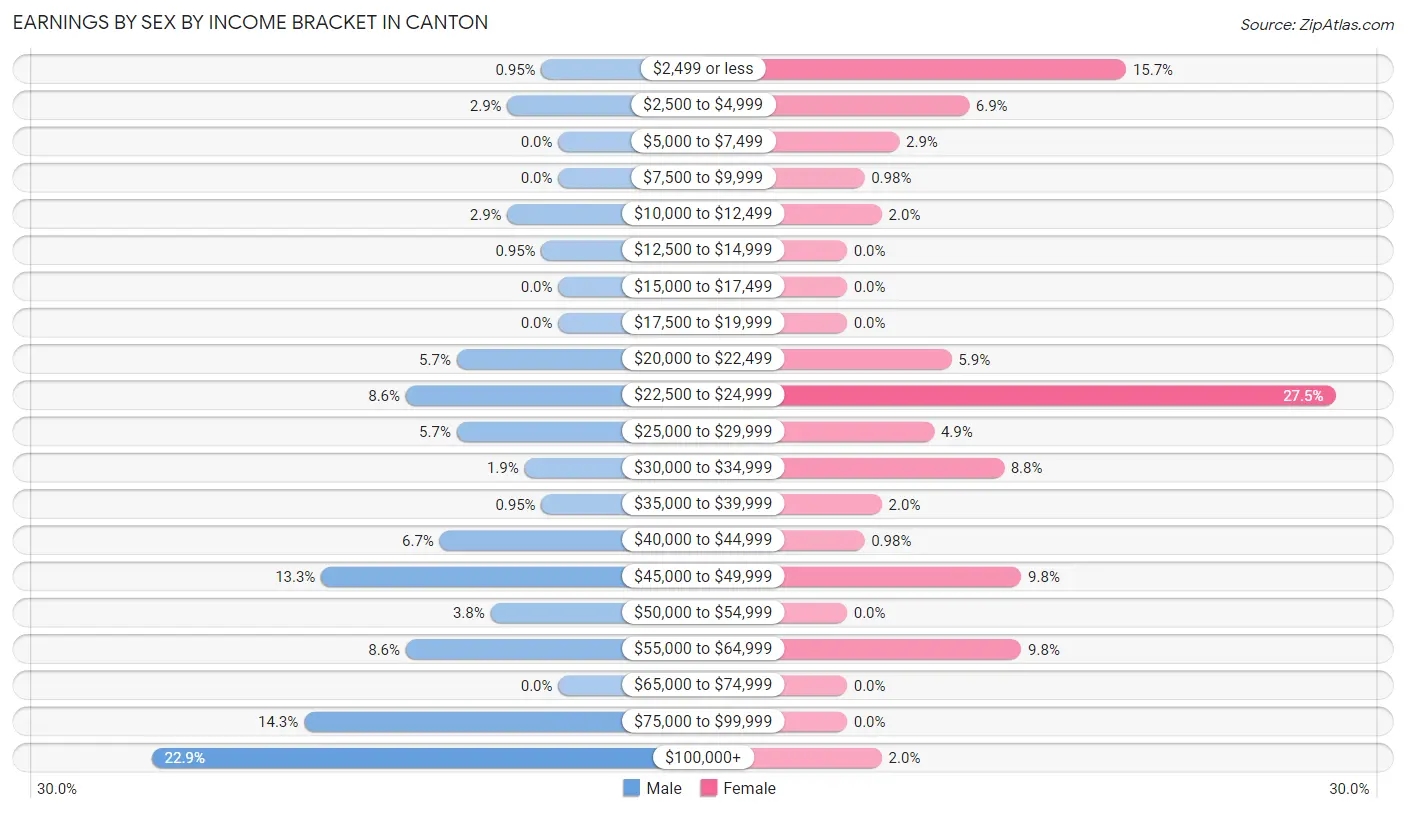
Earnings by Sex by Income Bracket in Canton
The most common earnings brackets in Canton are $100,000+ for men (24 | 22.9%) and $22,500 to $24,999 for women (28 | 27.5%).
| Income | Male | Female |
| $2,499 or less | 1 (0.9%) | 16 (15.7%) |
| $2,500 to $4,999 | 3 (2.9%) | 7 (6.9%) |
| $5,000 to $7,499 | 0 (0.0%) | 3 (2.9%) |
| $7,500 to $9,999 | 0 (0.0%) | 1 (1.0%) |
| $10,000 to $12,499 | 3 (2.9%) | 2 (2.0%) |
| $12,500 to $14,999 | 1 (0.9%) | 0 (0.0%) |
| $15,000 to $17,499 | 0 (0.0%) | 0 (0.0%) |
| $17,500 to $19,999 | 0 (0.0%) | 0 (0.0%) |
| $20,000 to $22,499 | 6 (5.7%) | 6 (5.9%) |
| $22,500 to $24,999 | 9 (8.6%) | 28 (27.5%) |
| $25,000 to $29,999 | 6 (5.7%) | 5 (4.9%) |
| $30,000 to $34,999 | 2 (1.9%) | 9 (8.8%) |
| $35,000 to $39,999 | 1 (0.9%) | 2 (2.0%) |
| $40,000 to $44,999 | 7 (6.7%) | 1 (1.0%) |
| $45,000 to $49,999 | 14 (13.3%) | 10 (9.8%) |
| $50,000 to $54,999 | 4 (3.8%) | 0 (0.0%) |
| $55,000 to $64,999 | 9 (8.6%) | 10 (9.8%) |
| $65,000 to $74,999 | 0 (0.0%) | 0 (0.0%) |
| $75,000 to $99,999 | 15 (14.3%) | 0 (0.0%) |
| $100,000+ | 24 (22.9%) | 2 (2.0%) |
| Total | 105 (100.0%) | 102 (100.0%) |
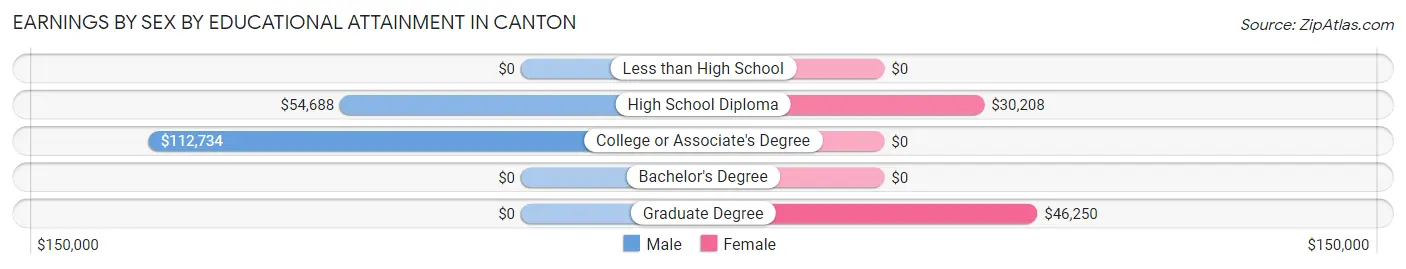
Earnings by Sex by Educational Attainment in Canton
Average earnings in Canton are $58,889 for men and $30,625 for women, a difference of 48.0%. Men with an educational attainment of college or associate's degree enjoy the highest average annual earnings of $112,734, while those with high school diploma education earn the least with $54,688. Women with an educational attainment of graduate degree earn the most with the average annual earnings of $46,250, while those with high school diploma education have the smallest earnings of $30,208.
| Educational Attainment | Male Income | Female Income |
| Less than High School | - | - |
| High School Diploma | $54,688 | $30,208 |
| College or Associate's Degree | $112,734 | $0 |
| Bachelor's Degree | - | - |
| Graduate Degree | - | - |
| Total | $58,889 | $30,625 |
Family Income in Canton
Family Income Brackets in Canton
According to the Canton family income data, there are 42 families falling into the $50,000 to $74,999 income range, which is the most common income bracket and makes up 36.5% of all families.
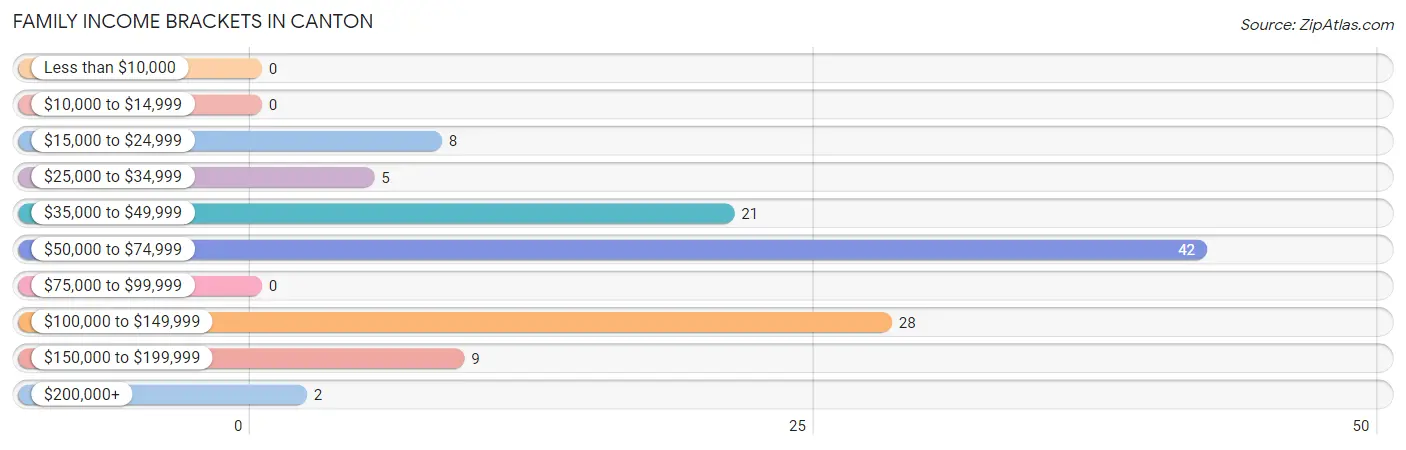
| Income Bracket | # Families | % Families |
| Less than $10,000 | 0 | 0.0% |
| $10,000 to $14,999 | 0 | 0.0% |
| $15,000 to $24,999 | 8 | 7.0% |
| $25,000 to $34,999 | 5 | 4.3% |
| $35,000 to $49,999 | 21 | 18.3% |
| $50,000 to $74,999 | 42 | 36.5% |
| $75,000 to $99,999 | 0 | 0.0% |
| $100,000 to $149,999 | 28 | 24.3% |
| $150,000 to $199,999 | 9 | 7.8% |
| $200,000+ | 2 | 1.7% |
Family Income by Famaliy Size in Canton
5-person families (25 | 21.7%) account for the highest median family income in Canton with $113,047 per family, while 2-person families (45 | 39.1%) have the highest median income of $31,094 per family member.
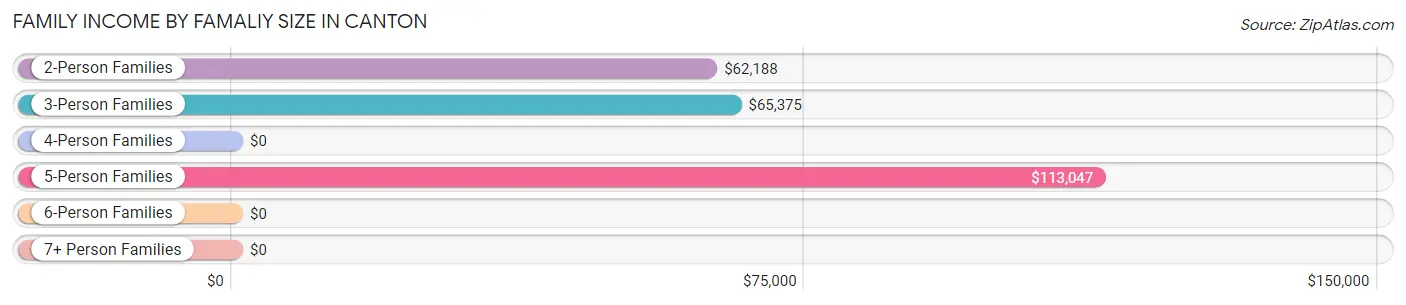
| Income Bracket | # Families | Median Income |
| 2-Person Families | 45 (39.1%) | $62,188 |
| 3-Person Families | 21 (18.3%) | $65,375 |
| 4-Person Families | 4 (3.5%) | $0 |
| 5-Person Families | 25 (21.7%) | $113,047 |
| 6-Person Families | 14 (12.2%) | $0 |
| 7+ Person Families | 6 (5.2%) | $0 |
| Total | 115 (100.0%) | $65,375 |
Family Income by Number of Earners in Canton
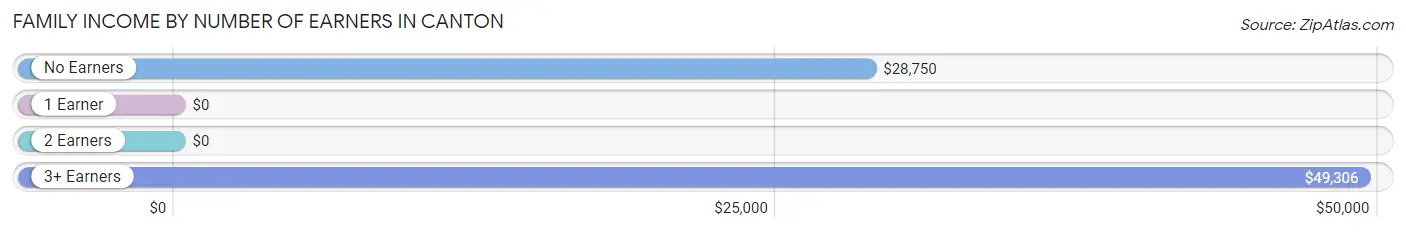
| Number of Earners | # Families | Median Income |
| No Earners | 15 (13.0%) | $28,750 |
| 1 Earner | 49 (42.6%) | $0 |
| 2 Earners | 34 (29.6%) | $0 |
| 3+ Earners | 17 (14.8%) | $49,306 |
| Total | 115 (100.0%) | $65,375 |
Household Income in Canton
Household Income Brackets in Canton
With 66 households falling in the category, the $50,000 to $74,999 income range is the most frequent in Canton, accounting for 36.9% of all households. In contrast, only 2 households (1.1%) fall into the $200,000+ income bracket, making it the least populous group.
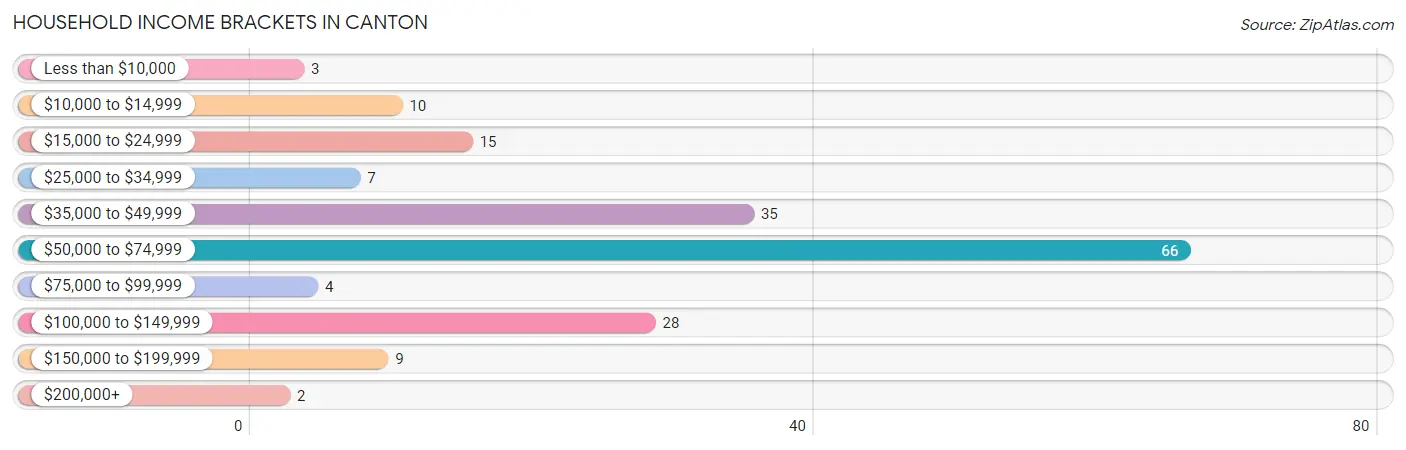
| Income Bracket | # Households | % Households |
| Less than $10,000 | 3 | 1.7% |
| $10,000 to $14,999 | 10 | 5.6% |
| $15,000 to $24,999 | 15 | 8.4% |
| $25,000 to $34,999 | 7 | 3.9% |
| $35,000 to $49,999 | 35 | 19.6% |
| $50,000 to $74,999 | 66 | 36.9% |
| $75,000 to $99,999 | 4 | 2.2% |
| $100,000 to $149,999 | 28 | 15.6% |
| $150,000 to $199,999 | 9 | 5.0% |
| $200,000+ | 2 | 1.1% |
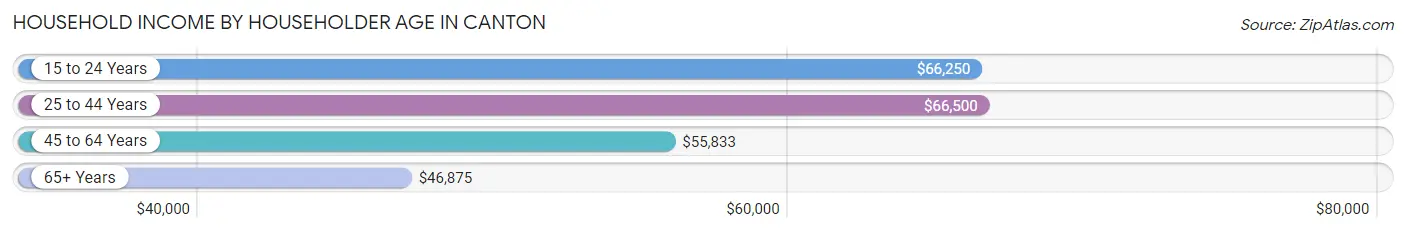
Household Income by Householder Age in Canton
The median household income in Canton is $59,297, with the highest median household income of $66,500 found in the 25 to 44 years age bracket for the primary householder. A total of 62 households (34.6%) fall into this category. Meanwhile, the 65+ years age bracket for the primary householder has the lowest median household income of $46,875, with 63 households (35.2%) in this group.
| Income Bracket | # Households | Median Income |
| 15 to 24 Years | 8 (4.5%) | $66,250 |
| 25 to 44 Years | 62 (34.6%) | $66,500 |
| 45 to 64 Years | 46 (25.7%) | $55,833 |
| 65+ Years | 63 (35.2%) | $46,875 |
| Total | 179 (100.0%) | $59,297 |
Poverty in Canton
Income Below Poverty by Sex and Age in Canton
With 3.5% poverty level for males and 3.7% for females among the residents of Canton, 18 to 24 year old males and 15 year old females are the most vulnerable to poverty, with 3 males (15.0%) and 3 females (30.0%) in their respective age groups living below the poverty level.
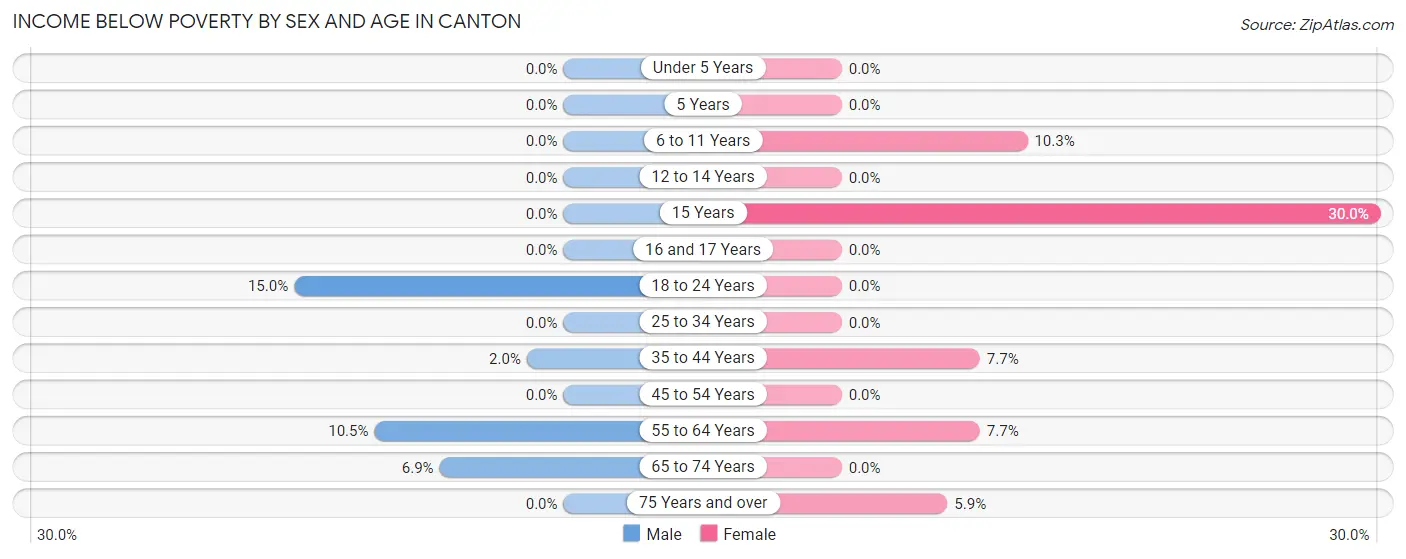
| Age Bracket | Male | Female |
| Under 5 Years | 0 (0.0%) | 0 (0.0%) |
| 5 Years | 0 (0.0%) | 0 (0.0%) |
| 6 to 11 Years | 0 (0.0%) | 3 (10.3%) |
| 12 to 14 Years | 0 (0.0%) | 0 (0.0%) |
| 15 Years | 0 (0.0%) | 3 (30.0%) |
| 16 and 17 Years | 0 (0.0%) | 0 (0.0%) |
| 18 to 24 Years | 3 (15.0%) | 0 (0.0%) |
| 25 to 34 Years | 0 (0.0%) | 0 (0.0%) |
| 35 to 44 Years | 1 (2.0%) | 2 (7.7%) |
| 45 to 54 Years | 0 (0.0%) | 0 (0.0%) |
| 55 to 64 Years | 2 (10.5%) | 2 (7.7%) |
| 65 to 74 Years | 2 (6.9%) | 0 (0.0%) |
| 75 Years and over | 0 (0.0%) | 1 (5.9%) |
| Total | 8 (3.5%) | 11 (3.7%) |
Income Above Poverty by Sex and Age in Canton
According to the poverty statistics in Canton, males aged under 5 years and females aged under 5 years are the age groups that are most secure financially, with 100.0% of males and 100.0% of females in these age groups living above the poverty line.
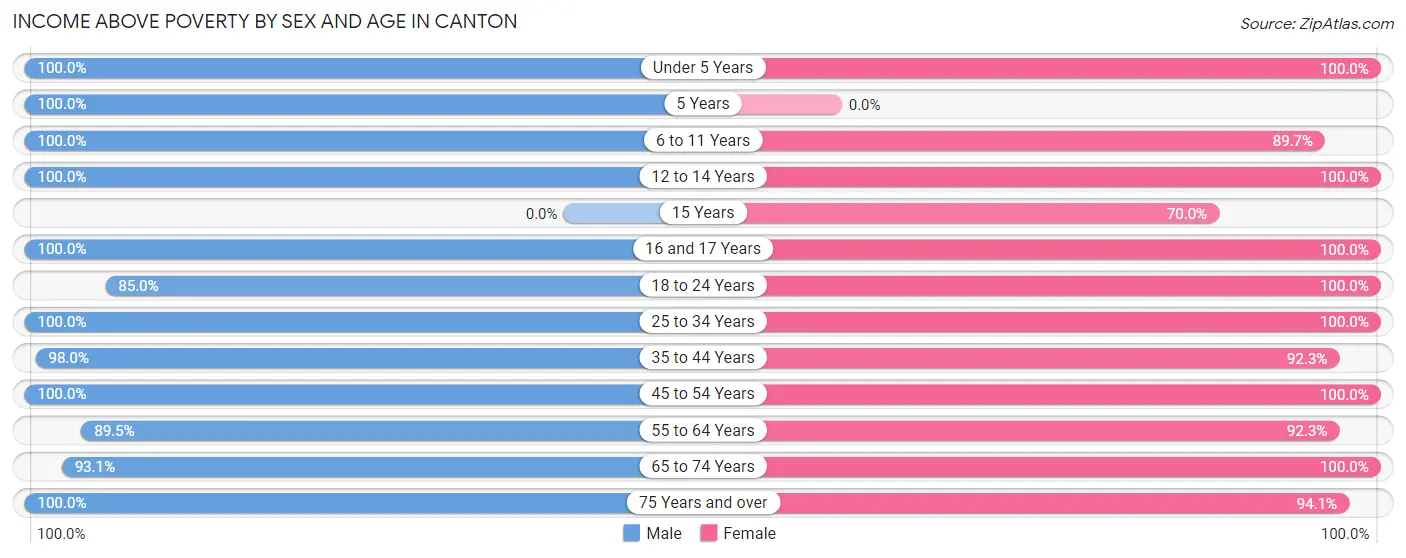
| Age Bracket | Male | Female |
| Under 5 Years | 17 (100.0%) | 34 (100.0%) |
| 5 Years | 2 (100.0%) | 0 (0.0%) |
| 6 to 11 Years | 43 (100.0%) | 26 (89.7%) |
| 12 to 14 Years | 13 (100.0%) | 18 (100.0%) |
| 15 Years | 0 (0.0%) | 7 (70.0%) |
| 16 and 17 Years | 2 (100.0%) | 37 (100.0%) |
| 18 to 24 Years | 17 (85.0%) | 29 (100.0%) |
| 25 to 34 Years | 14 (100.0%) | 30 (100.0%) |
| 35 to 44 Years | 48 (98.0%) | 24 (92.3%) |
| 45 to 54 Years | 9 (100.0%) | 8 (100.0%) |
| 55 to 64 Years | 17 (89.5%) | 24 (92.3%) |
| 65 to 74 Years | 27 (93.1%) | 30 (100.0%) |
| 75 Years and over | 9 (100.0%) | 16 (94.1%) |
| Total | 218 (96.5%) | 283 (96.3%) |
Income Below Poverty Among Married-Couple Families in Canton
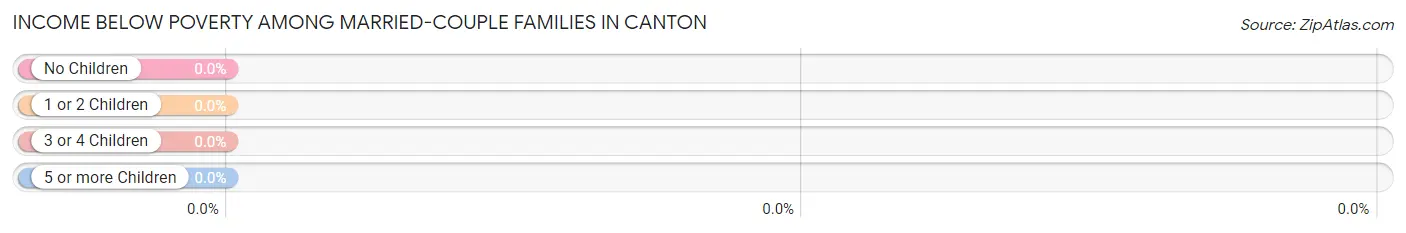
| Children | Above Poverty | Below Poverty |
| No Children | 28 (100.0%) | 0 (0.0%) |
| 1 or 2 Children | 12 (100.0%) | 0 (0.0%) |
| 3 or 4 Children | 39 (100.0%) | 0 (0.0%) |
| 5 or more Children | 0 (0.0%) | 0 (0.0%) |
| Total | 79 (100.0%) | 0 (0.0%) |
Income Below Poverty Among Single-Parent Households in Canton
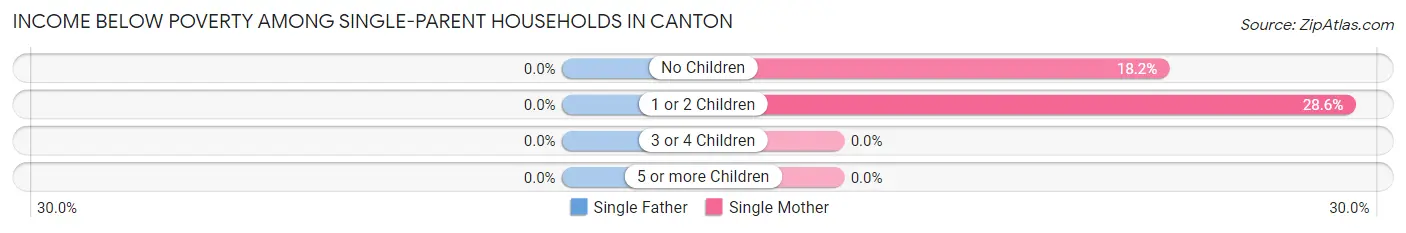
| Children | Single Father | Single Mother |
| No Children | 0 (0.0%) | 2 (18.2%) |
| 1 or 2 Children | 0 (0.0%) | 2 (28.6%) |
| 3 or 4 Children | 0 (0.0%) | 0 (0.0%) |
| 5 or more Children | 0 (0.0%) | 0 (0.0%) |
| Total | 0 (0.0%) | 4 (16.7%) |
Income Below Poverty Among Married-Couple vs Single-Parent Households in Canton
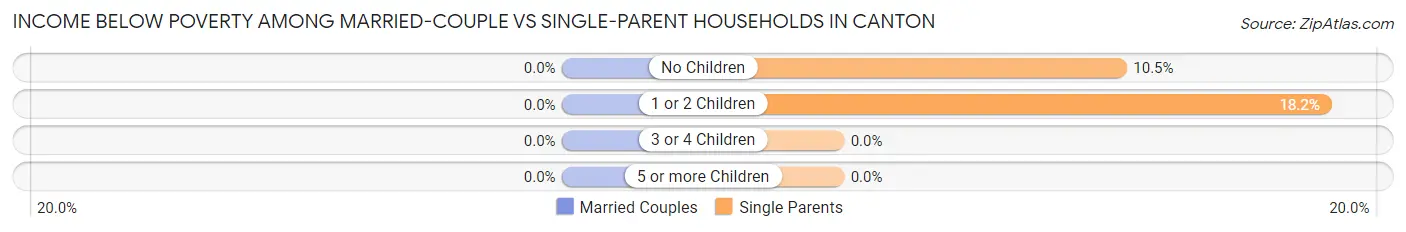
| Children | Married-Couple Families | Single-Parent Households |
| No Children | 0 (0.0%) | 2 (10.5%) |
| 1 or 2 Children | 0 (0.0%) | 2 (18.2%) |
| 3 or 4 Children | 0 (0.0%) | 0 (0.0%) |
| 5 or more Children | 0 (0.0%) | 0 (0.0%) |
| Total | 0 (0.0%) | 4 (11.1%) |
Race in Canton
The most populous races in Canton are White / Caucasian (399 | 76.7%), Native / Alaskan (70 | 13.5%), and Hispanic or Latino (56 | 10.8%).
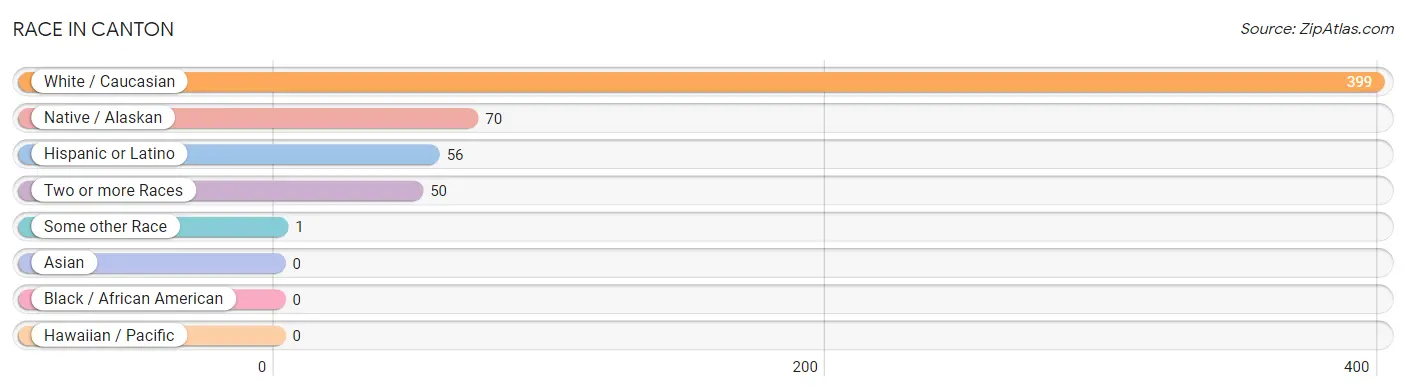
| Race | # Population | % Population |
| Asian | 0 | 0.0% |
| Black / African American | 0 | 0.0% |
| Hawaiian / Pacific | 0 | 0.0% |
| Hispanic or Latino | 56 | 10.8% |
| Native / Alaskan | 70 | 13.5% |
| White / Caucasian | 399 | 76.7% |
| Two or more Races | 50 | 9.6% |
| Some other Race | 1 | 0.2% |
| Total | 520 | 100.0% |
Ancestry in Canton
The most populous ancestries reported in Canton are Mexican (55 | 10.6%), German (48 | 9.2%), Scottish (43 | 8.3%), Creek (34 | 6.5%), and Irish (22 | 4.2%), together accounting for 38.9% of all Canton residents.
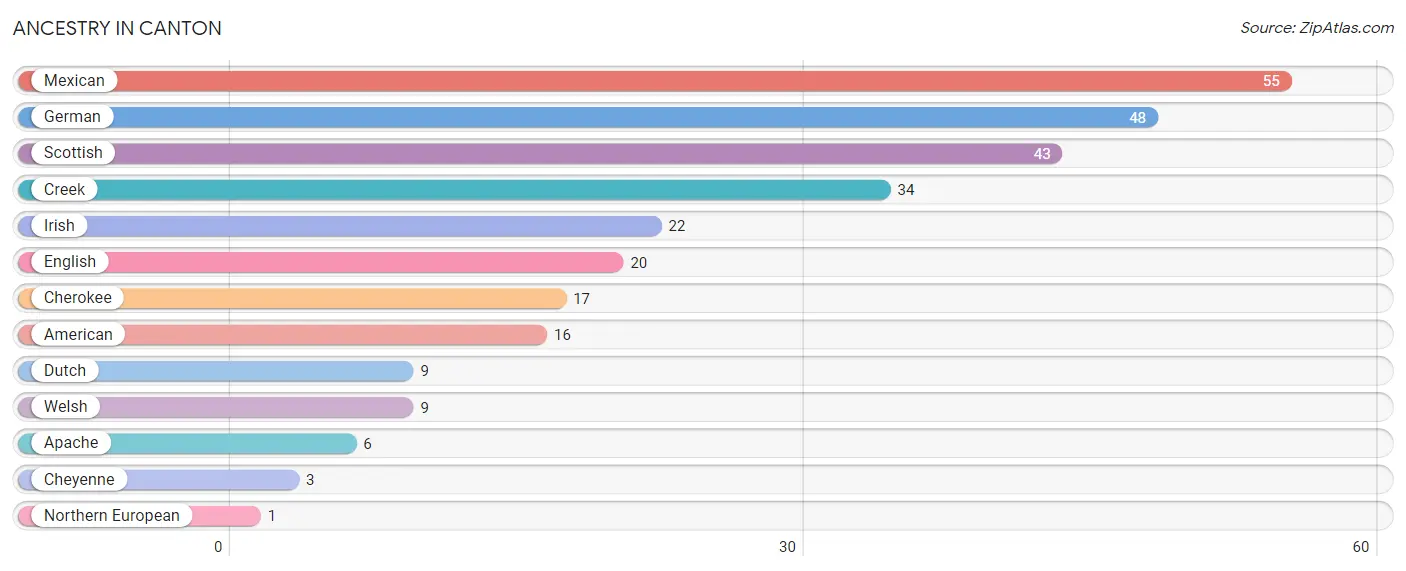
| Ancestry | # Population | % Population |
| American | 16 | 3.1% |
| Apache | 6 | 1.1% |
| Cherokee | 17 | 3.3% |
| Cheyenne | 3 | 0.6% |
| Creek | 34 | 6.5% |
| Dutch | 9 | 1.7% |
| English | 20 | 3.8% |
| German | 48 | 9.2% |
| Irish | 22 | 4.2% |
| Mexican | 55 | 10.6% |
| Northern European | 1 | 0.2% |
| Scottish | 43 | 8.3% |
| Welsh | 9 | 1.7% | View All 13 Rows |
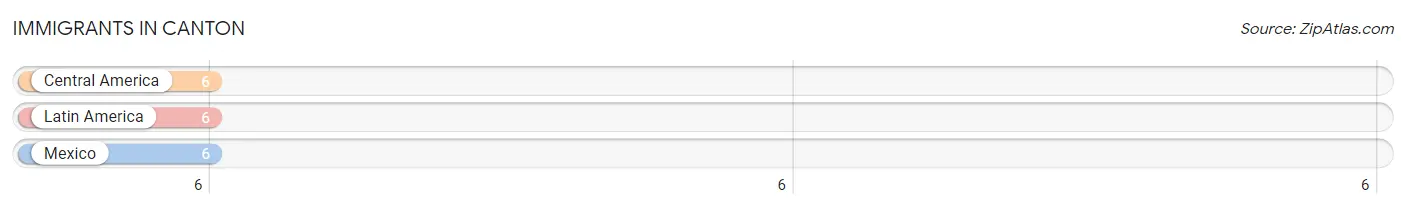
Immigrants in Canton
The most numerous immigrant groups reported in Canton came from Central America (6 | 1.1%), Latin America (6 | 1.1%), and Mexico (6 | 1.1%), together accounting for 3.5% of all Canton residents.
| Immigration Origin | # Population | % Population |
| Central America | 6 | 1.1% |
| Latin America | 6 | 1.1% |
| Mexico | 6 | 1.1% | View All 3 Rows |
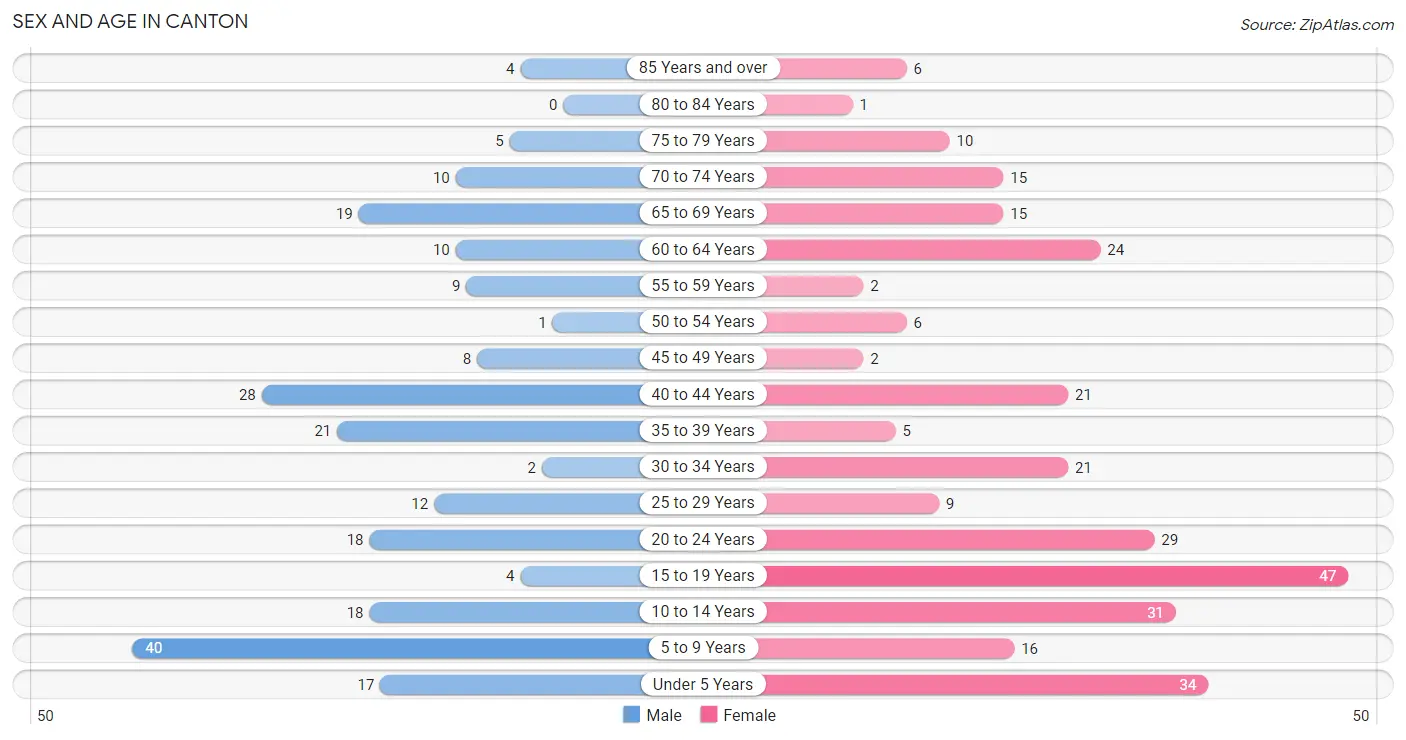
Sex and Age in Canton
Sex and Age in Canton
The most populous age groups in Canton are 5 to 9 Years (40 | 17.7%) for men and 15 to 19 Years (47 | 16.0%) for women.
| Age Bracket | Male | Female |
| Under 5 Years | 17 (7.5%) | 34 (11.6%) |
| 5 to 9 Years | 40 (17.7%) | 16 (5.4%) |
| 10 to 14 Years | 18 (8.0%) | 31 (10.5%) |
| 15 to 19 Years | 4 (1.8%) | 47 (16.0%) |
| 20 to 24 Years | 18 (8.0%) | 29 (9.9%) |
| 25 to 29 Years | 12 (5.3%) | 9 (3.1%) |
| 30 to 34 Years | 2 (0.9%) | 21 (7.1%) |
| 35 to 39 Years | 21 (9.3%) | 5 (1.7%) |
| 40 to 44 Years | 28 (12.4%) | 21 (7.1%) |
| 45 to 49 Years | 8 (3.5%) | 2 (0.7%) |
| 50 to 54 Years | 1 (0.4%) | 6 (2.0%) |
| 55 to 59 Years | 9 (4.0%) | 2 (0.7%) |
| 60 to 64 Years | 10 (4.4%) | 24 (8.2%) |
| 65 to 69 Years | 19 (8.4%) | 15 (5.1%) |
| 70 to 74 Years | 10 (4.4%) | 15 (5.1%) |
| 75 to 79 Years | 5 (2.2%) | 10 (3.4%) |
| 80 to 84 Years | 0 (0.0%) | 1 (0.3%) |
| 85 Years and over | 4 (1.8%) | 6 (2.0%) |
| Total | 226 (100.0%) | 294 (100.0%) |
Families and Households in Canton
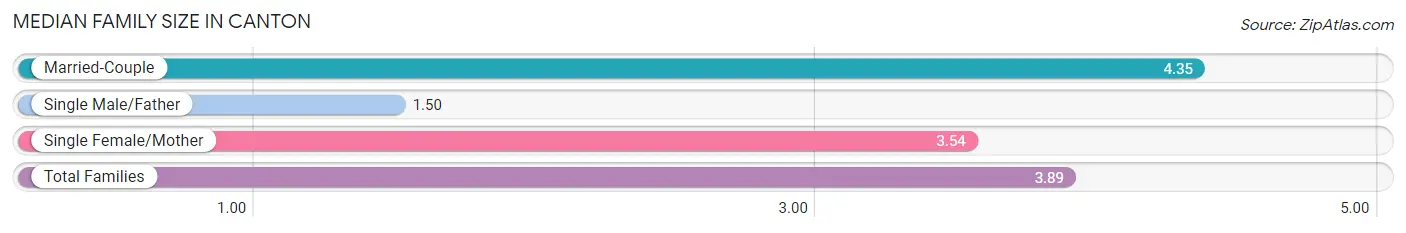
Median Family Size in Canton
The median family size in Canton is 3.89 persons per family, with married-couple families (79 | 68.7%) accounting for the largest median family size of 4.35 persons per family. On the other hand, single male/father families (12 | 10.4%) represent the smallest median family size with 1.50 persons per family.
| Family Type | # Families | Family Size |
| Married-Couple | 79 (68.7%) | 4.35 |
| Single Male/Father | 12 (10.4%) | 1.50 |
| Single Female/Mother | 24 (20.9%) | 3.54 |
| Total Families | 115 (100.0%) | 3.89 |
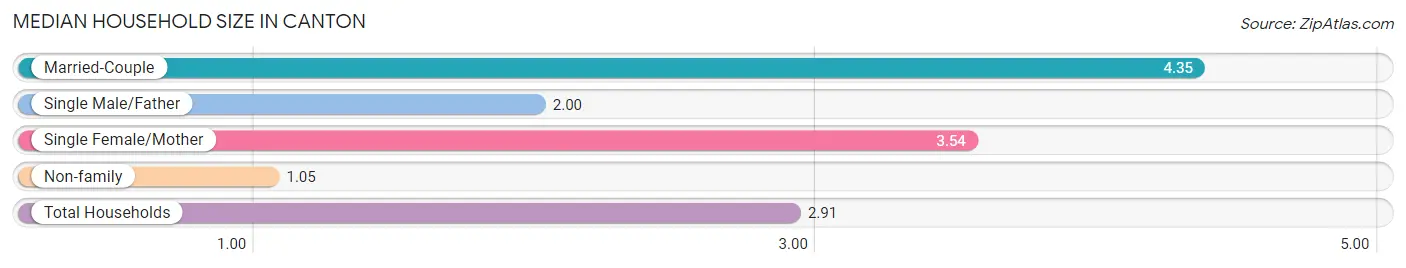
Median Household Size in Canton
The median household size in Canton is 2.91 persons per household, with married-couple households (79 | 44.1%) accounting for the largest median household size of 4.35 persons per household. non-family households (64 | 35.7%) represent the smallest median household size with 1.05 persons per household.
| Household Type | # Households | Household Size |
| Married-Couple | 79 (44.1%) | 4.35 |
| Single Male/Father | 12 (6.7%) | 2.00 |
| Single Female/Mother | 24 (13.4%) | 3.54 |
| Non-family | 64 (35.7%) | 1.05 |
| Total Households | 179 (100.0%) | 2.91 |
Household Size by Marriage Status in Canton
Out of a total of 179 households in Canton, 115 (64.2%) are family households, while 64 (35.7%) are nonfamily households. The most numerous type of family households are 2-person households, comprising 42, and the most common type of nonfamily households are 1-person households, comprising 62.
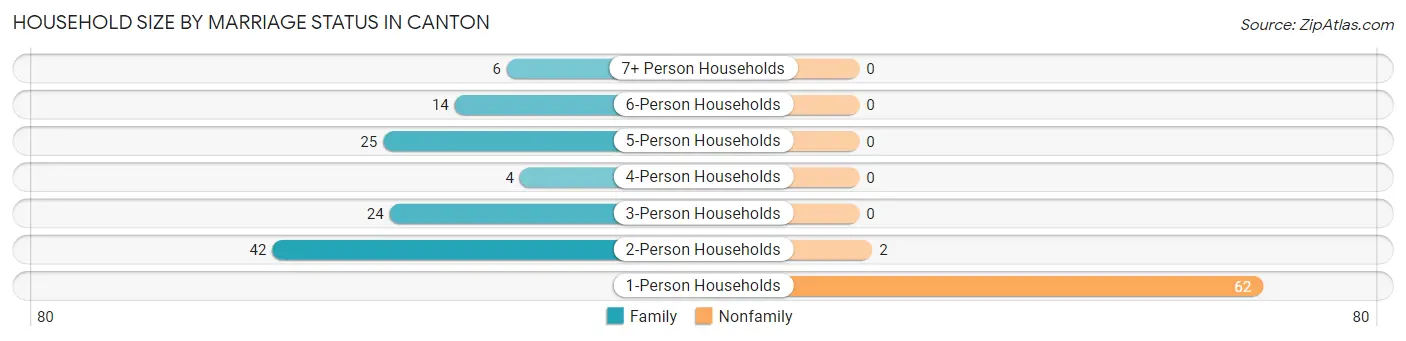
| Household Size | Family Households | Nonfamily Households |
| 1-Person Households | - | 62 (34.6%) |
| 2-Person Households | 42 (23.5%) | 2 (1.1%) |
| 3-Person Households | 24 (13.4%) | 0 (0.0%) |
| 4-Person Households | 4 (2.2%) | 0 (0.0%) |
| 5-Person Households | 25 (14.0%) | 0 (0.0%) |
| 6-Person Households | 14 (7.8%) | 0 (0.0%) |
| 7+ Person Households | 6 (3.4%) | 0 (0.0%) |
| Total | 115 (64.2%) | 64 (35.7%) |
Female Fertility in Canton
Fertility by Age in Canton
Average fertility rate in Canton is 179.0 births per 1,000 women. Women in the age bracket of 20 to 34 years have the highest fertility rate with 407.0 births per 1,000 women. Women in the age bracket of 20 to 34 years acount for 100.0% of all women with births.
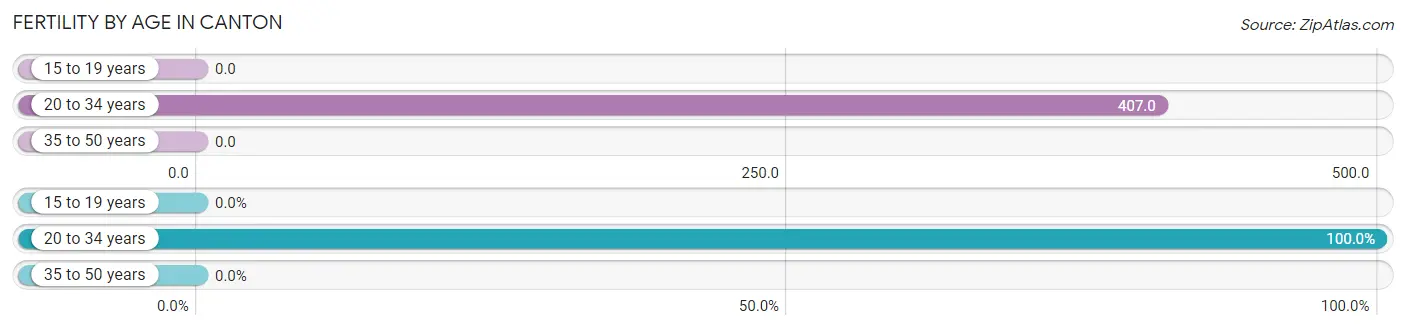
| Age Bracket | Women with Births | Births / 1,000 Women |
| 15 to 19 years | 0 (0.0%) | 0.0 |
| 20 to 34 years | 24 (100.0%) | 407.0 |
| 35 to 50 years | 0 (0.0%) | 0.0 |
| Total | 24 (100.0%) | 179.0 |
Fertility by Age by Marriage Status in Canton
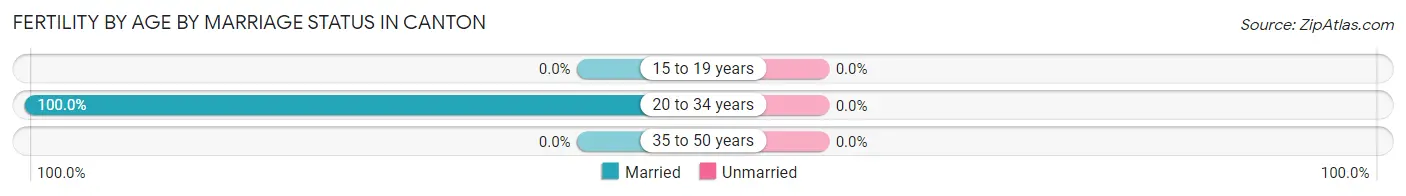
| Age Bracket | Married | Unmarried |
| 15 to 19 years | 0 (0.0%) | 0 (0.0%) |
| 20 to 34 years | 24 (100.0%) | 0 (0.0%) |
| 35 to 50 years | 0 (0.0%) | 0 (0.0%) |
| Total | 24 (100.0%) | 0 (0.0%) |
Fertility by Education in Canton
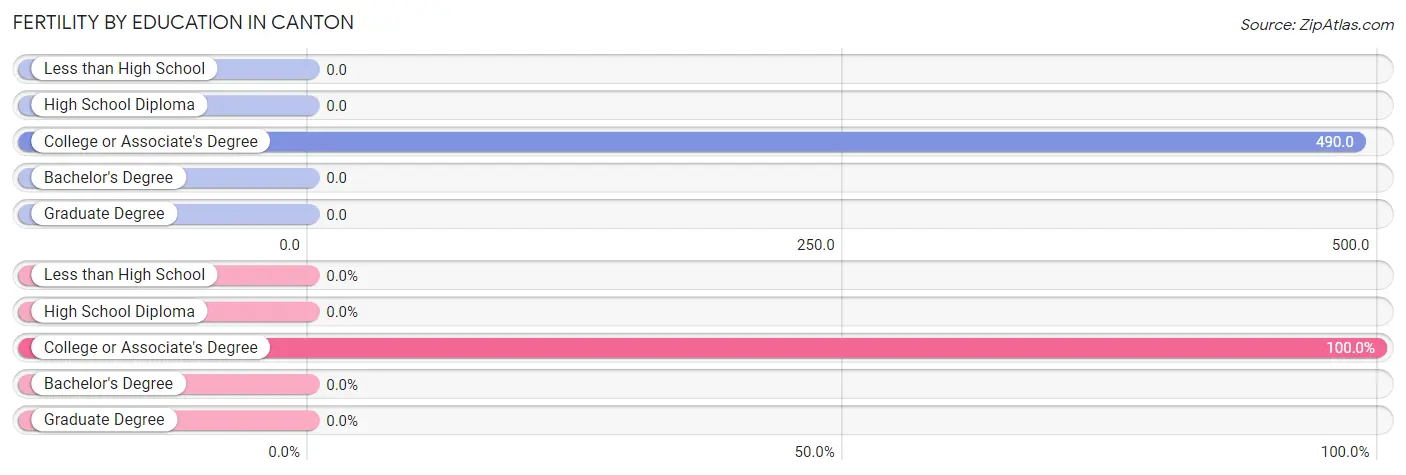
| Educational Attainment | Women with Births | Births / 1,000 Women |
| Less than High School | 0 (0.0%) | 0.0 |
| High School Diploma | 0 (0.0%) | 0.0 |
| College or Associate's Degree | 24 (100.0%) | 490.0 |
| Bachelor's Degree | 0 (0.0%) | 0.0 |
| Graduate Degree | 0 (0.0%) | 0.0 |
| Total | 24 (100.0%) | 179.0 |
Fertility by Education by Marriage Status in Canton
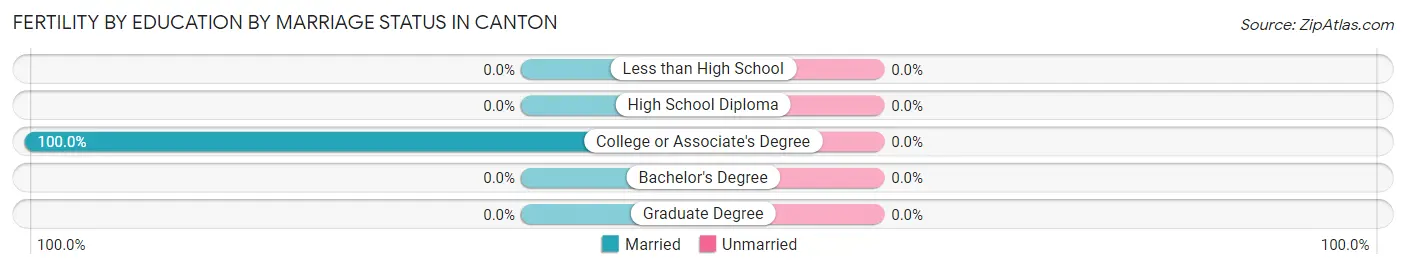
| Educational Attainment | Married | Unmarried |
| Less than High School | 0 (0.0%) | 0 (0.0%) |
| High School Diploma | 0 (0.0%) | 0 (0.0%) |
| College or Associate's Degree | 24 (100.0%) | 0 (0.0%) |
| Bachelor's Degree | 0 (0.0%) | 0 (0.0%) |
| Graduate Degree | 0 (0.0%) | 0 (0.0%) |
| Total | 24 (100.0%) | 0 (0.0%) |
Employment Characteristics in Canton
Employment by Class of Employer in Canton
Among the 143 employed individuals in Canton, private company employees (106 | 74.1%), local government employees (12 | 8.4%), and self-employed (not incorporated) (8 | 5.6%) make up the most common classes of employment.
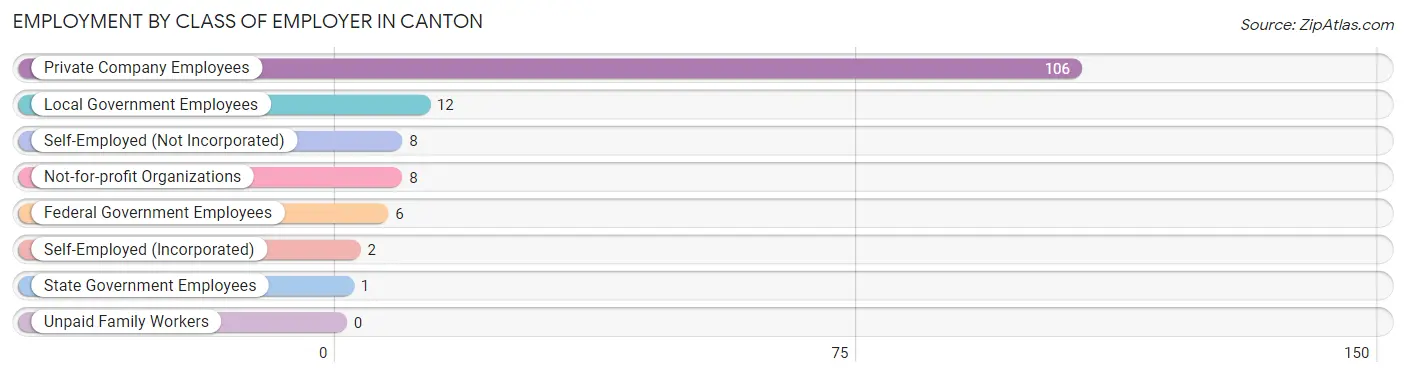
| Employer Class | # Employees | % Employees |
| Private Company Employees | 106 | 74.1% |
| Self-Employed (Incorporated) | 2 | 1.4% |
| Self-Employed (Not Incorporated) | 8 | 5.6% |
| Not-for-profit Organizations | 8 | 5.6% |
| Local Government Employees | 12 | 8.4% |
| State Government Employees | 1 | 0.7% |
| Federal Government Employees | 6 | 4.2% |
| Unpaid Family Workers | 0 | 0.0% |
| Total | 143 | 100.0% |
Employment Status by Age in Canton
According to the labor force statistics for Canton, out of the total population over 16 years of age (354), 52.0% or 184 individuals are in the labor force, with 18.5% or 34 of them unemployed. The age group with the highest labor force participation rate is 45 to 54 years, with 100.0% or 17 individuals in the labor force. Within the labor force, the 20 to 24 years age range has the highest percentage of unemployed individuals, with 52.2% or 24 of them being unemployed.
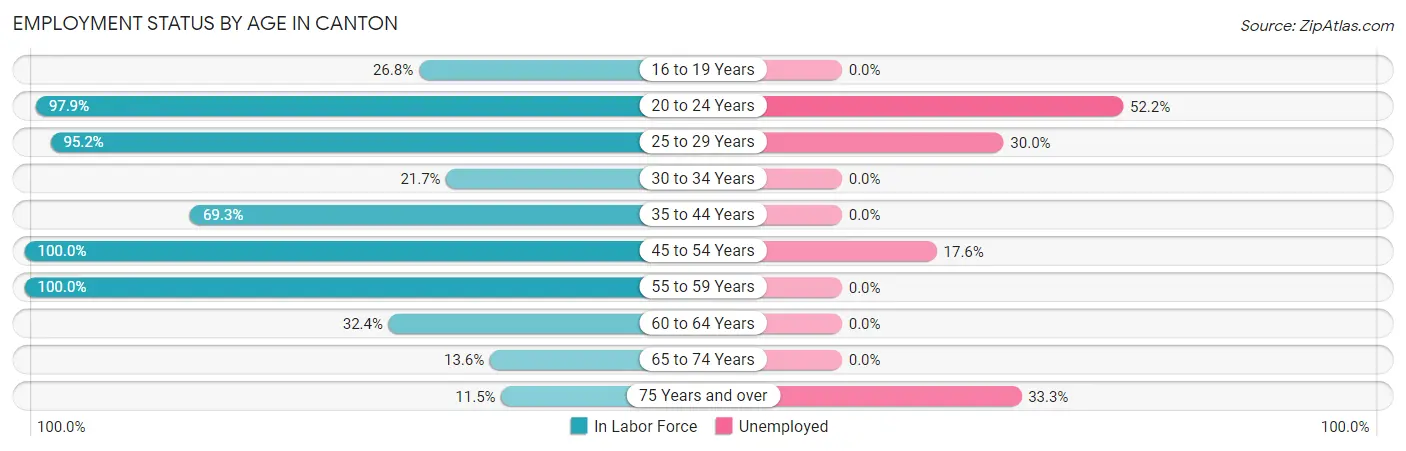
| Age Bracket | In Labor Force | Unemployed |
| 16 to 19 Years | 11 (26.8%) | 0 (0.0%) |
| 20 to 24 Years | 46 (97.9%) | 24 (52.2%) |
| 25 to 29 Years | 20 (95.2%) | 6 (30.0%) |
| 30 to 34 Years | 5 (21.7%) | 0 (0.0%) |
| 35 to 44 Years | 52 (69.3%) | 0 (0.0%) |
| 45 to 54 Years | 17 (100.0%) | 3 (17.6%) |
| 55 to 59 Years | 11 (100.0%) | 0 (0.0%) |
| 60 to 64 Years | 11 (32.4%) | 0 (0.0%) |
| 65 to 74 Years | 8 (13.6%) | 0 (0.0%) |
| 75 Years and over | 3 (11.5%) | 1 (33.3%) |
| Total | 184 (52.0%) | 34 (18.5%) |
Employment Status by Educational Attainment in Canton
According to labor force statistics for Canton, 64.1% of individuals (116) out of the total population between 25 and 64 years of age (181) are in the labor force, with 7.8% or 9 of them being unemployed. The group with the highest labor force participation rate are those with the educational attainment of bachelor's degree or higher, with 69.6% or 16 individuals in the labor force. Within the labor force, individuals with college / associate degree education have the highest percentage of unemployment, with 12.2% or 5 of them being unemployed.
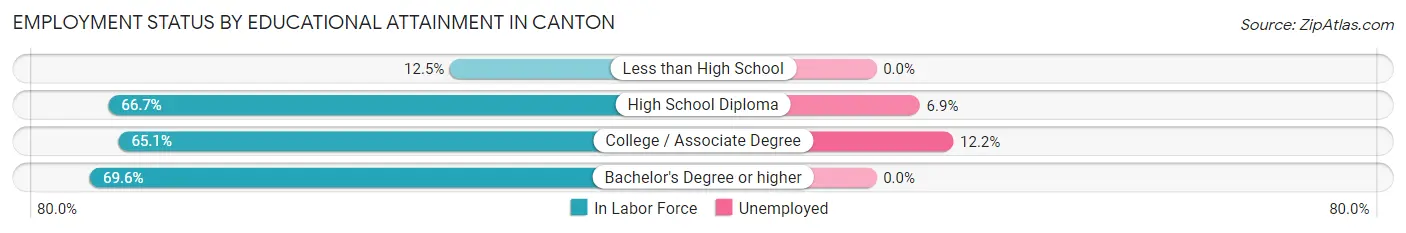
| Educational Attainment | In Labor Force | Unemployed |
| Less than High School | 1 (12.5%) | 0 (0.0%) |
| High School Diploma | 58 (66.7%) | 6 (6.9%) |
| College / Associate Degree | 41 (65.1%) | 8 (12.2%) |
| Bachelor's Degree or higher | 16 (69.6%) | 0 (0.0%) |
| Total | 116 (64.1%) | 14 (7.8%) |
Employment Occupations by Sex in Canton
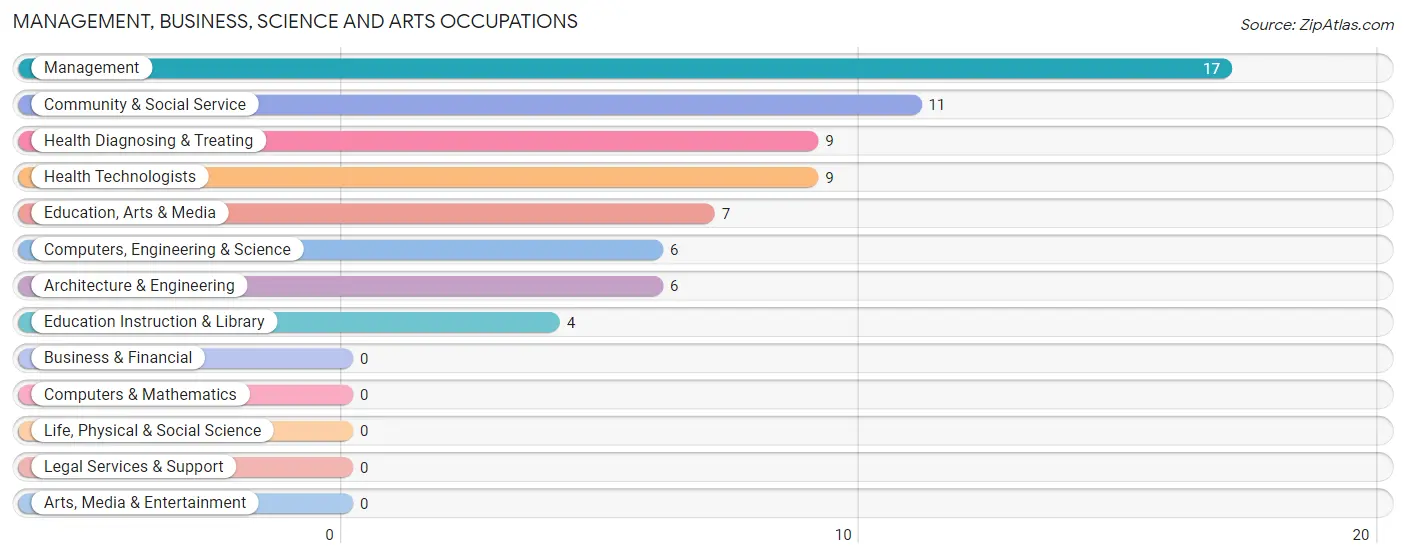
Management, Business, Science and Arts Occupations
The most common Management, Business, Science and Arts occupations in Canton are Management (17 | 11.3%), Community & Social Service (11 | 7.3%), Health Diagnosing & Treating (9 | 6.0%), Health Technologists (9 | 6.0%), and Education, Arts & Media (7 | 4.7%).
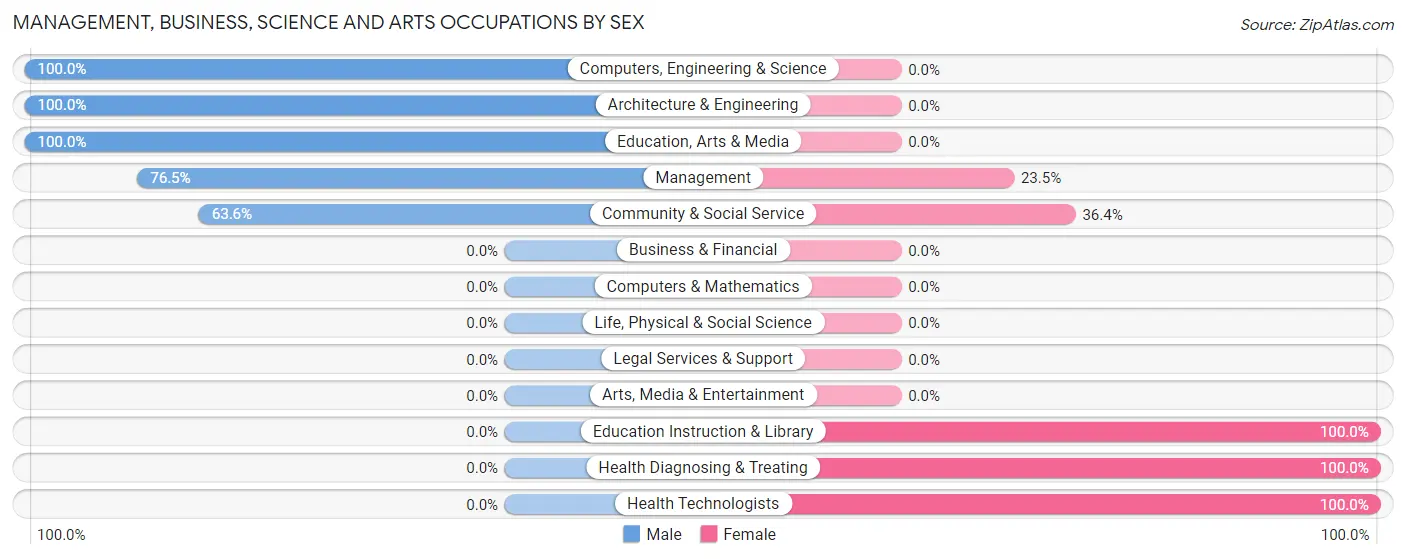
Management, Business, Science and Arts Occupations by Sex
Within the Management, Business, Science and Arts occupations in Canton, the most male-oriented occupations are Computers, Engineering & Science (100.0%), Architecture & Engineering (100.0%), and Education, Arts & Media (100.0%), while the most female-oriented occupations are Education Instruction & Library (100.0%), Health Diagnosing & Treating (100.0%), and Health Technologists (100.0%).
| Occupation | Male | Female |
| Management | 13 (76.5%) | 4 (23.5%) |
| Business & Financial | 0 (0.0%) | 0 (0.0%) |
| Computers, Engineering & Science | 6 (100.0%) | 0 (0.0%) |
| Computers & Mathematics | 0 (0.0%) | 0 (0.0%) |
| Architecture & Engineering | 6 (100.0%) | 0 (0.0%) |
| Life, Physical & Social Science | 0 (0.0%) | 0 (0.0%) |
| Community & Social Service | 7 (63.6%) | 4 (36.4%) |
| Education, Arts & Media | 7 (100.0%) | 0 (0.0%) |
| Legal Services & Support | 0 (0.0%) | 0 (0.0%) |
| Education Instruction & Library | 0 (0.0%) | 4 (100.0%) |
| Arts, Media & Entertainment | 0 (0.0%) | 0 (0.0%) |
| Health Diagnosing & Treating | 0 (0.0%) | 9 (100.0%) |
| Health Technologists | 0 (0.0%) | 9 (100.0%) |
| Total (Category) | 26 (60.5%) | 17 (39.5%) |
| Total (Overall) | 91 (60.7%) | 59 (39.3%) |
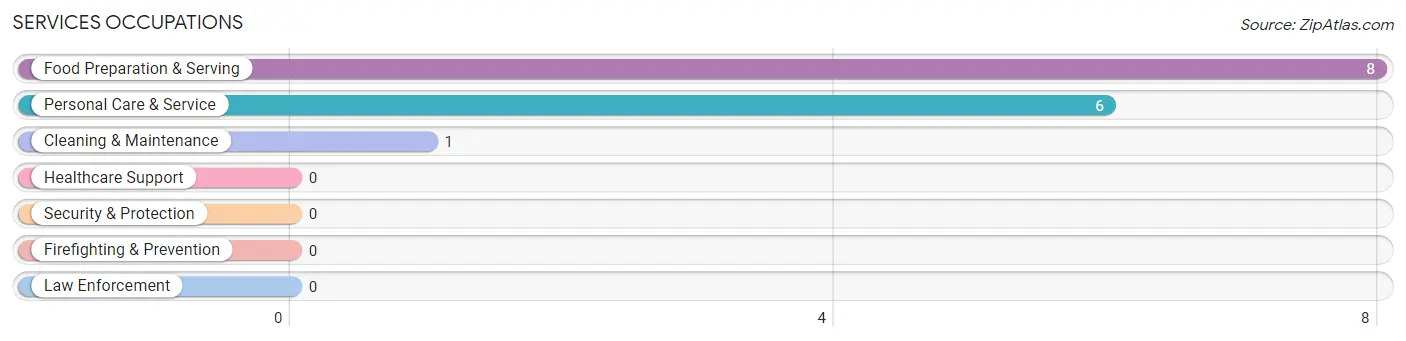
Services Occupations
The most common Services occupations in Canton are Food Preparation & Serving (8 | 5.3%), Personal Care & Service (6 | 4.0%), and Cleaning & Maintenance (1 | 0.7%).
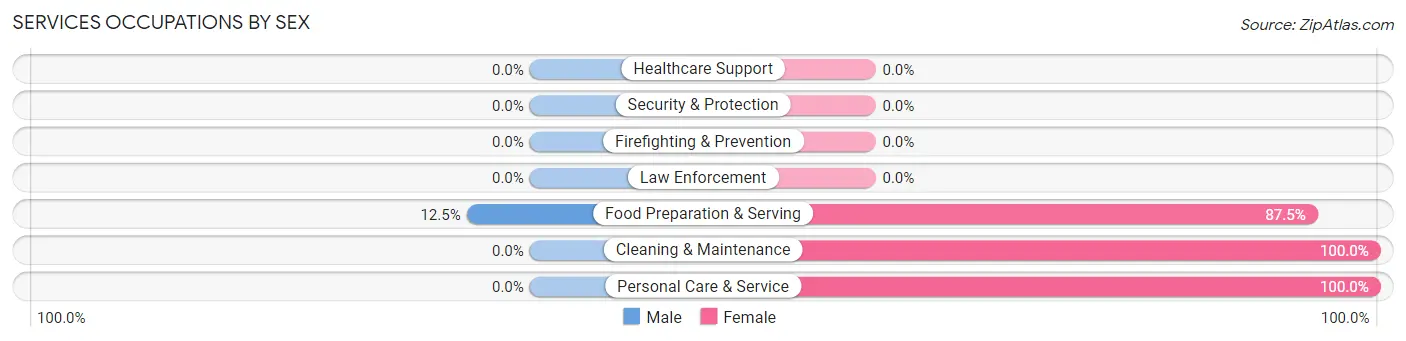
Services Occupations by Sex
| Occupation | Male | Female |
| Healthcare Support | 0 (0.0%) | 0 (0.0%) |
| Security & Protection | 0 (0.0%) | 0 (0.0%) |
| Firefighting & Prevention | 0 (0.0%) | 0 (0.0%) |
| Law Enforcement | 0 (0.0%) | 0 (0.0%) |
| Food Preparation & Serving | 1 (12.5%) | 7 (87.5%) |
| Cleaning & Maintenance | 0 (0.0%) | 1 (100.0%) |
| Personal Care & Service | 0 (0.0%) | 6 (100.0%) |
| Total (Category) | 1 (6.7%) | 14 (93.3%) |
| Total (Overall) | 91 (60.7%) | 59 (39.3%) |
Sales and Office Occupations
The most common Sales and Office occupations in Canton are Sales & Related (16 | 10.7%), and Office & Administration (16 | 10.7%).
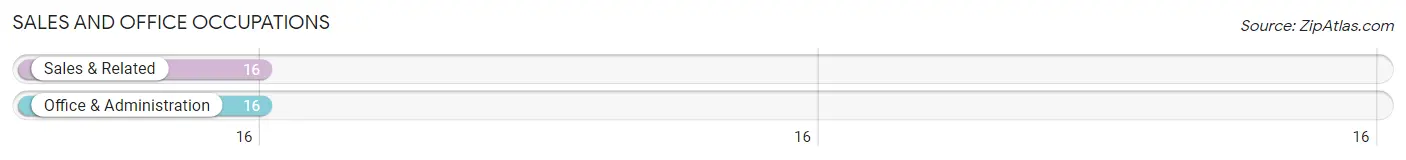
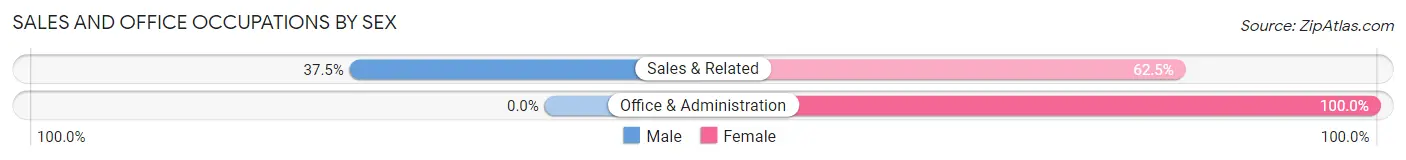
Sales and Office Occupations by Sex
| Occupation | Male | Female |
| Sales & Related | 6 (37.5%) | 10 (62.5%) |
| Office & Administration | 0 (0.0%) | 16 (100.0%) |
| Total (Category) | 6 (18.8%) | 26 (81.2%) |
| Total (Overall) | 91 (60.7%) | 59 (39.3%) |
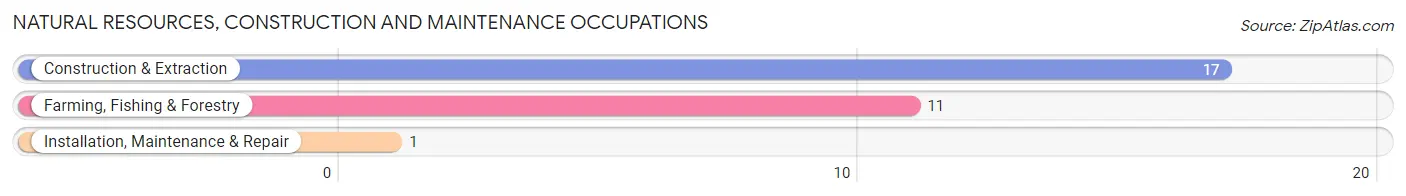
Natural Resources, Construction and Maintenance Occupations
The most common Natural Resources, Construction and Maintenance occupations in Canton are Construction & Extraction (17 | 11.3%), Farming, Fishing & Forestry (11 | 7.3%), and Installation, Maintenance & Repair (1 | 0.7%).
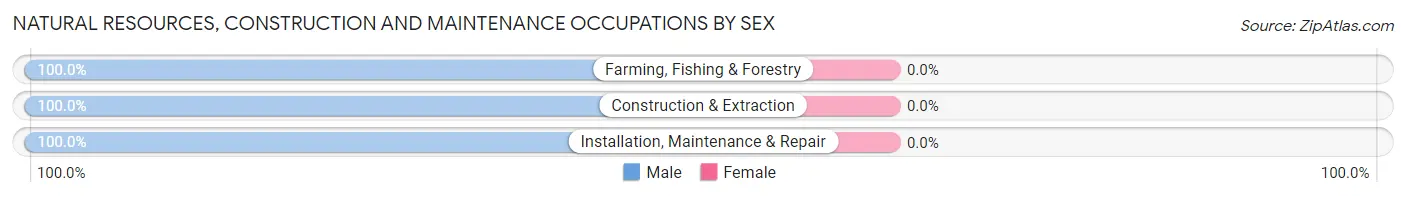
Natural Resources, Construction and Maintenance Occupations by Sex
| Occupation | Male | Female |
| Farming, Fishing & Forestry | 11 (100.0%) | 0 (0.0%) |
| Construction & Extraction | 17 (100.0%) | 0 (0.0%) |
| Installation, Maintenance & Repair | 1 (100.0%) | 0 (0.0%) |
| Total (Category) | 29 (100.0%) | 0 (0.0%) |
| Total (Overall) | 91 (60.7%) | 59 (39.3%) |
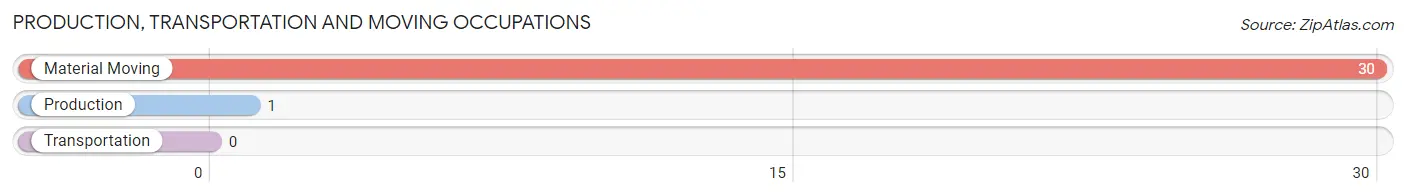
Production, Transportation and Moving Occupations
The most common Production, Transportation and Moving occupations in Canton are Material Moving (30 | 20.0%), and Production (1 | 0.7%).
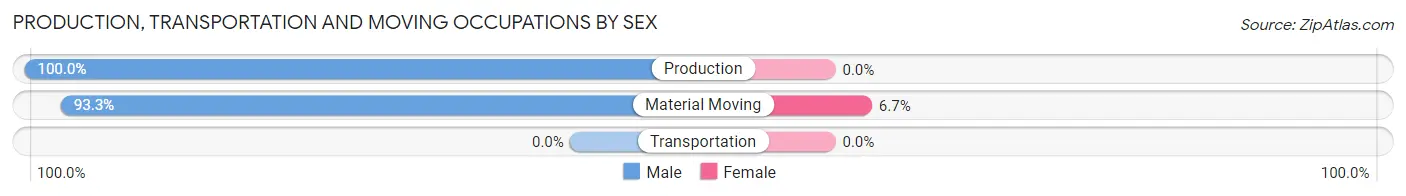
Production, Transportation and Moving Occupations by Sex
| Occupation | Male | Female |
| Production | 1 (100.0%) | 0 (0.0%) |
| Transportation | 0 (0.0%) | 0 (0.0%) |
| Material Moving | 28 (93.3%) | 2 (6.7%) |
| Total (Category) | 29 (93.5%) | 2 (6.5%) |
| Total (Overall) | 91 (60.7%) | 59 (39.3%) |
Employment Industries by Sex in Canton
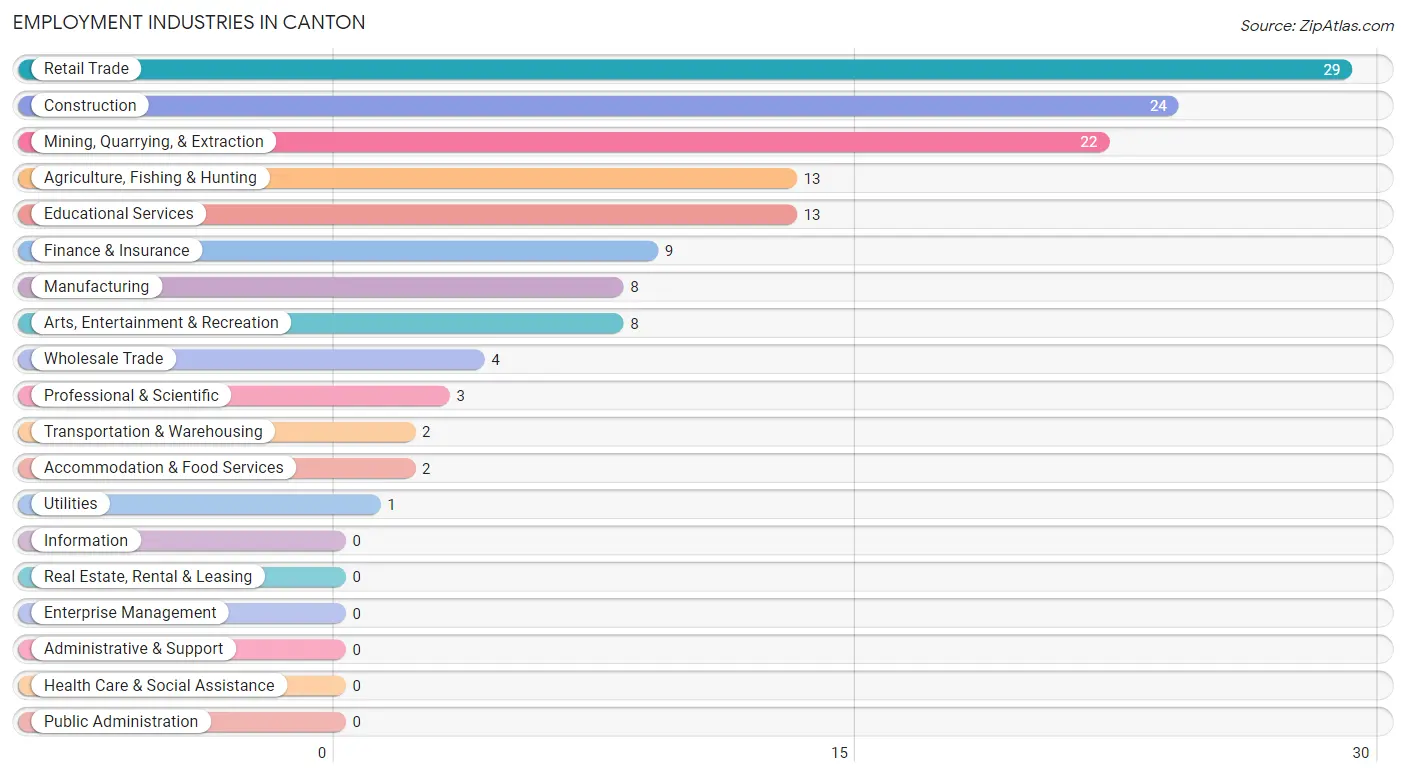
Employment Industries in Canton
The major employment industries in Canton include Retail Trade (29 | 19.3%), Construction (24 | 16.0%), Mining, Quarrying, & Extraction (22 | 14.7%), Agriculture, Fishing & Hunting (13 | 8.7%), and Educational Services (13 | 8.7%).
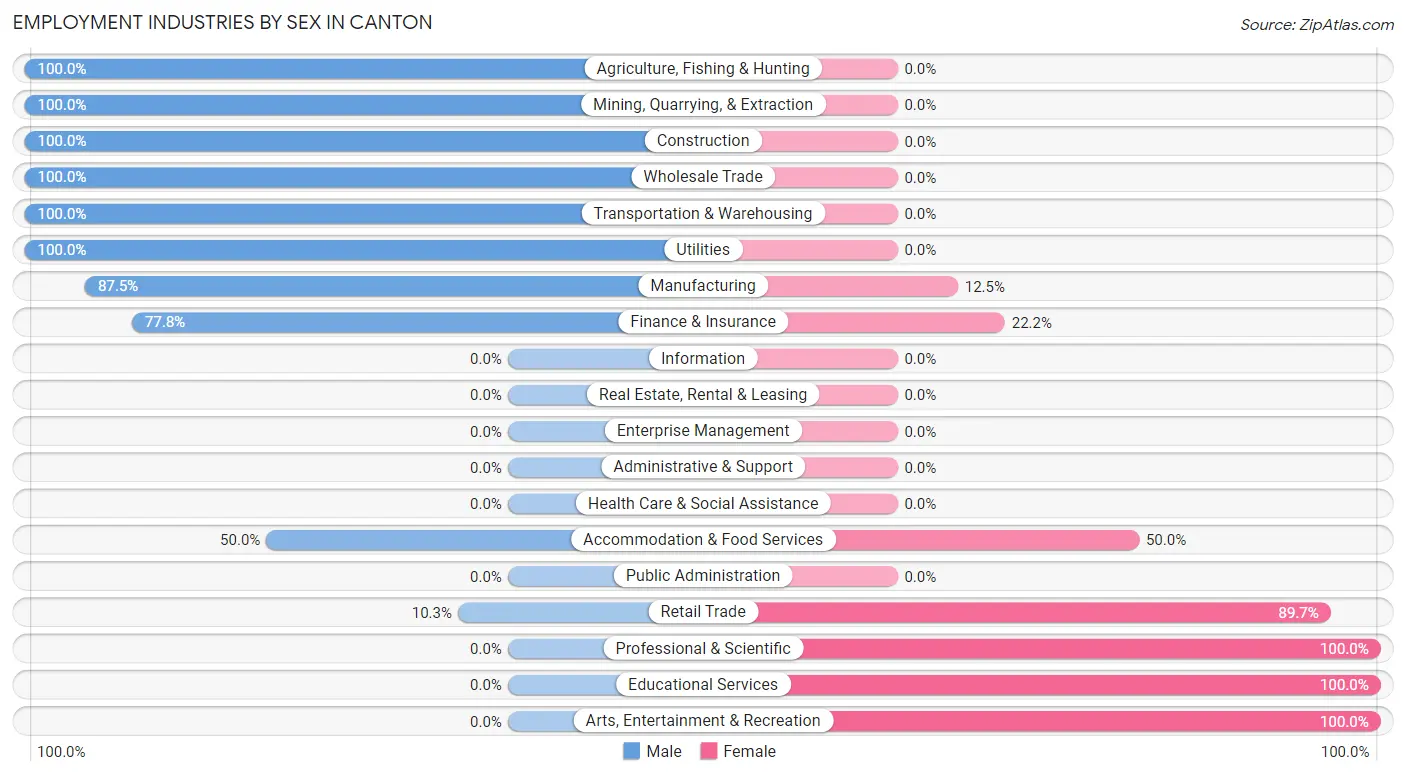
Employment Industries by Sex in Canton
The Canton industries that see more men than women are Agriculture, Fishing & Hunting (100.0%), Mining, Quarrying, & Extraction (100.0%), and Construction (100.0%), whereas the industries that tend to have a higher number of women are Professional & Scientific (100.0%), Educational Services (100.0%), and Arts, Entertainment & Recreation (100.0%).
| Industry | Male | Female |
| Agriculture, Fishing & Hunting | 13 (100.0%) | 0 (0.0%) |
| Mining, Quarrying, & Extraction | 22 (100.0%) | 0 (0.0%) |
| Construction | 24 (100.0%) | 0 (0.0%) |
| Manufacturing | 7 (87.5%) | 1 (12.5%) |
| Wholesale Trade | 4 (100.0%) | 0 (0.0%) |
| Retail Trade | 3 (10.3%) | 26 (89.7%) |
| Transportation & Warehousing | 2 (100.0%) | 0 (0.0%) |
| Utilities | 1 (100.0%) | 0 (0.0%) |
| Information | 0 (0.0%) | 0 (0.0%) |
| Finance & Insurance | 7 (77.8%) | 2 (22.2%) |
| Real Estate, Rental & Leasing | 0 (0.0%) | 0 (0.0%) |
| Professional & Scientific | 0 (0.0%) | 3 (100.0%) |
| Enterprise Management | 0 (0.0%) | 0 (0.0%) |
| Administrative & Support | 0 (0.0%) | 0 (0.0%) |
| Educational Services | 0 (0.0%) | 13 (100.0%) |
| Health Care & Social Assistance | 0 (0.0%) | 0 (0.0%) |
| Arts, Entertainment & Recreation | 0 (0.0%) | 8 (100.0%) |
| Accommodation & Food Services | 1 (50.0%) | 1 (50.0%) |
| Public Administration | 0 (0.0%) | 0 (0.0%) |
| Total | 91 (60.7%) | 59 (39.3%) |
Education in Canton
School Enrollment in Canton
The most common levels of schooling among the 162 students in Canton are middle school (58 | 35.8%), high school (44 | 27.2%), and elementary school (33 | 20.4%).
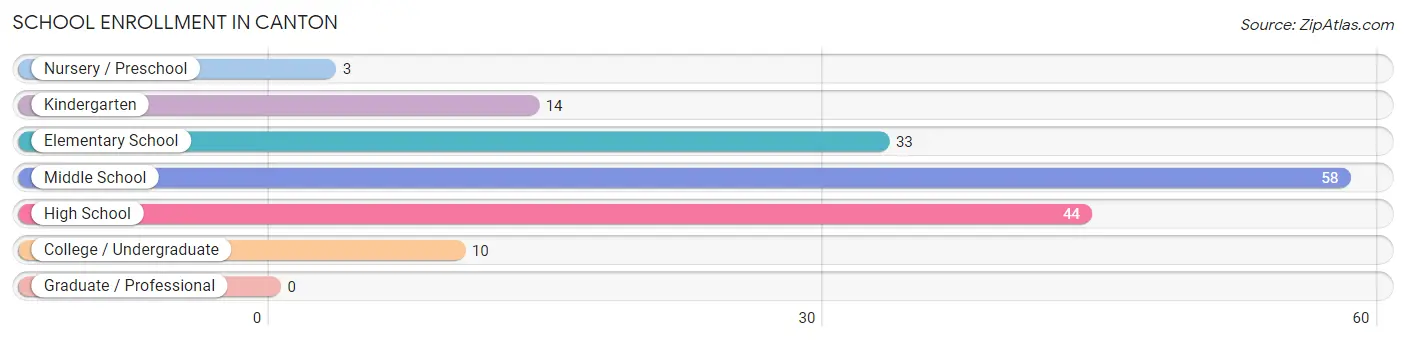
| School Level | # Students | % Students |
| Nursery / Preschool | 3 | 1.8% |
| Kindergarten | 14 | 8.6% |
| Elementary School | 33 | 20.4% |
| Middle School | 58 | 35.8% |
| High School | 44 | 27.2% |
| College / Undergraduate | 10 | 6.2% |
| Graduate / Professional | 0 | 0.0% |
| Total | 162 | 100.0% |
School Enrollment by Age by Funding Source in Canton
Out of a total of 162 students who are enrolled in schools in Canton, 9 (5.6%) attend a private institution, while the remaining 153 (94.4%) are enrolled in public schools. The age group of 15 to 17 year olds has the highest likelihood of being enrolled in private schools, with 9 (21.4% in the age bracket) enrolled. Conversely, the age group of 3 to 4 year olds has the lowest likelihood of being enrolled in a private school, with 3 (100.0% in the age bracket) attending a public institution.
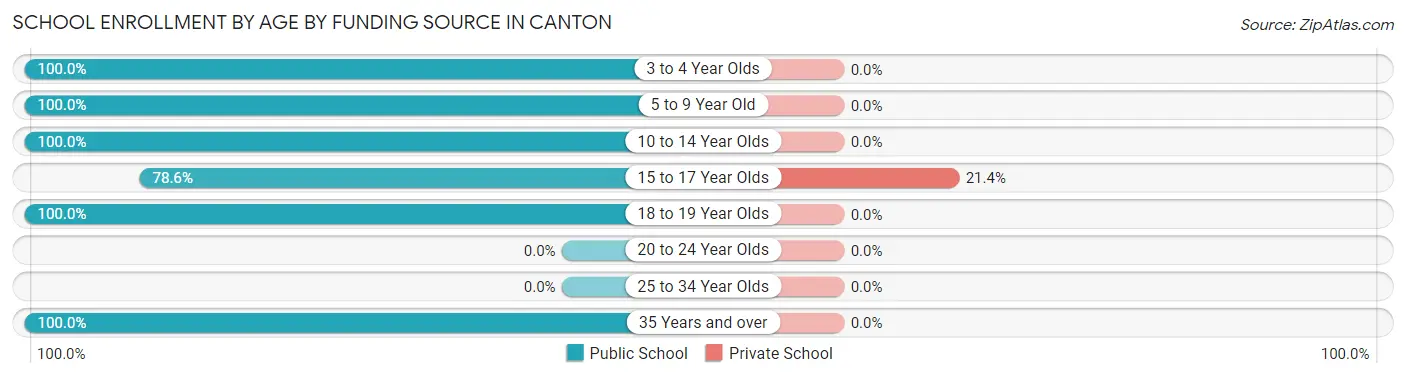
| Age Bracket | Public School | Private School |
| 3 to 4 Year Olds | 3 (100.0%) | 0 (0.0%) |
| 5 to 9 Year Old | 56 (100.0%) | 0 (0.0%) |
| 10 to 14 Year Olds | 49 (100.0%) | 0 (0.0%) |
| 15 to 17 Year Olds | 33 (78.6%) | 9 (21.4%) |
| 18 to 19 Year Olds | 2 (100.0%) | 0 (0.0%) |
| 20 to 24 Year Olds | 0 (0.0%) | 0 (0.0%) |
| 25 to 34 Year Olds | 0 (0.0%) | 0 (0.0%) |
| 35 Years and over | 10 (100.0%) | 0 (0.0%) |
| Total | 153 (94.4%) | 9 (5.6%) |
Educational Attainment by Field of Study in Canton
Education (21 | 35.6%), bio, nature & agricultural (8 | 13.6%), science & technology (8 | 13.6%), liberal arts & history (7 | 11.9%), and computers & mathematics (6 | 10.2%) are the most common fields of study among 59 individuals in Canton who have obtained a bachelor's degree or higher.
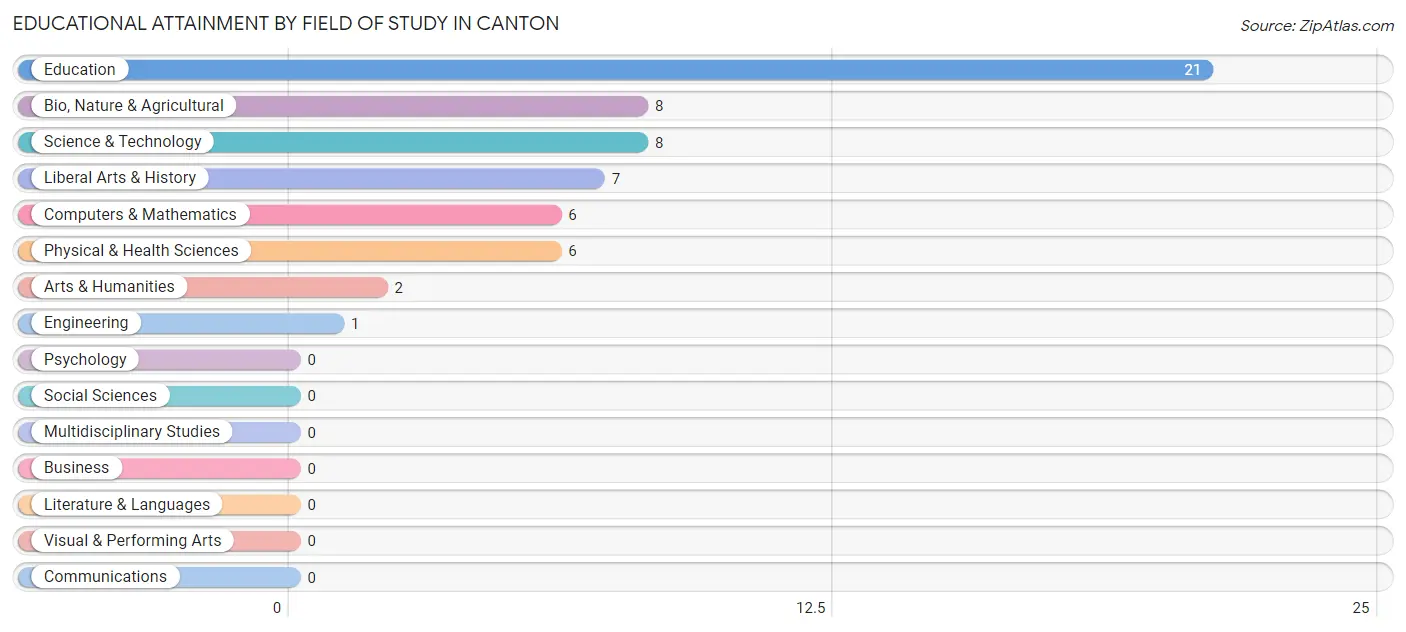
| Field of Study | # Graduates | % Graduates |
| Computers & Mathematics | 6 | 10.2% |
| Bio, Nature & Agricultural | 8 | 13.6% |
| Physical & Health Sciences | 6 | 10.2% |
| Psychology | 0 | 0.0% |
| Social Sciences | 0 | 0.0% |
| Engineering | 1 | 1.7% |
| Multidisciplinary Studies | 0 | 0.0% |
| Science & Technology | 8 | 13.6% |
| Business | 0 | 0.0% |
| Education | 21 | 35.6% |
| Literature & Languages | 0 | 0.0% |
| Liberal Arts & History | 7 | 11.9% |
| Visual & Performing Arts | 0 | 0.0% |
| Communications | 0 | 0.0% |
| Arts & Humanities | 2 | 3.4% |
| Total | 59 | 100.0% |
Transportation & Commute in Canton
Vehicle Availability by Sex in Canton
The most prevalent vehicle ownership categories in Canton are males with 2 vehicles (57, accounting for 62.6%) and females with 2 vehicles (25, making up 109.6%).
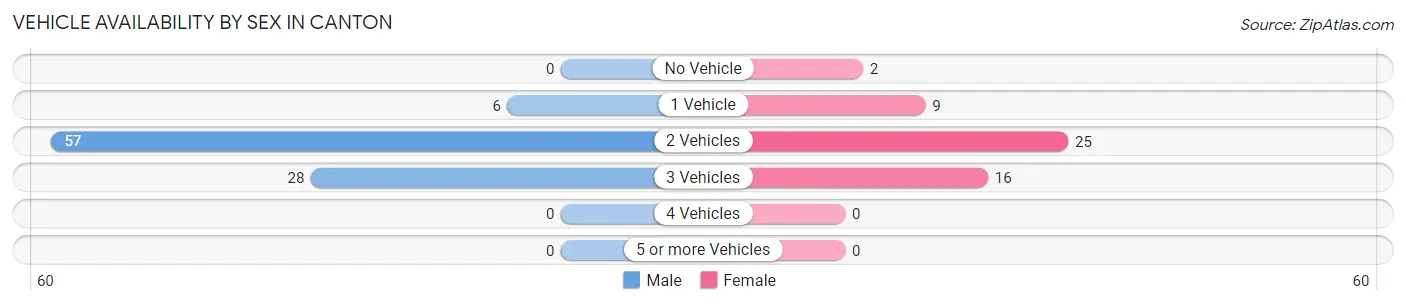
| Vehicles Available | Male | Female |
| No Vehicle | 0 (0.0%) | 2 (3.8%) |
| 1 Vehicle | 6 (6.6%) | 9 (17.3%) |
| 2 Vehicles | 57 (62.6%) | 25 (48.1%) |
| 3 Vehicles | 28 (30.8%) | 16 (30.8%) |
| 4 Vehicles | 0 (0.0%) | 0 (0.0%) |
| 5 or more Vehicles | 0 (0.0%) | 0 (0.0%) |
| Total | 91 (100.0%) | 52 (100.0%) |
Commute Time in Canton
The most frequently occuring commute durations in Canton are less than 5 minutes (66 commuters, 46.2%), 5 to 9 minutes (30 commuters, 21.0%), and 15 to 19 minutes (19 commuters, 13.3%).
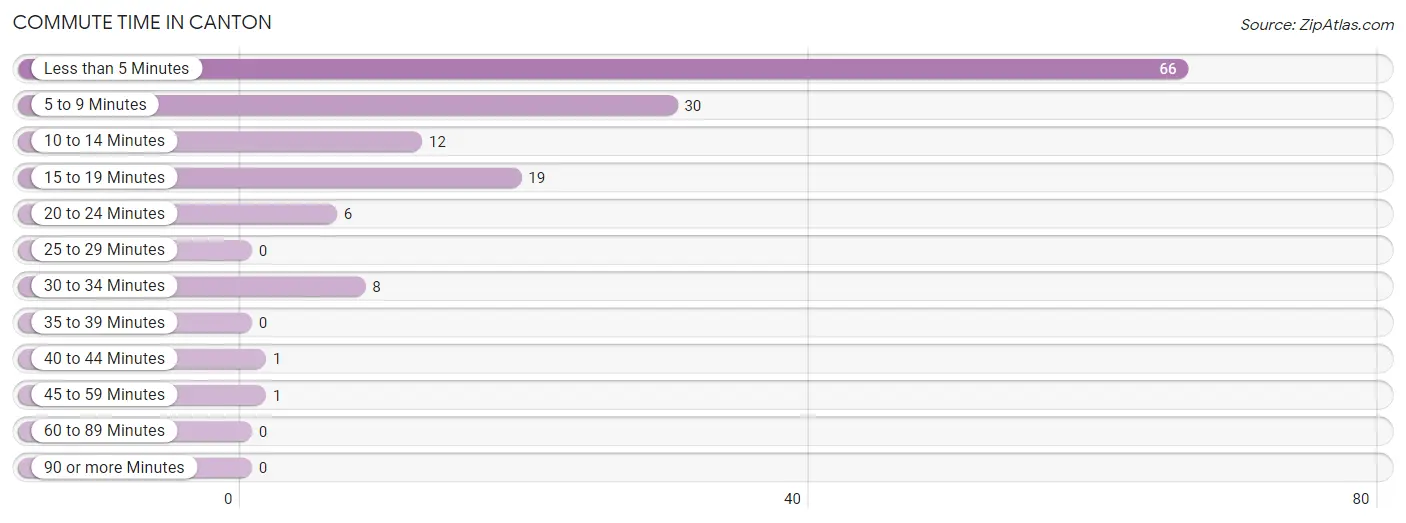
| Commute Time | # Commuters | % Commuters |
| Less than 5 Minutes | 66 | 46.2% |
| 5 to 9 Minutes | 30 | 21.0% |
| 10 to 14 Minutes | 12 | 8.4% |
| 15 to 19 Minutes | 19 | 13.3% |
| 20 to 24 Minutes | 6 | 4.2% |
| 25 to 29 Minutes | 0 | 0.0% |
| 30 to 34 Minutes | 8 | 5.6% |
| 35 to 39 Minutes | 0 | 0.0% |
| 40 to 44 Minutes | 1 | 0.7% |
| 45 to 59 Minutes | 1 | 0.7% |
| 60 to 89 Minutes | 0 | 0.0% |
| 90 or more Minutes | 0 | 0.0% |
Commute Time by Sex in Canton
The most common commute times in Canton are less than 5 minutes (29 commuters, 31.9%) for males and less than 5 minutes (37 commuters, 71.2%) for females.
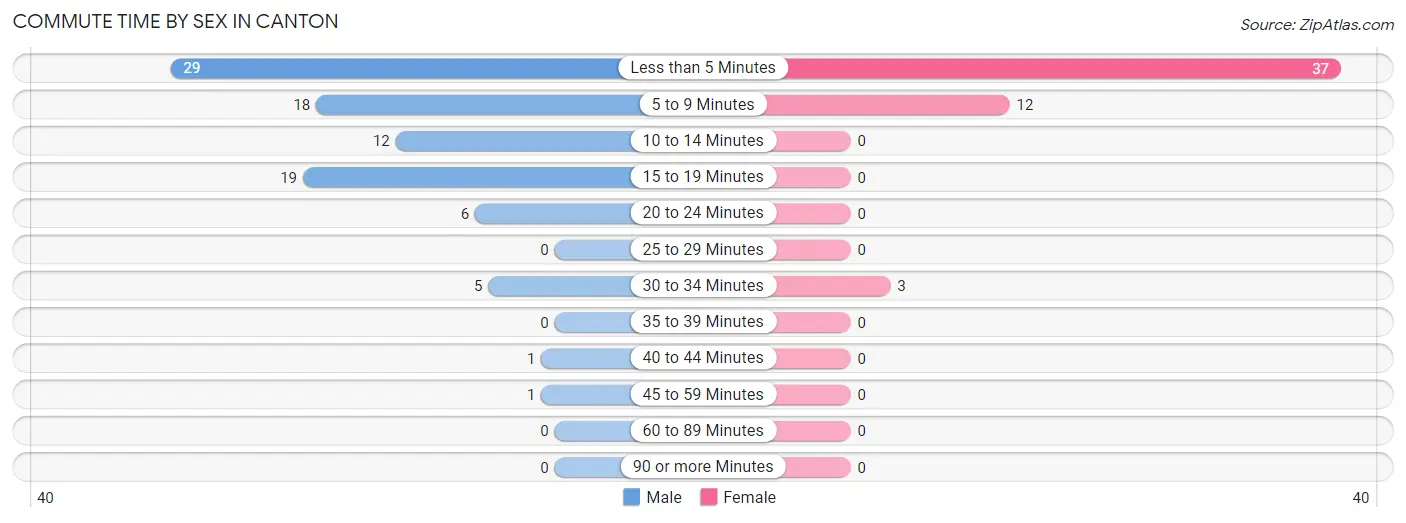
| Commute Time | Male | Female |
| Less than 5 Minutes | 29 (31.9%) | 37 (71.2%) |
| 5 to 9 Minutes | 18 (19.8%) | 12 (23.1%) |
| 10 to 14 Minutes | 12 (13.2%) | 0 (0.0%) |
| 15 to 19 Minutes | 19 (20.9%) | 0 (0.0%) |
| 20 to 24 Minutes | 6 (6.6%) | 0 (0.0%) |
| 25 to 29 Minutes | 0 (0.0%) | 0 (0.0%) |
| 30 to 34 Minutes | 5 (5.5%) | 3 (5.8%) |
| 35 to 39 Minutes | 0 (0.0%) | 0 (0.0%) |
| 40 to 44 Minutes | 1 (1.1%) | 0 (0.0%) |
| 45 to 59 Minutes | 1 (1.1%) | 0 (0.0%) |
| 60 to 89 Minutes | 0 (0.0%) | 0 (0.0%) |
| 90 or more Minutes | 0 (0.0%) | 0 (0.0%) |
Time of Departure to Work by Sex in Canton
The most frequent times of departure to work in Canton are 12:00 AM to 4:59 AM (19, 20.9%) for males and 12:00 AM to 4:59 AM (16, 30.8%) for females.
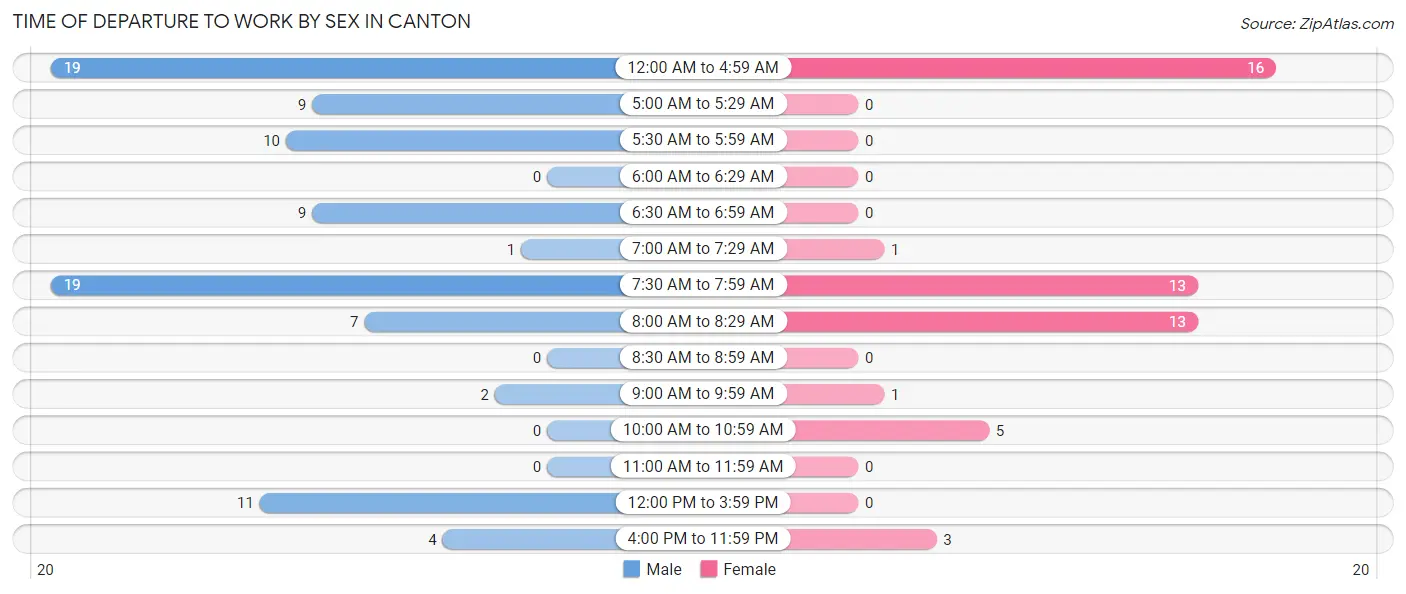
| Time of Departure | Male | Female |
| 12:00 AM to 4:59 AM | 19 (20.9%) | 16 (30.8%) |
| 5:00 AM to 5:29 AM | 9 (9.9%) | 0 (0.0%) |
| 5:30 AM to 5:59 AM | 10 (11.0%) | 0 (0.0%) |
| 6:00 AM to 6:29 AM | 0 (0.0%) | 0 (0.0%) |
| 6:30 AM to 6:59 AM | 9 (9.9%) | 0 (0.0%) |
| 7:00 AM to 7:29 AM | 1 (1.1%) | 1 (1.9%) |
| 7:30 AM to 7:59 AM | 19 (20.9%) | 13 (25.0%) |
| 8:00 AM to 8:29 AM | 7 (7.7%) | 13 (25.0%) |
| 8:30 AM to 8:59 AM | 0 (0.0%) | 0 (0.0%) |
| 9:00 AM to 9:59 AM | 2 (2.2%) | 1 (1.9%) |
| 10:00 AM to 10:59 AM | 0 (0.0%) | 5 (9.6%) |
| 11:00 AM to 11:59 AM | 0 (0.0%) | 0 (0.0%) |
| 12:00 PM to 3:59 PM | 11 (12.1%) | 0 (0.0%) |
| 4:00 PM to 11:59 PM | 4 (4.4%) | 3 (5.8%) |
| Total | 91 (100.0%) | 52 (100.0%) |
Housing Occupancy in Canton
Occupancy by Ownership in Canton
Of the total 179 dwellings in Canton, owner-occupied units account for 144 (80.4%), while renter-occupied units make up 35 (19.6%).
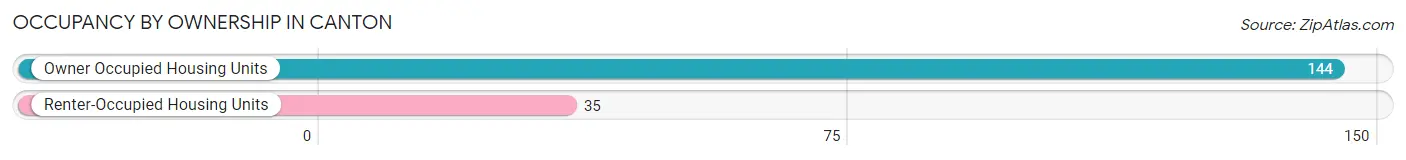
| Occupancy | # Housing Units | % Housing Units |
| Owner Occupied Housing Units | 144 | 80.4% |
| Renter-Occupied Housing Units | 35 | 19.6% |
| Total Occupied Housing Units | 179 | 100.0% |
Occupancy by Household Size in Canton
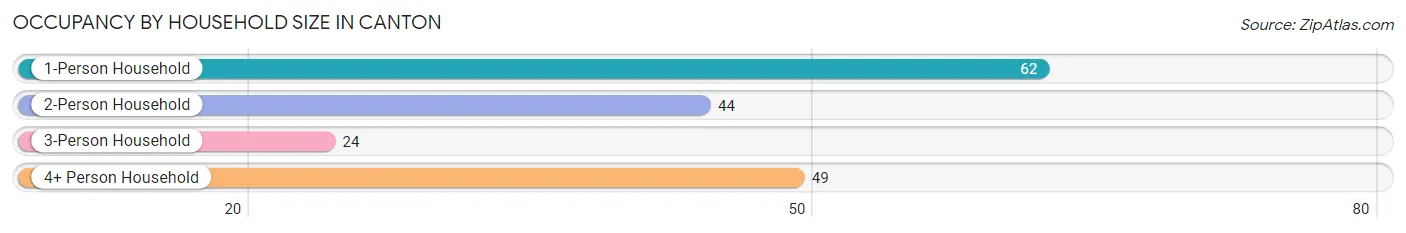
| Household Size | # Housing Units | % Housing Units |
| 1-Person Household | 62 | 34.6% |
| 2-Person Household | 44 | 24.6% |
| 3-Person Household | 24 | 13.4% |
| 4+ Person Household | 49 | 27.4% |
| Total Housing Units | 179 | 100.0% |
Occupancy by Ownership by Household Size in Canton
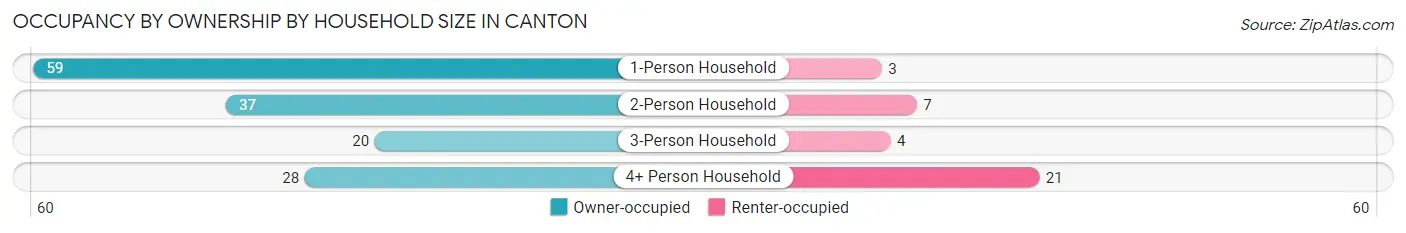
| Household Size | Owner-occupied | Renter-occupied |
| 1-Person Household | 59 (95.2%) | 3 (4.8%) |
| 2-Person Household | 37 (84.1%) | 7 (15.9%) |
| 3-Person Household | 20 (83.3%) | 4 (16.7%) |
| 4+ Person Household | 28 (57.1%) | 21 (42.9%) |
| Total Housing Units | 144 (80.4%) | 35 (19.6%) |
Occupancy by Educational Attainment in Canton
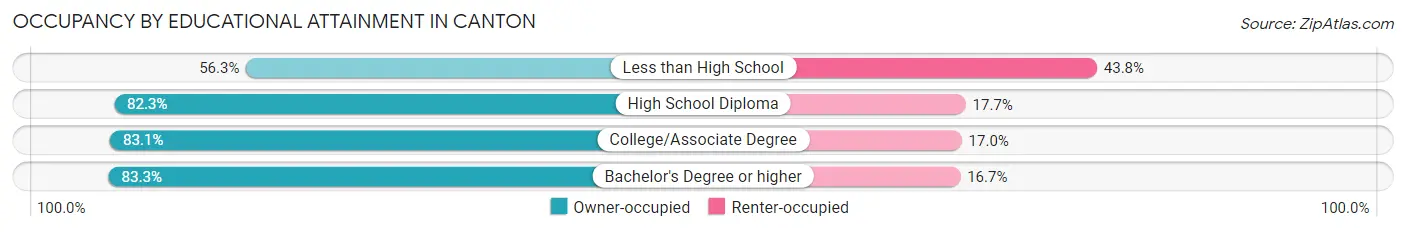
| Household Size | Owner-occupied | Renter-occupied |
| Less than High School | 9 (56.2%) | 7 (43.8%) |
| High School Diploma | 51 (82.3%) | 11 (17.7%) |
| College/Associate Degree | 49 (83.1%) | 10 (17.0%) |
| Bachelor's Degree or higher | 35 (83.3%) | 7 (16.7%) |
Occupancy by Age of Householder in Canton
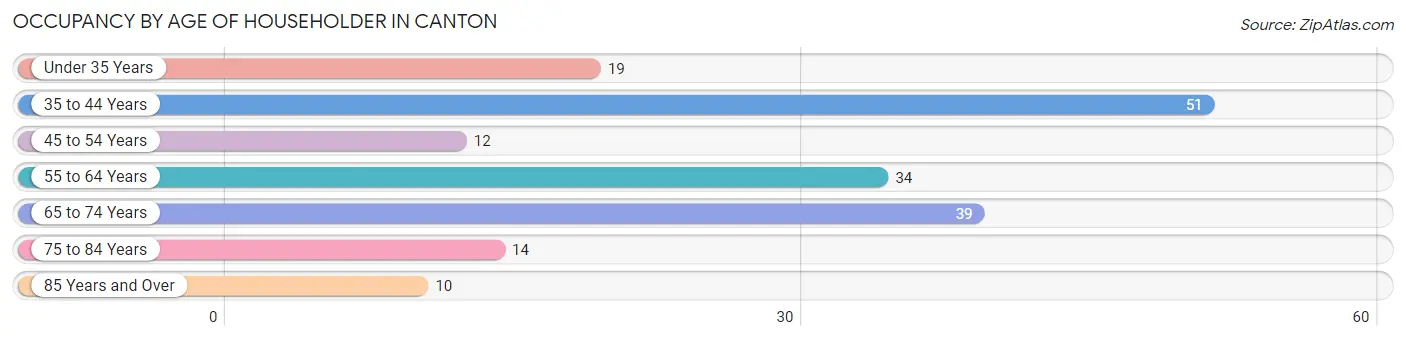
| Age Bracket | # Households | % Households |
| Under 35 Years | 19 | 10.6% |
| 35 to 44 Years | 51 | 28.5% |
| 45 to 54 Years | 12 | 6.7% |
| 55 to 64 Years | 34 | 19.0% |
| 65 to 74 Years | 39 | 21.8% |
| 75 to 84 Years | 14 | 7.8% |
| 85 Years and Over | 10 | 5.6% |
| Total | 179 | 100.0% |
Housing Finances in Canton
Median Income by Occupancy in Canton
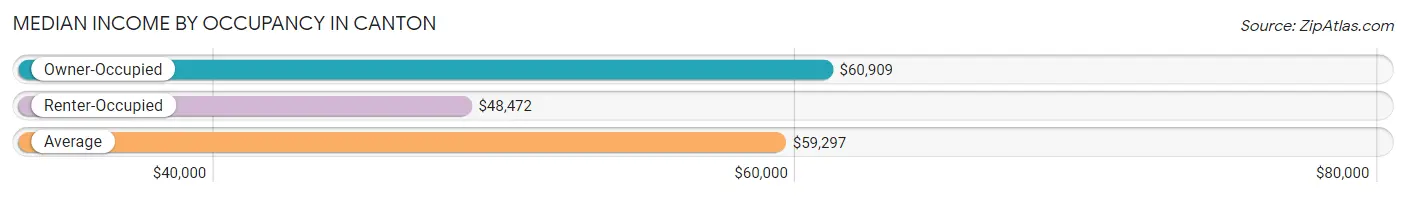
| Occupancy Type | # Households | Median Income |
| Owner-Occupied | 144 (80.4%) | $60,909 |
| Renter-Occupied | 35 (19.6%) | $48,472 |
| Average | 179 (100.0%) | $59,297 |
Occupancy by Householder Income Bracket in Canton
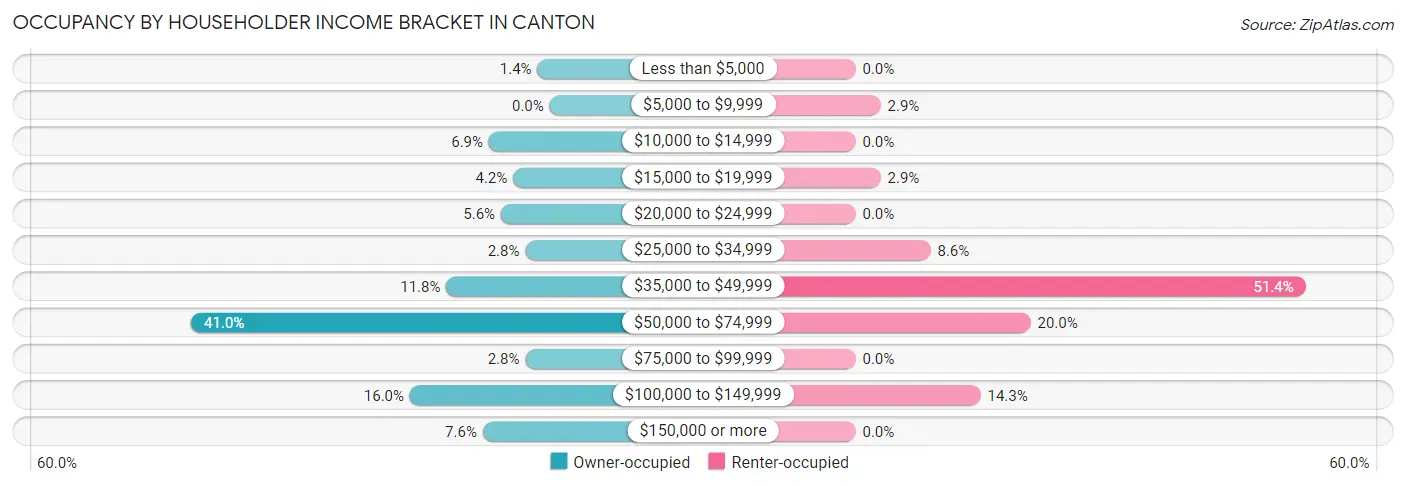
| Income Bracket | Owner-occupied | Renter-occupied |
| Less than $5,000 | 2 (1.4%) | 0 (0.0%) |
| $5,000 to $9,999 | 0 (0.0%) | 1 (2.9%) |
| $10,000 to $14,999 | 10 (6.9%) | 0 (0.0%) |
| $15,000 to $19,999 | 6 (4.2%) | 1 (2.9%) |
| $20,000 to $24,999 | 8 (5.6%) | 0 (0.0%) |
| $25,000 to $34,999 | 4 (2.8%) | 3 (8.6%) |
| $35,000 to $49,999 | 17 (11.8%) | 18 (51.4%) |
| $50,000 to $74,999 | 59 (41.0%) | 7 (20.0%) |
| $75,000 to $99,999 | 4 (2.8%) | 0 (0.0%) |
| $100,000 to $149,999 | 23 (16.0%) | 5 (14.3%) |
| $150,000 or more | 11 (7.6%) | 0 (0.0%) |
| Total | 144 (100.0%) | 35 (100.0%) |
Monthly Housing Cost Tiers in Canton
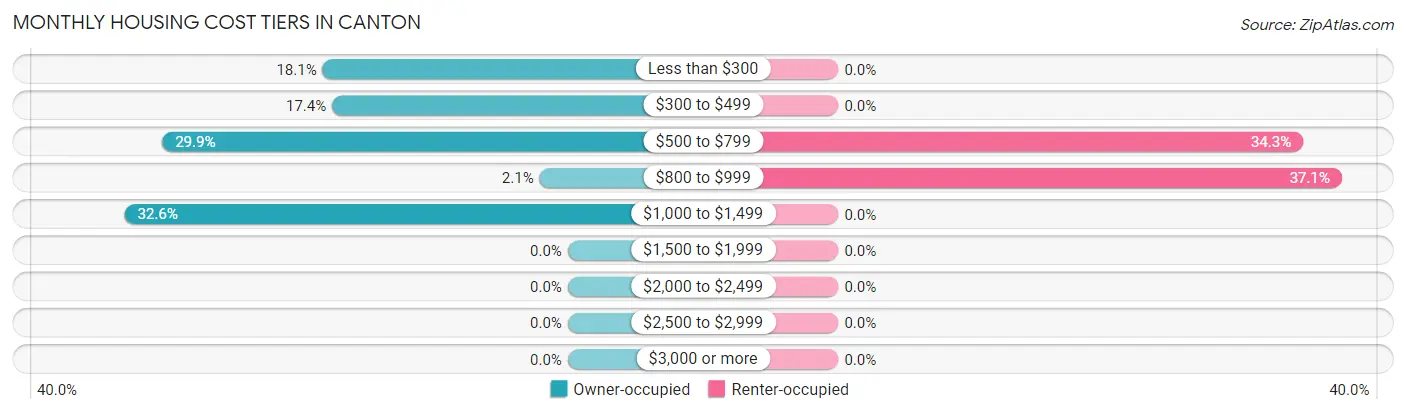
| Monthly Cost | Owner-occupied | Renter-occupied |
| Less than $300 | 26 (18.1%) | 0 (0.0%) |
| $300 to $499 | 25 (17.4%) | 0 (0.0%) |
| $500 to $799 | 43 (29.9%) | 12 (34.3%) |
| $800 to $999 | 3 (2.1%) | 13 (37.1%) |
| $1,000 to $1,499 | 47 (32.6%) | 0 (0.0%) |
| $1,500 to $1,999 | 0 (0.0%) | 0 (0.0%) |
| $2,000 to $2,499 | 0 (0.0%) | 0 (0.0%) |
| $2,500 to $2,999 | 0 (0.0%) | 0 (0.0%) |
| $3,000 or more | 0 (0.0%) | 0 (0.0%) |
| Total | 144 (100.0%) | 35 (100.0%) |
Physical Housing Characteristics in Canton
Housing Structures in Canton
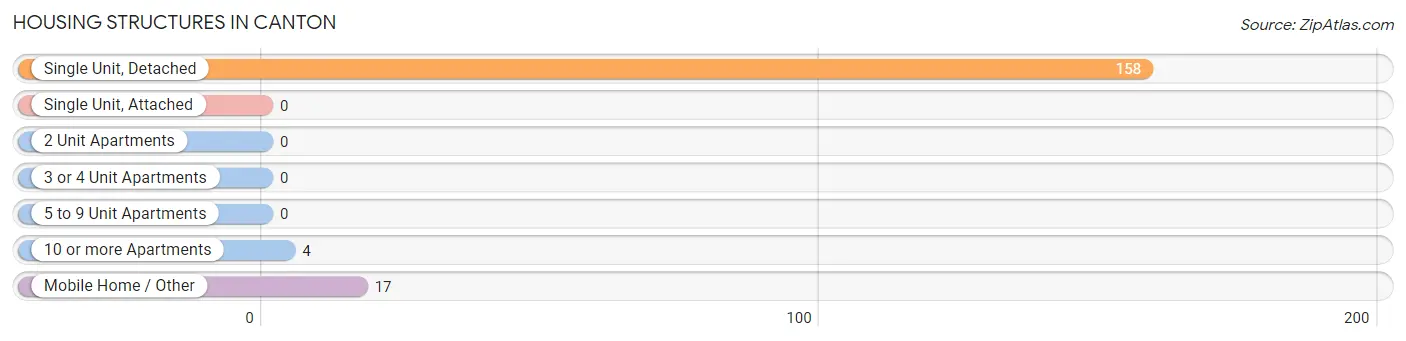
| Structure Type | # Housing Units | % Housing Units |
| Single Unit, Detached | 158 | 88.3% |
| Single Unit, Attached | 0 | 0.0% |
| 2 Unit Apartments | 0 | 0.0% |
| 3 or 4 Unit Apartments | 0 | 0.0% |
| 5 to 9 Unit Apartments | 0 | 0.0% |
| 10 or more Apartments | 4 | 2.2% |
| Mobile Home / Other | 17 | 9.5% |
| Total | 179 | 100.0% |
Housing Structures by Occupancy in Canton
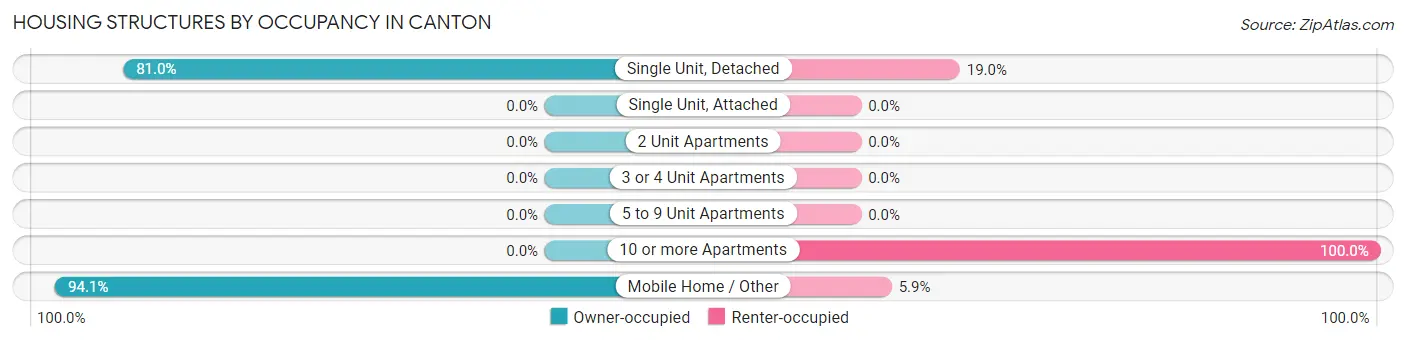
| Structure Type | Owner-occupied | Renter-occupied |
| Single Unit, Detached | 128 (81.0%) | 30 (19.0%) |
| Single Unit, Attached | 0 (0.0%) | 0 (0.0%) |
| 2 Unit Apartments | 0 (0.0%) | 0 (0.0%) |
| 3 or 4 Unit Apartments | 0 (0.0%) | 0 (0.0%) |
| 5 to 9 Unit Apartments | 0 (0.0%) | 0 (0.0%) |
| 10 or more Apartments | 0 (0.0%) | 4 (100.0%) |
| Mobile Home / Other | 16 (94.1%) | 1 (5.9%) |
| Total | 144 (80.4%) | 35 (19.6%) |
Housing Structures by Number of Rooms in Canton
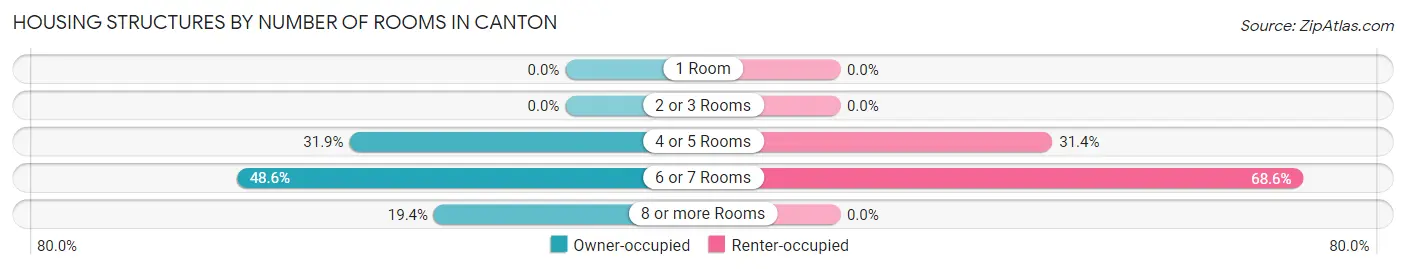
| Number of Rooms | Owner-occupied | Renter-occupied |
| 1 Room | 0 (0.0%) | 0 (0.0%) |
| 2 or 3 Rooms | 0 (0.0%) | 0 (0.0%) |
| 4 or 5 Rooms | 46 (31.9%) | 11 (31.4%) |
| 6 or 7 Rooms | 70 (48.6%) | 24 (68.6%) |
| 8 or more Rooms | 28 (19.4%) | 0 (0.0%) |
| Total | 144 (100.0%) | 35 (100.0%) |
Housing Structure by Heating Type in Canton
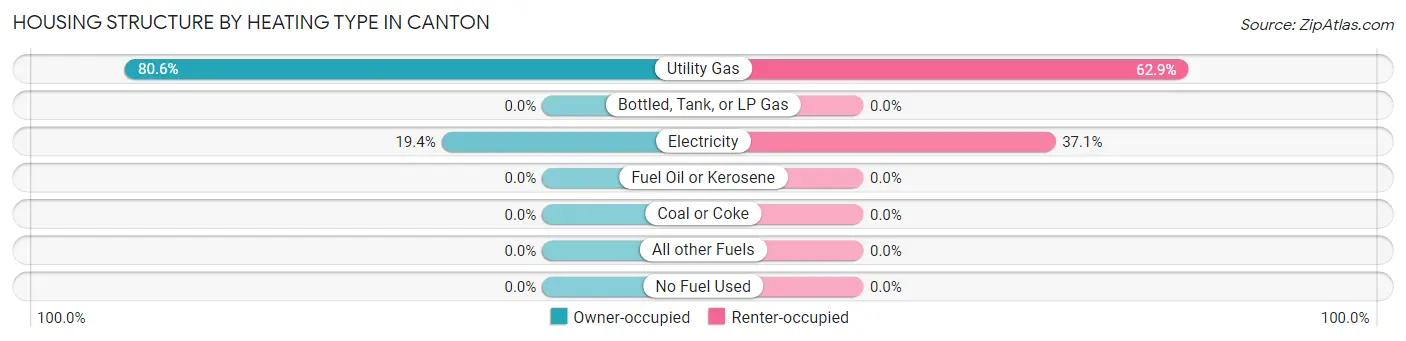
| Heating Type | Owner-occupied | Renter-occupied |
| Utility Gas | 116 (80.6%) | 22 (62.9%) |
| Bottled, Tank, or LP Gas | 0 (0.0%) | 0 (0.0%) |
| Electricity | 28 (19.4%) | 13 (37.1%) |
| Fuel Oil or Kerosene | 0 (0.0%) | 0 (0.0%) |
| Coal or Coke | 0 (0.0%) | 0 (0.0%) |
| All other Fuels | 0 (0.0%) | 0 (0.0%) |
| No Fuel Used | 0 (0.0%) | 0 (0.0%) |
| Total | 144 (100.0%) | 35 (100.0%) |
Household Vehicle Usage in Canton
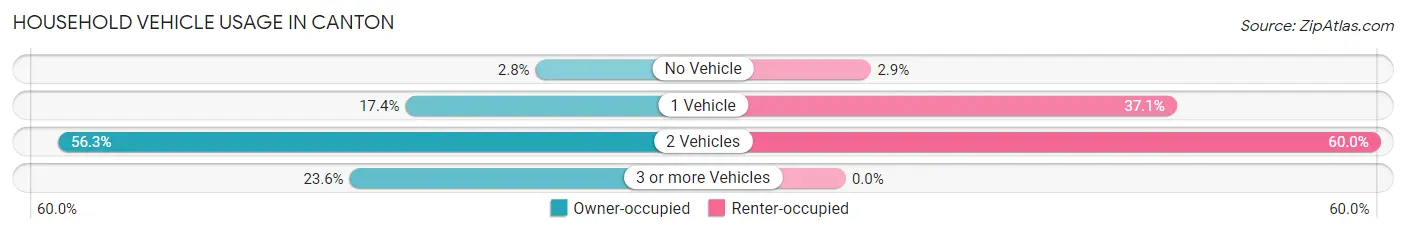
| Vehicles per Household | Owner-occupied | Renter-occupied |
| No Vehicle | 4 (2.8%) | 1 (2.9%) |
| 1 Vehicle | 25 (17.4%) | 13 (37.1%) |
| 2 Vehicles | 81 (56.2%) | 21 (60.0%) |
| 3 or more Vehicles | 34 (23.6%) | 0 (0.0%) |
| Total | 144 (100.0%) | 35 (100.0%) |
Real Estate & Mortgages in Canton
Real Estate and Mortgage Overview in Canton
| Characteristic | Without Mortgage | With Mortgage |
| Housing Units | 65 | 79 |
| Median Property Value | $59,300 | $59,200 |
| Median Household Income | $55,750 | $2 |
| Monthly Housing Costs | $341 | $0 |
| Real Estate Taxes | $242 | $0 |
Property Value by Mortgage Status in Canton

| Property Value | Without Mortgage | With Mortgage |
| Less than $50,000 | 13 (20.0%) | 11 (13.9%) |
| $50,000 to $99,999 | 25 (38.5%) | 54 (68.3%) |
| $100,000 to $299,999 | 25 (38.5%) | 14 (17.7%) |
| $300,000 to $499,999 | 2 (3.1%) | 0 (0.0%) |
| $500,000 to $749,999 | 0 (0.0%) | 0 (0.0%) |
| $750,000 to $999,999 | 0 (0.0%) | 0 (0.0%) |
| $1,000,000 or more | 0 (0.0%) | 0 (0.0%) |
| Total | 65 (100.0%) | 79 (100.0%) |
Household Income by Mortgage Status in Canton
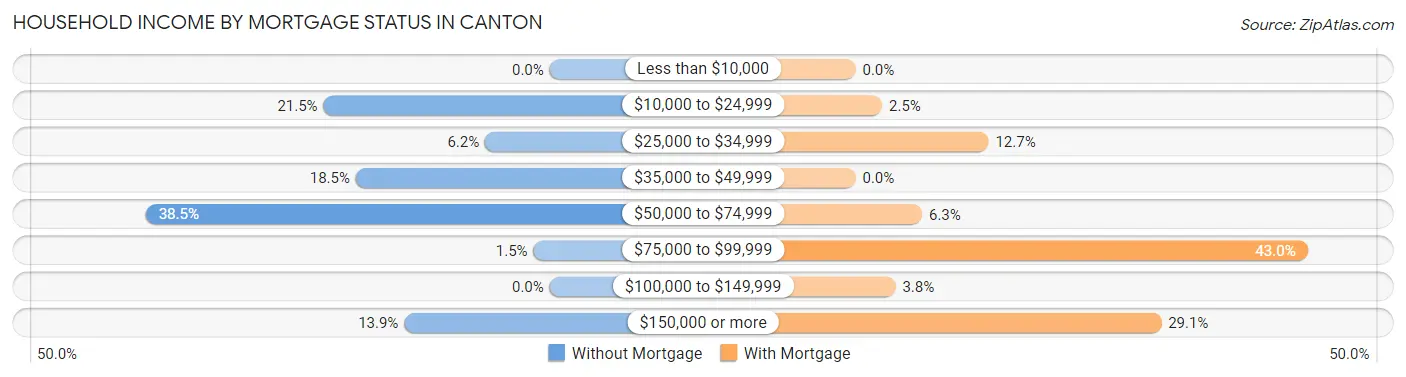
| Household Income | Without Mortgage | With Mortgage |
| Less than $10,000 | 0 (0.0%) | 0 (0.0%) |
| $10,000 to $24,999 | 14 (21.5%) | 2 (2.5%) |
| $25,000 to $34,999 | 4 (6.1%) | 10 (12.7%) |
| $35,000 to $49,999 | 12 (18.5%) | 0 (0.0%) |
| $50,000 to $74,999 | 25 (38.5%) | 5 (6.3%) |
| $75,000 to $99,999 | 1 (1.5%) | 34 (43.0%) |
| $100,000 to $149,999 | 0 (0.0%) | 3 (3.8%) |
| $150,000 or more | 9 (13.9%) | 23 (29.1%) |
| Total | 65 (100.0%) | 79 (100.0%) |
Property Value to Household Income Ratio in Canton
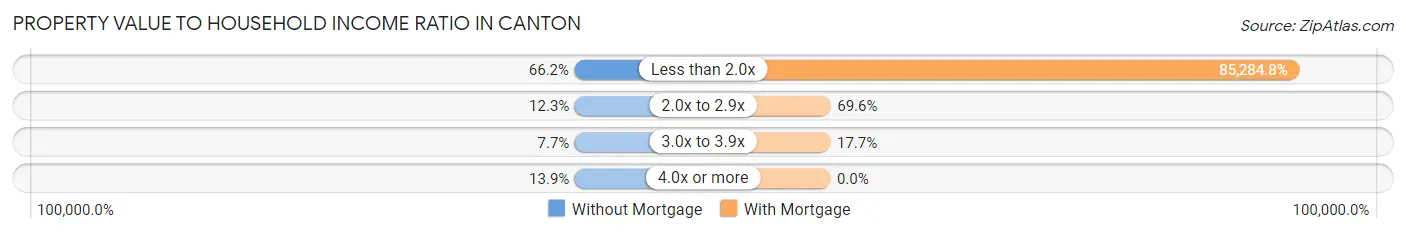
| Value-to-Income Ratio | Without Mortgage | With Mortgage |
| Less than 2.0x | 43 (66.1%) | 67,375 (85,284.8%) |
| 2.0x to 2.9x | 8 (12.3%) | 55 (69.6%) |
| 3.0x to 3.9x | 5 (7.7%) | 14 (17.7%) |
| 4.0x or more | 9 (13.9%) | 0 (0.0%) |
| Total | 65 (100.0%) | 79 (100.0%) |
Real Estate Taxes by Mortgage Status in Canton
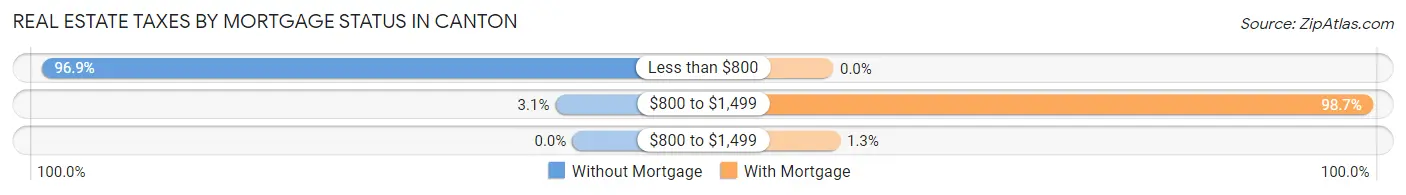
| Property Taxes | Without Mortgage | With Mortgage |
| Less than $800 | 63 (96.9%) | 0 (0.0%) |
| $800 to $1,499 | 2 (3.1%) | 78 (98.7%) |
| $800 to $1,499 | 0 (0.0%) | 1 (1.3%) |
| Total | 65 (100.0%) | 79 (100.0%) |
Health & Disability in Canton
Health Insurance Coverage by Age in Canton
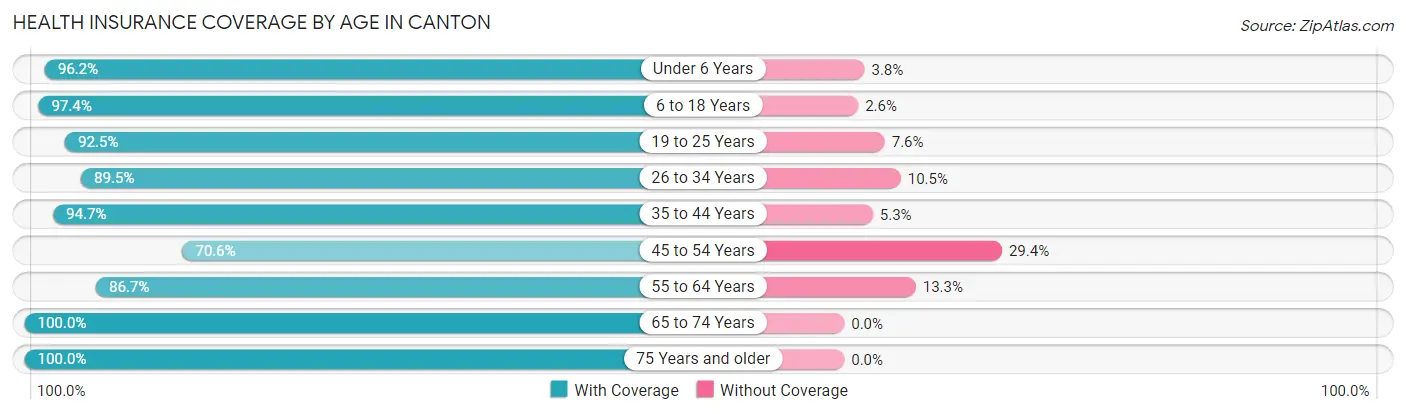
| Age Bracket | With Coverage | Without Coverage |
| Under 6 Years | 51 (96.2%) | 2 (3.8%) |
| 6 to 18 Years | 150 (97.4%) | 4 (2.6%) |
| 19 to 25 Years | 49 (92.4%) | 4 (7.5%) |
| 26 to 34 Years | 34 (89.5%) | 4 (10.5%) |
| 35 to 44 Years | 71 (94.7%) | 4 (5.3%) |
| 45 to 54 Years | 12 (70.6%) | 5 (29.4%) |
| 55 to 64 Years | 39 (86.7%) | 6 (13.3%) |
| 65 to 74 Years | 59 (100.0%) | 0 (0.0%) |
| 75 Years and older | 26 (100.0%) | 0 (0.0%) |
| Total | 491 (94.4%) | 29 (5.6%) |
Health Insurance Coverage by Citizenship Status in Canton
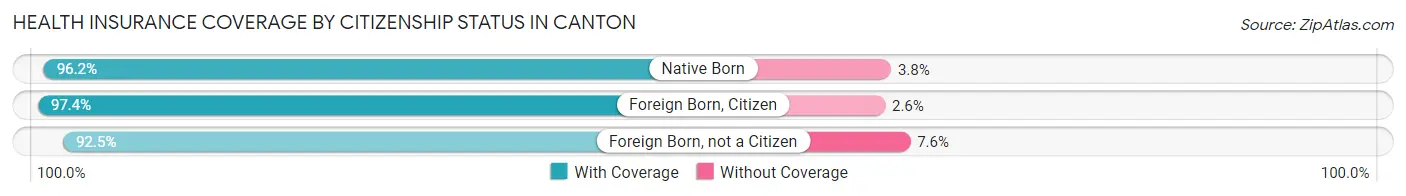
| Citizenship Status | With Coverage | Without Coverage |
| Native Born | 51 (96.2%) | 2 (3.8%) |
| Foreign Born, Citizen | 150 (97.4%) | 4 (2.6%) |
| Foreign Born, not a Citizen | 49 (92.4%) | 4 (7.5%) |
Health Insurance Coverage by Household Income in Canton
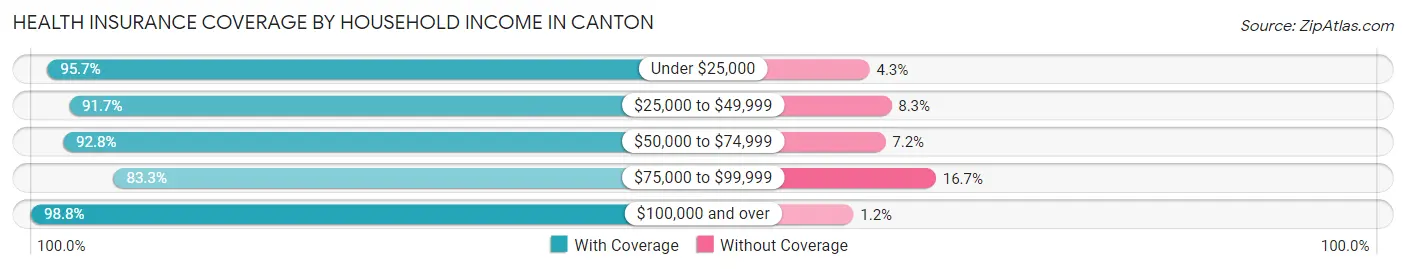
| Household Income | With Coverage | Without Coverage |
| Under $25,000 | 45 (95.7%) | 2 (4.3%) |
| $25,000 to $49,999 | 121 (91.7%) | 11 (8.3%) |
| $50,000 to $74,999 | 154 (92.8%) | 12 (7.2%) |
| $75,000 to $99,999 | 10 (83.3%) | 2 (16.7%) |
| $100,000 and over | 161 (98.8%) | 2 (1.2%) |
Public vs Private Health Insurance Coverage by Age in Canton
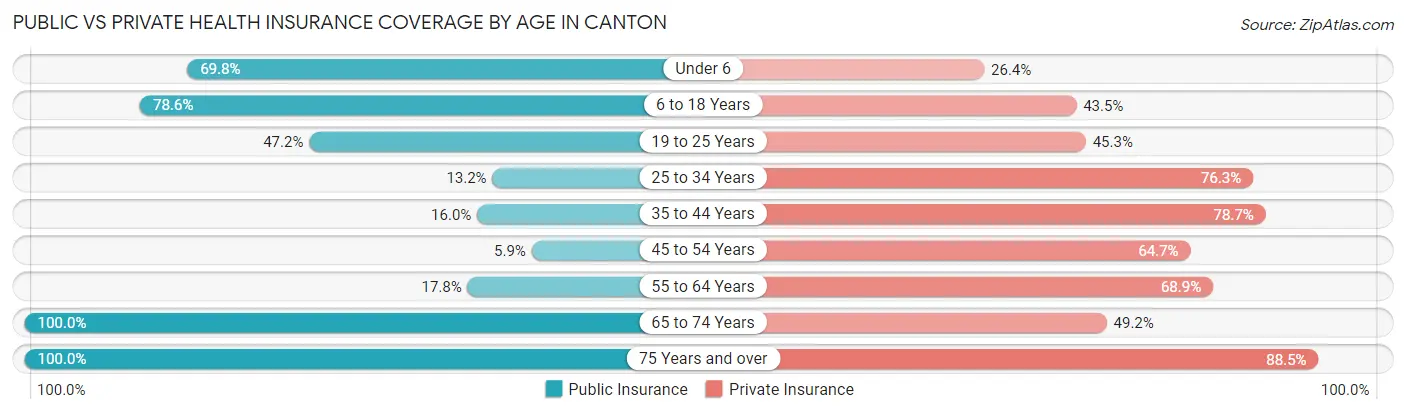
| Age Bracket | Public Insurance | Private Insurance |
| Under 6 | 37 (69.8%) | 14 (26.4%) |
| 6 to 18 Years | 121 (78.6%) | 67 (43.5%) |
| 19 to 25 Years | 25 (47.2%) | 24 (45.3%) |
| 25 to 34 Years | 5 (13.2%) | 29 (76.3%) |
| 35 to 44 Years | 12 (16.0%) | 59 (78.7%) |
| 45 to 54 Years | 1 (5.9%) | 11 (64.7%) |
| 55 to 64 Years | 8 (17.8%) | 31 (68.9%) |
| 65 to 74 Years | 59 (100.0%) | 29 (49.1%) |
| 75 Years and over | 26 (100.0%) | 23 (88.5%) |
| Total | 294 (56.5%) | 287 (55.2%) |
Disability Status by Sex by Age in Canton
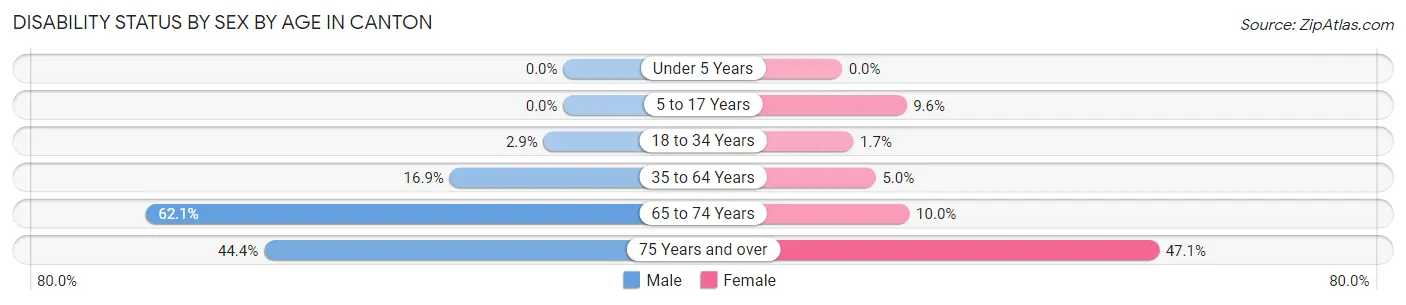
| Age Bracket | Male | Female |
| Under 5 Years | 0 (0.0%) | 0 (0.0%) |
| 5 to 17 Years | 0 (0.0%) | 9 (9.6%) |
| 18 to 34 Years | 1 (2.9%) | 1 (1.7%) |
| 35 to 64 Years | 13 (16.9%) | 3 (5.0%) |
| 65 to 74 Years | 18 (62.1%) | 3 (10.0%) |
| 75 Years and over | 4 (44.4%) | 8 (47.1%) |
Disability Class by Sex by Age in Canton
Disability Class: Hearing Difficulty
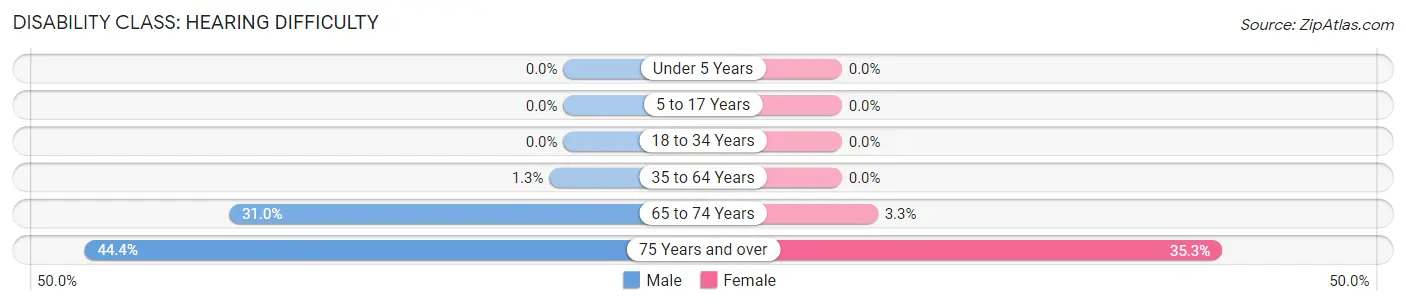
| Age Bracket | Male | Female |
| Under 5 Years | 0 (0.0%) | 0 (0.0%) |
| 5 to 17 Years | 0 (0.0%) | 0 (0.0%) |
| 18 to 34 Years | 0 (0.0%) | 0 (0.0%) |
| 35 to 64 Years | 1 (1.3%) | 0 (0.0%) |
| 65 to 74 Years | 9 (31.0%) | 1 (3.3%) |
| 75 Years and over | 4 (44.4%) | 6 (35.3%) |
Disability Class: Vision Difficulty
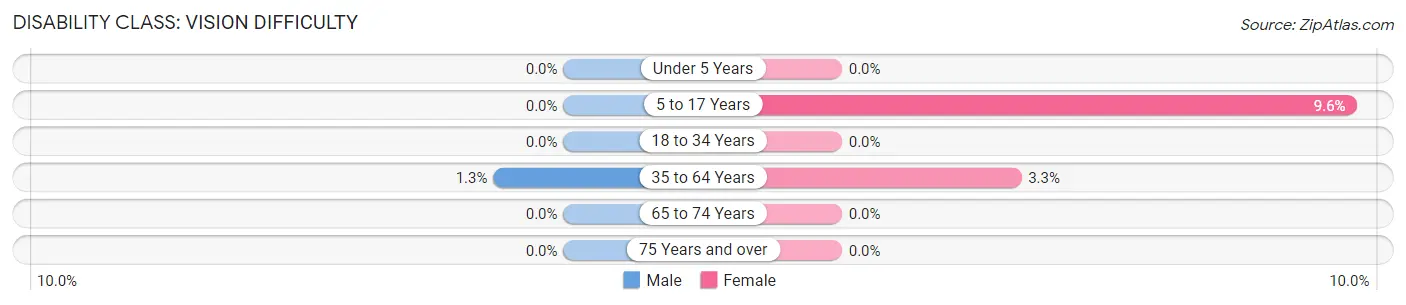
| Age Bracket | Male | Female |
| Under 5 Years | 0 (0.0%) | 0 (0.0%) |
| 5 to 17 Years | 0 (0.0%) | 9 (9.6%) |
| 18 to 34 Years | 0 (0.0%) | 0 (0.0%) |
| 35 to 64 Years | 1 (1.3%) | 2 (3.3%) |
| 65 to 74 Years | 0 (0.0%) | 0 (0.0%) |
| 75 Years and over | 0 (0.0%) | 0 (0.0%) |
Disability Class: Cognitive Difficulty
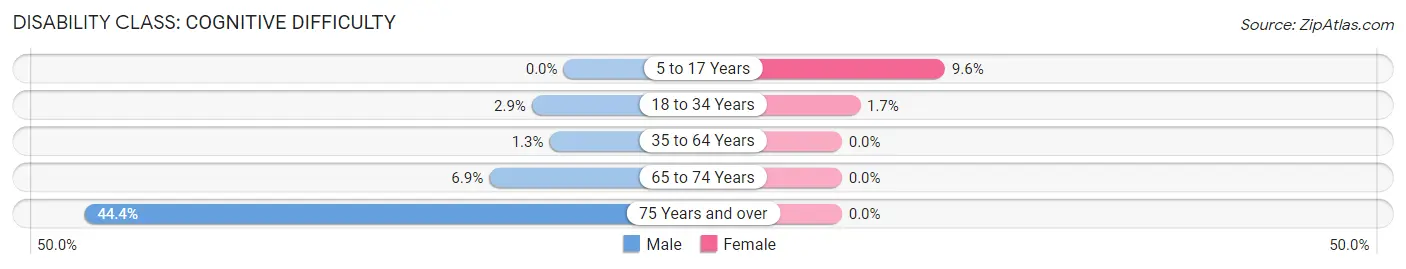
| Age Bracket | Male | Female |
| 5 to 17 Years | 0 (0.0%) | 9 (9.6%) |
| 18 to 34 Years | 1 (2.9%) | 1 (1.7%) |
| 35 to 64 Years | 1 (1.3%) | 0 (0.0%) |
| 65 to 74 Years | 2 (6.9%) | 0 (0.0%) |
| 75 Years and over | 4 (44.4%) | 0 (0.0%) |
Disability Class: Ambulatory Difficulty
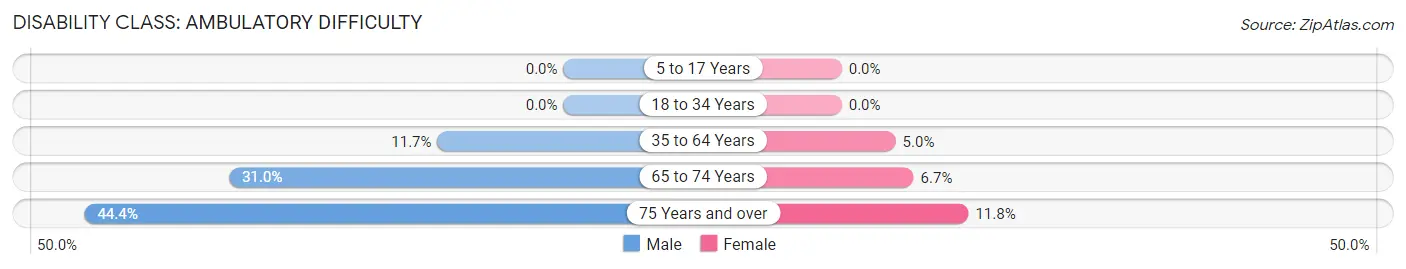
| Age Bracket | Male | Female |
| 5 to 17 Years | 0 (0.0%) | 0 (0.0%) |
| 18 to 34 Years | 0 (0.0%) | 0 (0.0%) |
| 35 to 64 Years | 9 (11.7%) | 3 (5.0%) |
| 65 to 74 Years | 9 (31.0%) | 2 (6.7%) |
| 75 Years and over | 4 (44.4%) | 2 (11.8%) |
Disability Class: Self-Care Difficulty
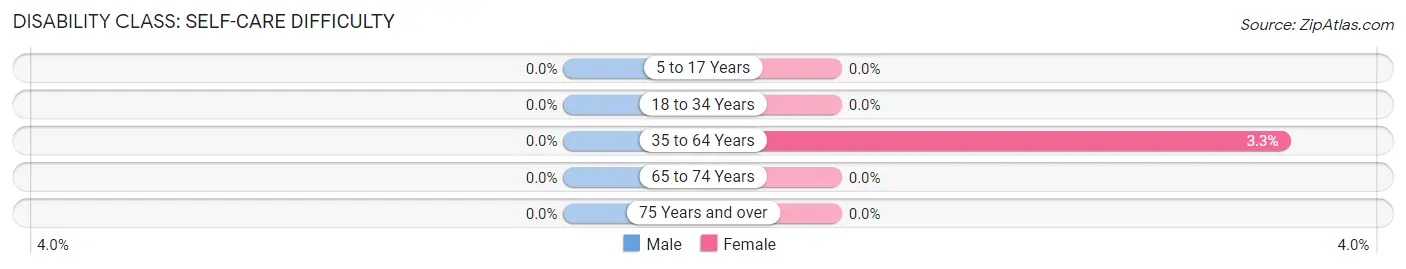
| Age Bracket | Male | Female |
| 5 to 17 Years | 0 (0.0%) | 0 (0.0%) |
| 18 to 34 Years | 0 (0.0%) | 0 (0.0%) |
| 35 to 64 Years | 0 (0.0%) | 2 (3.3%) |
| 65 to 74 Years | 0 (0.0%) | 0 (0.0%) |
| 75 Years and over | 0 (0.0%) | 0 (0.0%) |
Technology Access in Canton
Computing Device Access in Canton
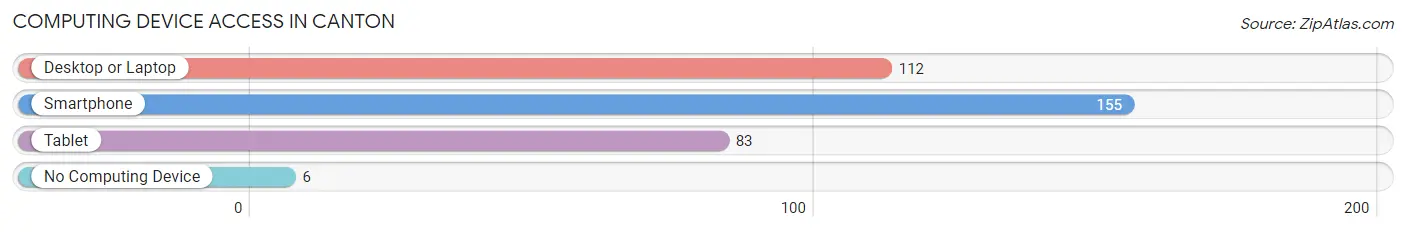
| Device Type | # Households | % Households |
| Desktop or Laptop | 112 | 62.6% |
| Smartphone | 155 | 86.6% |
| Tablet | 83 | 46.4% |
| No Computing Device | 6 | 3.4% |
| Total | 179 | 100.0% |
Internet Access in Canton
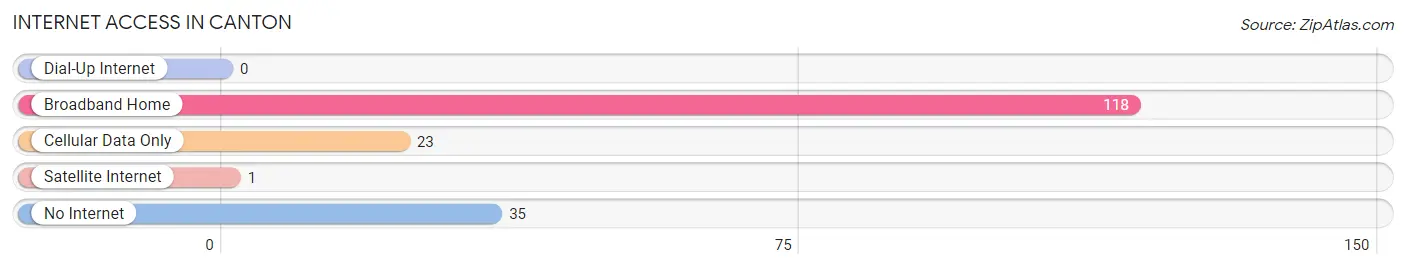
| Internet Type | # Households | % Households |
| Dial-Up Internet | 0 | 0.0% |
| Broadband Home | 118 | 65.9% |
| Cellular Data Only | 23 | 12.9% |
| Satellite Internet | 1 | 0.6% |
| No Internet | 35 | 19.6% |
| Total | 179 | 100.0% |
Canton Summary
Canton, Oklahoma is a small town located in the northwest corner of the state, near the Kansas border. It is part of the Cherokee Nation and is home to a population of just over 1,000 people. The town was founded in 1891 and has a rich history of Native American culture and heritage.
Geography
Canton is located in the northwest corner of Oklahoma, near the Kansas border. It is part of the Cherokee Nation and is situated in the foothills of the Ozark Mountains. The town is located on the banks of the Arkansas River and is surrounded by rolling hills and lush forests. The climate in Canton is mild, with hot summers and cold winters.
Economy
Canton’s economy is largely based on agriculture and tourism. The town is home to several farms and ranches, as well as a number of small businesses. Tourism is also an important part of the local economy, with visitors coming to the area to enjoy the natural beauty and outdoor activities.
Demographics
As of the 2010 census, the population of Canton was 1,072. The racial makeup of the town was 95.3% White, 0.7% African American, 0.7% Native American, 0.2% Asian, 0.1% Pacific Islander, and 2.1% from two or more races. The median household income was $30,938, and the median family income was $37,500.
History
Canton was founded in 1891 by a group of settlers from Arkansas. The town was named after Canton, Arkansas, and was originally intended to be a trading post for the Cherokee Nation. The town quickly grew and by the early 1900s, it had become a thriving community.
In the early 1900s, Canton was a popular destination for tourists, who came to enjoy the natural beauty of the area. The town was also home to a number of businesses, including a hotel, a general store, and a blacksmith shop.
In the 1920s, Canton was hit hard by the Great Depression. Many of the businesses in town closed, and the population declined. However, the town was able to recover and by the 1950s, it had become a popular tourist destination once again.
Today, Canton is a small, rural town with a population of just over 1,000 people. The town is still home to a number of businesses, including a hotel, a general store, and a blacksmith shop. The town is also home to a number of historic sites, including the Canton Museum and the Canton Historical Society.
Canton is a small town with a rich history and a bright future. The town is home to a diverse population and is a great place to visit or live. With its beautiful scenery and friendly people, Canton is a great place to call home.
Common Questions
What is Per Capita Income in Canton?
Per Capita income in Canton is $23,316.
What is the Median Family Income in Canton?
Median Family Income in Canton is $65,375.
What is the Median Household income in Canton?
Median Household Income in Canton is $59,297.
What is Income or Wage Gap in Canton?
Income or Wage Gap in Canton is 49.5%.
Women in Canton earn 50.5 cents for every dollar earned by a man.
What is Inequality or Gini Index in Canton?
Inequality or Gini Index in Canton is 0.33.
What is the Total Population of Canton?
Total Population of Canton is 520.
What is the Total Male Population of Canton?
Total Male Population of Canton is 226.
What is the Total Female Population of Canton?
Total Female Population of Canton is 294.
What is the Ratio of Males per 100 Females in Canton?
There are 76.87 Males per 100 Females in Canton.
What is the Ratio of Females per 100 Males in Canton?
There are 130.09 Females per 100 Males in Canton.
What is the Median Population Age in Canton?
Median Population Age in Canton is 26.0 Years.
What is the Average Family Size in Canton
Average Family Size in Canton is 3.9 People.
What is the Average Household Size in Canton
Average Household Size in Canton is 2.9 People.
How Large is the Labor Force in Canton?
There are 184 People in the Labor Forcein in Canton.
What is the Percentage of People in the Labor Force in Canton?
52.0% of People are in the Labor Force in Canton.
What is the Unemployment Rate in Canton?
Unemployment Rate in Canton is 18.5%.