Fort Supply, OK Map & Demographics
Fort Supply Map
Fort Supply Overview
$28,500
PER CAPITA INCOME
$70,481
AVG FAMILY INCOME
$59,375
AVG HOUSEHOLD INCOME
32.6%
WAGE / INCOME GAP [ % ]
67.4¢/ $1
WAGE / INCOME GAP [ $ ]
0.38
INEQUALITY / GINI INDEX
324
TOTAL POPULATION
138
MALE POPULATION
186
FEMALE POPULATION
74.19
MALES / 100 FEMALES
134.78
FEMALES / 100 MALES
31.7
MEDIAN AGE
3.2
AVG FAMILY SIZE
3.0
AVG HOUSEHOLD SIZE
165
LABOR FORCE [ PEOPLE ]
66.3%
PERCENT IN LABOR FORCE
10.3%
UNEMPLOYMENT RATE
Fort Supply Zip Codes
Fort Supply Area Codes
Income in Fort Supply
Income Overview in Fort Supply
Per Capita Income in Fort Supply is $28,500, while median incomes of families and households are $70,481 and $59,375 respectively.
| Characteristic | Number | Measure |
| Per Capita Income | 324 | $28,500 |
| Median Family Income | 91 | $70,481 |
| Mean Family Income | 91 | $78,013 |
| Median Household Income | 105 | $59,375 |
| Mean Household Income | 105 | $73,795 |
| Income Deficit | 91 | $0 |
| Wage / Income Gap (%) | 324 | 32.63% |
| Wage / Income Gap ($) | 324 | 67.37¢ per $1 |
| Gini / Inequality Index | 324 | 0.38 |
Earnings by Sex in Fort Supply
Average Earnings in Fort Supply are $50,938, $57,981 for men and $39,063 for women, a difference of 32.6%.
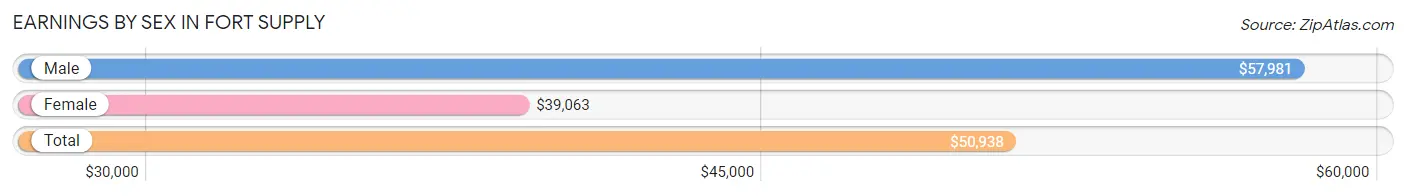
| Sex | Number | Average Earnings |
| Male | 79 (50.0%) | $57,981 |
| Female | 79 (50.0%) | $39,063 |
| Total | 158 (100.0%) | $50,938 |
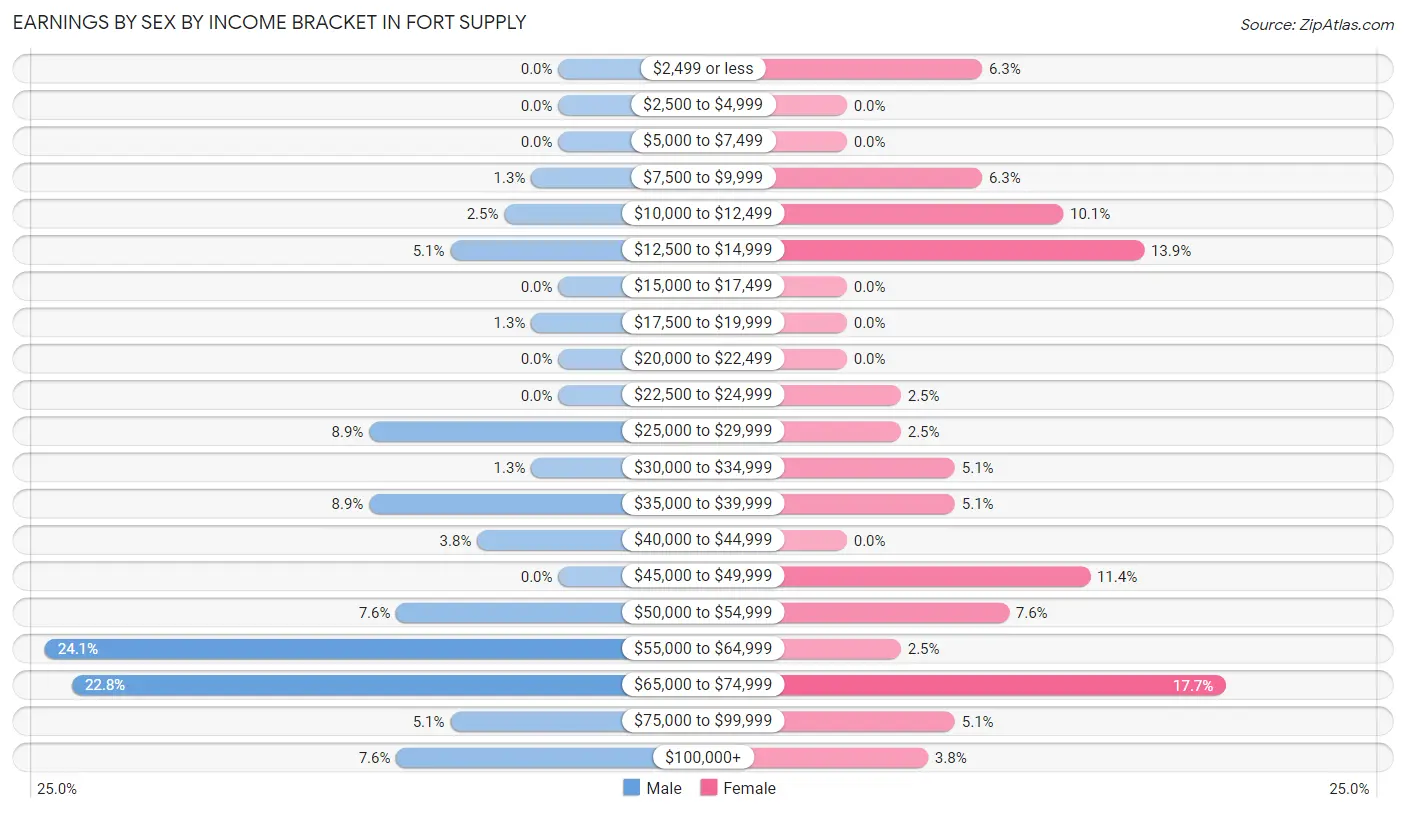
Earnings by Sex by Income Bracket in Fort Supply
The most common earnings brackets in Fort Supply are $55,000 to $64,999 for men (19 | 24.0%) and $65,000 to $74,999 for women (14 | 17.7%).
| Income | Male | Female |
| $2,499 or less | 0 (0.0%) | 5 (6.3%) |
| $2,500 to $4,999 | 0 (0.0%) | 0 (0.0%) |
| $5,000 to $7,499 | 0 (0.0%) | 0 (0.0%) |
| $7,500 to $9,999 | 1 (1.3%) | 5 (6.3%) |
| $10,000 to $12,499 | 2 (2.5%) | 8 (10.1%) |
| $12,500 to $14,999 | 4 (5.1%) | 11 (13.9%) |
| $15,000 to $17,499 | 0 (0.0%) | 0 (0.0%) |
| $17,500 to $19,999 | 1 (1.3%) | 0 (0.0%) |
| $20,000 to $22,499 | 0 (0.0%) | 0 (0.0%) |
| $22,500 to $24,999 | 0 (0.0%) | 2 (2.5%) |
| $25,000 to $29,999 | 7 (8.9%) | 2 (2.5%) |
| $30,000 to $34,999 | 1 (1.3%) | 4 (5.1%) |
| $35,000 to $39,999 | 7 (8.9%) | 4 (5.1%) |
| $40,000 to $44,999 | 3 (3.8%) | 0 (0.0%) |
| $45,000 to $49,999 | 0 (0.0%) | 9 (11.4%) |
| $50,000 to $54,999 | 6 (7.6%) | 6 (7.6%) |
| $55,000 to $64,999 | 19 (24.0%) | 2 (2.5%) |
| $65,000 to $74,999 | 18 (22.8%) | 14 (17.7%) |
| $75,000 to $99,999 | 4 (5.1%) | 4 (5.1%) |
| $100,000+ | 6 (7.6%) | 3 (3.8%) |
| Total | 79 (100.0%) | 79 (100.0%) |
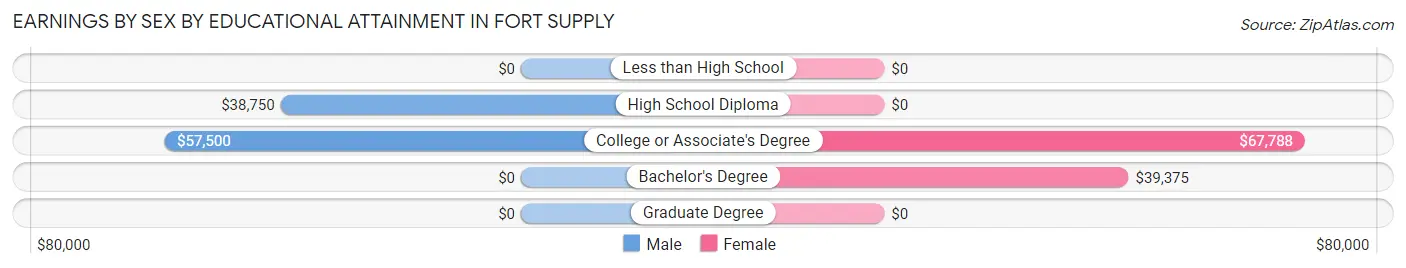
Earnings by Sex by Educational Attainment in Fort Supply
Average earnings in Fort Supply are $52,083 for men and $45,694 for women, a difference of 12.3%. Men with an educational attainment of college or associate's degree enjoy the highest average annual earnings of $57,500, while those with high school diploma education earn the least with $38,750. Women with an educational attainment of college or associate's degree earn the most with the average annual earnings of $67,788, while those with bachelor's degree education have the smallest earnings of $39,375.
| Educational Attainment | Male Income | Female Income |
| Less than High School | - | - |
| High School Diploma | $38,750 | $0 |
| College or Associate's Degree | $57,500 | $67,788 |
| Bachelor's Degree | - | - |
| Graduate Degree | - | - |
| Total | $52,083 | $45,694 |
Family Income in Fort Supply
Family Income Brackets in Fort Supply
According to the Fort Supply family income data, there are 24 families falling into the $50,000 to $74,999 income range, which is the most common income bracket and makes up 26.4% of all families. Conversely, the less than $10,000 income bracket is the least frequent group with only 2 families (2.2%) belonging to this category.
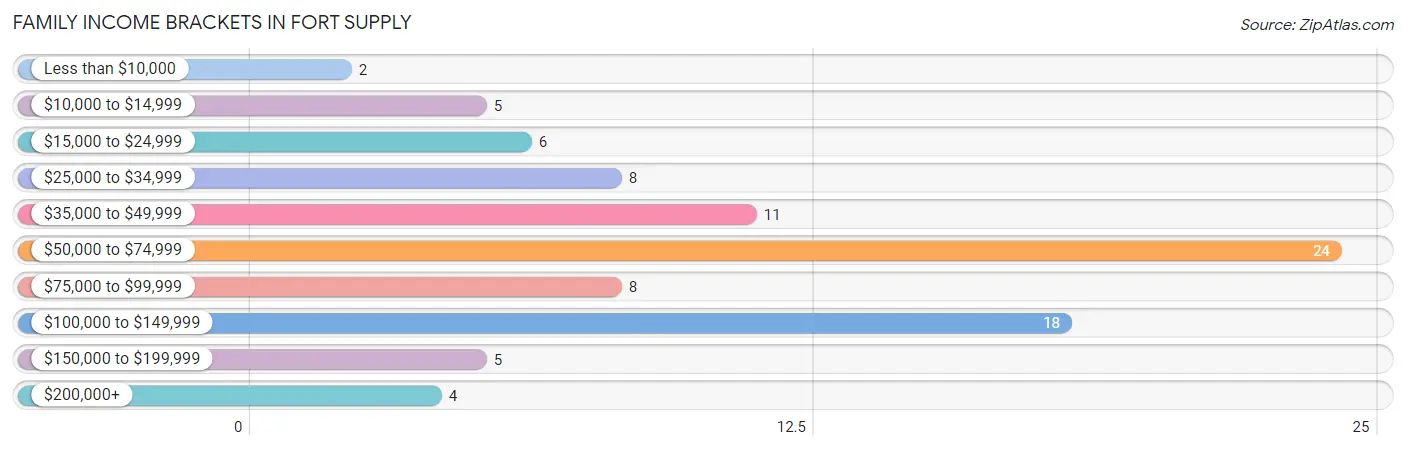
| Income Bracket | # Families | % Families |
| Less than $10,000 | 2 | 2.2% |
| $10,000 to $14,999 | 5 | 5.5% |
| $15,000 to $24,999 | 6 | 6.6% |
| $25,000 to $34,999 | 8 | 8.8% |
| $35,000 to $49,999 | 11 | 12.1% |
| $50,000 to $74,999 | 24 | 26.4% |
| $75,000 to $99,999 | 8 | 8.8% |
| $100,000 to $149,999 | 18 | 19.8% |
| $150,000 to $199,999 | 5 | 5.5% |
| $200,000+ | 4 | 4.4% |
Family Income by Famaliy Size in Fort Supply
4-person families (11 | 12.1%) account for the highest median family income in Fort Supply with $120,536 per family, while 4-person families (11 | 12.1%) have the highest median income of $30,134 per family member.
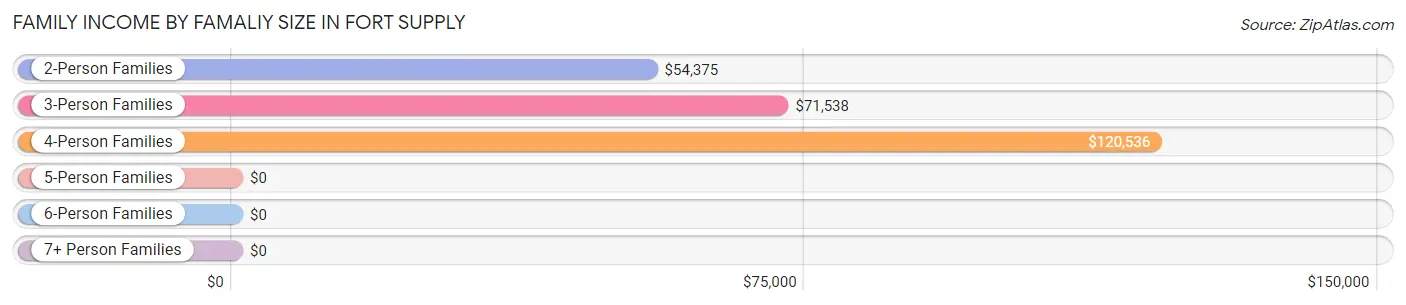
| Income Bracket | # Families | Median Income |
| 2-Person Families | 41 (45.1%) | $54,375 |
| 3-Person Families | 32 (35.2%) | $71,538 |
| 4-Person Families | 11 (12.1%) | $120,536 |
| 5-Person Families | 0 (0.0%) | $0 |
| 6-Person Families | 2 (2.2%) | $0 |
| 7+ Person Families | 5 (5.5%) | $0 |
| Total | 91 (100.0%) | $70,481 |
Family Income by Number of Earners in Fort Supply
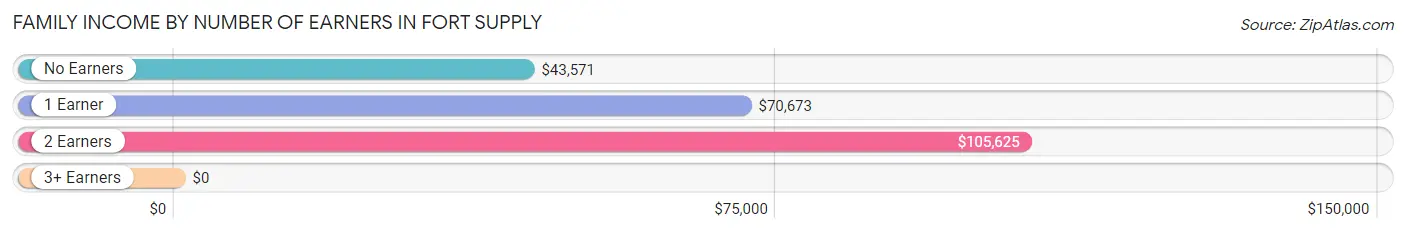
| Number of Earners | # Families | Median Income |
| No Earners | 22 (24.2%) | $43,571 |
| 1 Earner | 31 (34.1%) | $70,673 |
| 2 Earners | 29 (31.9%) | $105,625 |
| 3+ Earners | 9 (9.9%) | $0 |
| Total | 91 (100.0%) | $70,481 |
Household Income in Fort Supply
Household Income Brackets in Fort Supply
With 26 households falling in the category, the $50,000 to $74,999 income range is the most frequent in Fort Supply, accounting for 24.8% of all households. In contrast, only 2 households (1.9%) fall into the less than $10,000 income bracket, making it the least populous group.
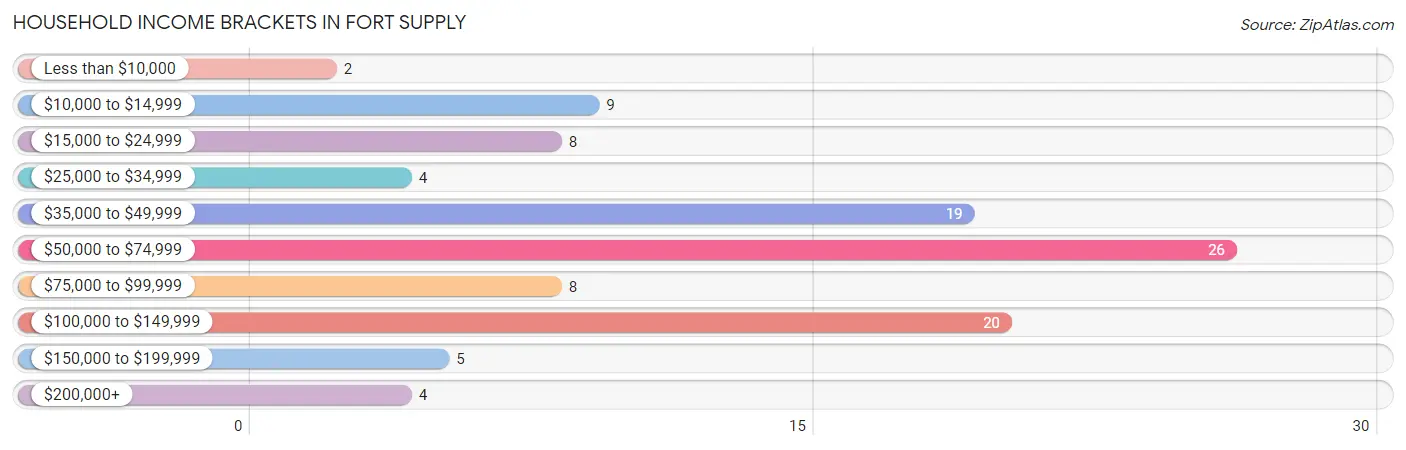
| Income Bracket | # Households | % Households |
| Less than $10,000 | 2 | 1.9% |
| $10,000 to $14,999 | 9 | 8.6% |
| $15,000 to $24,999 | 8 | 7.6% |
| $25,000 to $34,999 | 4 | 3.8% |
| $35,000 to $49,999 | 19 | 18.1% |
| $50,000 to $74,999 | 26 | 24.8% |
| $75,000 to $99,999 | 8 | 7.6% |
| $100,000 to $149,999 | 20 | 19.0% |
| $150,000 to $199,999 | 5 | 4.8% |
| $200,000+ | 4 | 3.8% |
Household Income by Householder Age in Fort Supply
The median household income in Fort Supply is $59,375, with the highest median household income of $72,404 found in the 45 to 64 years age bracket for the primary householder. A total of 47 households (44.8%) fall into this category. Meanwhile, the 15 to 24 years age bracket for the primary householder has the lowest median household income of $0, with 2 households (1.9%) in this group.
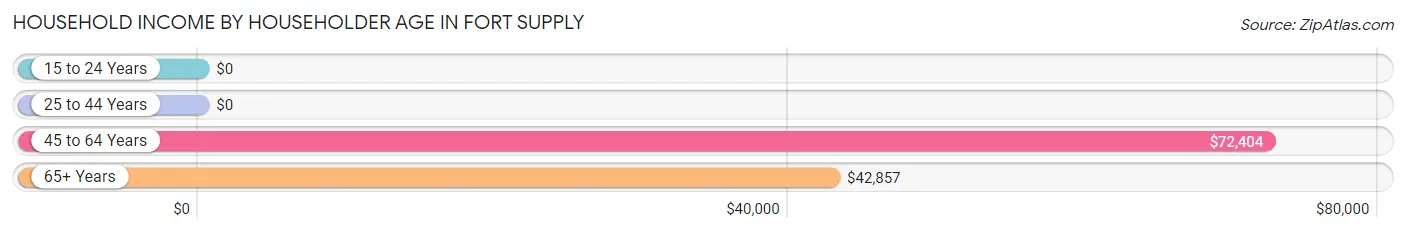
| Income Bracket | # Households | Median Income |
| 15 to 24 Years | 2 (1.9%) | $0 |
| 25 to 44 Years | 26 (24.8%) | $0 |
| 45 to 64 Years | 47 (44.8%) | $72,404 |
| 65+ Years | 30 (28.6%) | $42,857 |
| Total | 105 (100.0%) | $59,375 |
Poverty in Fort Supply
Income Below Poverty by Sex and Age in Fort Supply
With 13.0% poverty level for males and 25.3% for females among the residents of Fort Supply, 75 year old and over males and 6 to 11 year old females are the most vulnerable to poverty, with 6 males (35.3%) and 16 females (76.2%) in their respective age groups living below the poverty level.
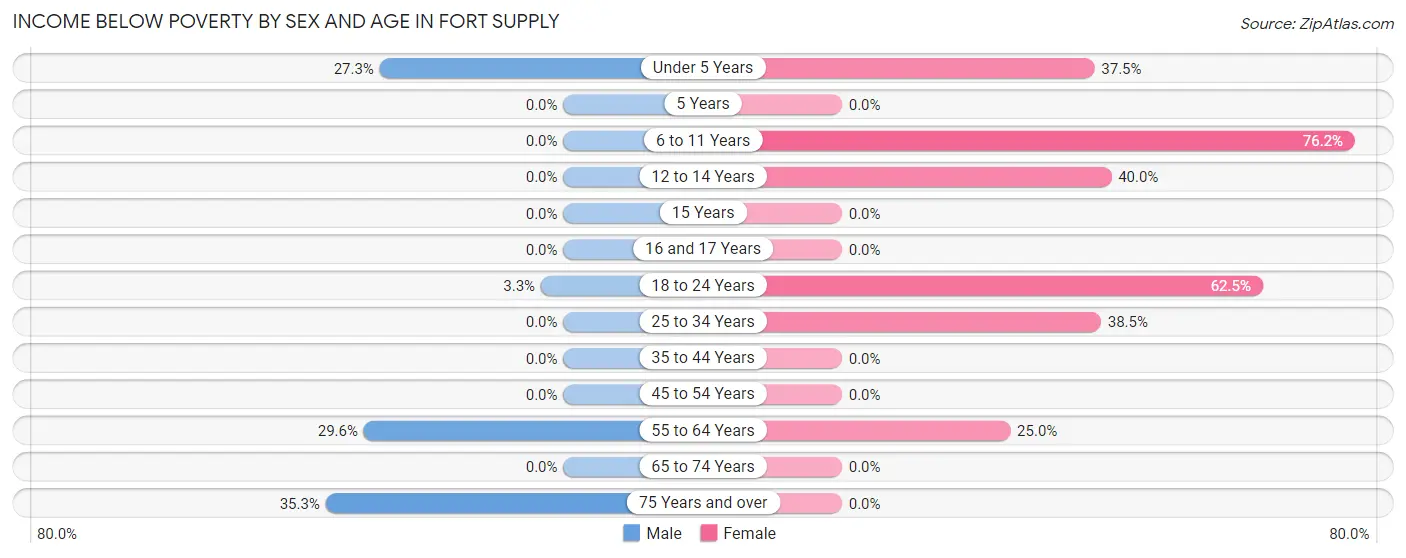
| Age Bracket | Male | Female |
| Under 5 Years | 3 (27.3%) | 3 (37.5%) |
| 5 Years | 0 (0.0%) | 0 (0.0%) |
| 6 to 11 Years | 0 (0.0%) | 16 (76.2%) |
| 12 to 14 Years | 0 (0.0%) | 8 (40.0%) |
| 15 Years | 0 (0.0%) | 0 (0.0%) |
| 16 and 17 Years | 0 (0.0%) | 0 (0.0%) |
| 18 to 24 Years | 1 (3.3%) | 5 (62.5%) |
| 25 to 34 Years | 0 (0.0%) | 10 (38.5%) |
| 35 to 44 Years | 0 (0.0%) | 0 (0.0%) |
| 45 to 54 Years | 0 (0.0%) | 0 (0.0%) |
| 55 to 64 Years | 8 (29.6%) | 4 (25.0%) |
| 65 to 74 Years | 0 (0.0%) | 0 (0.0%) |
| 75 Years and over | 6 (35.3%) | 0 (0.0%) |
| Total | 18 (13.0%) | 46 (25.3%) |
Income Above Poverty by Sex and Age in Fort Supply
According to the poverty statistics in Fort Supply, males aged 6 to 11 years and females aged 15 years are the age groups that are most secure financially, with 100.0% of males and 100.0% of females in these age groups living above the poverty line.
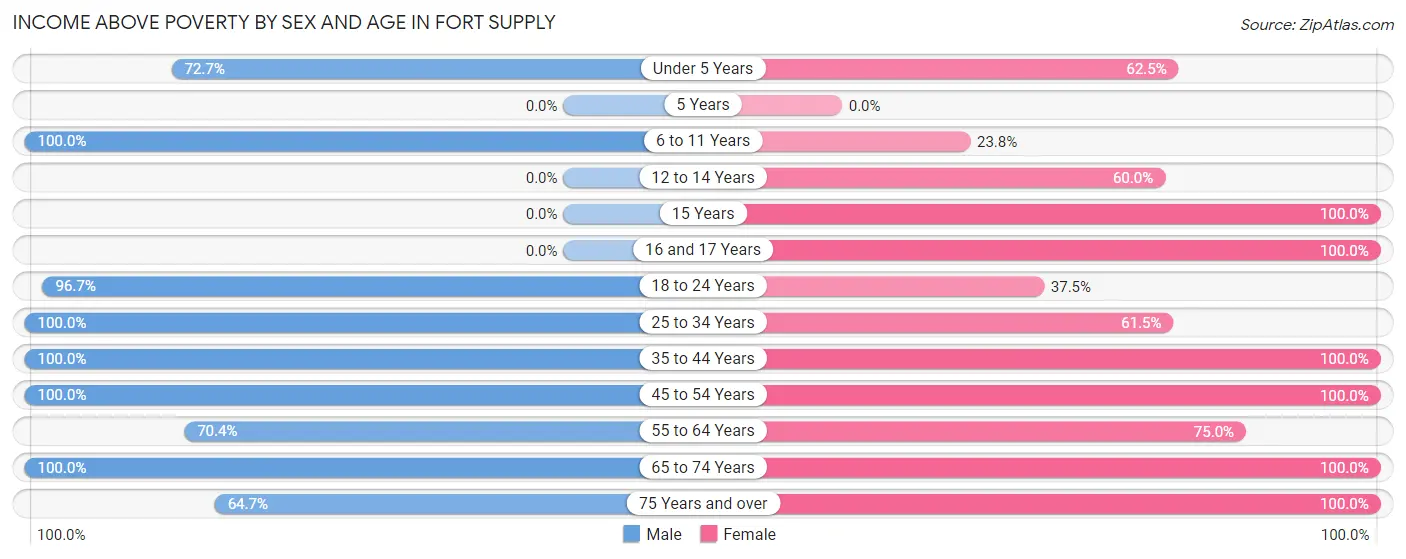
| Age Bracket | Male | Female |
| Under 5 Years | 8 (72.7%) | 5 (62.5%) |
| 5 Years | 0 (0.0%) | 0 (0.0%) |
| 6 to 11 Years | 5 (100.0%) | 5 (23.8%) |
| 12 to 14 Years | 0 (0.0%) | 12 (60.0%) |
| 15 Years | 0 (0.0%) | 10 (100.0%) |
| 16 and 17 Years | 0 (0.0%) | 17 (100.0%) |
| 18 to 24 Years | 29 (96.7%) | 3 (37.5%) |
| 25 to 34 Years | 15 (100.0%) | 16 (61.5%) |
| 35 to 44 Years | 12 (100.0%) | 2 (100.0%) |
| 45 to 54 Years | 12 (100.0%) | 33 (100.0%) |
| 55 to 64 Years | 19 (70.4%) | 12 (75.0%) |
| 65 to 74 Years | 9 (100.0%) | 10 (100.0%) |
| 75 Years and over | 11 (64.7%) | 11 (100.0%) |
| Total | 120 (87.0%) | 136 (74.7%) |
Income Below Poverty Among Married-Couple Families in Fort Supply
The poverty statistics for married-couple families in Fort Supply show that 3.8% or 2 of the total 53 families live below the poverty line. Families with no children have the highest poverty rate of 5.9%, comprising of 2 families. On the other hand, families with 1 or 2 children have the lowest poverty rate of 0.0%, which includes 0 families.
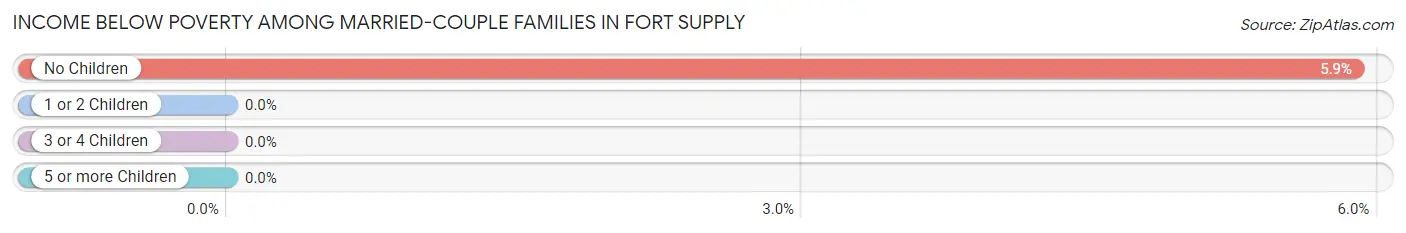
| Children | Above Poverty | Below Poverty |
| No Children | 32 (94.1%) | 2 (5.9%) |
| 1 or 2 Children | 19 (100.0%) | 0 (0.0%) |
| 3 or 4 Children | 0 (0.0%) | 0 (0.0%) |
| 5 or more Children | 0 (0.0%) | 0 (0.0%) |
| Total | 51 (96.2%) | 2 (3.8%) |
Income Below Poverty Among Single-Parent Households in Fort Supply
According to the poverty data in Fort Supply, 54.5% or 6 single-father households and 18.5% or 5 single-mother households are living below the poverty line. Among single-father households, those with no children have the highest poverty rate, with 6 households (100.0%) experiencing poverty. Likewise, among single-mother households, those with 5 or more children have the highest poverty rate, with 5 households (100.0%) falling below the poverty line.
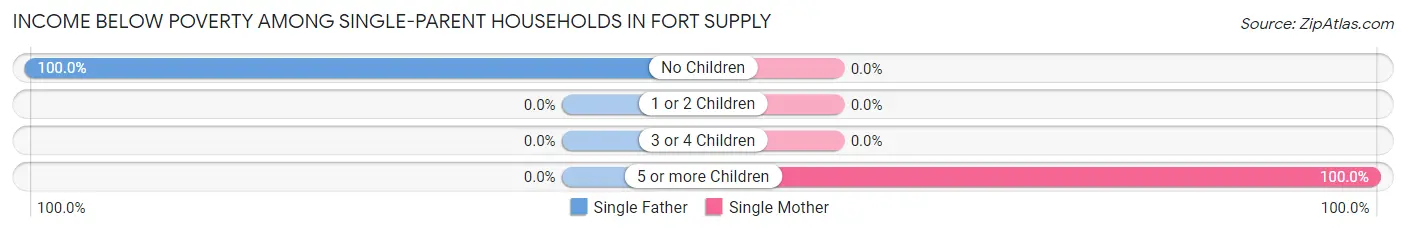
| Children | Single Father | Single Mother |
| No Children | 6 (100.0%) | 0 (0.0%) |
| 1 or 2 Children | 0 (0.0%) | 0 (0.0%) |
| 3 or 4 Children | 0 (0.0%) | 0 (0.0%) |
| 5 or more Children | 0 (0.0%) | 5 (100.0%) |
| Total | 6 (54.5%) | 5 (18.5%) |
Income Below Poverty Among Married-Couple vs Single-Parent Households in Fort Supply
The poverty data for Fort Supply shows that 2 of the married-couple family households (3.8%) and 11 of the single-parent households (28.9%) are living below the poverty level. Within the married-couple family households, those with no children have the highest poverty rate, with 2 households (5.9%) falling below the poverty line. Among the single-parent households, those with 5 or more children have the highest poverty rate, with 5 household (100.0%) living below poverty.
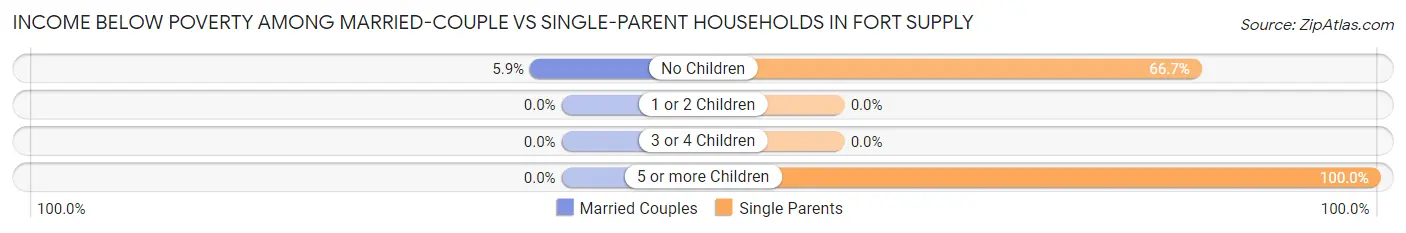
| Children | Married-Couple Families | Single-Parent Households |
| No Children | 2 (5.9%) | 6 (66.7%) |
| 1 or 2 Children | 0 (0.0%) | 0 (0.0%) |
| 3 or 4 Children | 0 (0.0%) | 0 (0.0%) |
| 5 or more Children | 0 (0.0%) | 5 (100.0%) |
| Total | 2 (3.8%) | 11 (28.9%) |
Race in Fort Supply
The most populous races in Fort Supply are White / Caucasian (305 | 94.1%), Hispanic or Latino (39 | 12.0%), and Two or more Races (10 | 3.1%).
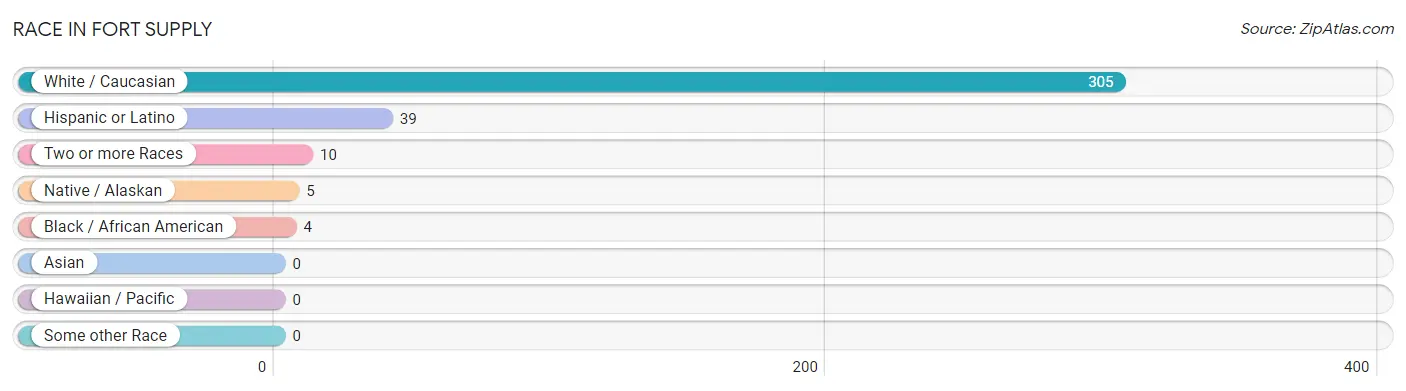
| Race | # Population | % Population |
| Asian | 0 | 0.0% |
| Black / African American | 4 | 1.2% |
| Hawaiian / Pacific | 0 | 0.0% |
| Hispanic or Latino | 39 | 12.0% |
| Native / Alaskan | 5 | 1.5% |
| White / Caucasian | 305 | 94.1% |
| Two or more Races | 10 | 3.1% |
| Some other Race | 0 | 0.0% |
| Total | 324 | 100.0% |
Ancestry in Fort Supply
The most populous ancestries reported in Fort Supply are German (80 | 24.7%), French (57 | 17.6%), Mexican (39 | 12.0%), English (25 | 7.7%), and Irish (13 | 4.0%), together accounting for 66.1% of all Fort Supply residents.
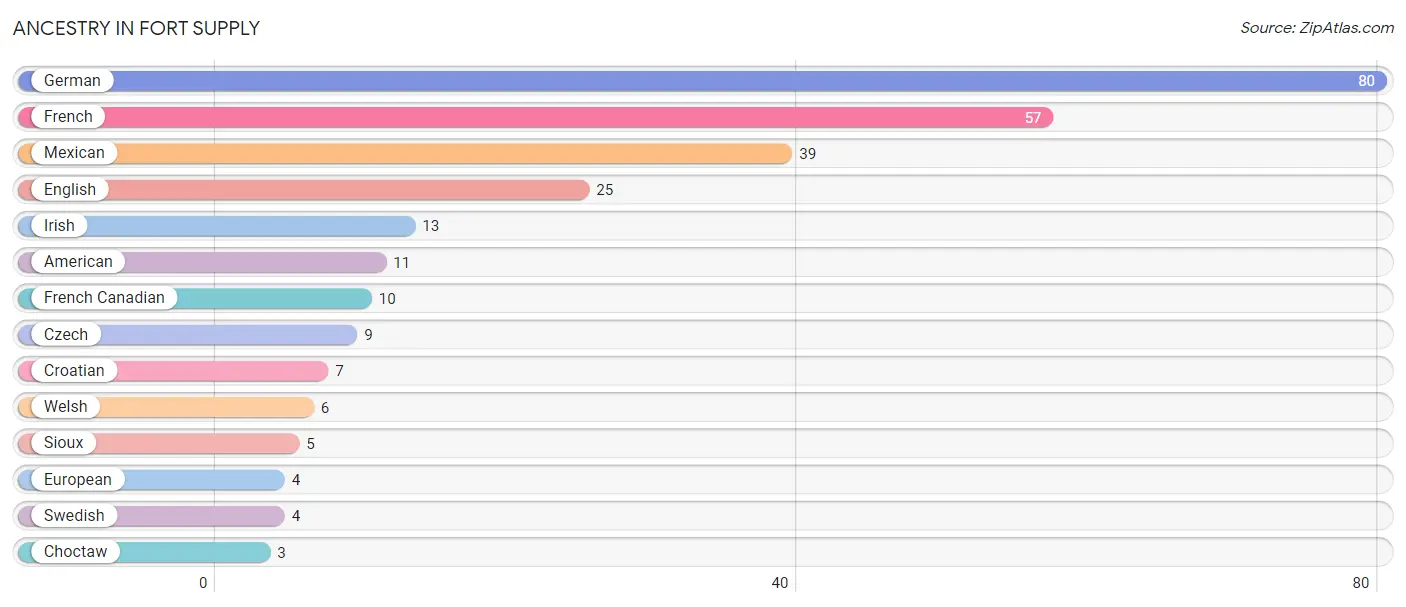
| Ancestry | # Population | % Population |
| American | 11 | 3.4% |
| Choctaw | 3 | 0.9% |
| Croatian | 7 | 2.2% |
| Czech | 9 | 2.8% |
| English | 25 | 7.7% |
| European | 4 | 1.2% |
| French | 57 | 17.6% |
| French Canadian | 10 | 3.1% |
| German | 80 | 24.7% |
| Irish | 13 | 4.0% |
| Mexican | 39 | 12.0% |
| Sioux | 5 | 1.5% |
| Swedish | 4 | 1.2% |
| Welsh | 6 | 1.8% | View All 14 Rows |
Immigrants in Fort Supply

| Immigration Origin | # Population | % Population | View All 0 Rows |
Sex and Age in Fort Supply
Sex and Age in Fort Supply
The most populous age groups in Fort Supply are 20 to 24 Years (24 | 17.4%) for men and 15 to 19 Years (32 | 17.2%) for women.
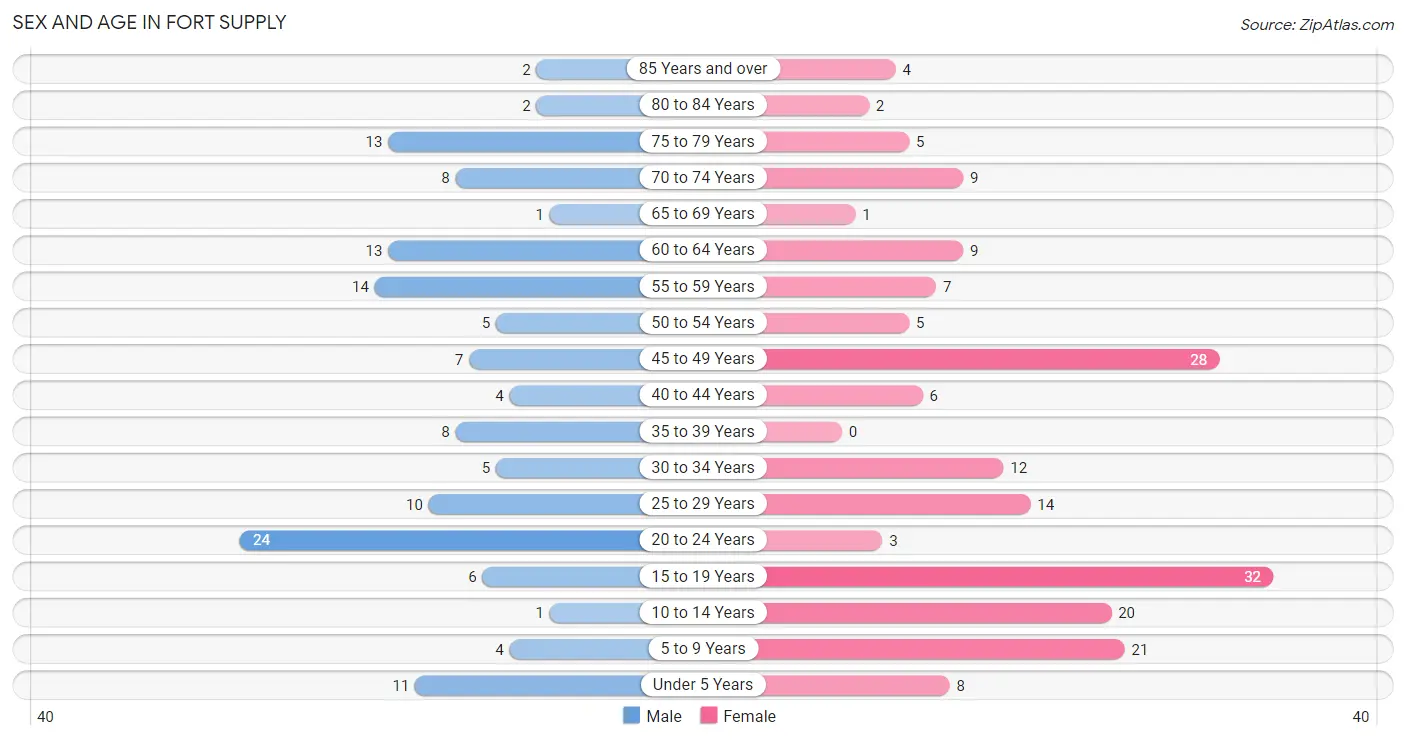
| Age Bracket | Male | Female |
| Under 5 Years | 11 (8.0%) | 8 (4.3%) |
| 5 to 9 Years | 4 (2.9%) | 21 (11.3%) |
| 10 to 14 Years | 1 (0.7%) | 20 (10.7%) |
| 15 to 19 Years | 6 (4.3%) | 32 (17.2%) |
| 20 to 24 Years | 24 (17.4%) | 3 (1.6%) |
| 25 to 29 Years | 10 (7.2%) | 14 (7.5%) |
| 30 to 34 Years | 5 (3.6%) | 12 (6.5%) |
| 35 to 39 Years | 8 (5.8%) | 0 (0.0%) |
| 40 to 44 Years | 4 (2.9%) | 6 (3.2%) |
| 45 to 49 Years | 7 (5.1%) | 28 (15.0%) |
| 50 to 54 Years | 5 (3.6%) | 5 (2.7%) |
| 55 to 59 Years | 14 (10.1%) | 7 (3.8%) |
| 60 to 64 Years | 13 (9.4%) | 9 (4.8%) |
| 65 to 69 Years | 1 (0.7%) | 1 (0.5%) |
| 70 to 74 Years | 8 (5.8%) | 9 (4.8%) |
| 75 to 79 Years | 13 (9.4%) | 5 (2.7%) |
| 80 to 84 Years | 2 (1.5%) | 2 (1.1%) |
| 85 Years and over | 2 (1.5%) | 4 (2.1%) |
| Total | 138 (100.0%) | 186 (100.0%) |
Families and Households in Fort Supply
Median Family Size in Fort Supply
The median family size in Fort Supply is 3.25 persons per family, with single female/mother families (27 | 29.7%) accounting for the largest median family size of 3.41 persons per family. On the other hand, single male/father families (11 | 12.1%) represent the smallest median family size with 2.27 persons per family.
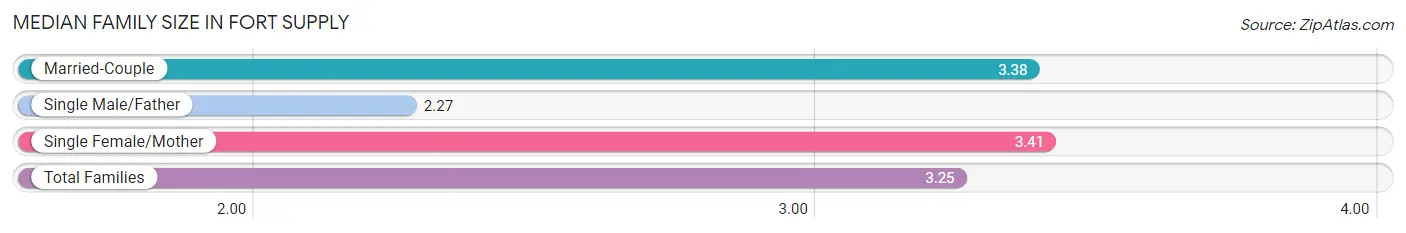
| Family Type | # Families | Family Size |
| Married-Couple | 53 (58.2%) | 3.38 |
| Single Male/Father | 11 (12.1%) | 2.27 |
| Single Female/Mother | 27 (29.7%) | 3.41 |
| Total Families | 91 (100.0%) | 3.25 |
Median Household Size in Fort Supply
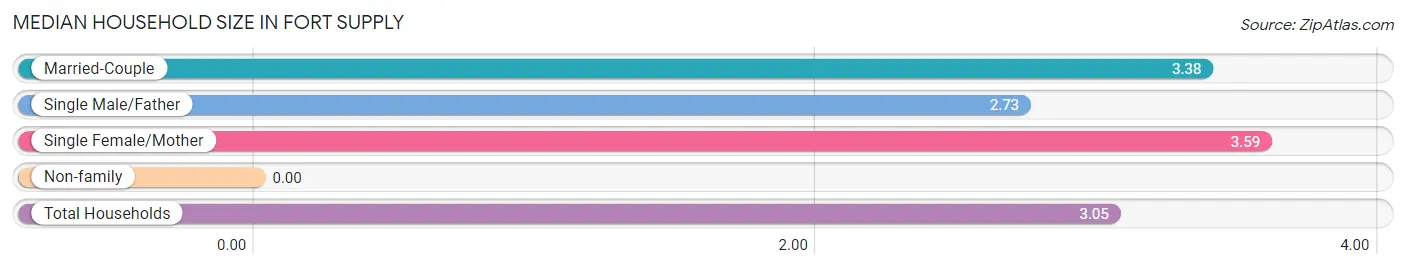
| Household Type | # Households | Household Size |
| Married-Couple | 53 (50.5%) | 3.38 |
| Single Male/Father | 11 (10.5%) | 2.73 |
| Single Female/Mother | 27 (25.7%) | 3.59 |
| Non-family | 14 (13.3%) | - |
| Total Households | 105 (100.0%) | 3.05 |
Household Size by Marriage Status in Fort Supply
Out of a total of 105 households in Fort Supply, 91 (86.7%) are family households, while 14 (13.3%) are nonfamily households. The most numerous type of family households are 3-person households, comprising 38, and the most common type of nonfamily households are 1-person households, comprising 14.
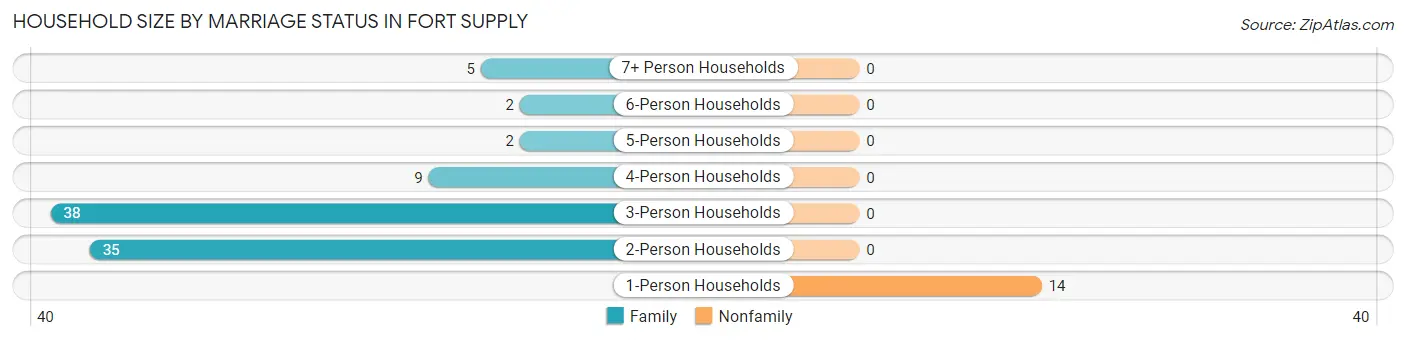
| Household Size | Family Households | Nonfamily Households |
| 1-Person Households | - | 14 (13.3%) |
| 2-Person Households | 35 (33.3%) | 0 (0.0%) |
| 3-Person Households | 38 (36.2%) | 0 (0.0%) |
| 4-Person Households | 9 (8.6%) | 0 (0.0%) |
| 5-Person Households | 2 (1.9%) | 0 (0.0%) |
| 6-Person Households | 2 (1.9%) | 0 (0.0%) |
| 7+ Person Households | 5 (4.8%) | 0 (0.0%) |
| Total | 91 (86.7%) | 14 (13.3%) |
Female Fertility in Fort Supply
Fertility by Age in Fort Supply
Average fertility rate in Fort Supply is 135.0 births per 1,000 women. Women in the age bracket of 20 to 34 years have the highest fertility rate with 448.0 births per 1,000 women. Women in the age bracket of 20 to 34 years acount for 100.0% of all women with births.
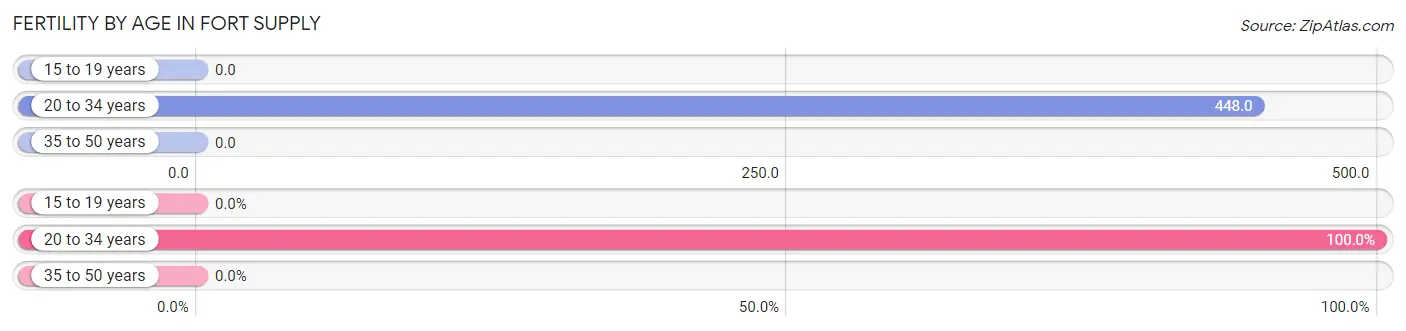
| Age Bracket | Women with Births | Births / 1,000 Women |
| 15 to 19 years | 0 (0.0%) | 0.0 |
| 20 to 34 years | 13 (100.0%) | 448.0 |
| 35 to 50 years | 0 (0.0%) | 0.0 |
| Total | 13 (100.0%) | 135.0 |
Fertility by Age by Marriage Status in Fort Supply
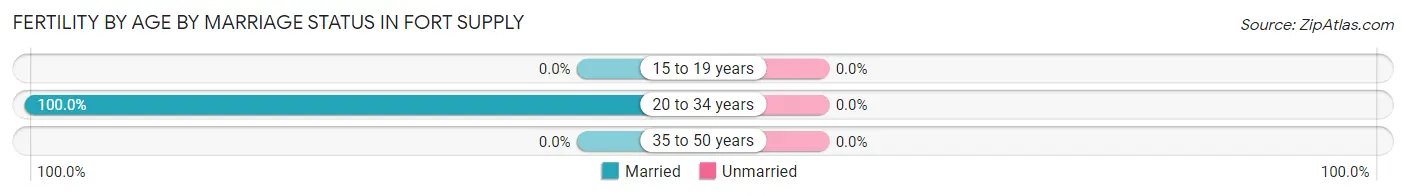
| Age Bracket | Married | Unmarried |
| 15 to 19 years | 0 (0.0%) | 0 (0.0%) |
| 20 to 34 years | 13 (100.0%) | 0 (0.0%) |
| 35 to 50 years | 0 (0.0%) | 0 (0.0%) |
| Total | 13 (100.0%) | 0 (0.0%) |
Fertility by Education in Fort Supply
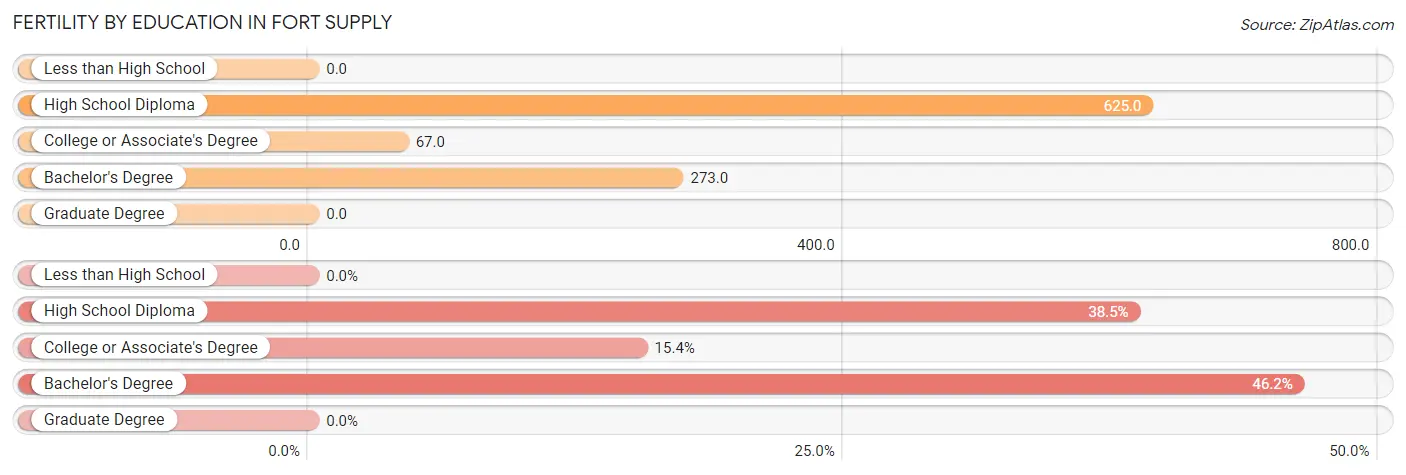
| Educational Attainment | Women with Births | Births / 1,000 Women |
| Less than High School | 0 (0.0%) | 0.0 |
| High School Diploma | 5 (38.5%) | 625.0 |
| College or Associate's Degree | 2 (15.4%) | 67.0 |
| Bachelor's Degree | 6 (46.2%) | 273.0 |
| Graduate Degree | 0 (0.0%) | 0.0 |
| Total | 13 (100.0%) | 135.0 |
Fertility by Education by Marriage Status in Fort Supply
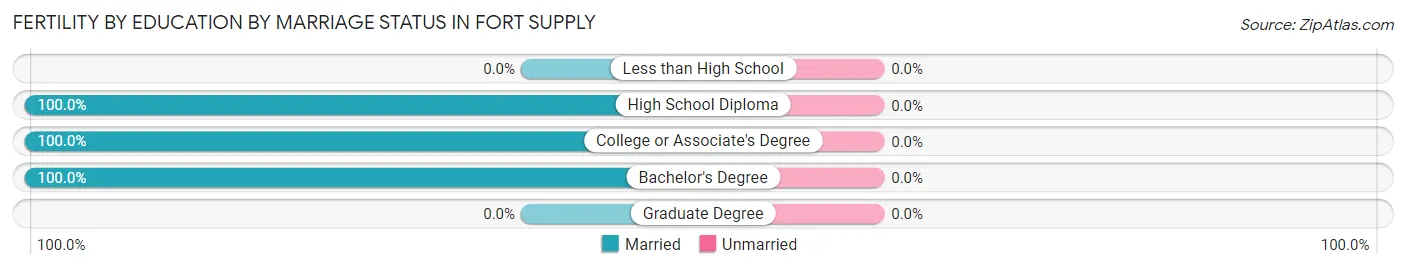
| Educational Attainment | Married | Unmarried |
| Less than High School | 0 (0.0%) | 0 (0.0%) |
| High School Diploma | 5 (100.0%) | 0 (0.0%) |
| College or Associate's Degree | 2 (100.0%) | 0 (0.0%) |
| Bachelor's Degree | 6 (100.0%) | 0 (0.0%) |
| Graduate Degree | 0 (0.0%) | 0 (0.0%) |
| Total | 13 (100.0%) | 0 (0.0%) |
Employment Characteristics in Fort Supply
Employment by Class of Employer in Fort Supply
Among the 139 employed individuals in Fort Supply, private company employees (87 | 62.6%), local government employees (24 | 17.3%), and state government employees (12 | 8.6%) make up the most common classes of employment.
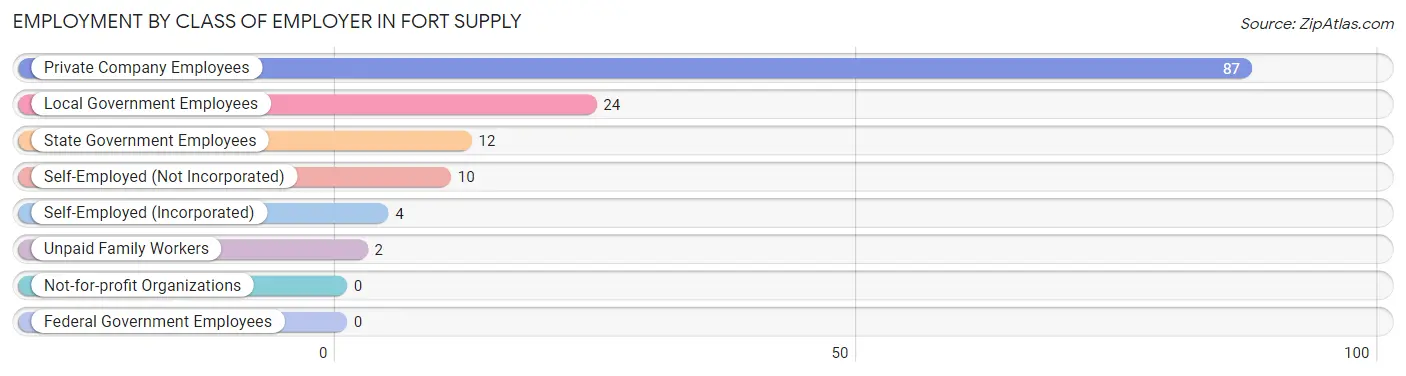
| Employer Class | # Employees | % Employees |
| Private Company Employees | 87 | 62.6% |
| Self-Employed (Incorporated) | 4 | 2.9% |
| Self-Employed (Not Incorporated) | 10 | 7.2% |
| Not-for-profit Organizations | 0 | 0.0% |
| Local Government Employees | 24 | 17.3% |
| State Government Employees | 12 | 8.6% |
| Federal Government Employees | 0 | 0.0% |
| Unpaid Family Workers | 2 | 1.4% |
| Total | 139 | 100.0% |
Employment Status by Age in Fort Supply
According to the labor force statistics for Fort Supply, out of the total population over 16 years of age (249), 66.3% or 165 individuals are in the labor force, with 10.3% or 17 of them unemployed. The age group with the highest labor force participation rate is 25 to 29 years, with 100.0% or 24 individuals in the labor force. Within the labor force, the 16 to 19 years age range has the highest percentage of unemployed individuals, with 77.3% or 17 of them being unemployed.
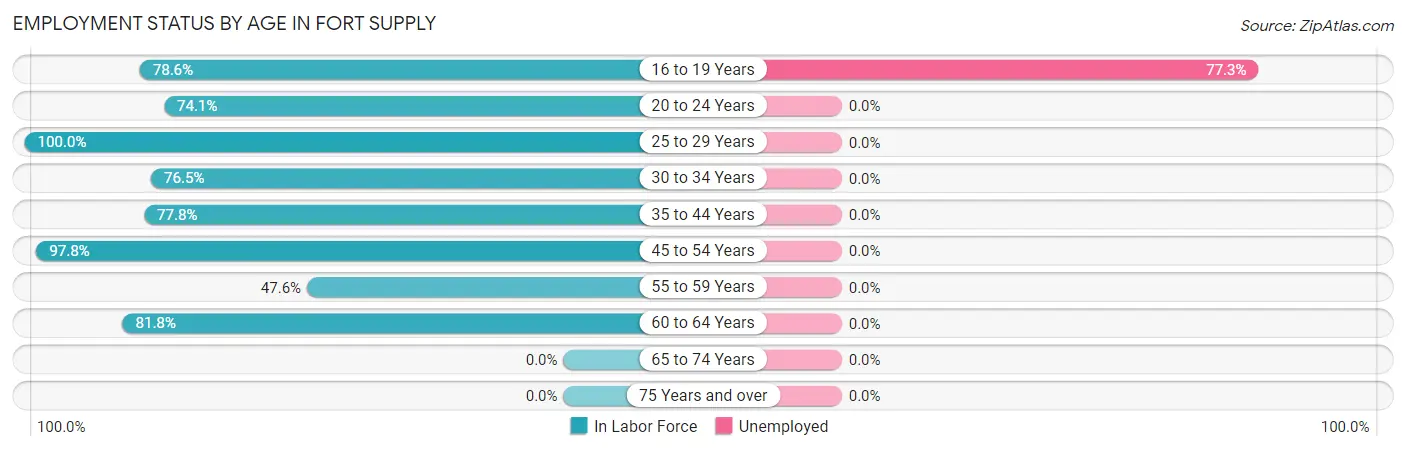
| Age Bracket | In Labor Force | Unemployed |
| 16 to 19 Years | 22 (78.6%) | 17 (77.3%) |
| 20 to 24 Years | 20 (74.1%) | 0 (0.0%) |
| 25 to 29 Years | 24 (100.0%) | 0 (0.0%) |
| 30 to 34 Years | 13 (76.5%) | 0 (0.0%) |
| 35 to 44 Years | 14 (77.8%) | 0 (0.0%) |
| 45 to 54 Years | 44 (97.8%) | 0 (0.0%) |
| 55 to 59 Years | 10 (47.6%) | 0 (0.0%) |
| 60 to 64 Years | 18 (81.8%) | 0 (0.0%) |
| 65 to 74 Years | 0 (0.0%) | 0 (0.0%) |
| 75 Years and over | 0 (0.0%) | 0 (0.0%) |
| Total | 165 (66.3%) | 17 (10.3%) |
Employment Status by Educational Attainment in Fort Supply
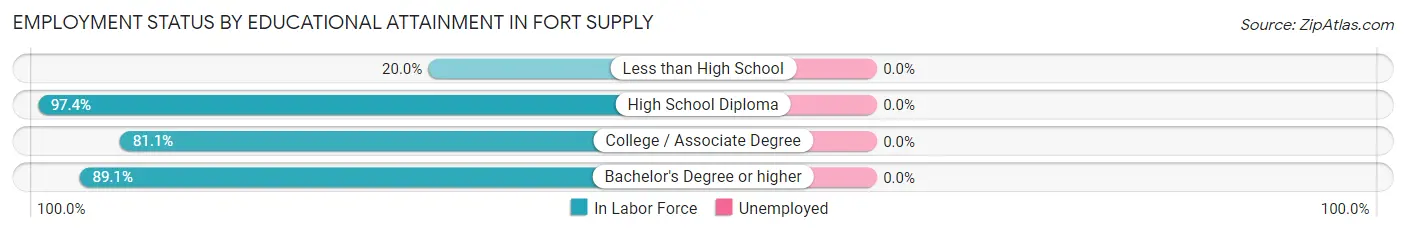
| Educational Attainment | In Labor Force | Unemployed |
| Less than High School | 2 (20.0%) | 0 (0.0%) |
| High School Diploma | 37 (97.4%) | 0 (0.0%) |
| College / Associate Degree | 43 (81.1%) | 0 (0.0%) |
| Bachelor's Degree or higher | 41 (89.1%) | 0 (0.0%) |
| Total | 123 (83.7%) | 0 (0.0%) |
Employment Occupations by Sex in Fort Supply
Management, Business, Science and Arts Occupations
The most common Management, Business, Science and Arts occupations in Fort Supply are Management (12 | 8.1%), Community & Social Service (12 | 8.1%), Education Instruction & Library (10 | 6.8%), Health Diagnosing & Treating (4 | 2.7%), and Education, Arts & Media (2 | 1.3%).
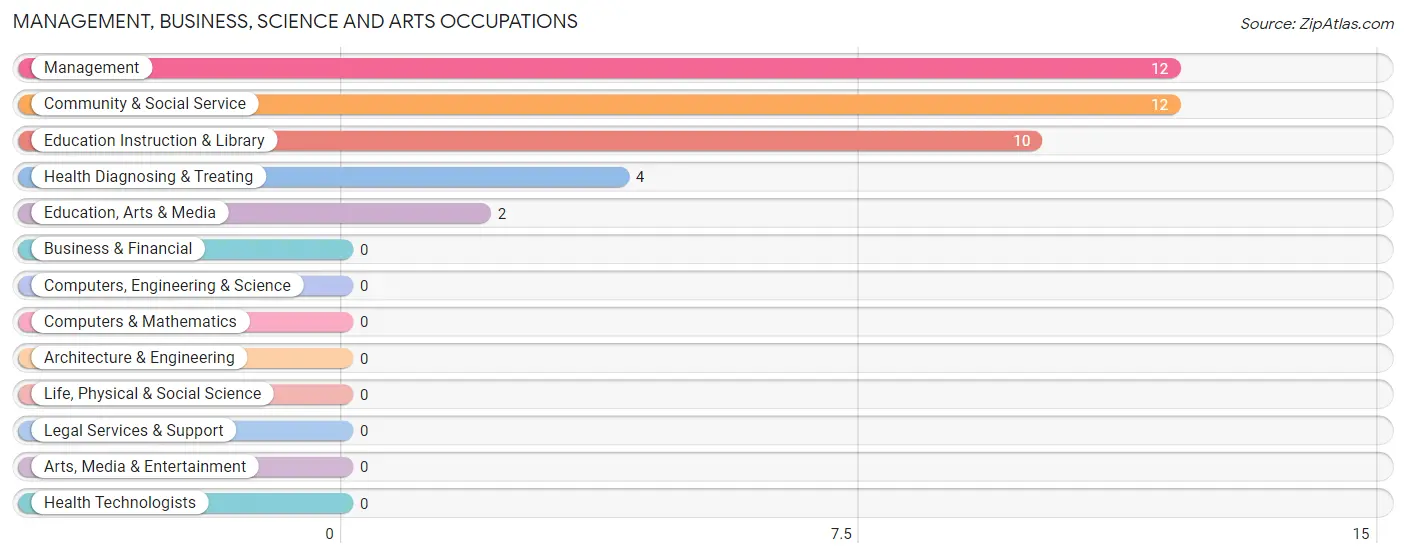
Management, Business, Science and Arts Occupations by Sex
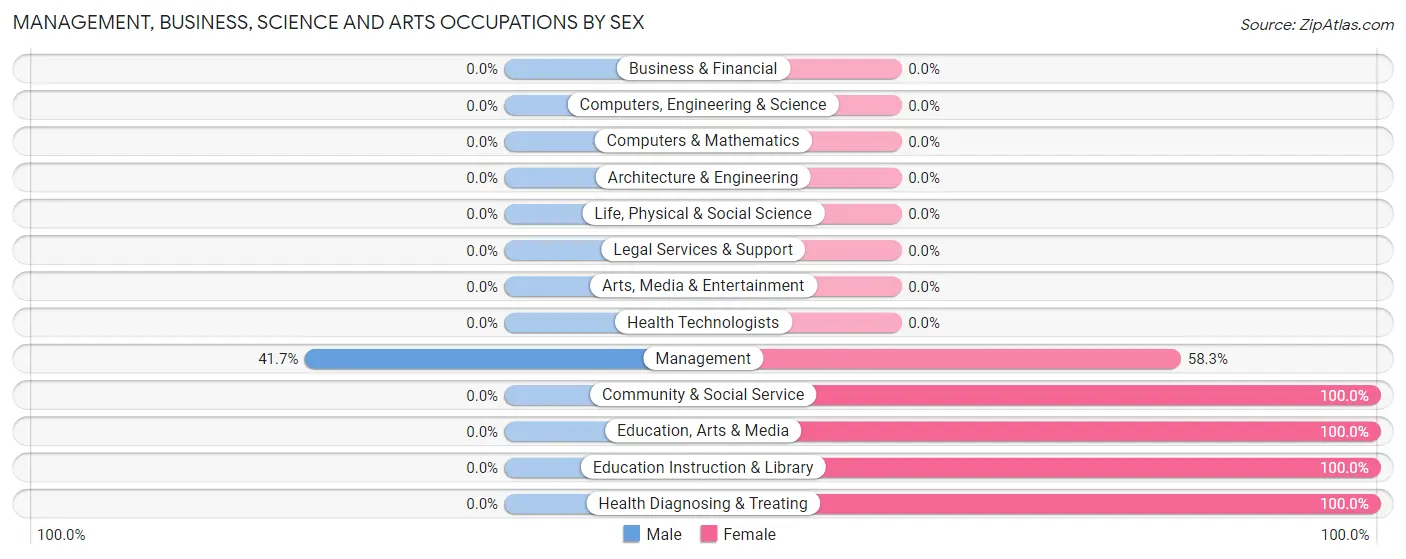
| Occupation | Male | Female |
| Management | 5 (41.7%) | 7 (58.3%) |
| Business & Financial | 0 (0.0%) | 0 (0.0%) |
| Computers, Engineering & Science | 0 (0.0%) | 0 (0.0%) |
| Computers & Mathematics | 0 (0.0%) | 0 (0.0%) |
| Architecture & Engineering | 0 (0.0%) | 0 (0.0%) |
| Life, Physical & Social Science | 0 (0.0%) | 0 (0.0%) |
| Community & Social Service | 0 (0.0%) | 12 (100.0%) |
| Education, Arts & Media | 0 (0.0%) | 2 (100.0%) |
| Legal Services & Support | 0 (0.0%) | 0 (0.0%) |
| Education Instruction & Library | 0 (0.0%) | 10 (100.0%) |
| Arts, Media & Entertainment | 0 (0.0%) | 0 (0.0%) |
| Health Diagnosing & Treating | 0 (0.0%) | 4 (100.0%) |
| Health Technologists | 0 (0.0%) | 0 (0.0%) |
| Total (Category) | 5 (17.9%) | 23 (82.1%) |
| Total (Overall) | 75 (50.7%) | 73 (49.3%) |
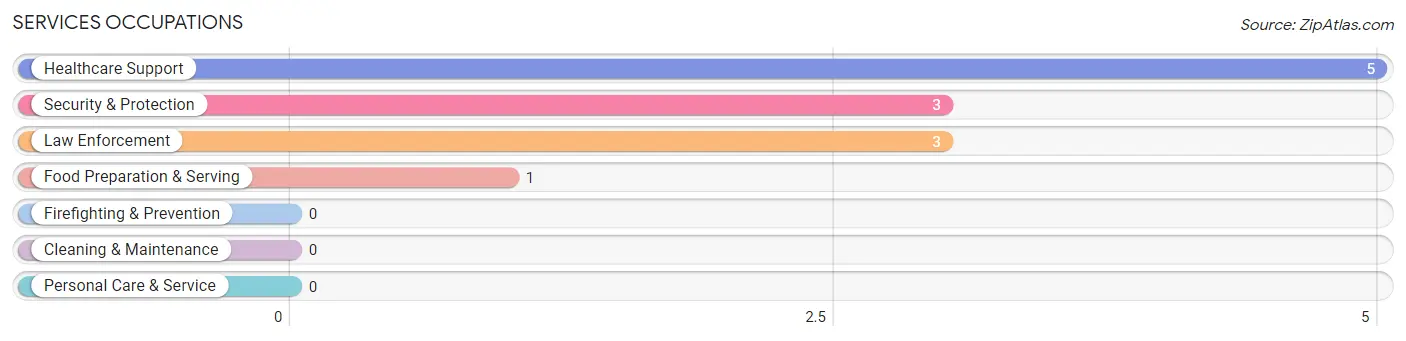
Services Occupations
The most common Services occupations in Fort Supply are Healthcare Support (5 | 3.4%), Security & Protection (3 | 2.0%), Law Enforcement (3 | 2.0%), and Food Preparation & Serving (1 | 0.7%).
Services Occupations by Sex
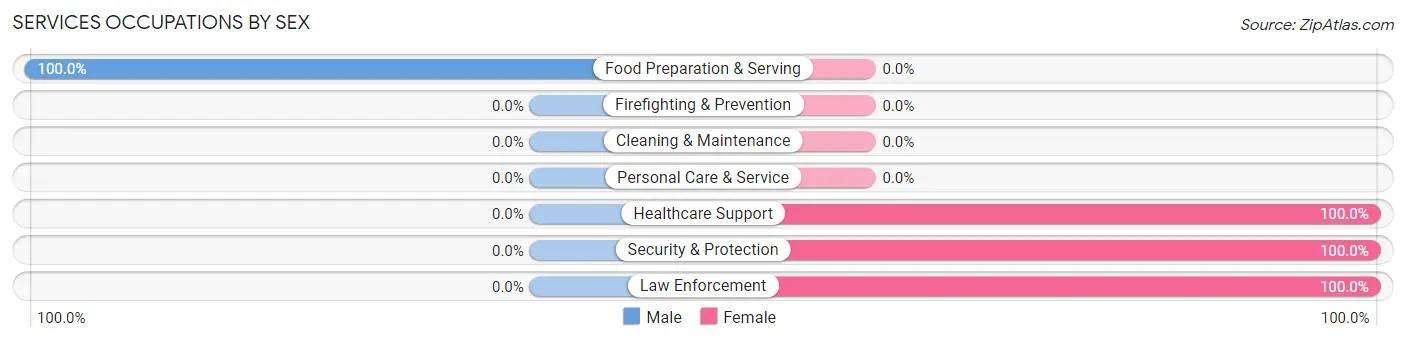
| Occupation | Male | Female |
| Healthcare Support | 0 (0.0%) | 5 (100.0%) |
| Security & Protection | 0 (0.0%) | 3 (100.0%) |
| Firefighting & Prevention | 0 (0.0%) | 0 (0.0%) |
| Law Enforcement | 0 (0.0%) | 3 (100.0%) |
| Food Preparation & Serving | 1 (100.0%) | 0 (0.0%) |
| Cleaning & Maintenance | 0 (0.0%) | 0 (0.0%) |
| Personal Care & Service | 0 (0.0%) | 0 (0.0%) |
| Total (Category) | 1 (11.1%) | 8 (88.9%) |
| Total (Overall) | 75 (50.7%) | 73 (49.3%) |
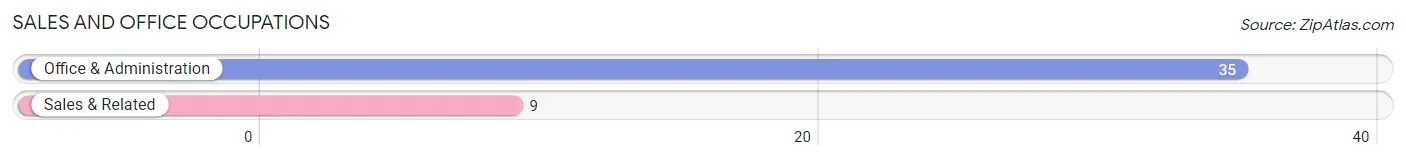
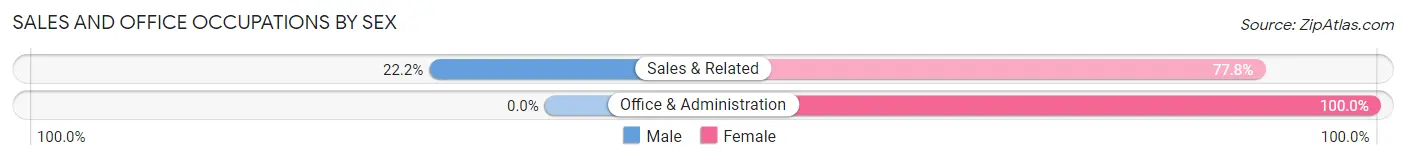
Sales and Office Occupations
The most common Sales and Office occupations in Fort Supply are Office & Administration (35 | 23.6%), and Sales & Related (9 | 6.1%).
Sales and Office Occupations by Sex
| Occupation | Male | Female |
| Sales & Related | 2 (22.2%) | 7 (77.8%) |
| Office & Administration | 0 (0.0%) | 35 (100.0%) |
| Total (Category) | 2 (4.5%) | 42 (95.5%) |
| Total (Overall) | 75 (50.7%) | 73 (49.3%) |
Natural Resources, Construction and Maintenance Occupations
The most common Natural Resources, Construction and Maintenance occupations in Fort Supply are Construction & Extraction (24 | 16.2%), and Installation, Maintenance & Repair (24 | 16.2%).
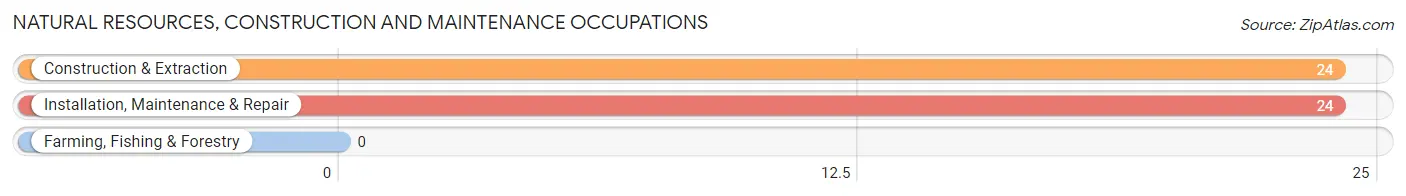
Natural Resources, Construction and Maintenance Occupations by Sex
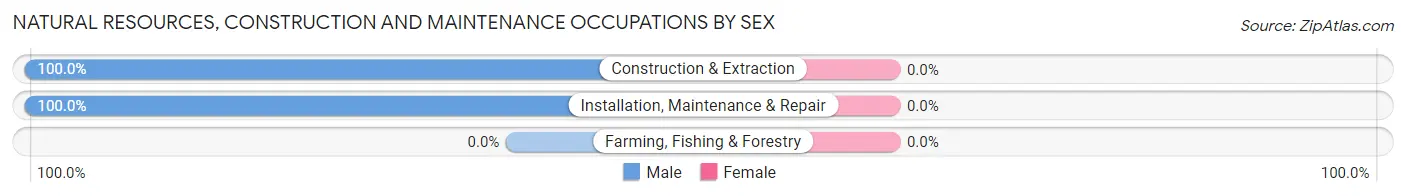
| Occupation | Male | Female |
| Farming, Fishing & Forestry | 0 (0.0%) | 0 (0.0%) |
| Construction & Extraction | 24 (100.0%) | 0 (0.0%) |
| Installation, Maintenance & Repair | 24 (100.0%) | 0 (0.0%) |
| Total (Category) | 48 (100.0%) | 0 (0.0%) |
| Total (Overall) | 75 (50.7%) | 73 (49.3%) |
Production, Transportation and Moving Occupations
The most common Production, Transportation and Moving occupations in Fort Supply are Transportation (10 | 6.8%), Material Moving (5 | 3.4%), and Production (4 | 2.7%).
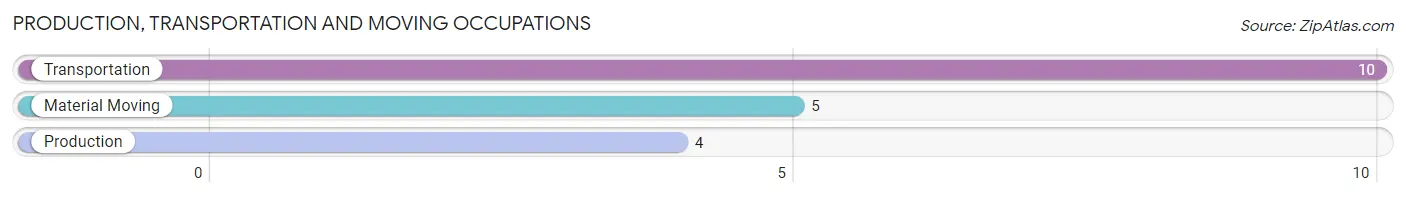
Production, Transportation and Moving Occupations by Sex
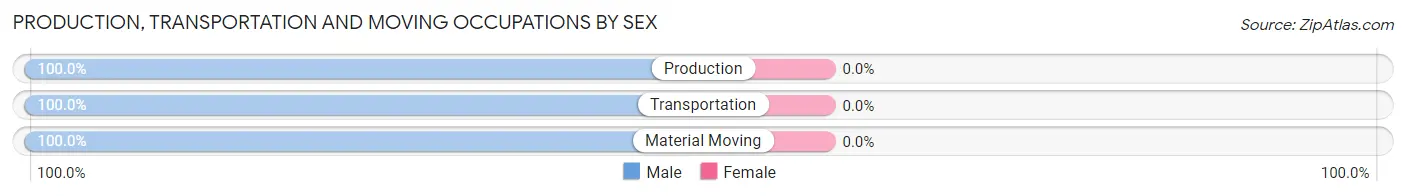
| Occupation | Male | Female |
| Production | 4 (100.0%) | 0 (0.0%) |
| Transportation | 10 (100.0%) | 0 (0.0%) |
| Material Moving | 5 (100.0%) | 0 (0.0%) |
| Total (Category) | 19 (100.0%) | 0 (0.0%) |
| Total (Overall) | 75 (50.7%) | 73 (49.3%) |
Employment Industries by Sex in Fort Supply
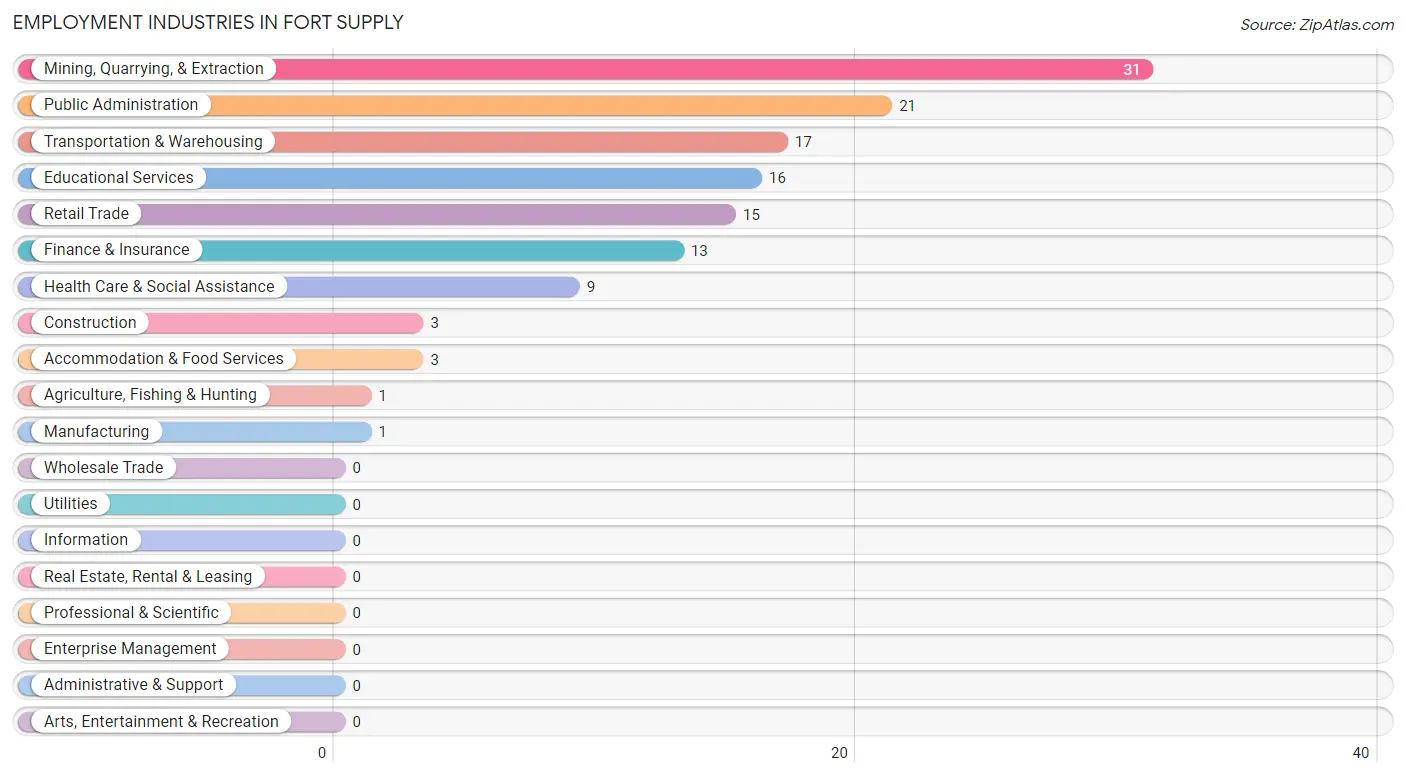
Employment Industries in Fort Supply
The major employment industries in Fort Supply include Mining, Quarrying, & Extraction (31 | 20.9%), Public Administration (21 | 14.2%), Transportation & Warehousing (17 | 11.5%), Educational Services (16 | 10.8%), and Retail Trade (15 | 10.1%).
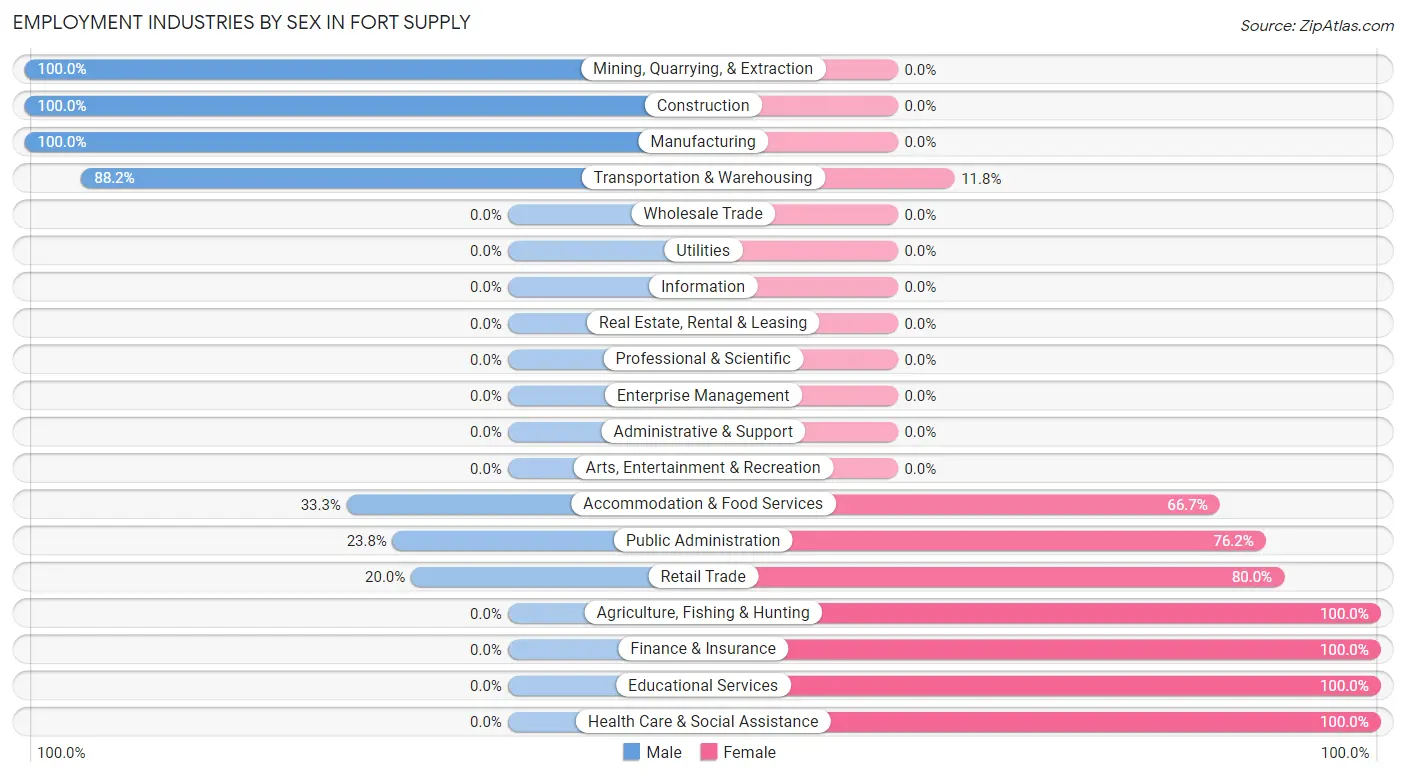
Employment Industries by Sex in Fort Supply
The Fort Supply industries that see more men than women are Mining, Quarrying, & Extraction (100.0%), Construction (100.0%), and Manufacturing (100.0%), whereas the industries that tend to have a higher number of women are Agriculture, Fishing & Hunting (100.0%), Finance & Insurance (100.0%), and Educational Services (100.0%).
| Industry | Male | Female |
| Agriculture, Fishing & Hunting | 0 (0.0%) | 1 (100.0%) |
| Mining, Quarrying, & Extraction | 31 (100.0%) | 0 (0.0%) |
| Construction | 3 (100.0%) | 0 (0.0%) |
| Manufacturing | 1 (100.0%) | 0 (0.0%) |
| Wholesale Trade | 0 (0.0%) | 0 (0.0%) |
| Retail Trade | 3 (20.0%) | 12 (80.0%) |
| Transportation & Warehousing | 15 (88.2%) | 2 (11.8%) |
| Utilities | 0 (0.0%) | 0 (0.0%) |
| Information | 0 (0.0%) | 0 (0.0%) |
| Finance & Insurance | 0 (0.0%) | 13 (100.0%) |
| Real Estate, Rental & Leasing | 0 (0.0%) | 0 (0.0%) |
| Professional & Scientific | 0 (0.0%) | 0 (0.0%) |
| Enterprise Management | 0 (0.0%) | 0 (0.0%) |
| Administrative & Support | 0 (0.0%) | 0 (0.0%) |
| Educational Services | 0 (0.0%) | 16 (100.0%) |
| Health Care & Social Assistance | 0 (0.0%) | 9 (100.0%) |
| Arts, Entertainment & Recreation | 0 (0.0%) | 0 (0.0%) |
| Accommodation & Food Services | 1 (33.3%) | 2 (66.7%) |
| Public Administration | 5 (23.8%) | 16 (76.2%) |
| Total | 75 (50.7%) | 73 (49.3%) |
Education in Fort Supply
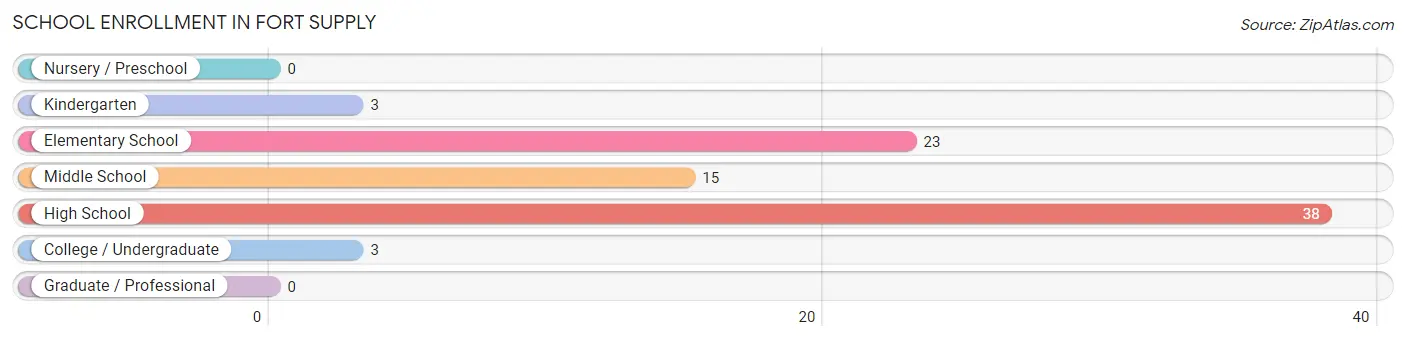
School Enrollment in Fort Supply
The most common levels of schooling among the 82 students in Fort Supply are high school (38 | 46.3%), elementary school (23 | 28.1%), and middle school (15 | 18.3%).
| School Level | # Students | % Students |
| Nursery / Preschool | 0 | 0.0% |
| Kindergarten | 3 | 3.7% |
| Elementary School | 23 | 28.1% |
| Middle School | 15 | 18.3% |
| High School | 38 | 46.3% |
| College / Undergraduate | 3 | 3.7% |
| Graduate / Professional | 0 | 0.0% |
| Total | 82 | 100.0% |
School Enrollment by Age by Funding Source in Fort Supply
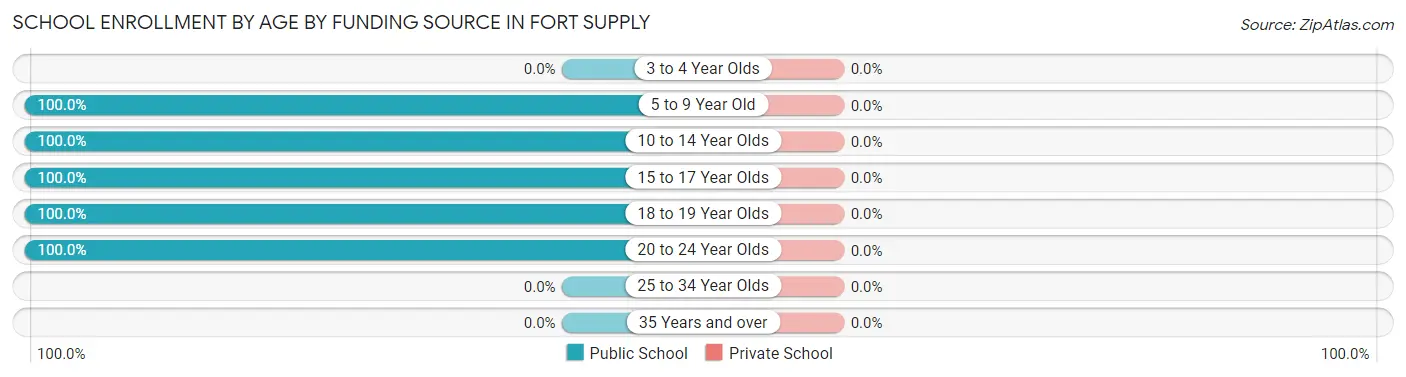
| Age Bracket | Public School | Private School |
| 3 to 4 Year Olds | 0 (0.0%) | 0 (0.0%) |
| 5 to 9 Year Old | 25 (100.0%) | 0 (0.0%) |
| 10 to 14 Year Olds | 21 (100.0%) | 0 (0.0%) |
| 15 to 17 Year Olds | 27 (100.0%) | 0 (0.0%) |
| 18 to 19 Year Olds | 6 (100.0%) | 0 (0.0%) |
| 20 to 24 Year Olds | 3 (100.0%) | 0 (0.0%) |
| 25 to 34 Year Olds | 0 (0.0%) | 0 (0.0%) |
| 35 Years and over | 0 (0.0%) | 0 (0.0%) |
| Total | 82 (100.0%) | 0 (0.0%) |
Educational Attainment by Field of Study in Fort Supply
Education (25 | 41.0%), psychology (14 | 23.0%), business (6 | 9.8%), arts & humanities (6 | 9.8%), and computers & mathematics (5 | 8.2%) are the most common fields of study among 61 individuals in Fort Supply who have obtained a bachelor's degree or higher.
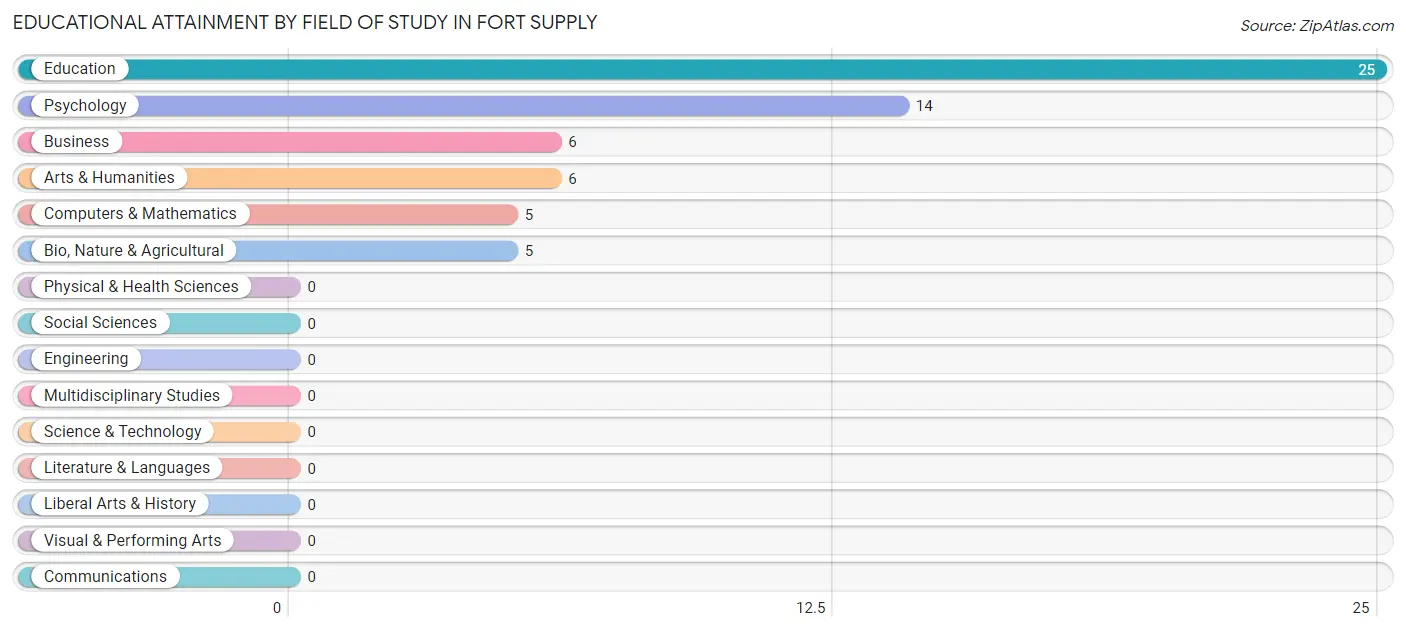
| Field of Study | # Graduates | % Graduates |
| Computers & Mathematics | 5 | 8.2% |
| Bio, Nature & Agricultural | 5 | 8.2% |
| Physical & Health Sciences | 0 | 0.0% |
| Psychology | 14 | 23.0% |
| Social Sciences | 0 | 0.0% |
| Engineering | 0 | 0.0% |
| Multidisciplinary Studies | 0 | 0.0% |
| Science & Technology | 0 | 0.0% |
| Business | 6 | 9.8% |
| Education | 25 | 41.0% |
| Literature & Languages | 0 | 0.0% |
| Liberal Arts & History | 0 | 0.0% |
| Visual & Performing Arts | 0 | 0.0% |
| Communications | 0 | 0.0% |
| Arts & Humanities | 6 | 9.8% |
| Total | 61 | 100.0% |
Transportation & Commute in Fort Supply
Vehicle Availability by Sex in Fort Supply
The most prevalent vehicle ownership categories in Fort Supply are males with 5 or more vehicles (31, accounting for 43.1%) and females with 5 or more vehicles (13, making up 46.3%).
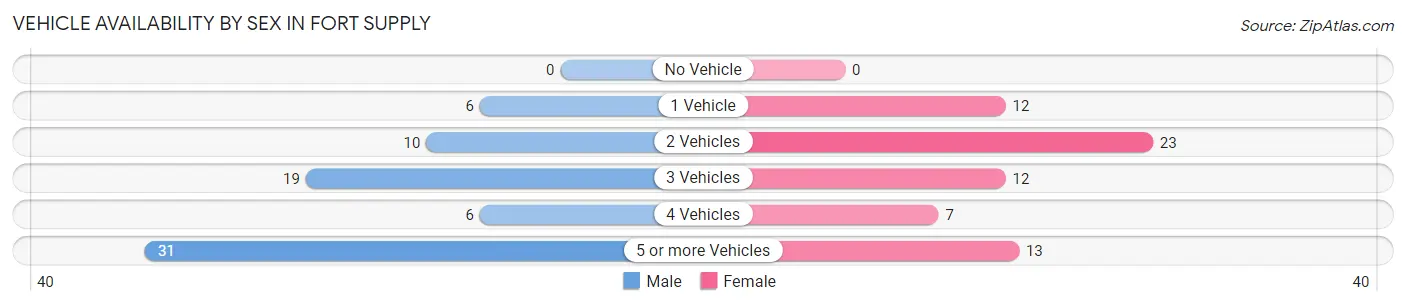
| Vehicles Available | Male | Female |
| No Vehicle | 0 (0.0%) | 0 (0.0%) |
| 1 Vehicle | 6 (8.3%) | 12 (17.9%) |
| 2 Vehicles | 10 (13.9%) | 23 (34.3%) |
| 3 Vehicles | 19 (26.4%) | 12 (17.9%) |
| 4 Vehicles | 6 (8.3%) | 7 (10.4%) |
| 5 or more Vehicles | 31 (43.1%) | 13 (19.4%) |
| Total | 72 (100.0%) | 67 (100.0%) |
Commute Time in Fort Supply
The most frequently occuring commute durations in Fort Supply are 20 to 24 minutes (43 commuters, 30.9%), 15 to 19 minutes (27 commuters, 19.4%), and 30 to 34 minutes (21 commuters, 15.1%).
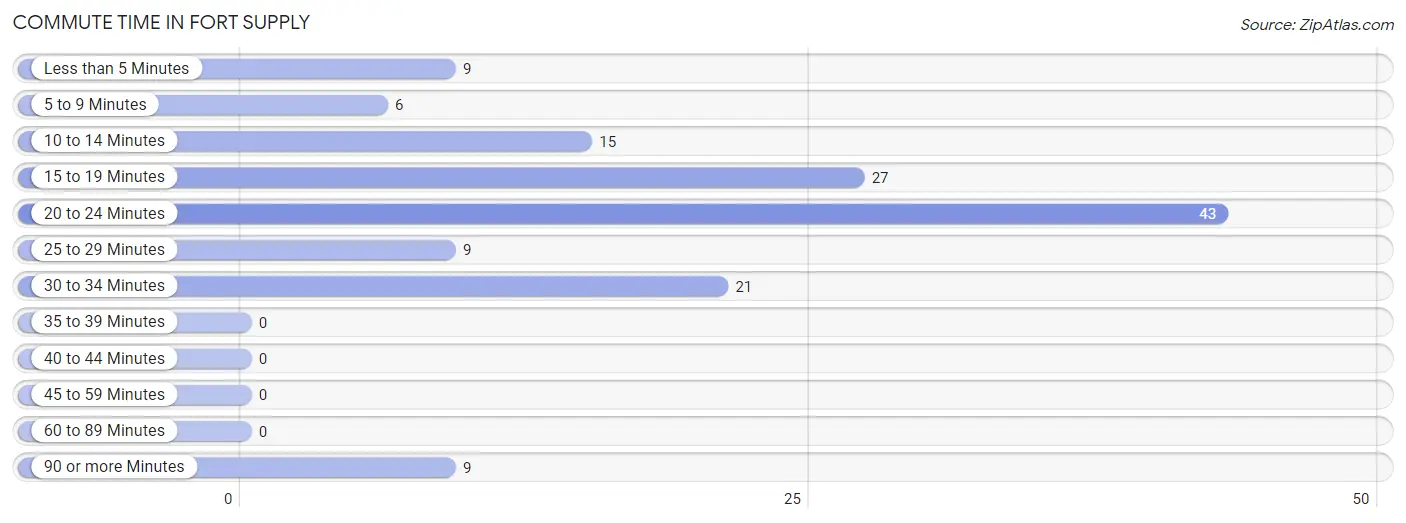
| Commute Time | # Commuters | % Commuters |
| Less than 5 Minutes | 9 | 6.5% |
| 5 to 9 Minutes | 6 | 4.3% |
| 10 to 14 Minutes | 15 | 10.8% |
| 15 to 19 Minutes | 27 | 19.4% |
| 20 to 24 Minutes | 43 | 30.9% |
| 25 to 29 Minutes | 9 | 6.5% |
| 30 to 34 Minutes | 21 | 15.1% |
| 35 to 39 Minutes | 0 | 0.0% |
| 40 to 44 Minutes | 0 | 0.0% |
| 45 to 59 Minutes | 0 | 0.0% |
| 60 to 89 Minutes | 0 | 0.0% |
| 90 or more Minutes | 9 | 6.5% |
Commute Time by Sex in Fort Supply
The most common commute times in Fort Supply are 20 to 24 minutes (25 commuters, 34.7%) for males and 20 to 24 minutes (18 commuters, 26.9%) for females.
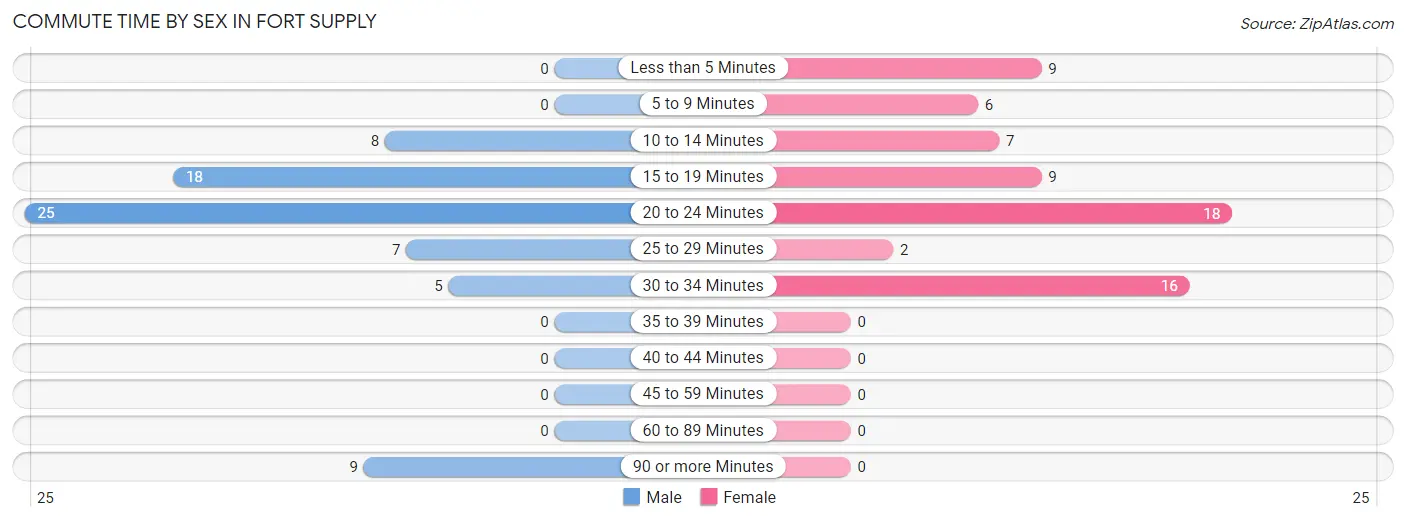
| Commute Time | Male | Female |
| Less than 5 Minutes | 0 (0.0%) | 9 (13.4%) |
| 5 to 9 Minutes | 0 (0.0%) | 6 (9.0%) |
| 10 to 14 Minutes | 8 (11.1%) | 7 (10.4%) |
| 15 to 19 Minutes | 18 (25.0%) | 9 (13.4%) |
| 20 to 24 Minutes | 25 (34.7%) | 18 (26.9%) |
| 25 to 29 Minutes | 7 (9.7%) | 2 (3.0%) |
| 30 to 34 Minutes | 5 (6.9%) | 16 (23.9%) |
| 35 to 39 Minutes | 0 (0.0%) | 0 (0.0%) |
| 40 to 44 Minutes | 0 (0.0%) | 0 (0.0%) |
| 45 to 59 Minutes | 0 (0.0%) | 0 (0.0%) |
| 60 to 89 Minutes | 0 (0.0%) | 0 (0.0%) |
| 90 or more Minutes | 9 (12.5%) | 0 (0.0%) |
Time of Departure to Work by Sex in Fort Supply
The most frequent times of departure to work in Fort Supply are 7:00 AM to 7:29 AM (36, 50.0%) for males and 7:30 AM to 7:59 AM (34, 50.7%) for females.
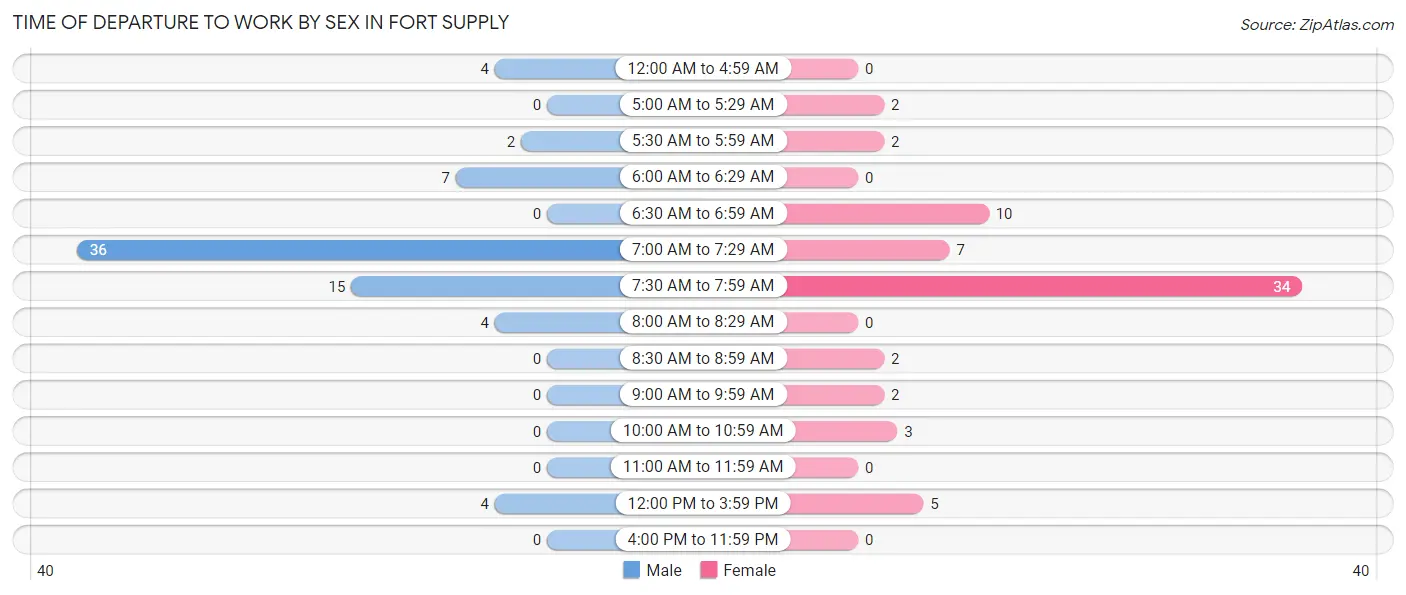
| Time of Departure | Male | Female |
| 12:00 AM to 4:59 AM | 4 (5.6%) | 0 (0.0%) |
| 5:00 AM to 5:29 AM | 0 (0.0%) | 2 (3.0%) |
| 5:30 AM to 5:59 AM | 2 (2.8%) | 2 (3.0%) |
| 6:00 AM to 6:29 AM | 7 (9.7%) | 0 (0.0%) |
| 6:30 AM to 6:59 AM | 0 (0.0%) | 10 (14.9%) |
| 7:00 AM to 7:29 AM | 36 (50.0%) | 7 (10.4%) |
| 7:30 AM to 7:59 AM | 15 (20.8%) | 34 (50.7%) |
| 8:00 AM to 8:29 AM | 4 (5.6%) | 0 (0.0%) |
| 8:30 AM to 8:59 AM | 0 (0.0%) | 2 (3.0%) |
| 9:00 AM to 9:59 AM | 0 (0.0%) | 2 (3.0%) |
| 10:00 AM to 10:59 AM | 0 (0.0%) | 3 (4.5%) |
| 11:00 AM to 11:59 AM | 0 (0.0%) | 0 (0.0%) |
| 12:00 PM to 3:59 PM | 4 (5.6%) | 5 (7.5%) |
| 4:00 PM to 11:59 PM | 0 (0.0%) | 0 (0.0%) |
| Total | 72 (100.0%) | 67 (100.0%) |
Housing Occupancy in Fort Supply
Occupancy by Ownership in Fort Supply
Of the total 105 dwellings in Fort Supply, owner-occupied units account for 74 (70.5%), while renter-occupied units make up 31 (29.5%).
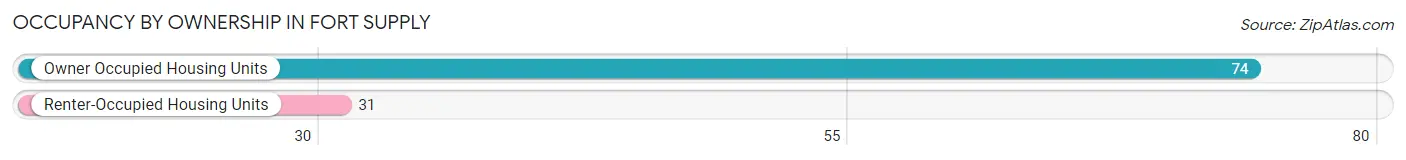
| Occupancy | # Housing Units | % Housing Units |
| Owner Occupied Housing Units | 74 | 70.5% |
| Renter-Occupied Housing Units | 31 | 29.5% |
| Total Occupied Housing Units | 105 | 100.0% |
Occupancy by Household Size in Fort Supply
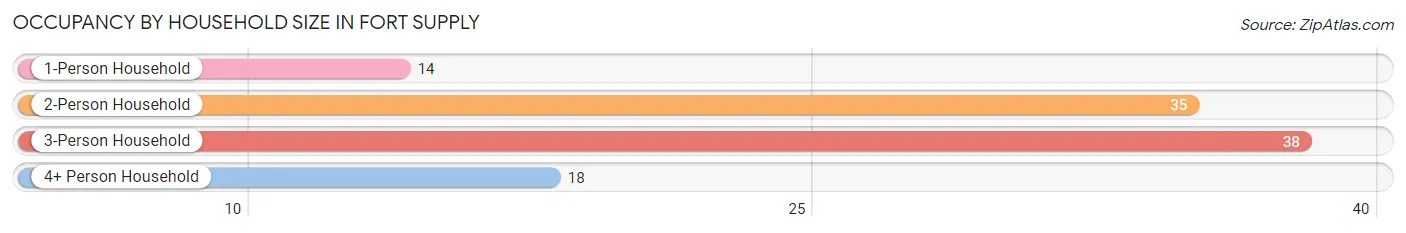
| Household Size | # Housing Units | % Housing Units |
| 1-Person Household | 14 | 13.3% |
| 2-Person Household | 35 | 33.3% |
| 3-Person Household | 38 | 36.2% |
| 4+ Person Household | 18 | 17.1% |
| Total Housing Units | 105 | 100.0% |
Occupancy by Ownership by Household Size in Fort Supply
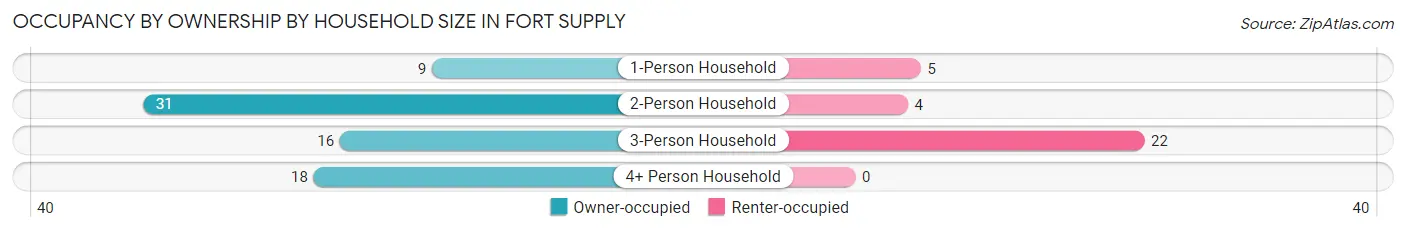
| Household Size | Owner-occupied | Renter-occupied |
| 1-Person Household | 9 (64.3%) | 5 (35.7%) |
| 2-Person Household | 31 (88.6%) | 4 (11.4%) |
| 3-Person Household | 16 (42.1%) | 22 (57.9%) |
| 4+ Person Household | 18 (100.0%) | 0 (0.0%) |
| Total Housing Units | 74 (70.5%) | 31 (29.5%) |
Occupancy by Educational Attainment in Fort Supply
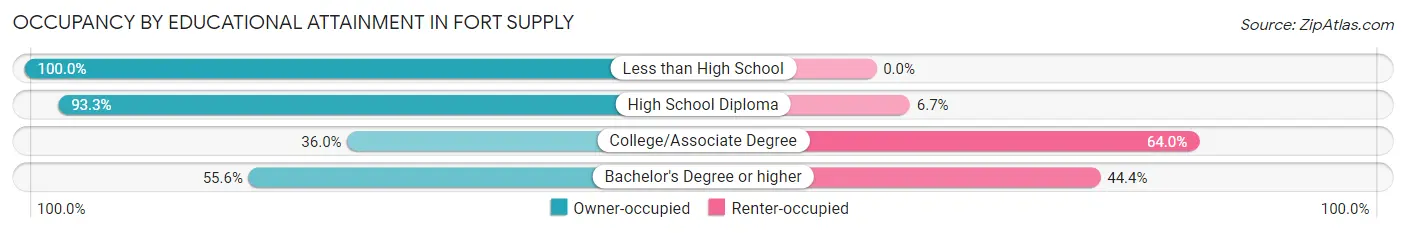
| Household Size | Owner-occupied | Renter-occupied |
| Less than High School | 8 (100.0%) | 0 (0.0%) |
| High School Diploma | 42 (93.3%) | 3 (6.7%) |
| College/Associate Degree | 9 (36.0%) | 16 (64.0%) |
| Bachelor's Degree or higher | 15 (55.6%) | 12 (44.4%) |
Occupancy by Age of Householder in Fort Supply
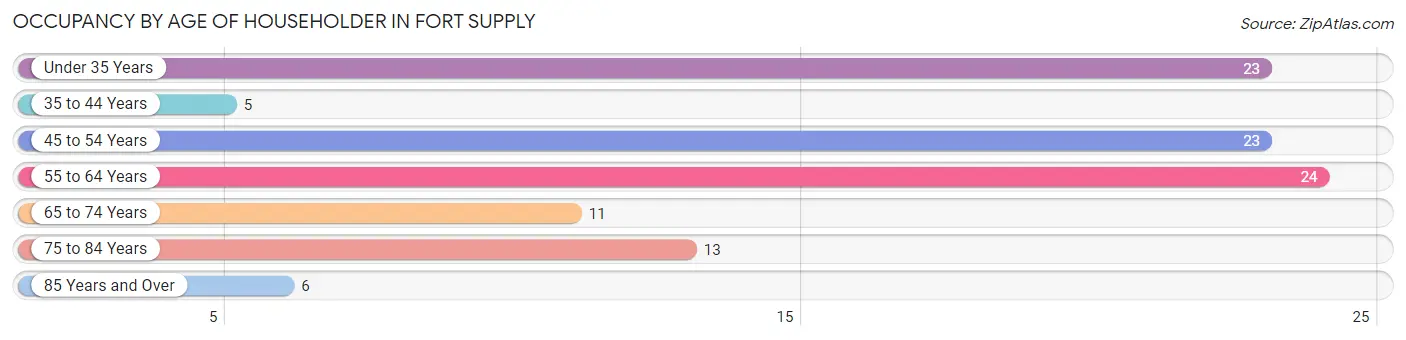
| Age Bracket | # Households | % Households |
| Under 35 Years | 23 | 21.9% |
| 35 to 44 Years | 5 | 4.8% |
| 45 to 54 Years | 23 | 21.9% |
| 55 to 64 Years | 24 | 22.9% |
| 65 to 74 Years | 11 | 10.5% |
| 75 to 84 Years | 13 | 12.4% |
| 85 Years and Over | 6 | 5.7% |
| Total | 105 | 100.0% |
Housing Finances in Fort Supply
Median Income by Occupancy in Fort Supply
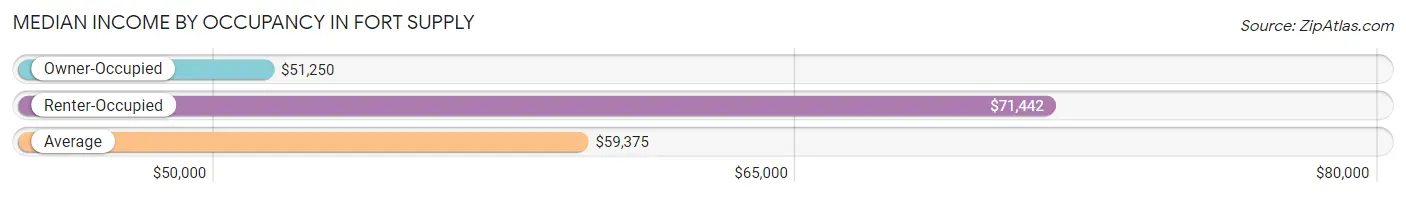
| Occupancy Type | # Households | Median Income |
| Owner-Occupied | 74 (70.5%) | $51,250 |
| Renter-Occupied | 31 (29.5%) | $71,442 |
| Average | 105 (100.0%) | $59,375 |
Occupancy by Householder Income Bracket in Fort Supply
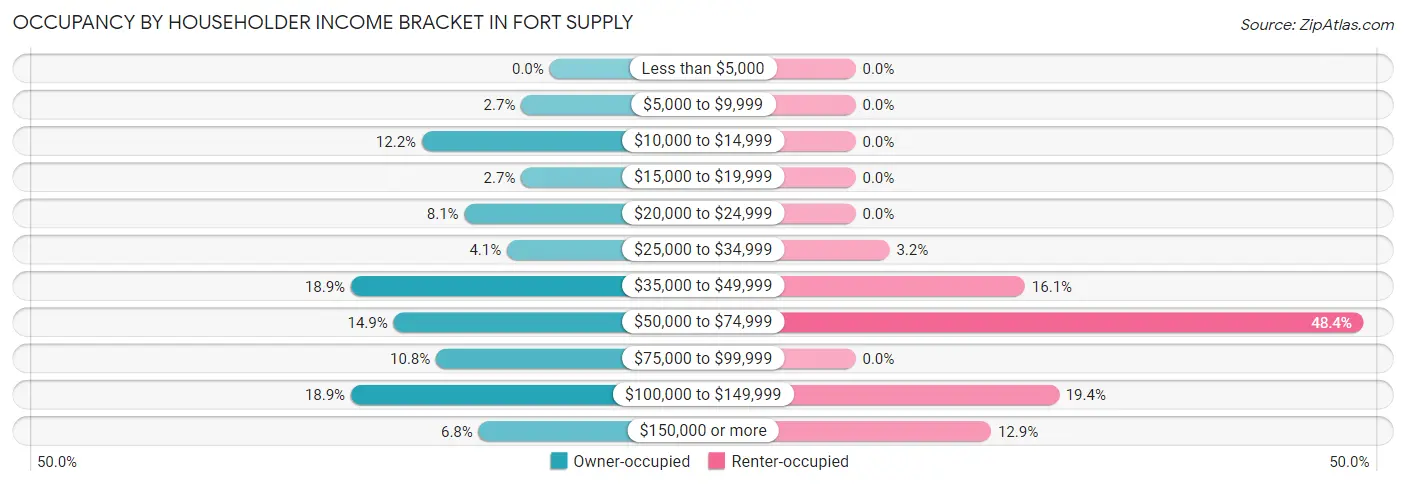
| Income Bracket | Owner-occupied | Renter-occupied |
| Less than $5,000 | 0 (0.0%) | 0 (0.0%) |
| $5,000 to $9,999 | 2 (2.7%) | 0 (0.0%) |
| $10,000 to $14,999 | 9 (12.2%) | 0 (0.0%) |
| $15,000 to $19,999 | 2 (2.7%) | 0 (0.0%) |
| $20,000 to $24,999 | 6 (8.1%) | 0 (0.0%) |
| $25,000 to $34,999 | 3 (4.1%) | 1 (3.2%) |
| $35,000 to $49,999 | 14 (18.9%) | 5 (16.1%) |
| $50,000 to $74,999 | 11 (14.9%) | 15 (48.4%) |
| $75,000 to $99,999 | 8 (10.8%) | 0 (0.0%) |
| $100,000 to $149,999 | 14 (18.9%) | 6 (19.4%) |
| $150,000 or more | 5 (6.8%) | 4 (12.9%) |
| Total | 74 (100.0%) | 31 (100.0%) |
Monthly Housing Cost Tiers in Fort Supply
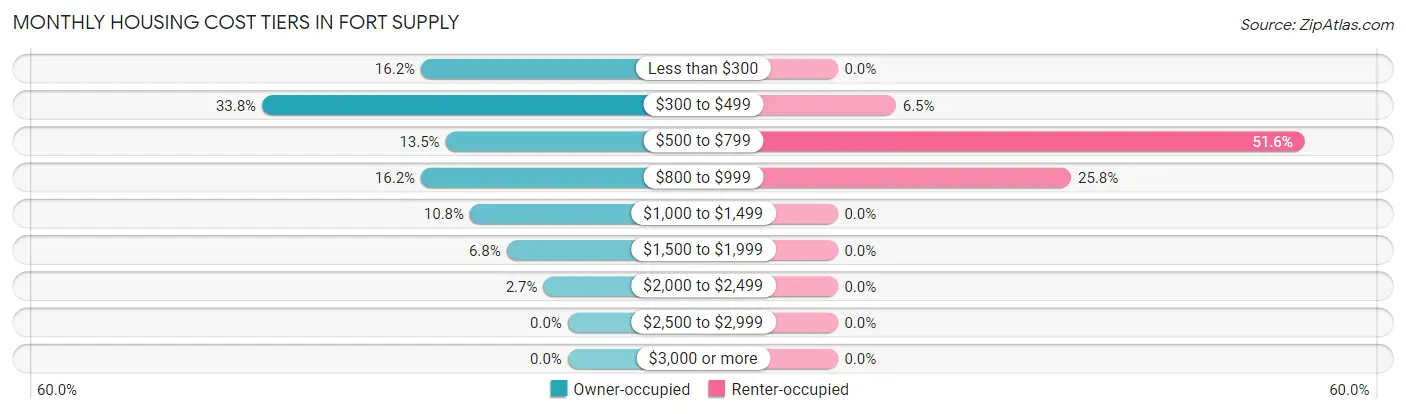
| Monthly Cost | Owner-occupied | Renter-occupied |
| Less than $300 | 12 (16.2%) | 0 (0.0%) |
| $300 to $499 | 25 (33.8%) | 2 (6.5%) |
| $500 to $799 | 10 (13.5%) | 16 (51.6%) |
| $800 to $999 | 12 (16.2%) | 8 (25.8%) |
| $1,000 to $1,499 | 8 (10.8%) | 0 (0.0%) |
| $1,500 to $1,999 | 5 (6.8%) | 0 (0.0%) |
| $2,000 to $2,499 | 2 (2.7%) | 0 (0.0%) |
| $2,500 to $2,999 | 0 (0.0%) | 0 (0.0%) |
| $3,000 or more | 0 (0.0%) | 0 (0.0%) |
| Total | 74 (100.0%) | 31 (100.0%) |
Physical Housing Characteristics in Fort Supply
Housing Structures in Fort Supply
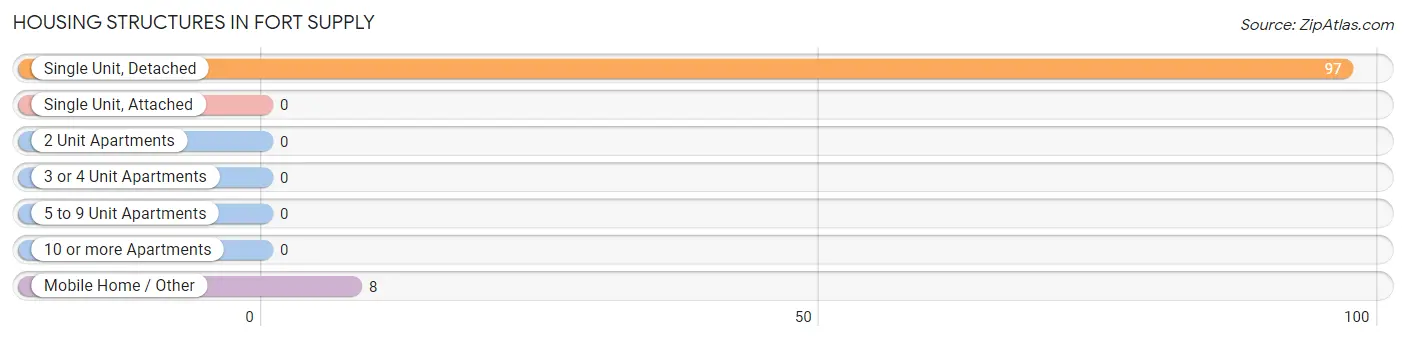
| Structure Type | # Housing Units | % Housing Units |
| Single Unit, Detached | 97 | 92.4% |
| Single Unit, Attached | 0 | 0.0% |
| 2 Unit Apartments | 0 | 0.0% |
| 3 or 4 Unit Apartments | 0 | 0.0% |
| 5 to 9 Unit Apartments | 0 | 0.0% |
| 10 or more Apartments | 0 | 0.0% |
| Mobile Home / Other | 8 | 7.6% |
| Total | 105 | 100.0% |
Housing Structures by Occupancy in Fort Supply
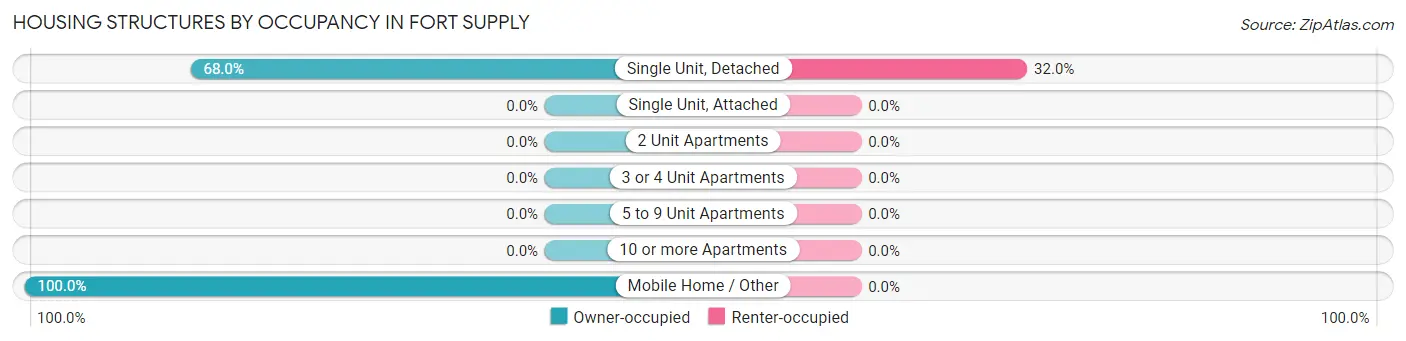
| Structure Type | Owner-occupied | Renter-occupied |
| Single Unit, Detached | 66 (68.0%) | 31 (32.0%) |
| Single Unit, Attached | 0 (0.0%) | 0 (0.0%) |
| 2 Unit Apartments | 0 (0.0%) | 0 (0.0%) |
| 3 or 4 Unit Apartments | 0 (0.0%) | 0 (0.0%) |
| 5 to 9 Unit Apartments | 0 (0.0%) | 0 (0.0%) |
| 10 or more Apartments | 0 (0.0%) | 0 (0.0%) |
| Mobile Home / Other | 8 (100.0%) | 0 (0.0%) |
| Total | 74 (70.5%) | 31 (29.5%) |
Housing Structures by Number of Rooms in Fort Supply
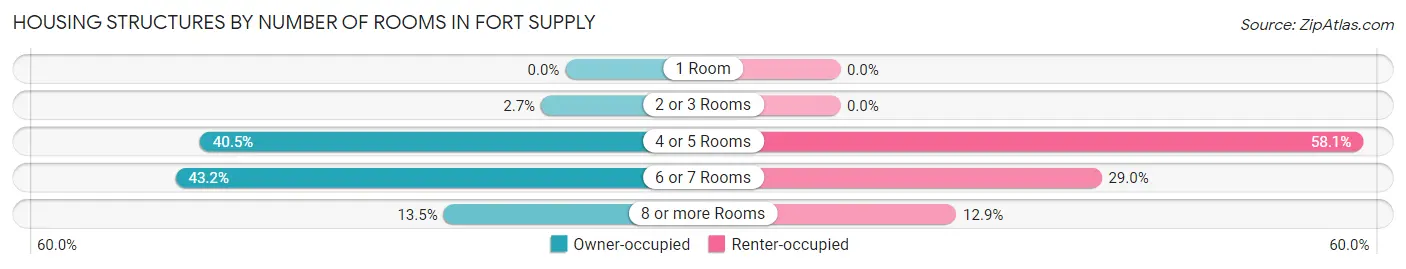
| Number of Rooms | Owner-occupied | Renter-occupied |
| 1 Room | 0 (0.0%) | 0 (0.0%) |
| 2 or 3 Rooms | 2 (2.7%) | 0 (0.0%) |
| 4 or 5 Rooms | 30 (40.5%) | 18 (58.1%) |
| 6 or 7 Rooms | 32 (43.2%) | 9 (29.0%) |
| 8 or more Rooms | 10 (13.5%) | 4 (12.9%) |
| Total | 74 (100.0%) | 31 (100.0%) |
Housing Structure by Heating Type in Fort Supply
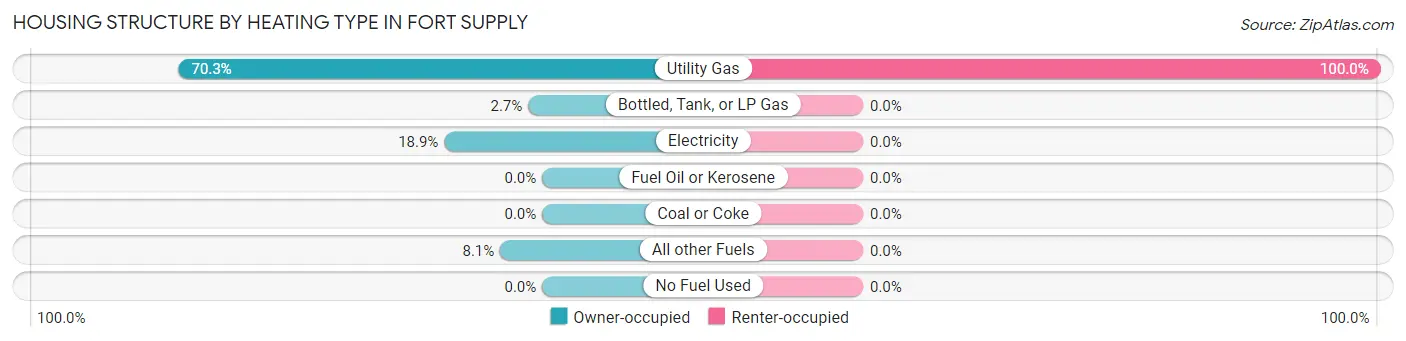
| Heating Type | Owner-occupied | Renter-occupied |
| Utility Gas | 52 (70.3%) | 31 (100.0%) |
| Bottled, Tank, or LP Gas | 2 (2.7%) | 0 (0.0%) |
| Electricity | 14 (18.9%) | 0 (0.0%) |
| Fuel Oil or Kerosene | 0 (0.0%) | 0 (0.0%) |
| Coal or Coke | 0 (0.0%) | 0 (0.0%) |
| All other Fuels | 6 (8.1%) | 0 (0.0%) |
| No Fuel Used | 0 (0.0%) | 0 (0.0%) |
| Total | 74 (100.0%) | 31 (100.0%) |
Household Vehicle Usage in Fort Supply
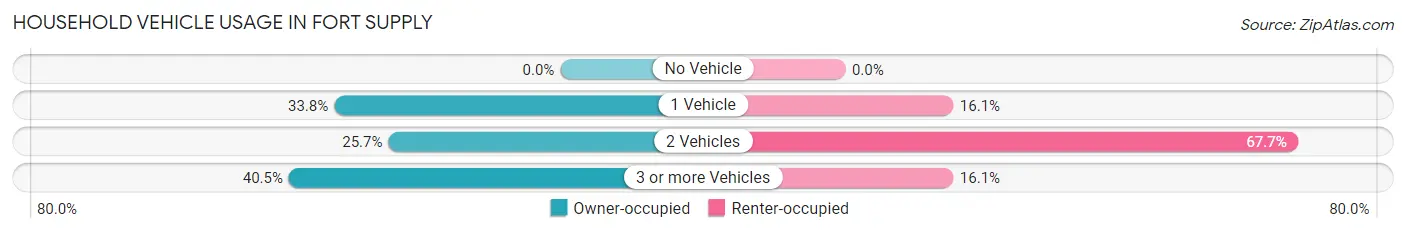
| Vehicles per Household | Owner-occupied | Renter-occupied |
| No Vehicle | 0 (0.0%) | 0 (0.0%) |
| 1 Vehicle | 25 (33.8%) | 5 (16.1%) |
| 2 Vehicles | 19 (25.7%) | 21 (67.7%) |
| 3 or more Vehicles | 30 (40.5%) | 5 (16.1%) |
| Total | 74 (100.0%) | 31 (100.0%) |
Real Estate & Mortgages in Fort Supply
Real Estate and Mortgage Overview in Fort Supply
| Characteristic | Without Mortgage | With Mortgage |
| Housing Units | 52 | 22 |
| Median Property Value | $77,500 | $95,700 |
| Median Household Income | $47,500 | $5 |
| Monthly Housing Costs | $371 | $0 |
| Real Estate Taxes | $450 | $0 |
Property Value by Mortgage Status in Fort Supply
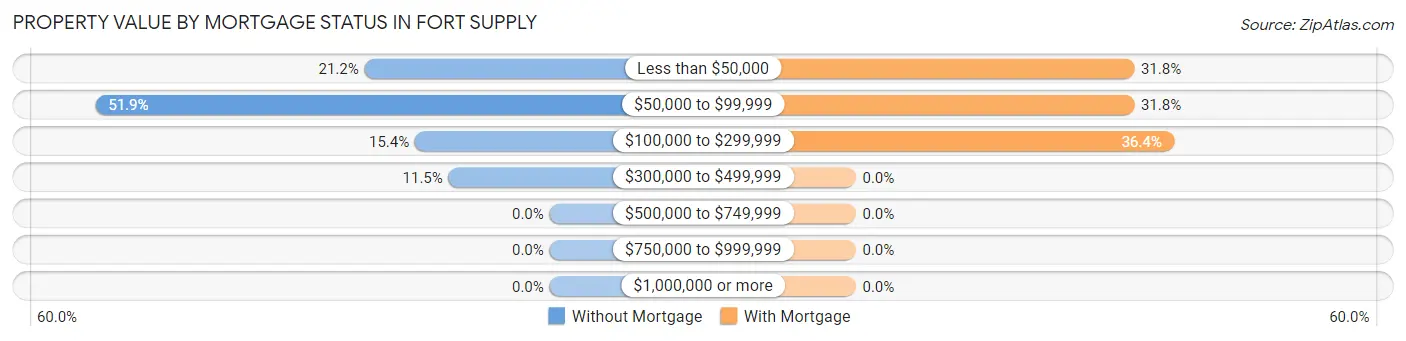
| Property Value | Without Mortgage | With Mortgage |
| Less than $50,000 | 11 (21.1%) | 7 (31.8%) |
| $50,000 to $99,999 | 27 (51.9%) | 7 (31.8%) |
| $100,000 to $299,999 | 8 (15.4%) | 8 (36.4%) |
| $300,000 to $499,999 | 6 (11.5%) | 0 (0.0%) |
| $500,000 to $749,999 | 0 (0.0%) | 0 (0.0%) |
| $750,000 to $999,999 | 0 (0.0%) | 0 (0.0%) |
| $1,000,000 or more | 0 (0.0%) | 0 (0.0%) |
| Total | 52 (100.0%) | 22 (100.0%) |
Household Income by Mortgage Status in Fort Supply
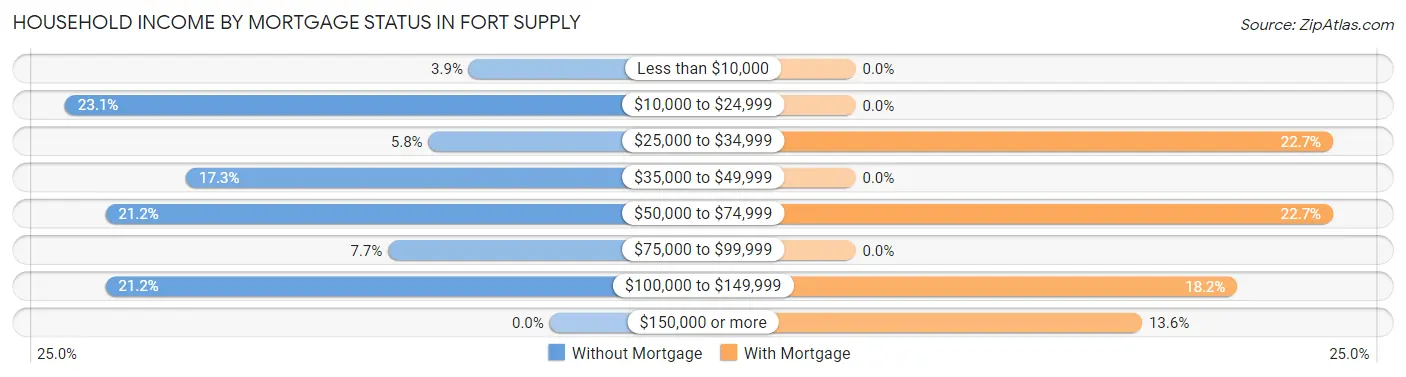
| Household Income | Without Mortgage | With Mortgage |
| Less than $10,000 | 2 (3.8%) | 0 (0.0%) |
| $10,000 to $24,999 | 12 (23.1%) | 0 (0.0%) |
| $25,000 to $34,999 | 3 (5.8%) | 5 (22.7%) |
| $35,000 to $49,999 | 9 (17.3%) | 0 (0.0%) |
| $50,000 to $74,999 | 11 (21.1%) | 5 (22.7%) |
| $75,000 to $99,999 | 4 (7.7%) | 0 (0.0%) |
| $100,000 to $149,999 | 11 (21.1%) | 4 (18.2%) |
| $150,000 or more | 0 (0.0%) | 3 (13.6%) |
| Total | 52 (100.0%) | 22 (100.0%) |
Property Value to Household Income Ratio in Fort Supply
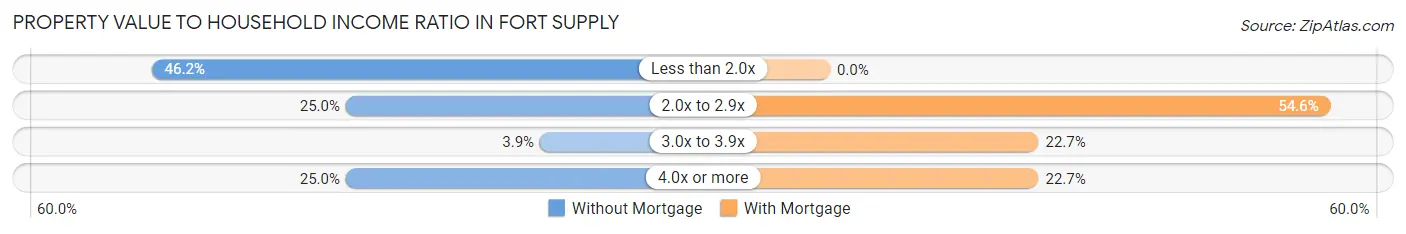
| Value-to-Income Ratio | Without Mortgage | With Mortgage |
| Less than 2.0x | 24 (46.2%) | 0 (0.0%) |
| 2.0x to 2.9x | 13 (25.0%) | 12 (54.5%) |
| 3.0x to 3.9x | 2 (3.8%) | 5 (22.7%) |
| 4.0x or more | 13 (25.0%) | 5 (22.7%) |
| Total | 52 (100.0%) | 22 (100.0%) |
Real Estate Taxes by Mortgage Status in Fort Supply
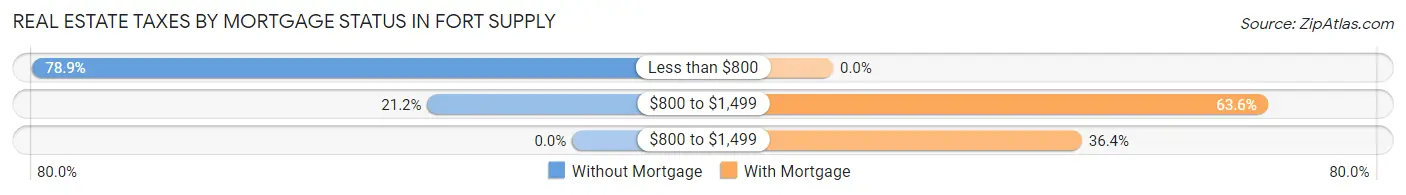
| Property Taxes | Without Mortgage | With Mortgage |
| Less than $800 | 41 (78.8%) | 0 (0.0%) |
| $800 to $1,499 | 11 (21.1%) | 14 (63.6%) |
| $800 to $1,499 | 0 (0.0%) | 8 (36.4%) |
| Total | 52 (100.0%) | 22 (100.0%) |
Health & Disability in Fort Supply
Health Insurance Coverage by Age in Fort Supply
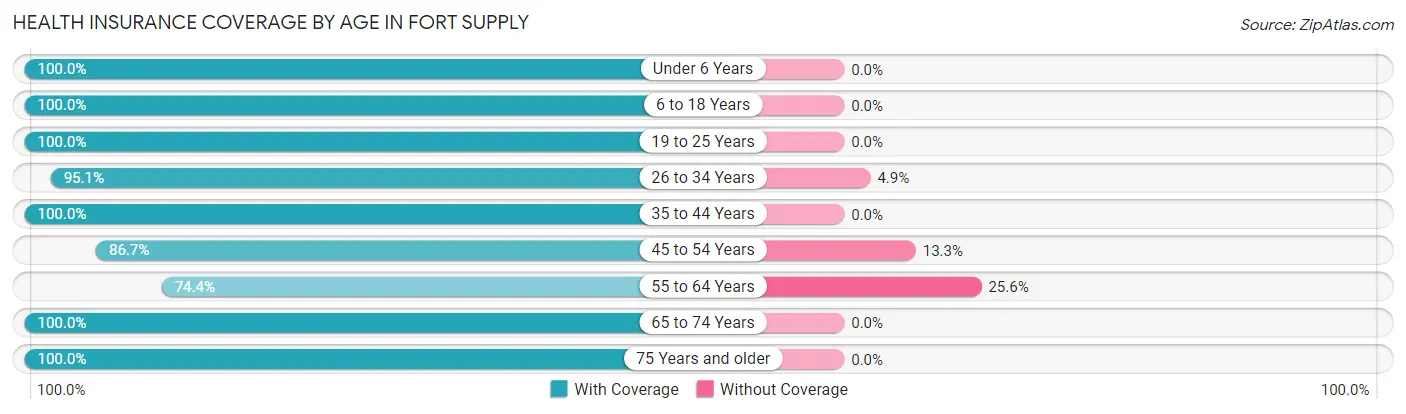
| Age Bracket | With Coverage | Without Coverage |
| Under 6 Years | 19 (100.0%) | 0 (0.0%) |
| 6 to 18 Years | 83 (100.0%) | 0 (0.0%) |
| 19 to 25 Years | 28 (100.0%) | 0 (0.0%) |
| 26 to 34 Years | 39 (95.1%) | 2 (4.9%) |
| 35 to 44 Years | 14 (100.0%) | 0 (0.0%) |
| 45 to 54 Years | 39 (86.7%) | 6 (13.3%) |
| 55 to 64 Years | 32 (74.4%) | 11 (25.6%) |
| 65 to 74 Years | 19 (100.0%) | 0 (0.0%) |
| 75 Years and older | 28 (100.0%) | 0 (0.0%) |
| Total | 301 (94.1%) | 19 (5.9%) |
Health Insurance Coverage by Citizenship Status in Fort Supply
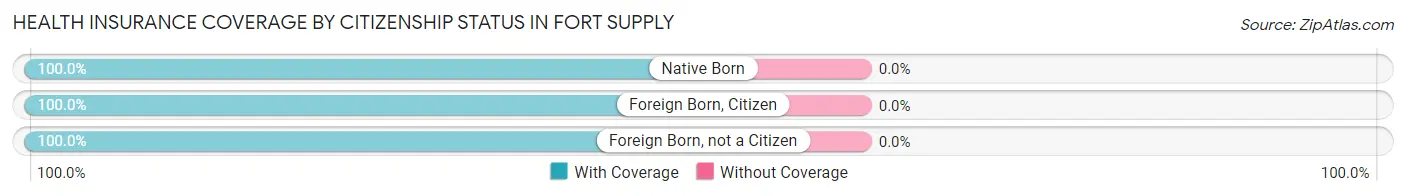
| Citizenship Status | With Coverage | Without Coverage |
| Native Born | 19 (100.0%) | 0 (0.0%) |
| Foreign Born, Citizen | 83 (100.0%) | 0 (0.0%) |
| Foreign Born, not a Citizen | 28 (100.0%) | 0 (0.0%) |
Health Insurance Coverage by Household Income in Fort Supply
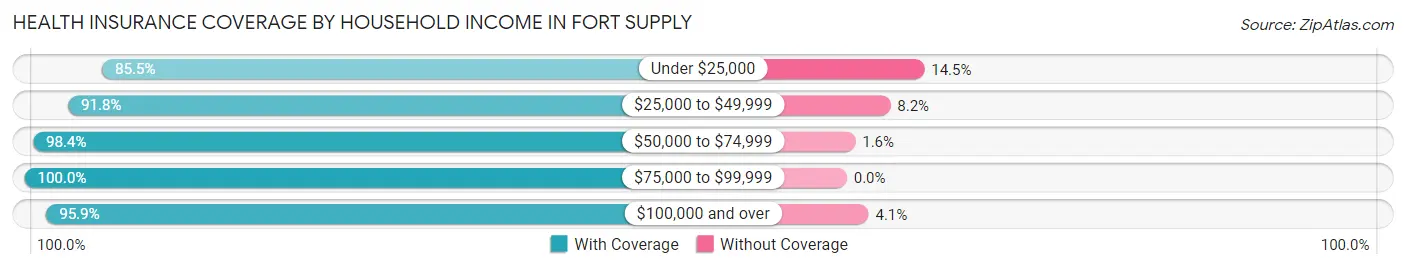
| Household Income | With Coverage | Without Coverage |
| Under $25,000 | 53 (85.5%) | 9 (14.5%) |
| $25,000 to $49,999 | 45 (91.8%) | 4 (8.2%) |
| $50,000 to $74,999 | 62 (98.4%) | 1 (1.6%) |
| $75,000 to $99,999 | 23 (100.0%) | 0 (0.0%) |
| $100,000 and over | 118 (95.9%) | 5 (4.1%) |
Public vs Private Health Insurance Coverage by Age in Fort Supply
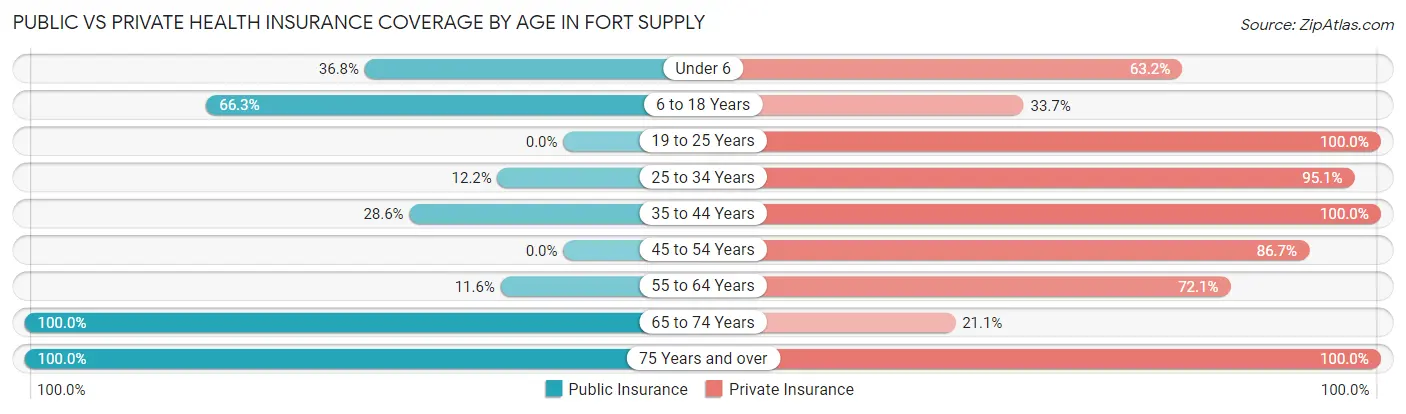
| Age Bracket | Public Insurance | Private Insurance |
| Under 6 | 7 (36.8%) | 12 (63.2%) |
| 6 to 18 Years | 55 (66.3%) | 28 (33.7%) |
| 19 to 25 Years | 0 (0.0%) | 28 (100.0%) |
| 25 to 34 Years | 5 (12.2%) | 39 (95.1%) |
| 35 to 44 Years | 4 (28.6%) | 14 (100.0%) |
| 45 to 54 Years | 0 (0.0%) | 39 (86.7%) |
| 55 to 64 Years | 5 (11.6%) | 31 (72.1%) |
| 65 to 74 Years | 19 (100.0%) | 4 (21.0%) |
| 75 Years and over | 28 (100.0%) | 28 (100.0%) |
| Total | 123 (38.4%) | 223 (69.7%) |
Disability Status by Sex by Age in Fort Supply
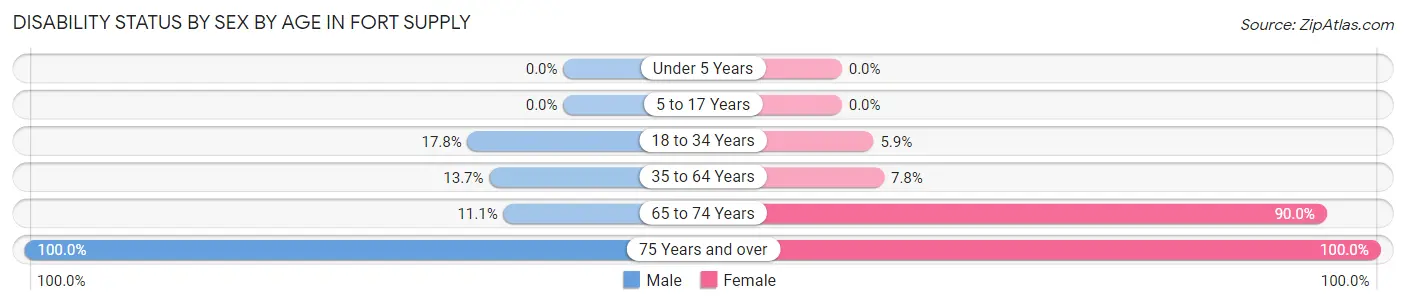
| Age Bracket | Male | Female |
| Under 5 Years | 0 (0.0%) | 0 (0.0%) |
| 5 to 17 Years | 0 (0.0%) | 0 (0.0%) |
| 18 to 34 Years | 8 (17.8%) | 2 (5.9%) |
| 35 to 64 Years | 7 (13.7%) | 4 (7.8%) |
| 65 to 74 Years | 1 (11.1%) | 9 (90.0%) |
| 75 Years and over | 17 (100.0%) | 11 (100.0%) |
Disability Class by Sex by Age in Fort Supply
Disability Class: Hearing Difficulty
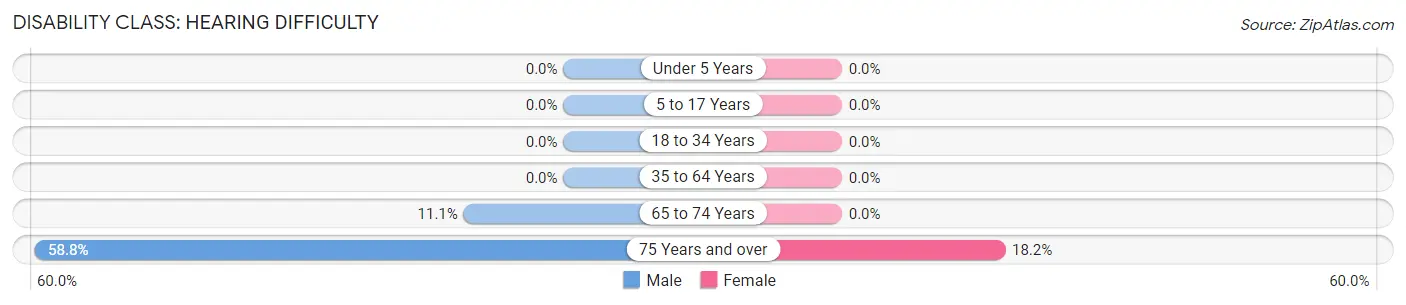
| Age Bracket | Male | Female |
| Under 5 Years | 0 (0.0%) | 0 (0.0%) |
| 5 to 17 Years | 0 (0.0%) | 0 (0.0%) |
| 18 to 34 Years | 0 (0.0%) | 0 (0.0%) |
| 35 to 64 Years | 0 (0.0%) | 0 (0.0%) |
| 65 to 74 Years | 1 (11.1%) | 0 (0.0%) |
| 75 Years and over | 10 (58.8%) | 2 (18.2%) |
Disability Class: Vision Difficulty
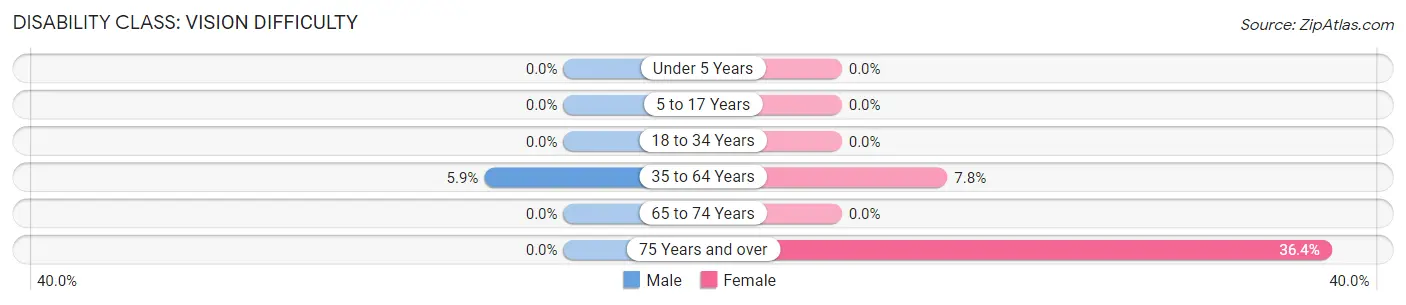
| Age Bracket | Male | Female |
| Under 5 Years | 0 (0.0%) | 0 (0.0%) |
| 5 to 17 Years | 0 (0.0%) | 0 (0.0%) |
| 18 to 34 Years | 0 (0.0%) | 0 (0.0%) |
| 35 to 64 Years | 3 (5.9%) | 4 (7.8%) |
| 65 to 74 Years | 0 (0.0%) | 0 (0.0%) |
| 75 Years and over | 0 (0.0%) | 4 (36.4%) |
Disability Class: Cognitive Difficulty
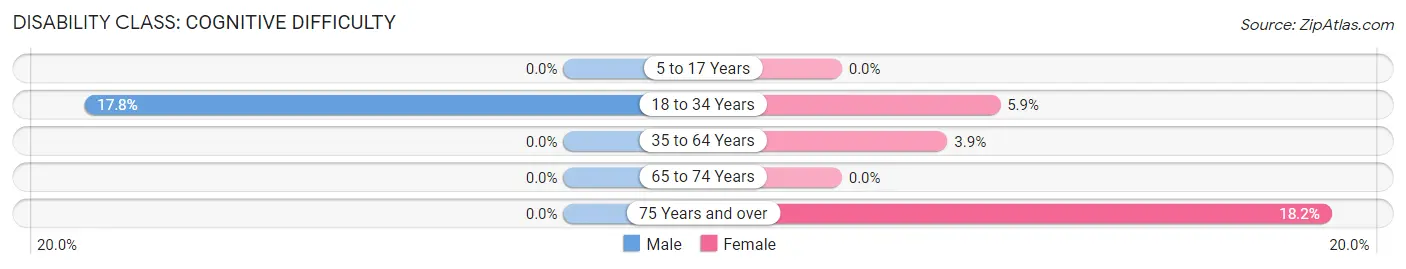
| Age Bracket | Male | Female |
| 5 to 17 Years | 0 (0.0%) | 0 (0.0%) |
| 18 to 34 Years | 8 (17.8%) | 2 (5.9%) |
| 35 to 64 Years | 0 (0.0%) | 2 (3.9%) |
| 65 to 74 Years | 0 (0.0%) | 0 (0.0%) |
| 75 Years and over | 0 (0.0%) | 2 (18.2%) |
Disability Class: Ambulatory Difficulty
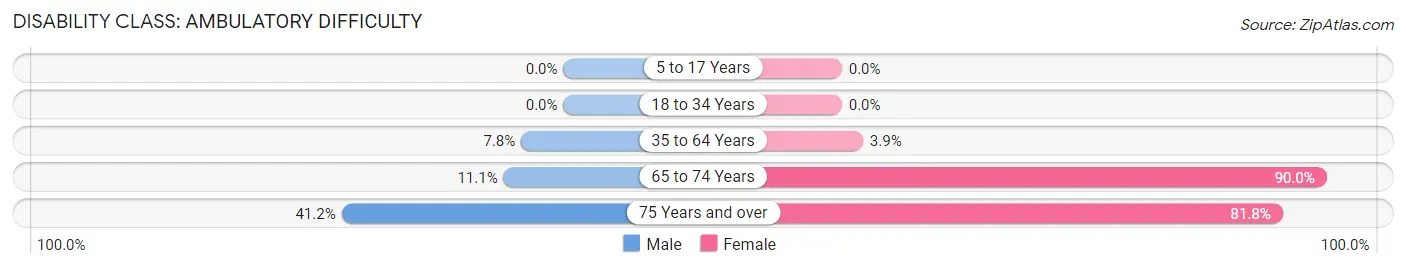
| Age Bracket | Male | Female |
| 5 to 17 Years | 0 (0.0%) | 0 (0.0%) |
| 18 to 34 Years | 0 (0.0%) | 0 (0.0%) |
| 35 to 64 Years | 4 (7.8%) | 2 (3.9%) |
| 65 to 74 Years | 1 (11.1%) | 9 (90.0%) |
| 75 Years and over | 7 (41.2%) | 9 (81.8%) |
Disability Class: Self-Care Difficulty
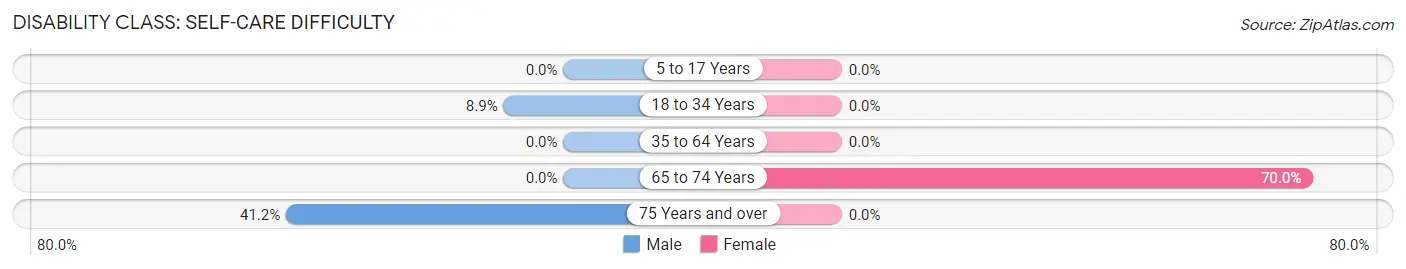
| Age Bracket | Male | Female |
| 5 to 17 Years | 0 (0.0%) | 0 (0.0%) |
| 18 to 34 Years | 4 (8.9%) | 0 (0.0%) |
| 35 to 64 Years | 0 (0.0%) | 0 (0.0%) |
| 65 to 74 Years | 0 (0.0%) | 7 (70.0%) |
| 75 Years and over | 7 (41.2%) | 0 (0.0%) |
Technology Access in Fort Supply
Computing Device Access in Fort Supply
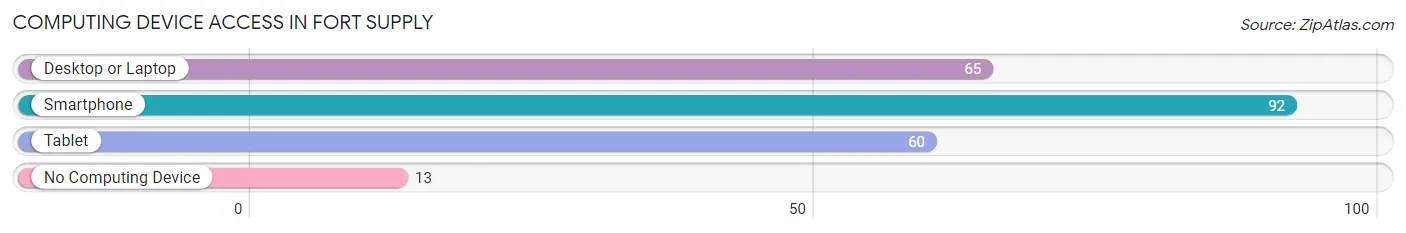
| Device Type | # Households | % Households |
| Desktop or Laptop | 65 | 61.9% |
| Smartphone | 92 | 87.6% |
| Tablet | 60 | 57.1% |
| No Computing Device | 13 | 12.4% |
| Total | 105 | 100.0% |
Internet Access in Fort Supply
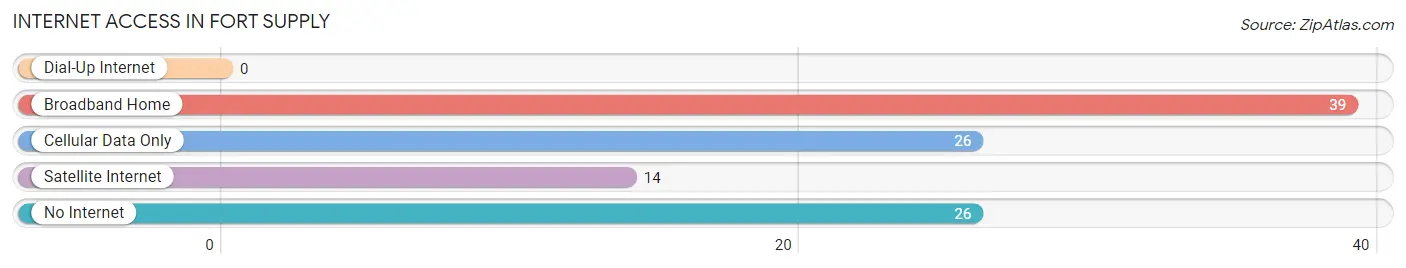
| Internet Type | # Households | % Households |
| Dial-Up Internet | 0 | 0.0% |
| Broadband Home | 39 | 37.1% |
| Cellular Data Only | 26 | 24.8% |
| Satellite Internet | 14 | 13.3% |
| No Internet | 26 | 24.8% |
| Total | 105 | 100.0% |
Fort Supply Summary
Fort Supply is a small town located in Woodward County, Oklahoma. It is situated on the western edge of the state, near the Oklahoma-Kansas border. The town was founded in 1868 as a military post to protect the Cheyenne and Arapaho Indians from hostile forces. The town was named after General William B. Hazen, who was the commander of the post.
Fort Supply is located in the western part of Oklahoma, near the Oklahoma-Kansas border. It is situated in the Red Bed Plains region of the state, which is characterized by flat terrain and sandy soils. The town is located in the Cimarron River Valley, which is a major tributary of the Arkansas River. The town is located at an elevation of 1,845 feet above sea level.
The population of Fort Supply was 1,093 in the year 2000. The population is predominantly white, with a small percentage of African Americans and Native Americans. The median household income in the town was $25,938 in 2000, and the median family income was $31,250. The per capita income was $14,845.
The economy of Fort Supply is largely based on agriculture. The town is home to several large farms, which produce wheat, corn, and other crops. The town also has a few small businesses, including a grocery store, a hardware store, and a few restaurants.
Fort Supply is served by the Woodward County School District. The town has one elementary school, one middle school, and one high school. The town also has a library and a museum.
Fort Supply is home to several historical sites, including the Fort Supply Historic Site, which is a National Historic Landmark. The site includes the original fort, which was built in 1868, as well as a museum and a visitor center. The town also has a few other historical sites, including the Fort Supply Cemetery, which is the final resting place of many of the soldiers who served at the fort.
Fort Supply is a small town with a rich history and a bright future. The town is home to a diverse population, and its economy is largely based on agriculture. The town is also home to several historical sites, which attract visitors from all over the country. Fort Supply is a great place to live, work, and raise a family.
Common Questions
What is Per Capita Income in Fort Supply?
Per Capita income in Fort Supply is $28,500.
What is the Median Family Income in Fort Supply?
Median Family Income in Fort Supply is $70,481.
What is the Median Household income in Fort Supply?
Median Household Income in Fort Supply is $59,375.
What is Income or Wage Gap in Fort Supply?
Income or Wage Gap in Fort Supply is 32.6%.
Women in Fort Supply earn 67.4 cents for every dollar earned by a man.
What is Inequality or Gini Index in Fort Supply?
Inequality or Gini Index in Fort Supply is 0.38.
What is the Total Population of Fort Supply?
Total Population of Fort Supply is 324.
What is the Total Male Population of Fort Supply?
Total Male Population of Fort Supply is 138.
What is the Total Female Population of Fort Supply?
Total Female Population of Fort Supply is 186.
What is the Ratio of Males per 100 Females in Fort Supply?
There are 74.19 Males per 100 Females in Fort Supply.
What is the Ratio of Females per 100 Males in Fort Supply?
There are 134.78 Females per 100 Males in Fort Supply.
What is the Median Population Age in Fort Supply?
Median Population Age in Fort Supply is 31.7 Years.
What is the Average Family Size in Fort Supply
Average Family Size in Fort Supply is 3.2 People.
What is the Average Household Size in Fort Supply
Average Household Size in Fort Supply is 3.0 People.
How Large is the Labor Force in Fort Supply?
There are 165 People in the Labor Forcein in Fort Supply.
What is the Percentage of People in the Labor Force in Fort Supply?
66.3% of People are in the Labor Force in Fort Supply.
What is the Unemployment Rate in Fort Supply?
Unemployment Rate in Fort Supply is 10.3%.