Zip Codes with the Most Immigrants from Caribbean in Dayton, OH
RELATED REPORTS & OPTIONS
Caribbean
Dayton
Compare Zip Codes
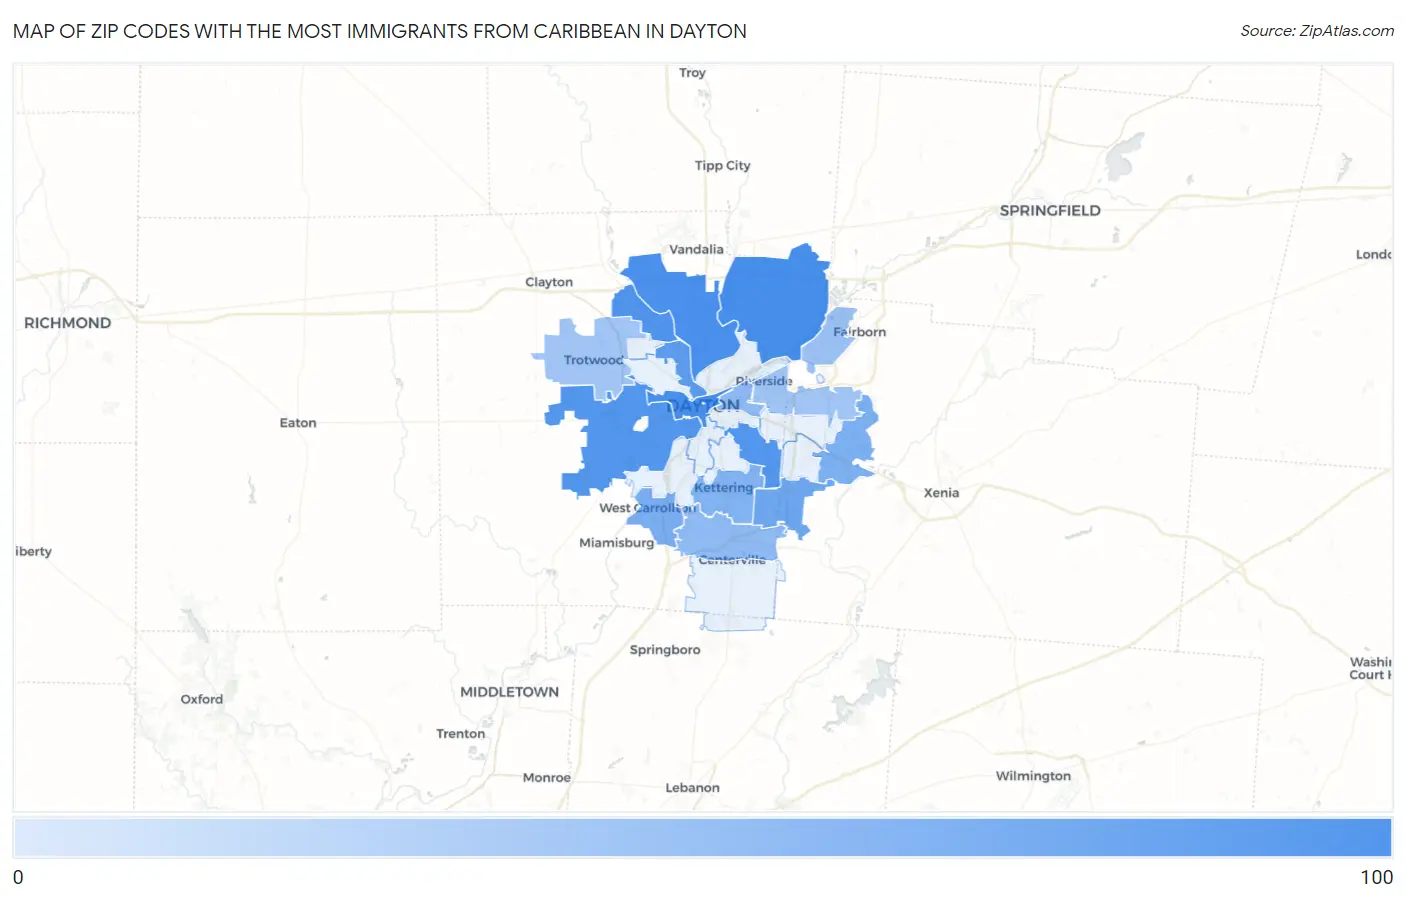
Map of Zip Codes with the Most Immigrants from Caribbean in Dayton
5
84
Zip Codes with the Most Immigrants from Caribbean in Dayton, OH
| Zip Code | Caribbean | vs State | vs National | |
| 1. | 45424 | 84 | 18,985(0.44%)#60 | 4,544,093(0.00%)#4,139 |
| 2. | 45402 | 83 | 18,985(0.44%)#61 | 4,544,093(0.00%)#4,186 |
| 3. | 45414 | 76 | 18,985(0.40%)#65 | 4,544,093(0.00%)#4,386 |
| 4. | 45415 | 67 | 18,985(0.35%)#76 | 4,544,093(0.00%)#4,697 |
| 5. | 45417 | 59 | 18,985(0.31%)#84 | 4,544,093(0.00%)#5,003 |
| 6. | 45420 | 59 | 18,985(0.31%)#86 | 4,544,093(0.00%)#5,007 |
| 7. | 45405 | 48 | 18,985(0.25%)#99 | 4,544,093(0.00%)#5,516 |
| 8. | 45440 | 26 | 18,985(0.14%)#151 | 4,544,093(0.00%)#6,876 |
| 9. | 45449 | 18 | 18,985(0.09%)#186 | 4,544,093(0.00%)#7,674 |
| 10. | 45434 | 17 | 18,985(0.09%)#189 | 4,544,093(0.00%)#7,793 |
| 11. | 45429 | 14 | 18,985(0.07%)#198 | 4,544,093(0.00%)#8,127 |
| 12. | 45403 | 10 | 18,985(0.05%)#216 | 4,544,093(0.00%)#8,758 |
| 13. | 45459 | 9 | 18,985(0.05%)#220 | 4,544,093(0.00%)#8,882 |
| 14. | 45433 | 6 | 18,985(0.03%)#241 | 4,544,093(0.00%)#9,559 |
| 15. | 45431 | 5 | 18,985(0.03%)#244 | 4,544,093(0.00%)#9,605 |
| 16. | 45426 | 5 | 18,985(0.03%)#246 | 4,544,093(0.00%)#9,630 |
1
Common Questions
What are the Top 10 Zip Codes with the Most Immigrants from Caribbean in Dayton, OH?
Top 10 Zip Codes with the Most Immigrants from Caribbean in Dayton, OH are:
What zip code has the Most Immigrants from Caribbean in Dayton, OH?
45424 has the Most Immigrants from Caribbean in Dayton, OH with 84.
What is the Total Immigrants from Caribbean in Dayton, OH?
Total Immigrants from Caribbean in Dayton is 268.
What is the Total Immigrants from Caribbean in Ohio?
Total Immigrants from Caribbean in Ohio is 18,985.
What is the Total Immigrants from Caribbean in the United States?
Total Immigrants from Caribbean in the United States is 4,544,093.