Zip Codes with the Highest Percentage of Population Employed in Firefighting & Prevention in Dayton, OH

RELATED REPORTS & OPTIONS

Firefighting & Prevention
Population
Families and Households
Female Fertility
Female Fertility (Unmarried)
Race (Community Size)
Race (Percentage)
Ancestry (Community Size)
AfricanAlbanianAlsatianAmericanApacheArabArgentineanArmenianAustralianAustrianBasqueBelgianBhutaneseBlackfeetBolivianBrazilianBritishBulgarianBurmeseCajunCanadianCape VerdeanCelticCentral AmericanCentral American IndianCherokeeChileanChippewaChoctawColombianCosta RicanCreekCroatianCubanCzechCzechoslovakianDanishDominicanDutchEastern EuropeanEcuadorianEgyptianEnglishEstonianEthiopianEuropeanFilipinoFinnishFrenchFrench CanadianGermanGhanaianGreekGuamanian / ChamorroGuatemalanHaitianHonduranHungarianIcelanderIndian (Asian)InupiatIranianIraqiIrishIroquoisItalianJamaicanJapaneseKenyanKoreanLaotianLatvianLebaneseLiberianLithuanianLuxembourgerMacedonianMalteseMexicanMexican American IndianMoroccanNative HawaiianNavajoNicaraguanNigerianNorthern EuropeanNorwegianOkinawanPakistaniPalestinianPanamanianPennsylvania GermanPeruvianPolishPortuguesePotawatomiPuerto RicanRomanianRussianSalvadoranSamoanScandinavianScotch-IrishScottishSeminoleSenegaleseSerbianSiouxSlavicSlovakSloveneSouth AfricanSouth AmericanSpaniardSpanishSri LankanSubsaharan AfricanSudaneseSwedishSwissSyrianThaiTrinidadian and TobagonianTurkishUkrainianVenezuelanWelshWest IndianYugoslavian
Ancestry (Percentage)
AfricanAlbanianAlsatianAmericanApacheArabArgentineanArmenianAustralianAustrianBasqueBelgianBhutaneseBlackfeetBolivianBrazilianBritishBulgarianBurmeseCajunCanadianCape VerdeanCelticCentral AmericanCentral American IndianCherokeeChileanChippewaChoctawColombianCosta RicanCreekCroatianCubanCzechCzechoslovakianDanishDominicanDutchEastern EuropeanEcuadorianEgyptianEnglishEstonianEthiopianEuropeanFilipinoFinnishFrenchFrench CanadianGermanGhanaianGreekGuamanian / ChamorroGuatemalanHaitianHonduranHungarianIcelanderIndian (Asian)InupiatIranianIraqiIrishIroquoisItalianJamaicanJapaneseKenyanKoreanLaotianLatvianLebaneseLiberianLithuanianLuxembourgerMacedonianMalteseMexicanMexican American IndianMoroccanNative HawaiianNavajoNicaraguanNigerianNorthern EuropeanNorwegianOkinawanPakistaniPalestinianPanamanianPennsylvania GermanPeruvianPolishPortuguesePotawatomiPuerto RicanRomanianRussianSalvadoranSamoanScandinavianScotch-IrishScottishSeminoleSenegaleseSerbianSiouxSlavicSlovakSloveneSouth AfricanSouth AmericanSpaniardSpanishSri LankanSubsaharan AfricanSudaneseSwedishSwissSyrianThaiTrinidadian and TobagonianTurkishUkrainianVenezuelanWelshWest IndianYugoslavian
Immigrant Origin (Total)
AfricaArgentinaAsiaAustraliaBelarusBosnia and HerzegovinaBrazilBulgariaCambodiaCameroonCanadaCaribbeanCentral AmericaChinaColombiaCongoCosta RicaCubaDominican RepublicEastern AfricaEastern AsiaEastern EuropeEcuadorEgyptEl SalvadorEnglandEthiopiaEuropeFranceGermanyGhanaGreeceGuatemalaGuyanaHaitiHondurasHong KongHungaryIndiaIndonesiaIranIraqIrelandIsraelItalyJamaicaJapanJordanKenyaKoreaKuwaitLatin AmericaLebanonLiberiaMalaysiaMexicoMiddle AfricaMoldovaMoroccoNetherlandsNigeriaNorthern AfricaNorthern EuropeNorwayOceaniaPakistanPanamaPeruPhilippinesPolandPortugalRomaniaRussiaSaudi ArabiaScotlandSenegalSingaporeSouth AfricaSouth AmericaSouth Central AsiaSouth Eastern AsiaSouthern EuropeSpainSudanTaiwanThailandTrinidad and TobagoTurkeyUkraineUzbekistanVenezuelaVietnamWestern AfricaWestern AsiaWestern EuropeZaire
Immigrant Origin (Percentage)
AfricaArgentinaAsiaAustraliaBelarusBosnia and HerzegovinaBrazilBulgariaCambodiaCameroonCanadaCaribbeanCentral AmericaChinaColombiaCongoCosta RicaCubaDominican RepublicEastern AfricaEastern AsiaEastern EuropeEcuadorEgyptEl SalvadorEnglandEthiopiaEuropeFranceGermanyGhanaGreeceGuatemalaGuyanaHaitiHondurasHong KongHungaryIndiaIndonesiaIranIraqIrelandIsraelItalyJamaicaJapanJordanKenyaKoreaKuwaitLatin AmericaLebanonLiberiaMalaysiaMexicoMiddle AfricaMoldovaMoroccoNetherlandsNigeriaNorthern AfricaNorthern EuropeNorwayOceaniaPakistanPanamaPeruPhilippinesPolandPortugalRomaniaRussiaSaudi ArabiaScotlandSenegalSingaporeSouth AfricaSouth AmericaSouth Central AsiaSouth Eastern AsiaSouthern EuropeSpainSudanTaiwanThailandTrinidad and TobagoTurkeyUkraineUzbekistanVenezuelaVietnamWestern AfricaWestern AsiaWestern EuropeZaire
Income
Income (Families)
Income (Households)
Poverty
Poverty (Families)
Unemployment
Employment Occupations
Employment Industries
Employer Class
Commute Time
Commute Means
School Enrollment
Education by Degree Field
Occupancy
Finances
Physical Characteristics
Dayton
Compare Zip Codes
Comparison Subject

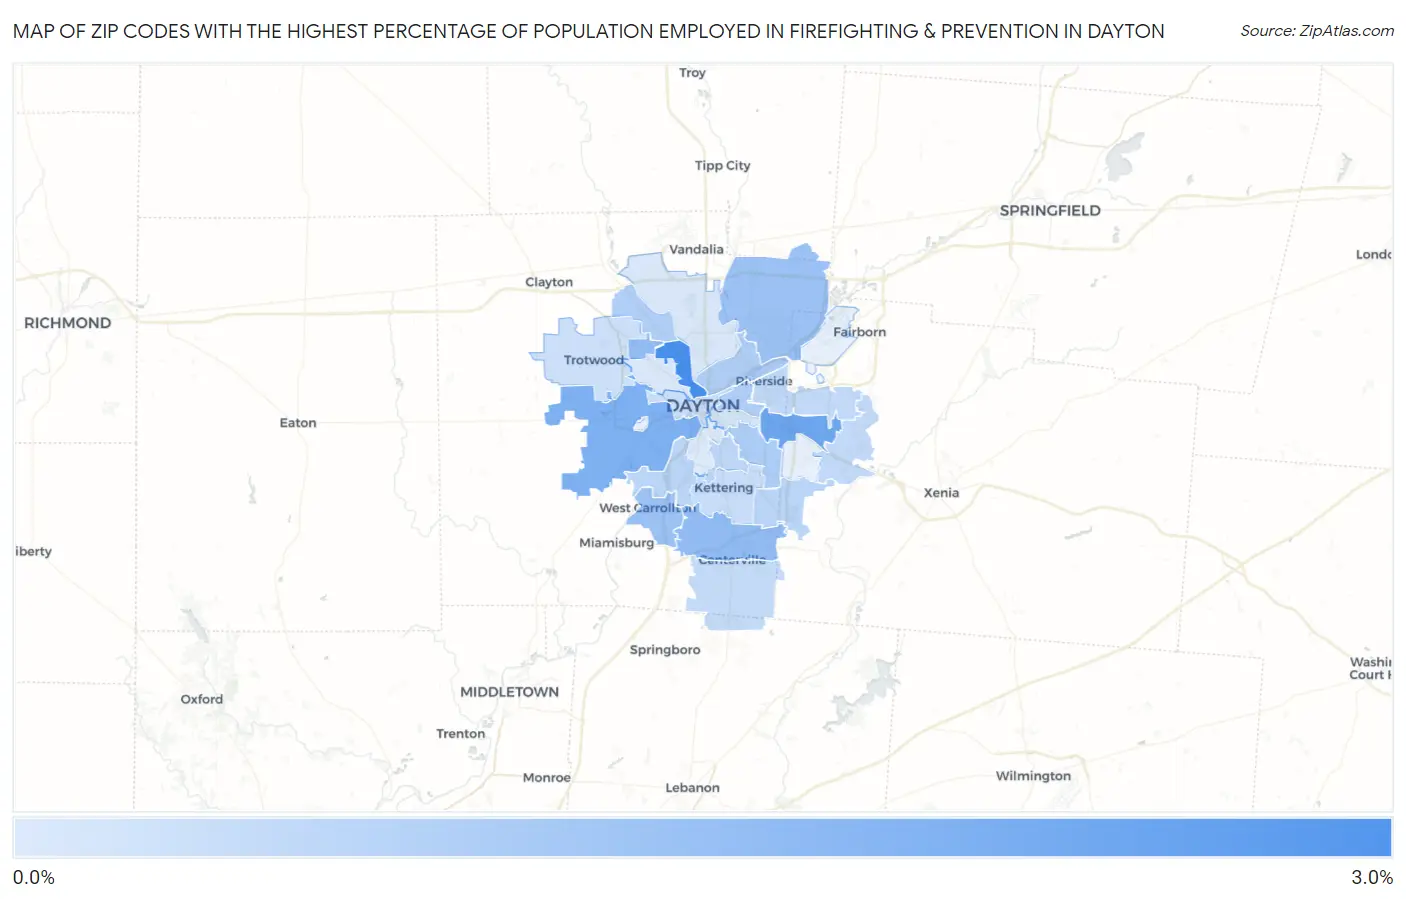
Map of Zip Codes with the Highest Percentage of Population Employed in Firefighting & Prevention in Dayton

0.0%
3.0%
Zip Codes with the Highest Percentage of Population Employed in Firefighting & Prevention in Dayton Map

Zip Codes with the Highest Percentage of Population Employed in Firefighting & Prevention in Dayton, OH

Zip Code % Employed vs State vs National
1.454052.6%1.1%(+1.55)#761.2%(+1.43)#2,859
2.454322.0%1.1%(+0.967)#1271.2%(+0.847)#4,392
3.454171.8%1.1%(+0.705)#1571.2%(+0.585)#5,492
4.454591.5%1.1%(+0.461)#2131.2%(+0.341)#6,803
5.454161.5%1.1%(+0.424)#2211.2%(+0.304)#7,041
6.454241.4%1.1%(+0.289)#2591.2%(+0.169)#7,942
7.454491.3%1.1%(+0.257)#2641.2%(+0.137)#8,182
8.454201.1%1.1%(+0.031)#3491.2%(-0.089)#10,131
9.454031.1%1.1%(+0.006)#3561.2%(-0.114)#10,362
10.454041.1%1.1%(-0.003)#3631.2%(-0.123)#10,448
11.454151.0%1.1%(-0.040)#3791.2%(-0.160)#10,817
12.454390.90%1.1%(-0.168)#4431.2%(-0.288)#12,189
13.454400.88%1.1%(-0.181)#4521.2%(-0.301)#12,322
14.454190.86%1.1%(-0.202)#4661.2%(-0.322)#12,537
15.454340.80%1.1%(-0.262)#4971.2%(-0.382)#13,167
16.454310.77%1.1%(-0.292)#5101.2%(-0.412)#13,499
17.454580.75%1.1%(-0.313)#5161.2%(-0.433)#13,724
18.454290.71%1.1%(-0.361)#5421.2%(-0.481)#14,275
19.454020.66%1.1%(-0.403)#5681.2%(-0.523)#14,753
20.454260.62%1.1%(-0.447)#5921.2%(-0.566)#15,206
21.454100.52%1.1%(-0.548)#6391.2%(-0.668)#16,356
22.454060.45%1.1%(-0.617)#6651.2%(-0.737)#17,104
23.454140.45%1.1%(-0.620)#6671.2%(-0.740)#17,142
24.454090.38%1.1%(-0.684)#6971.2%(-0.804)#17,859

Common Questions

What are the Top 10 Zip Codes with the Highest Percentage of Population Employed in Firefighting & Prevention in Dayton, OH?
Top 10 Zip Codes with the Highest Percentage of Population Employed in Firefighting & Prevention in Dayton, OH are:
#1
2.6%
#2
2.0%
#3
1.8%
#4
1.5%
#5
1.5%
#6
1.4%
#7
1.3%
#8
1.1%
#9
1.1%
#10
1.1%
What zip code has the Highest Percentage of Population Employed in Firefighting & Prevention in Dayton, OH?
45405 has the Highest Percentage of Population Employed in Firefighting & Prevention in Dayton, OH with 2.6%.
What is the Percentage of Population Employed in Firefighting & Prevention in Dayton, OH?
Percentage of Population Employed in Firefighting & Prevention in Dayton is 1.2%.
What is the Percentage of Population Employed in Firefighting & Prevention in Ohio?
Percentage of Population Employed in Firefighting & Prevention in Ohio is 1.1%.
What is the Percentage of Population Employed in Firefighting & Prevention in the United States?
Percentage of Population Employed in Firefighting & Prevention in the United States is 1.2%.