Howell, MI Map & Demographics
Howell Map
Howell Overview
$37,300
PER CAPITA INCOME
$86,739
AVG FAMILY INCOME
$53,953
AVG HOUSEHOLD INCOME
22.8%
WAGE / INCOME GAP [ % ]
77.2¢/ $1
WAGE / INCOME GAP [ $ ]
$8,669
FAMILY INCOME DEFICIT
0.39
INEQUALITY / GINI INDEX
10,067
TOTAL POPULATION
4,807
MALE POPULATION
5,260
FEMALE POPULATION
91.39
MALES / 100 FEMALES
109.42
FEMALES / 100 MALES
37.4
MEDIAN AGE
2.9
AVG FAMILY SIZE
2.0
AVG HOUSEHOLD SIZE
5,659
LABOR FORCE [ PEOPLE ]
66.4%
PERCENT IN LABOR FORCE
4.4%
UNEMPLOYMENT RATE
Howell Area Codes
Income in Howell
Income Overview in Howell
Per Capita Income in Howell is $37,300, while median incomes of families and households are $86,739 and $53,953 respectively.
| Characteristic | Number | Measure |
| Per Capita Income | 10,067 | $37,300 |
| Median Family Income | 2,042 | $86,739 |
| Mean Family Income | 2,042 | $96,087 |
| Median Household Income | 4,839 | $53,953 |
| Mean Household Income | 4,839 | $69,748 |
| Income Deficit | 2,042 | $8,669 |
| Wage / Income Gap (%) | 10,067 | 22.82% |
| Wage / Income Gap ($) | 10,067 | 77.18¢ per $1 |
| Gini / Inequality Index | 10,067 | 0.39 |
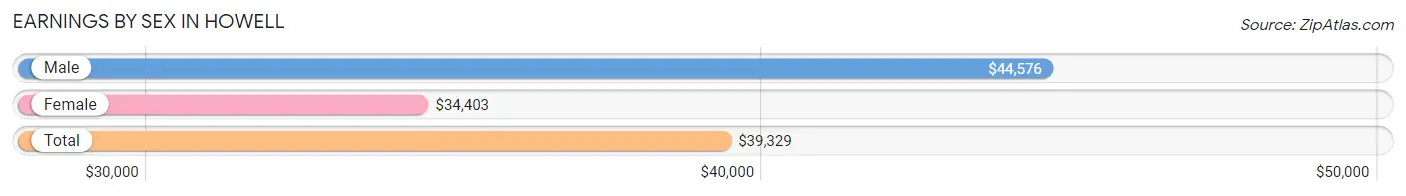
Earnings by Sex in Howell
Average Earnings in Howell are $39,329, $44,576 for men and $34,403 for women, a difference of 22.8%.
| Sex | Number | Average Earnings |
| Male | 3,065 (52.0%) | $44,576 |
| Female | 2,828 (48.0%) | $34,403 |
| Total | 5,893 (100.0%) | $39,329 |
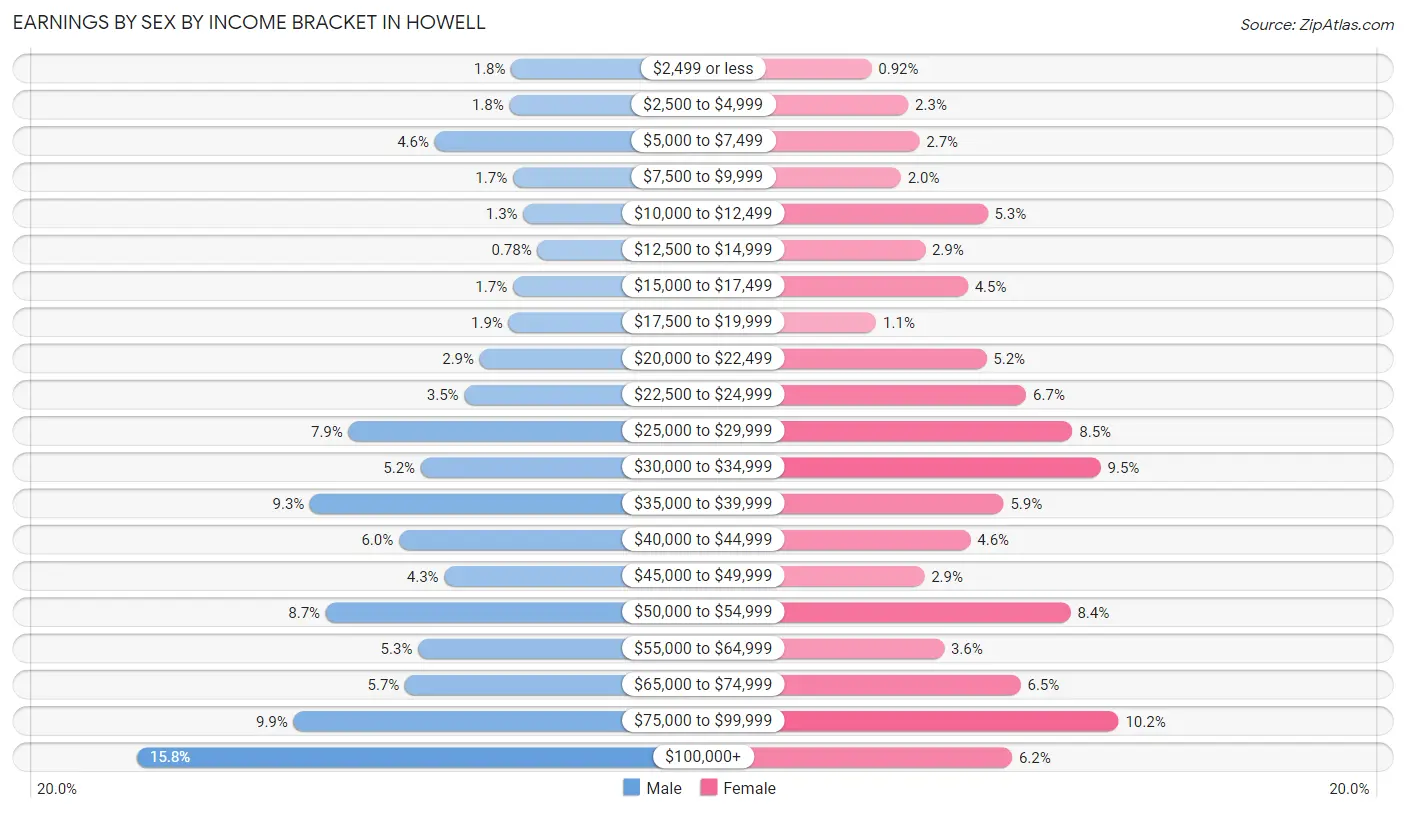
Earnings by Sex by Income Bracket in Howell
The most common earnings brackets in Howell are $100,000+ for men (484 | 15.8%) and $75,000 to $99,999 for women (288 | 10.2%).
| Income | Male | Female |
| $2,499 or less | 54 (1.8%) | 26 (0.9%) |
| $2,500 to $4,999 | 56 (1.8%) | 65 (2.3%) |
| $5,000 to $7,499 | 142 (4.6%) | 77 (2.7%) |
| $7,500 to $9,999 | 52 (1.7%) | 57 (2.0%) |
| $10,000 to $12,499 | 40 (1.3%) | 149 (5.3%) |
| $12,500 to $14,999 | 24 (0.8%) | 83 (2.9%) |
| $15,000 to $17,499 | 52 (1.7%) | 128 (4.5%) |
| $17,500 to $19,999 | 57 (1.9%) | 31 (1.1%) |
| $20,000 to $22,499 | 90 (2.9%) | 148 (5.2%) |
| $22,500 to $24,999 | 108 (3.5%) | 190 (6.7%) |
| $25,000 to $29,999 | 241 (7.9%) | 239 (8.5%) |
| $30,000 to $34,999 | 158 (5.1%) | 269 (9.5%) |
| $35,000 to $39,999 | 285 (9.3%) | 166 (5.9%) |
| $40,000 to $44,999 | 183 (6.0%) | 131 (4.6%) |
| $45,000 to $49,999 | 131 (4.3%) | 82 (2.9%) |
| $50,000 to $54,999 | 267 (8.7%) | 237 (8.4%) |
| $55,000 to $64,999 | 161 (5.2%) | 103 (3.6%) |
| $65,000 to $74,999 | 176 (5.7%) | 184 (6.5%) |
| $75,000 to $99,999 | 304 (9.9%) | 288 (10.2%) |
| $100,000+ | 484 (15.8%) | 175 (6.2%) |
| Total | 3,065 (100.0%) | 2,828 (100.0%) |
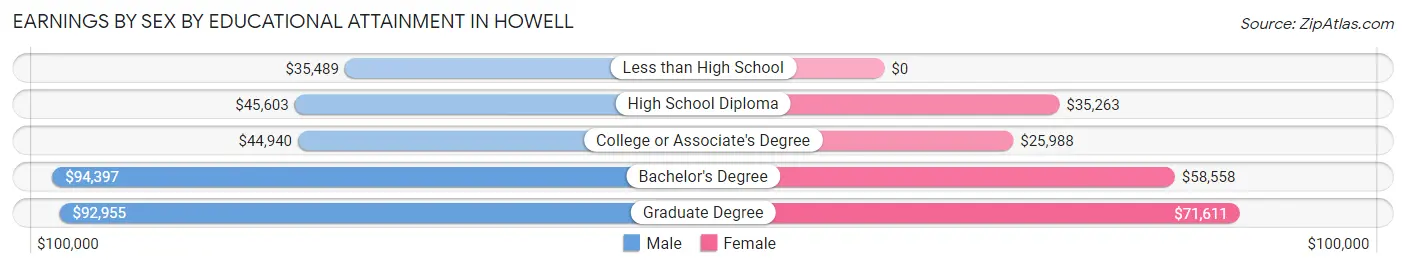
Earnings by Sex by Educational Attainment in Howell
Average earnings in Howell are $51,500 for men and $38,875 for women, a difference of 24.5%. Men with an educational attainment of bachelor's degree enjoy the highest average annual earnings of $94,397, while those with less than high school education earn the least with $35,489. Women with an educational attainment of graduate degree earn the most with the average annual earnings of $71,611, while those with college or associate's degree education have the smallest earnings of $25,988.
| Educational Attainment | Male Income | Female Income |
| Less than High School | $35,489 | $0 |
| High School Diploma | $45,603 | $35,263 |
| College or Associate's Degree | $44,940 | $25,988 |
| Bachelor's Degree | $94,397 | $58,558 |
| Graduate Degree | $92,955 | $71,611 |
| Total | $51,500 | $38,875 |
Family Income in Howell
Family Income Brackets in Howell
According to the Howell family income data, there are 545 families falling into the $100,000 to $149,999 income range, which is the most common income bracket and makes up 26.7% of all families. Conversely, the less than $10,000 income bracket is the least frequent group with only 20 families (1.0%) belonging to this category.
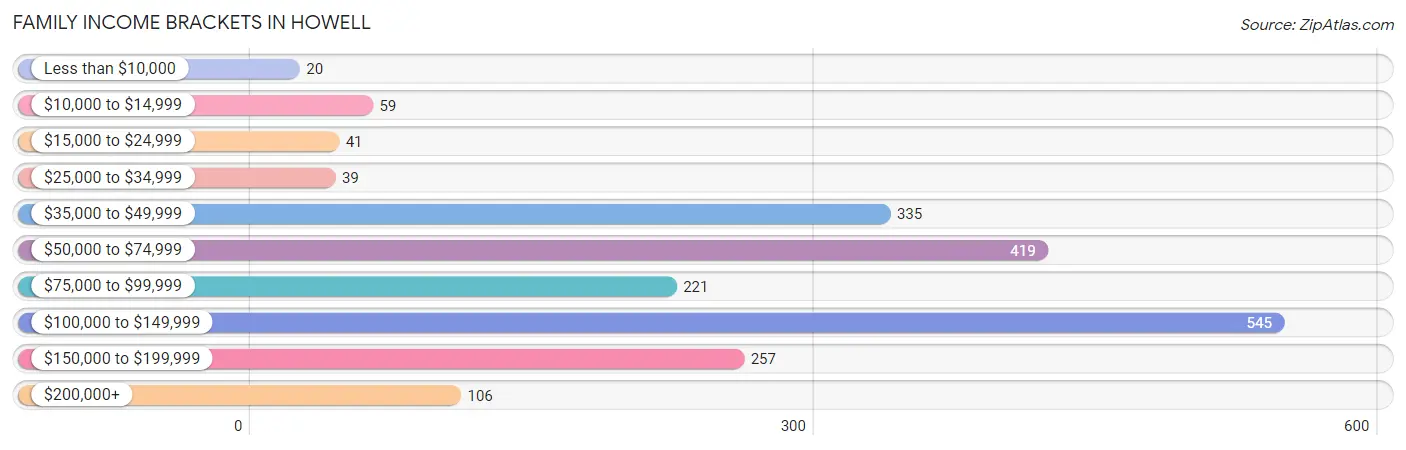
| Income Bracket | # Families | % Families |
| Less than $10,000 | 20 | 1.0% |
| $10,000 to $14,999 | 59 | 2.9% |
| $15,000 to $24,999 | 41 | 2.0% |
| $25,000 to $34,999 | 39 | 1.9% |
| $35,000 to $49,999 | 335 | 16.4% |
| $50,000 to $74,999 | 419 | 20.5% |
| $75,000 to $99,999 | 221 | 10.8% |
| $100,000 to $149,999 | 545 | 26.7% |
| $150,000 to $199,999 | 257 | 12.6% |
| $200,000+ | 106 | 5.2% |
Family Income by Famaliy Size in Howell
7+ person families (57 | 2.8%) account for the highest median family income in Howell with $158,576 per family, while 2-person families (1,163 | 57.0%) have the highest median income of $34,325 per family member.
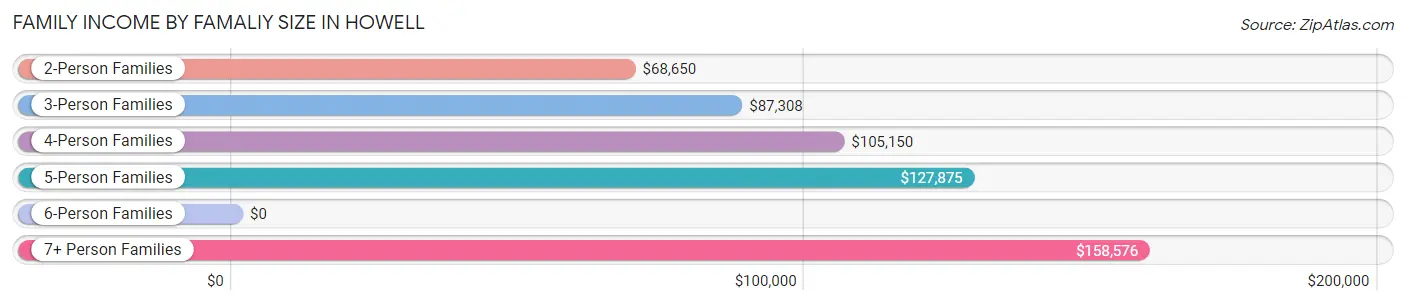
| Income Bracket | # Families | Median Income |
| 2-Person Families | 1,163 (57.0%) | $68,650 |
| 3-Person Families | 478 (23.4%) | $87,308 |
| 4-Person Families | 178 (8.7%) | $105,150 |
| 5-Person Families | 122 (6.0%) | $127,875 |
| 6-Person Families | 44 (2.1%) | $0 |
| 7+ Person Families | 57 (2.8%) | $158,576 |
| Total | 2,042 (100.0%) | $86,739 |
Family Income by Number of Earners in Howell
The median family income in Howell is $86,739, with families comprising 3+ earners (224) having the highest median family income of $157,292, while families with 1 earner (613) have the lowest median family income of $51,549, accounting for 11.0% and 30.0% of families, respectively.
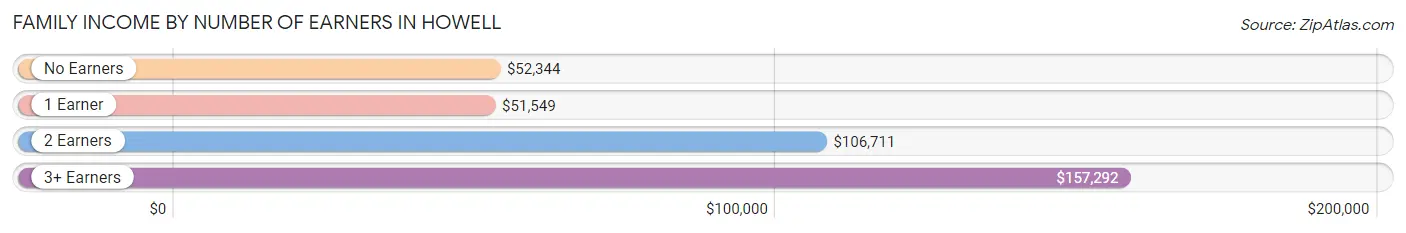
| Number of Earners | # Families | Median Income |
| No Earners | 305 (14.9%) | $52,344 |
| 1 Earner | 613 (30.0%) | $51,549 |
| 2 Earners | 900 (44.1%) | $106,711 |
| 3+ Earners | 224 (11.0%) | $157,292 |
| Total | 2,042 (100.0%) | $86,739 |
Household Income in Howell
Household Income Brackets in Howell
With 968 households falling in the category, the $50,000 to $74,999 income range is the most frequent in Howell, accounting for 20.0% of all households. In contrast, only 29 households (0.6%) fall into the less than $10,000 income bracket, making it the least populous group.
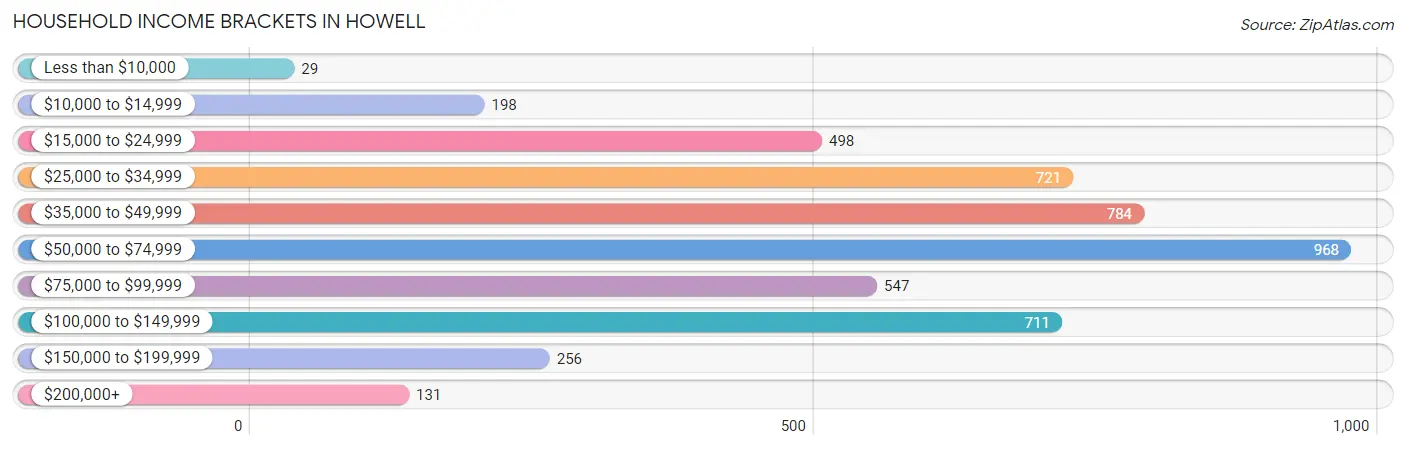
| Income Bracket | # Households | % Households |
| Less than $10,000 | 29 | 0.6% |
| $10,000 to $14,999 | 198 | 4.1% |
| $15,000 to $24,999 | 498 | 10.3% |
| $25,000 to $34,999 | 721 | 14.9% |
| $35,000 to $49,999 | 784 | 16.2% |
| $50,000 to $74,999 | 968 | 20.0% |
| $75,000 to $99,999 | 547 | 11.3% |
| $100,000 to $149,999 | 711 | 14.7% |
| $150,000 to $199,999 | 256 | 5.3% |
| $200,000+ | 131 | 2.7% |
Household Income by Householder Age in Howell
The median household income in Howell is $53,953, with the highest median household income of $75,536 found in the 25 to 44 years age bracket for the primary householder. A total of 1,415 households (29.2%) fall into this category. Meanwhile, the 65+ years age bracket for the primary householder has the lowest median household income of $33,847, with 1,243 households (25.7%) in this group.
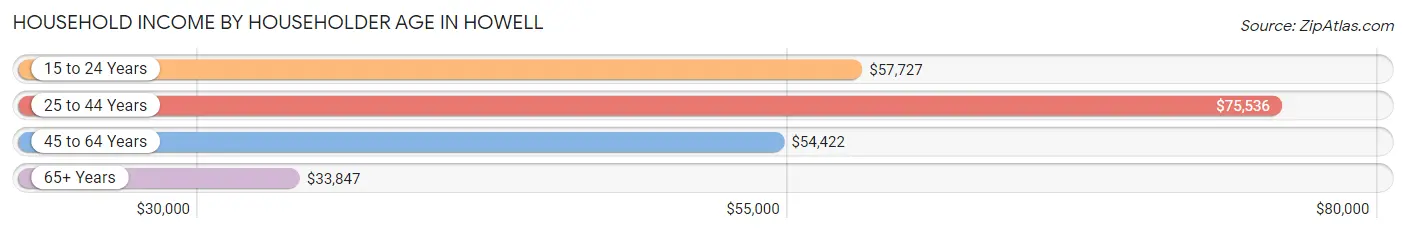
| Income Bracket | # Households | Median Income |
| 15 to 24 Years | 586 (12.1%) | $57,727 |
| 25 to 44 Years | 1,415 (29.2%) | $75,536 |
| 45 to 64 Years | 1,595 (33.0%) | $54,422 |
| 65+ Years | 1,243 (25.7%) | $33,847 |
| Total | 4,839 (100.0%) | $53,953 |
Poverty in Howell
Income Below Poverty by Sex and Age in Howell
With 2.7% poverty level for males and 8.0% for females among the residents of Howell, 6 to 11 year old males and 18 to 24 year old females are the most vulnerable to poverty, with 32 males (16.1%) and 96 females (14.0%) in their respective age groups living below the poverty level.
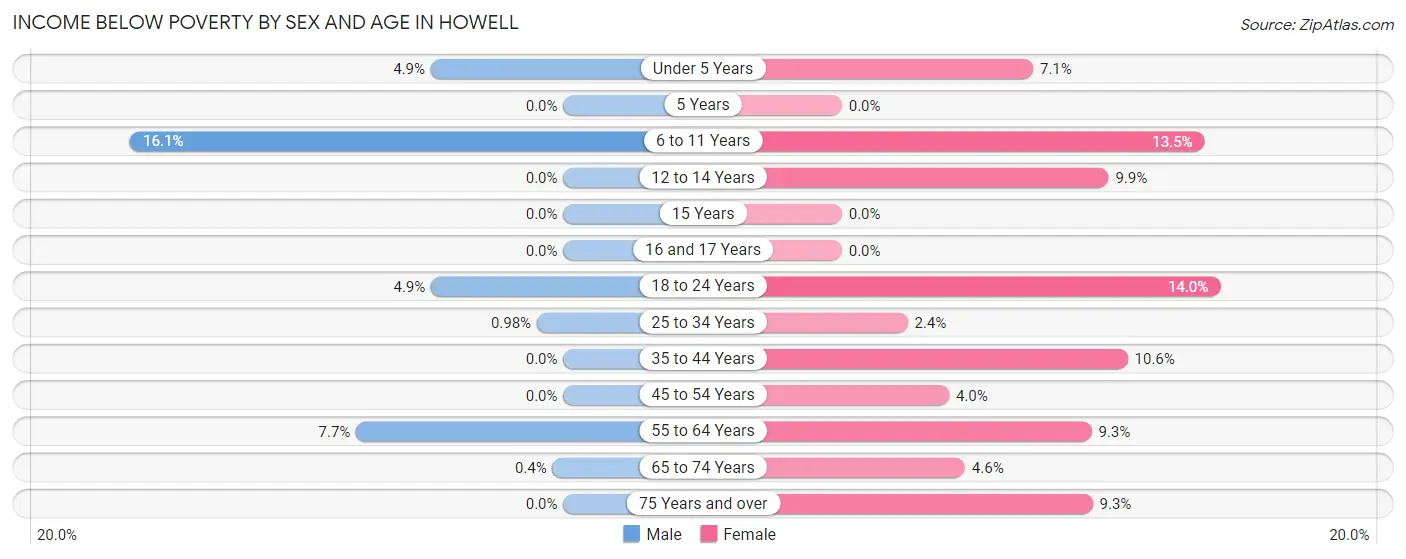
| Age Bracket | Male | Female |
| Under 5 Years | 15 (4.9%) | 11 (7.1%) |
| 5 Years | 0 (0.0%) | 0 (0.0%) |
| 6 to 11 Years | 32 (16.1%) | 35 (13.5%) |
| 12 to 14 Years | 0 (0.0%) | 10 (9.9%) |
| 15 Years | 0 (0.0%) | 0 (0.0%) |
| 16 and 17 Years | 0 (0.0%) | 0 (0.0%) |
| 18 to 24 Years | 26 (4.9%) | 96 (14.0%) |
| 25 to 34 Years | 10 (1.0%) | 18 (2.4%) |
| 35 to 44 Years | 0 (0.0%) | 61 (10.6%) |
| 45 to 54 Years | 0 (0.0%) | 20 (4.0%) |
| 55 to 64 Years | 38 (7.7%) | 71 (9.3%) |
| 65 to 74 Years | 1 (0.4%) | 23 (4.6%) |
| 75 Years and over | 0 (0.0%) | 59 (9.3%) |
| Total | 122 (2.7%) | 404 (8.0%) |
Income Above Poverty by Sex and Age in Howell
According to the poverty statistics in Howell, males aged 5 years and females aged 5 years are the age groups that are most secure financially, with 100.0% of males and 100.0% of females in these age groups living above the poverty line.
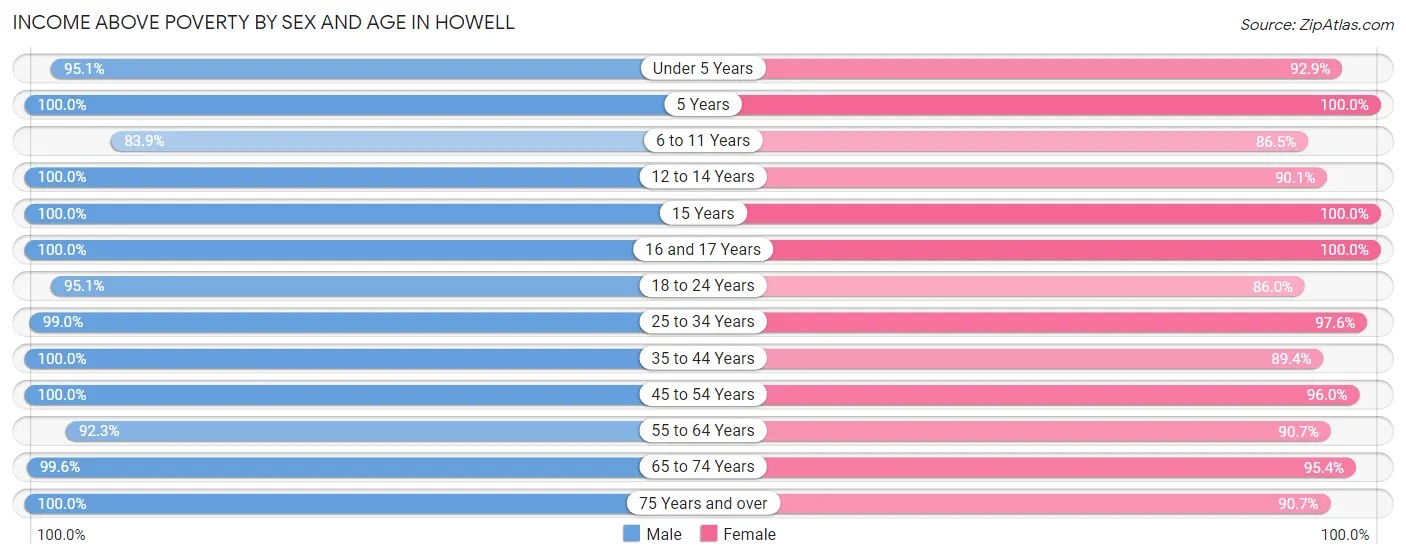
| Age Bracket | Male | Female |
| Under 5 Years | 290 (95.1%) | 144 (92.9%) |
| 5 Years | 82 (100.0%) | 10 (100.0%) |
| 6 to 11 Years | 167 (83.9%) | 225 (86.5%) |
| 12 to 14 Years | 226 (100.0%) | 91 (90.1%) |
| 15 Years | 107 (100.0%) | 10 (100.0%) |
| 16 and 17 Years | 123 (100.0%) | 85 (100.0%) |
| 18 to 24 Years | 503 (95.1%) | 588 (86.0%) |
| 25 to 34 Years | 1,010 (99.0%) | 719 (97.6%) |
| 35 to 44 Years | 491 (100.0%) | 514 (89.4%) |
| 45 to 54 Years | 476 (100.0%) | 483 (96.0%) |
| 55 to 64 Years | 456 (92.3%) | 695 (90.7%) |
| 65 to 74 Years | 252 (99.6%) | 480 (95.4%) |
| 75 Years and over | 177 (100.0%) | 575 (90.7%) |
| Total | 4,360 (97.3%) | 4,619 (92.0%) |
Income Below Poverty Among Married-Couple Families in Howell
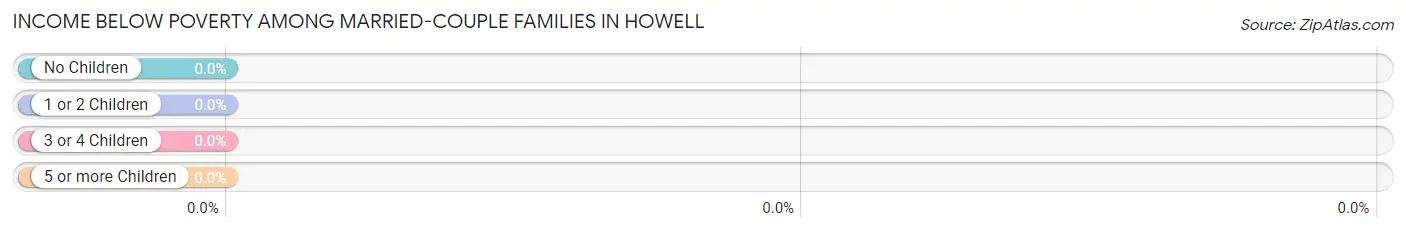
| Children | Above Poverty | Below Poverty |
| No Children | 821 (100.0%) | 0 (0.0%) |
| 1 or 2 Children | 389 (100.0%) | 0 (0.0%) |
| 3 or 4 Children | 123 (100.0%) | 0 (0.0%) |
| 5 or more Children | 43 (100.0%) | 0 (0.0%) |
| Total | 1,376 (100.0%) | 0 (0.0%) |
Income Below Poverty Among Single-Parent Households in Howell
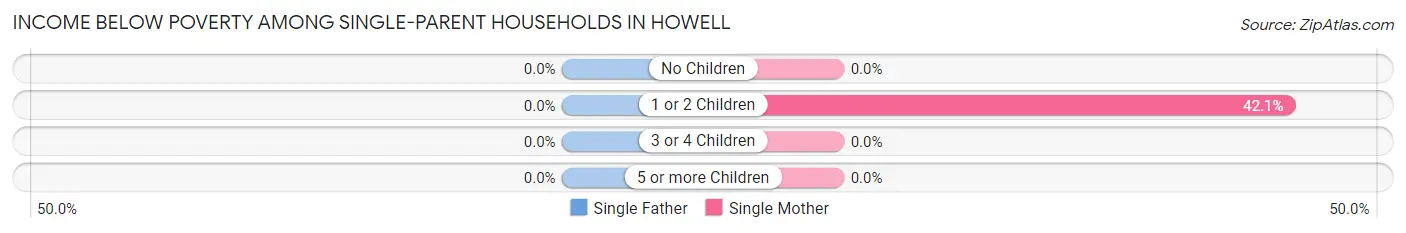
| Children | Single Father | Single Mother |
| No Children | 0 (0.0%) | 0 (0.0%) |
| 1 or 2 Children | 0 (0.0%) | 90 (42.1%) |
| 3 or 4 Children | 0 (0.0%) | 0 (0.0%) |
| 5 or more Children | 0 (0.0%) | 0 (0.0%) |
| Total | 0 (0.0%) | 90 (23.9%) |
Income Below Poverty Among Married-Couple vs Single-Parent Households in Howell
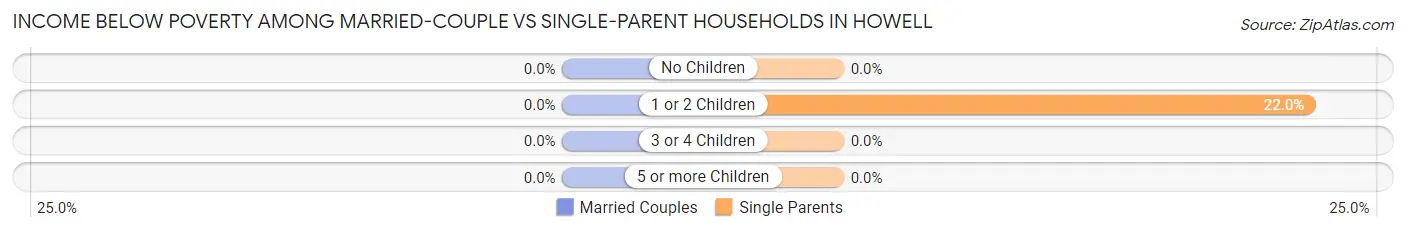
| Children | Married-Couple Families | Single-Parent Households |
| No Children | 0 (0.0%) | 0 (0.0%) |
| 1 or 2 Children | 0 (0.0%) | 90 (22.0%) |
| 3 or 4 Children | 0 (0.0%) | 0 (0.0%) |
| 5 or more Children | 0 (0.0%) | 0 (0.0%) |
| Total | 0 (0.0%) | 90 (13.5%) |
Race in Howell
The most populous races in Howell are White / Caucasian (9,105 | 90.4%), Hispanic or Latino (757 | 7.5%), and Two or more Races (414 | 4.1%).
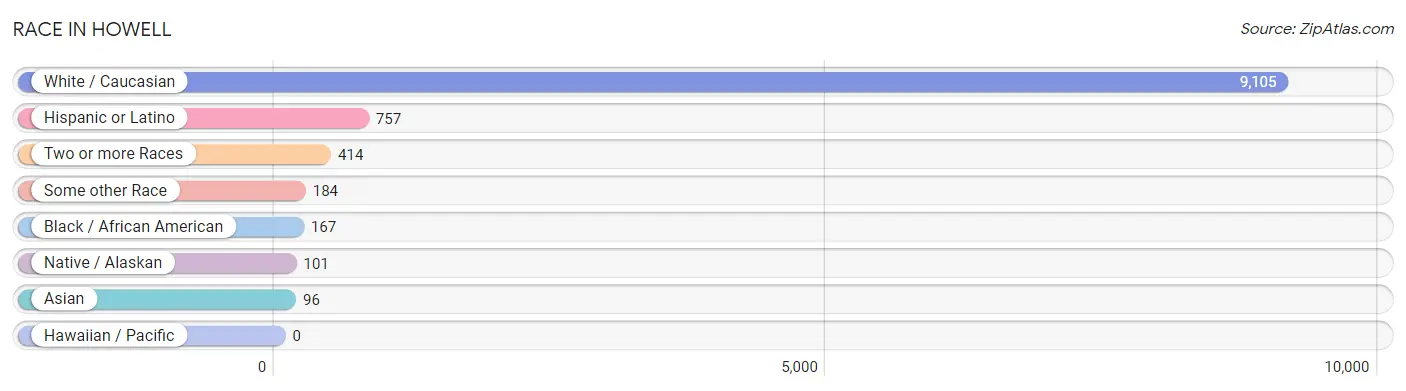
| Race | # Population | % Population |
| Asian | 96 | 0.9% |
| Black / African American | 167 | 1.7% |
| Hawaiian / Pacific | 0 | 0.0% |
| Hispanic or Latino | 757 | 7.5% |
| Native / Alaskan | 101 | 1.0% |
| White / Caucasian | 9,105 | 90.4% |
| Two or more Races | 414 | 4.1% |
| Some other Race | 184 | 1.8% |
| Total | 10,067 | 100.0% |
Ancestry in Howell
The most populous ancestries reported in Howell are German (2,216 | 22.0%), English (1,262 | 12.5%), Irish (1,068 | 10.6%), Polish (960 | 9.5%), and Italian (570 | 5.7%), together accounting for 60.4% of all Howell residents.
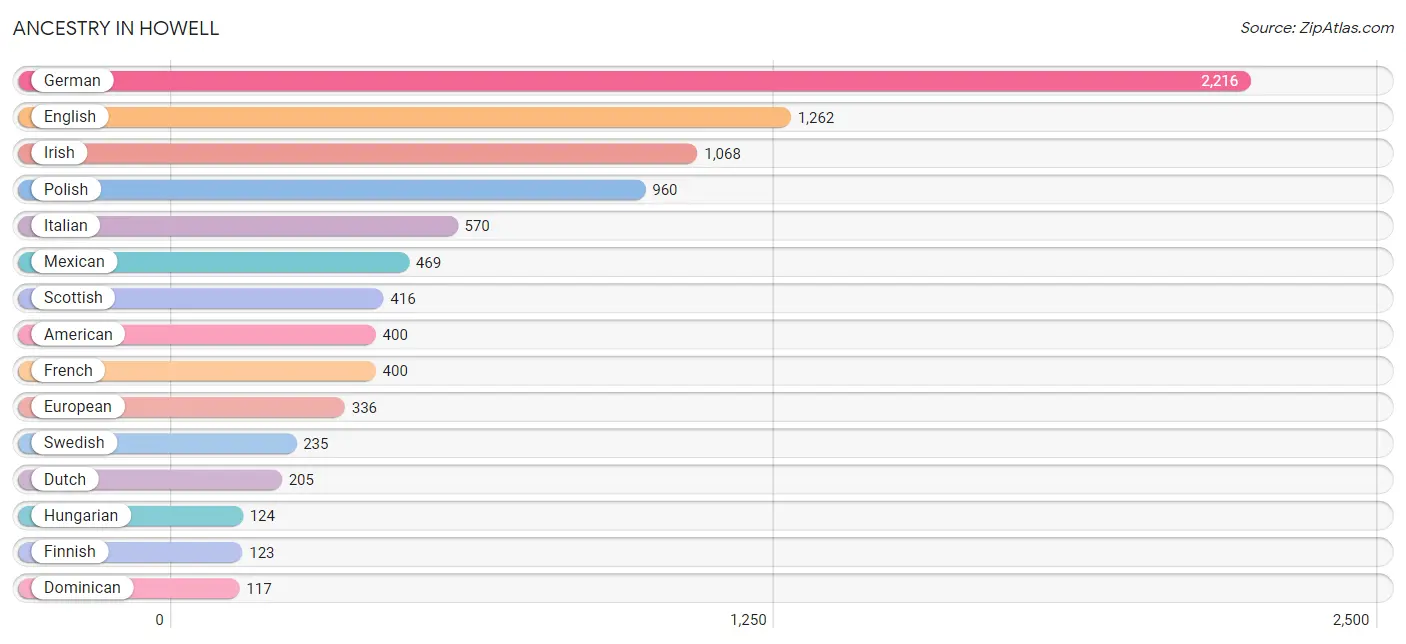
| Ancestry | # Population | % Population |
| African | 20 | 0.2% |
| American | 400 | 4.0% |
| Arab | 72 | 0.7% |
| Assyrian / Chaldean / Syriac | 64 | 0.6% |
| Belgian | 18 | 0.2% |
| Bhutanese | 50 | 0.5% |
| Brazilian | 6 | 0.1% |
| British | 32 | 0.3% |
| Bulgarian | 23 | 0.2% |
| Burmese | 22 | 0.2% |
| Canadian | 57 | 0.6% |
| Celtic | 9 | 0.1% |
| Cherokee | 24 | 0.2% |
| Chippewa | 10 | 0.1% |
| Choctaw | 13 | 0.1% |
| Croatian | 41 | 0.4% |
| Cuban | 56 | 0.6% |
| Czech | 17 | 0.2% |
| Czechoslovakian | 27 | 0.3% |
| Danish | 13 | 0.1% |
| Dominican | 117 | 1.2% |
| Dutch | 205 | 2.0% |
| English | 1,262 | 12.5% |
| European | 336 | 3.3% |
| Finnish | 123 | 1.2% |
| French | 400 | 4.0% |
| French Canadian | 90 | 0.9% |
| German | 2,216 | 22.0% |
| Greek | 21 | 0.2% |
| Hungarian | 124 | 1.2% |
| Indian (Asian) | 44 | 0.4% |
| Irish | 1,068 | 10.6% |
| Iroquois | 3 | 0.0% |
| Italian | 570 | 5.7% |
| Korean | 15 | 0.2% |
| Lebanese | 8 | 0.1% |
| Lithuanian | 45 | 0.4% |
| Macedonian | 89 | 0.9% |
| Maltese | 30 | 0.3% |
| Mexican | 469 | 4.7% |
| Mexican American Indian | 32 | 0.3% |
| Norwegian | 85 | 0.8% |
| Ottawa | 7 | 0.1% |
| Pennsylvania German | 11 | 0.1% |
| Peruvian | 20 | 0.2% |
| Polish | 960 | 9.5% |
| Puerto Rican | 95 | 0.9% |
| Russian | 113 | 1.1% |
| Scandinavian | 46 | 0.5% |
| Scotch-Irish | 65 | 0.6% |
| Scottish | 416 | 4.1% |
| Slavic | 34 | 0.3% |
| Slovak | 14 | 0.1% |
| South American | 20 | 0.2% |
| Sri Lankan | 5 | 0.1% |
| Subsaharan African | 20 | 0.2% |
| Swedish | 235 | 2.3% |
| Swiss | 11 | 0.1% |
| Thai | 23 | 0.2% |
| Ukrainian | 47 | 0.5% |
| Welsh | 57 | 0.6% | View All 61 Rows |
Immigrants in Howell
The most numerous immigrant groups reported in Howell came from Latin America (334 | 3.3%), Caribbean (173 | 1.7%), Central America (155 | 1.5%), Mexico (155 | 1.5%), and Dominican Republic (117 | 1.2%), together accounting for 9.3% of all Howell residents.
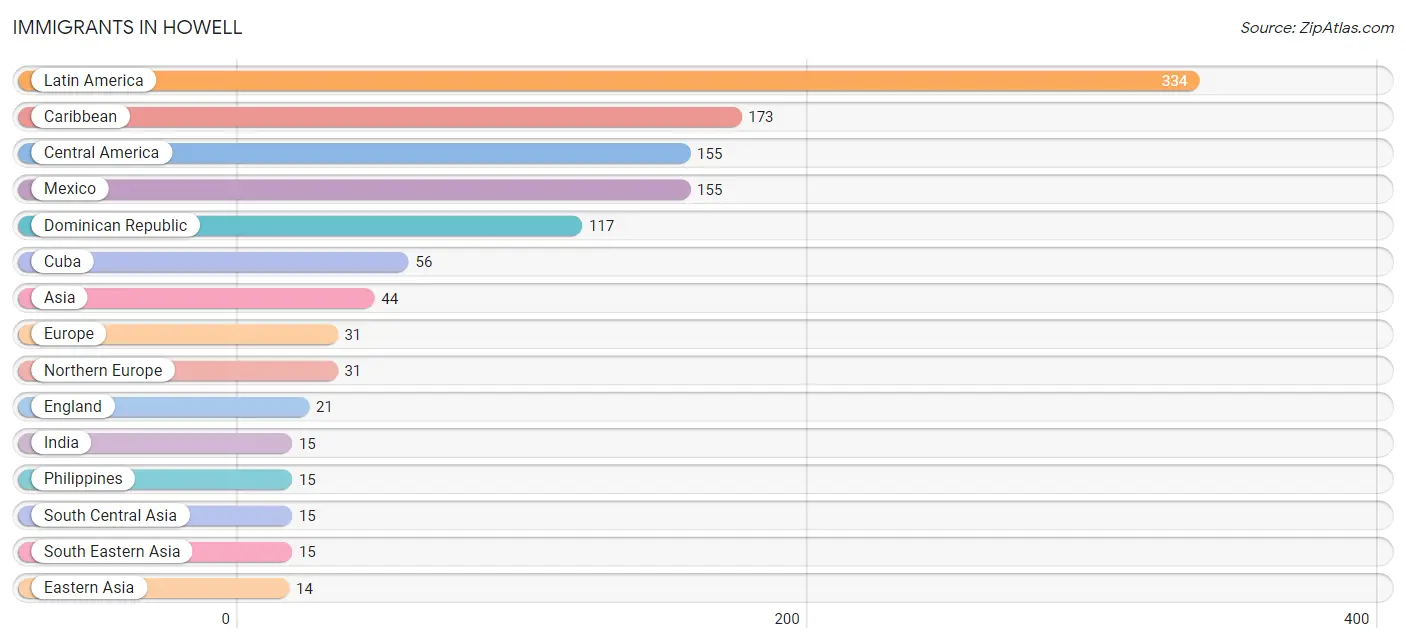
| Immigration Origin | # Population | % Population |
| Asia | 44 | 0.4% |
| Brazil | 6 | 0.1% |
| Caribbean | 173 | 1.7% |
| Central America | 155 | 1.5% |
| Cuba | 56 | 0.6% |
| Dominican Republic | 117 | 1.2% |
| Eastern Asia | 14 | 0.1% |
| England | 21 | 0.2% |
| Europe | 31 | 0.3% |
| India | 15 | 0.2% |
| Korea | 14 | 0.1% |
| Latin America | 334 | 3.3% |
| Mexico | 155 | 1.5% |
| Northern Europe | 31 | 0.3% |
| Philippines | 15 | 0.2% |
| South America | 6 | 0.1% |
| South Central Asia | 15 | 0.2% |
| South Eastern Asia | 15 | 0.2% | View All 18 Rows |
Sex and Age in Howell
Sex and Age in Howell
The most populous age groups in Howell are 25 to 29 Years (740 | 15.4%) for men and 20 to 24 Years (641 | 12.2%) for women.
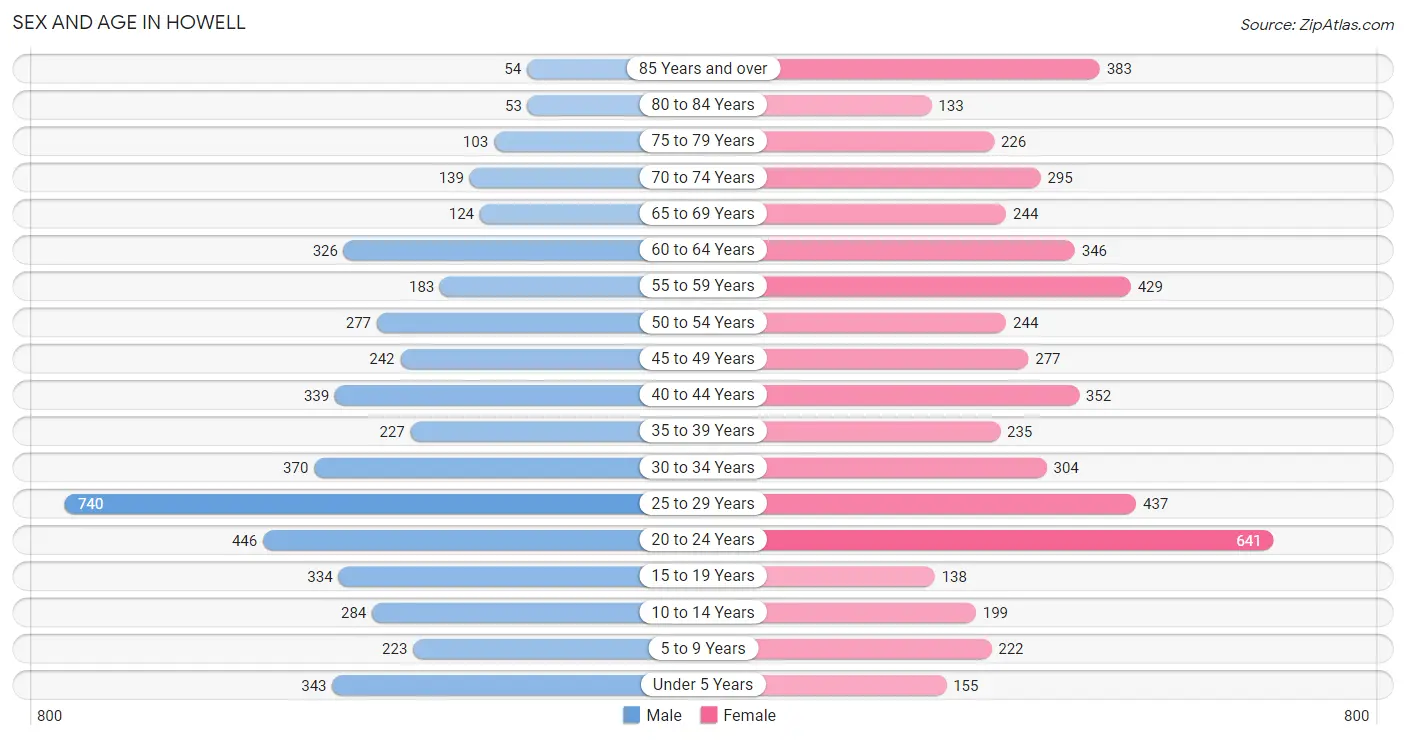
| Age Bracket | Male | Female |
| Under 5 Years | 343 (7.1%) | 155 (2.9%) |
| 5 to 9 Years | 223 (4.6%) | 222 (4.2%) |
| 10 to 14 Years | 284 (5.9%) | 199 (3.8%) |
| 15 to 19 Years | 334 (7.0%) | 138 (2.6%) |
| 20 to 24 Years | 446 (9.3%) | 641 (12.2%) |
| 25 to 29 Years | 740 (15.4%) | 437 (8.3%) |
| 30 to 34 Years | 370 (7.7%) | 304 (5.8%) |
| 35 to 39 Years | 227 (4.7%) | 235 (4.5%) |
| 40 to 44 Years | 339 (7.0%) | 352 (6.7%) |
| 45 to 49 Years | 242 (5.0%) | 277 (5.3%) |
| 50 to 54 Years | 277 (5.8%) | 244 (4.6%) |
| 55 to 59 Years | 183 (3.8%) | 429 (8.2%) |
| 60 to 64 Years | 326 (6.8%) | 346 (6.6%) |
| 65 to 69 Years | 124 (2.6%) | 244 (4.6%) |
| 70 to 74 Years | 139 (2.9%) | 295 (5.6%) |
| 75 to 79 Years | 103 (2.1%) | 226 (4.3%) |
| 80 to 84 Years | 53 (1.1%) | 133 (2.5%) |
| 85 Years and over | 54 (1.1%) | 383 (7.3%) |
| Total | 4,807 (100.0%) | 5,260 (100.0%) |
Families and Households in Howell
Median Family Size in Howell
The median family size in Howell is 2.86 persons per family, with married-couple families (1,376 | 67.4%) accounting for the largest median family size of 3.03 persons per family. On the other hand, single male/father families (289 | 14.1%) represent the smallest median family size with 2.40 persons per family.
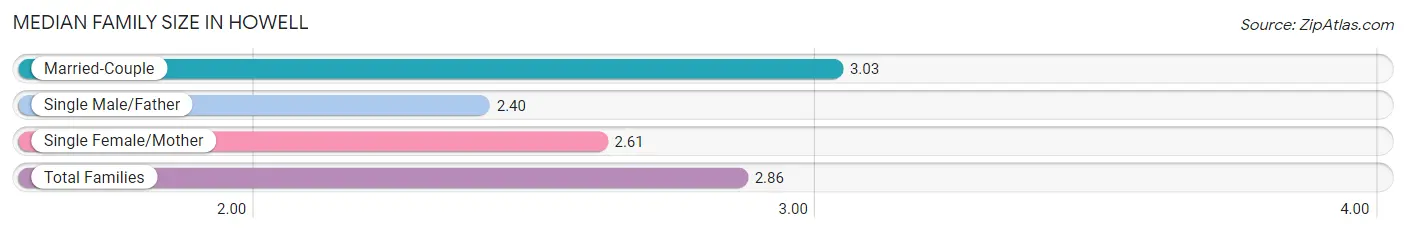
| Family Type | # Families | Family Size |
| Married-Couple | 1,376 (67.4%) | 3.03 |
| Single Male/Father | 289 (14.1%) | 2.40 |
| Single Female/Mother | 377 (18.5%) | 2.61 |
| Total Families | 2,042 (100.0%) | 2.86 |
Median Household Size in Howell
The median household size in Howell is 1.98 persons per household, with single female/mother households (377 | 7.8%) accounting for the largest median household size of 3.17 persons per household. non-family households (2,797 | 57.8%) represent the smallest median household size with 1.20 persons per household.
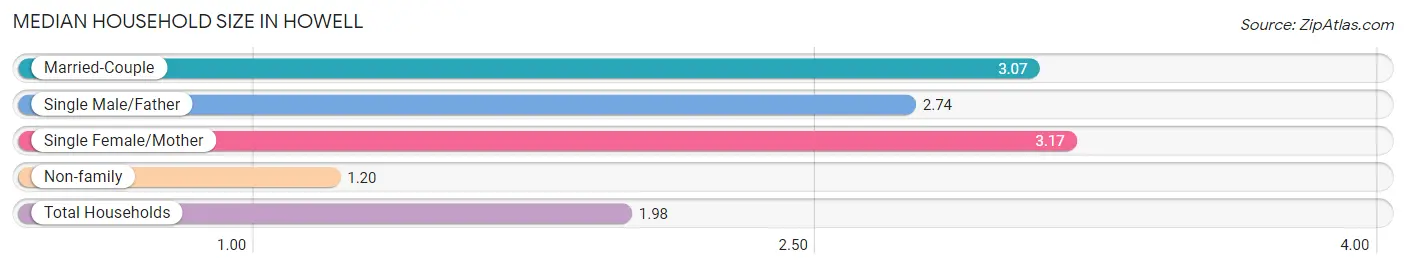
| Household Type | # Households | Household Size |
| Married-Couple | 1,376 (28.4%) | 3.07 |
| Single Male/Father | 289 (6.0%) | 2.74 |
| Single Female/Mother | 377 (7.8%) | 3.17 |
| Non-family | 2,797 (57.8%) | 1.20 |
| Total Households | 4,839 (100.0%) | 1.98 |
Household Size by Marriage Status in Howell
Out of a total of 4,839 households in Howell, 2,042 (42.2%) are family households, while 2,797 (57.8%) are nonfamily households. The most numerous type of family households are 2-person households, comprising 1,000, and the most common type of nonfamily households are 1-person households, comprising 2,421.
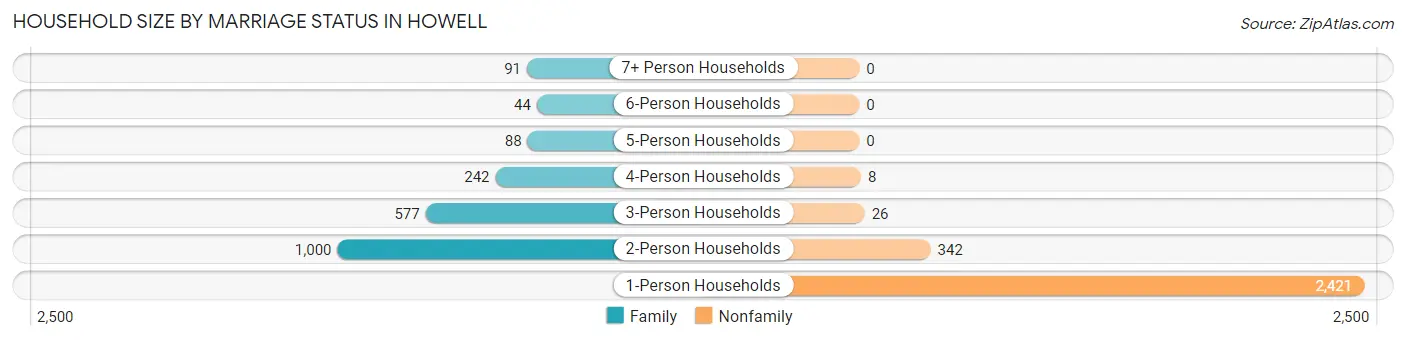
| Household Size | Family Households | Nonfamily Households |
| 1-Person Households | - | 2,421 (50.0%) |
| 2-Person Households | 1,000 (20.7%) | 342 (7.1%) |
| 3-Person Households | 577 (11.9%) | 26 (0.5%) |
| 4-Person Households | 242 (5.0%) | 8 (0.2%) |
| 5-Person Households | 88 (1.8%) | 0 (0.0%) |
| 6-Person Households | 44 (0.9%) | 0 (0.0%) |
| 7+ Person Households | 91 (1.9%) | 0 (0.0%) |
| Total | 2,042 (42.2%) | 2,797 (57.8%) |
Female Fertility in Howell
Fertility by Age in Howell
Average fertility rate in Howell is 68.0 births per 1,000 women. Women in the age bracket of 20 to 34 years have the highest fertility rate with 109.0 births per 1,000 women. Women in the age bracket of 20 to 34 years acount for 91.5% of all women with births.
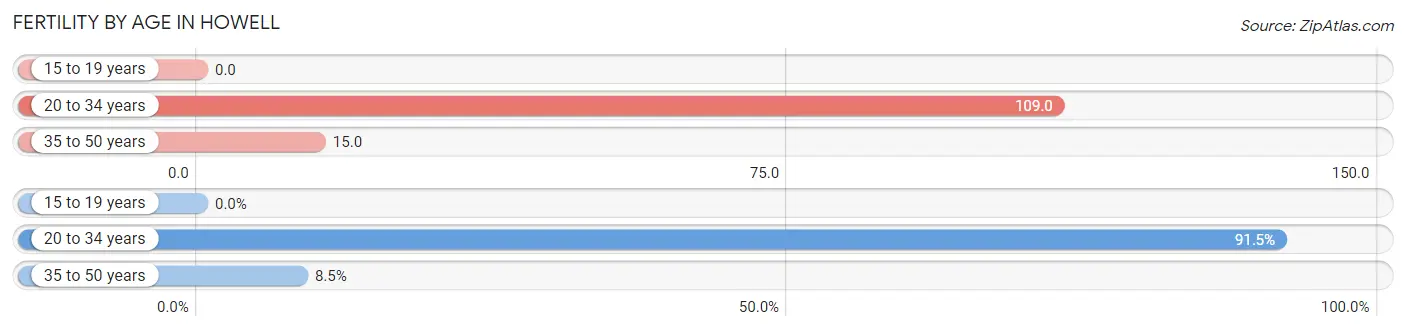
| Age Bracket | Women with Births | Births / 1,000 Women |
| 15 to 19 years | 0 (0.0%) | 0.0 |
| 20 to 34 years | 151 (91.5%) | 109.0 |
| 35 to 50 years | 14 (8.5%) | 15.0 |
| Total | 165 (100.0%) | 68.0 |
Fertility by Age by Marriage Status in Howell
49.1% of women with births (165) in Howell are married. The highest percentage of unmarried women with births falls into 20 to 34 years age bracket with 55.6% of them unmarried at the time of birth, while the lowest percentage of unmarried women with births belong to 35 to 50 years age bracket with 0.0% of them unmarried.
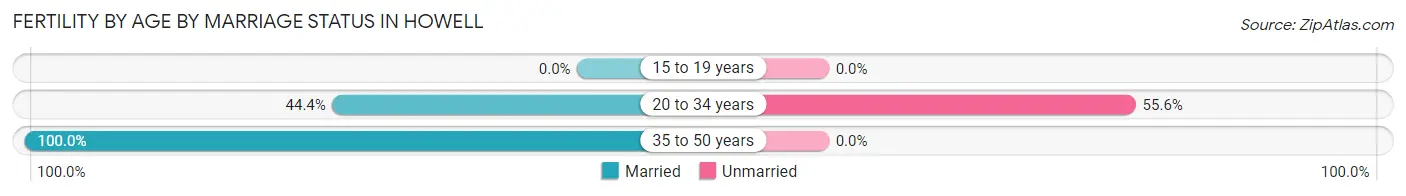
| Age Bracket | Married | Unmarried |
| 15 to 19 years | 0 (0.0%) | 0 (0.0%) |
| 20 to 34 years | 67 (44.4%) | 84 (55.6%) |
| 35 to 50 years | 14 (100.0%) | 0 (0.0%) |
| Total | 81 (49.1%) | 84 (50.9%) |
Fertility by Education in Howell
Average fertility rate in Howell is 68.0 births per 1,000 women. Women with the education attainment of high school diploma have the highest fertility rate of 85.0 births per 1,000 women, while women with the education attainment of bachelor's degree have the lowest fertility at 55.0 births per 1,000 women. Women with the education attainment of college or associate's degree represent 35.8% of all women with births.
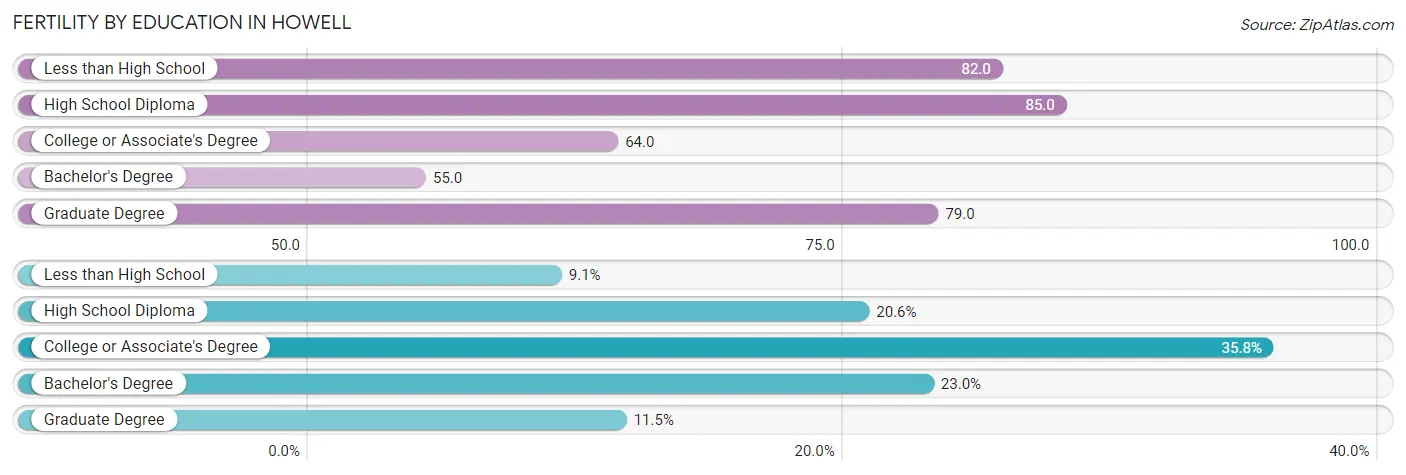
| Educational Attainment | Women with Births | Births / 1,000 Women |
| Less than High School | 15 (9.1%) | 82.0 |
| High School Diploma | 34 (20.6%) | 85.0 |
| College or Associate's Degree | 59 (35.8%) | 64.0 |
| Bachelor's Degree | 38 (23.0%) | 55.0 |
| Graduate Degree | 19 (11.5%) | 79.0 |
| Total | 165 (100.0%) | 68.0 |
Fertility by Education by Marriage Status in Howell
50.9% of women with births in Howell are unmarried. Women with the educational attainment of bachelor's degree are most likely to be married with 100.0% of them married at childbirth, while women with the educational attainment of less than high school are least likely to be married with 100.0% of them unmarried at childbirth.
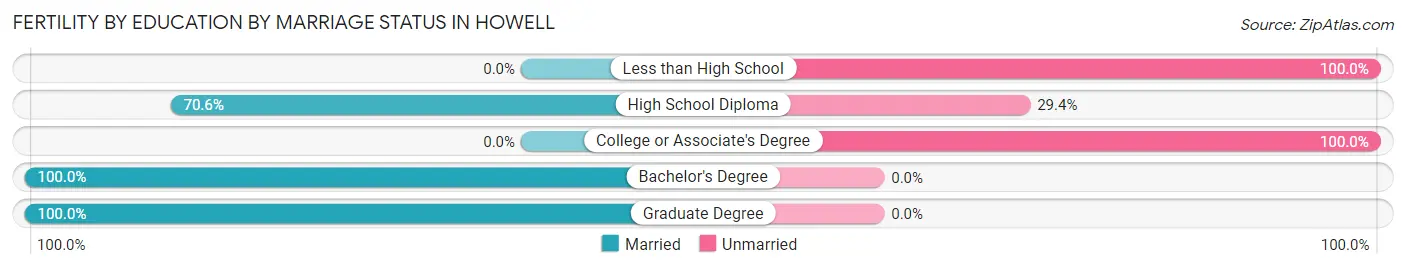
| Educational Attainment | Married | Unmarried |
| Less than High School | 0 (0.0%) | 15 (100.0%) |
| High School Diploma | 24 (70.6%) | 10 (29.4%) |
| College or Associate's Degree | 0 (0.0%) | 59 (100.0%) |
| Bachelor's Degree | 38 (100.0%) | 0 (0.0%) |
| Graduate Degree | 19 (100.0%) | 0 (0.0%) |
| Total | 81 (49.1%) | 84 (50.9%) |
Employment Characteristics in Howell
Employment by Class of Employer in Howell
Among the 5,382 employed individuals in Howell, private company employees (4,450 | 82.7%), not-for-profit organizations (315 | 5.9%), and self-employed (not incorporated) (192 | 3.6%) make up the most common classes of employment.
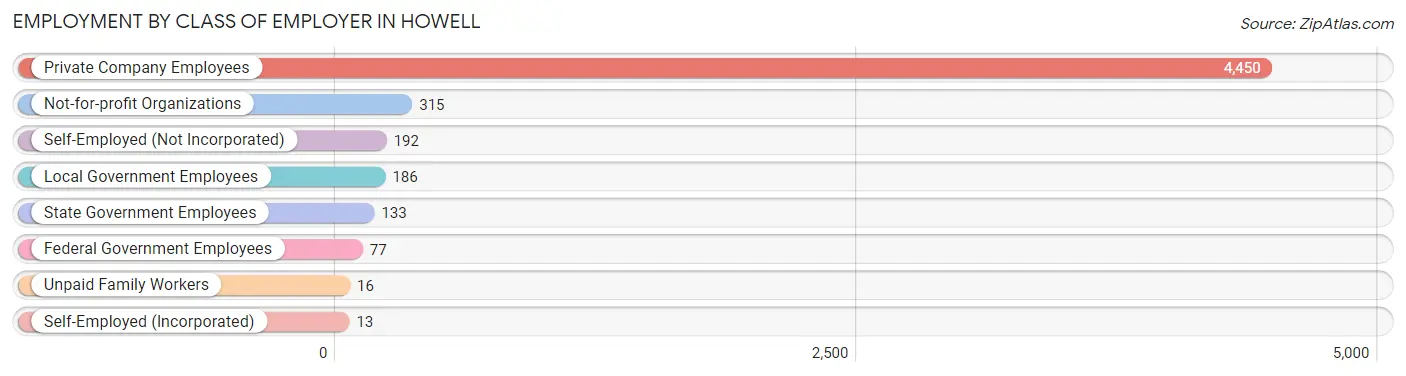
| Employer Class | # Employees | % Employees |
| Private Company Employees | 4,450 | 82.7% |
| Self-Employed (Incorporated) | 13 | 0.2% |
| Self-Employed (Not Incorporated) | 192 | 3.6% |
| Not-for-profit Organizations | 315 | 5.9% |
| Local Government Employees | 186 | 3.5% |
| State Government Employees | 133 | 2.5% |
| Federal Government Employees | 77 | 1.4% |
| Unpaid Family Workers | 16 | 0.3% |
| Total | 5,382 | 100.0% |
Employment Status by Age in Howell
According to the labor force statistics for Howell, out of the total population over 16 years of age (8,523), 66.4% or 5,659 individuals are in the labor force, with 4.4% or 249 of them unemployed. The age group with the highest labor force participation rate is 20 to 24 years, with 96.1% or 1,045 individuals in the labor force. Within the labor force, the 25 to 29 years age range has the highest percentage of unemployed individuals, with 9.3% or 97 of them being unemployed.
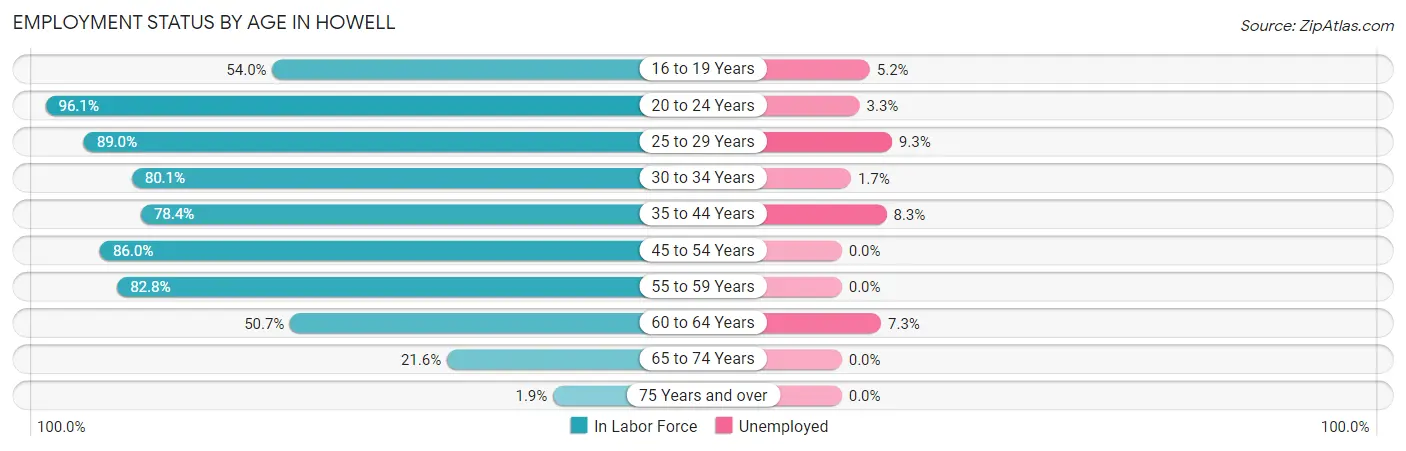
| Age Bracket | In Labor Force | Unemployed |
| 16 to 19 Years | 191 (54.0%) | 10 (5.2%) |
| 20 to 24 Years | 1,045 (96.1%) | 34 (3.3%) |
| 25 to 29 Years | 1,048 (89.0%) | 97 (9.3%) |
| 30 to 34 Years | 540 (80.1%) | 9 (1.7%) |
| 35 to 44 Years | 904 (78.4%) | 75 (8.3%) |
| 45 to 54 Years | 894 (86.0%) | 0 (0.0%) |
| 55 to 59 Years | 507 (82.8%) | 0 (0.0%) |
| 60 to 64 Years | 341 (50.7%) | 25 (7.3%) |
| 65 to 74 Years | 173 (21.6%) | 0 (0.0%) |
| 75 Years and over | 18 (1.9%) | 0 (0.0%) |
| Total | 5,659 (66.4%) | 249 (4.4%) |
Employment Status by Educational Attainment in Howell
According to labor force statistics for Howell, 79.5% of individuals (4,236) out of the total population between 25 and 64 years of age (5,328) are in the labor force, with 4.9% or 208 of them being unemployed. The group with the highest labor force participation rate are those with the educational attainment of bachelor's degree or higher, with 88.3% or 1,533 individuals in the labor force. Within the labor force, individuals with less than high school education have the highest percentage of unemployment, with 8.2% or 18 of them being unemployed.
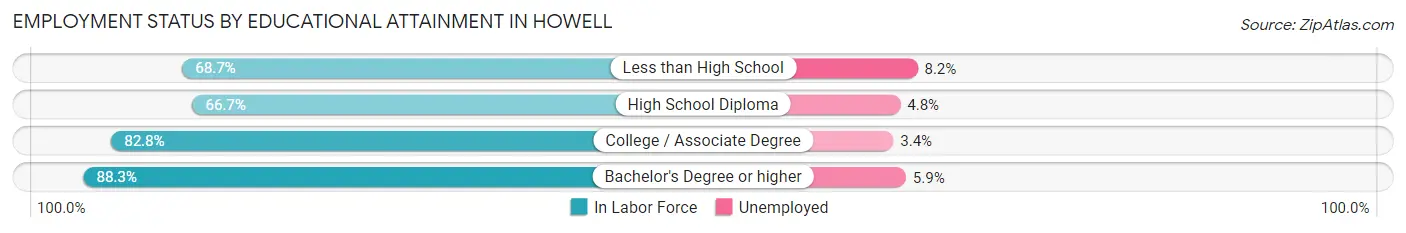
| Educational Attainment | In Labor Force | Unemployed |
| Less than High School | 219 (68.7%) | 26 (8.2%) |
| High School Diploma | 943 (66.7%) | 68 (4.8%) |
| College / Associate Degree | 1,539 (82.8%) | 63 (3.4%) |
| Bachelor's Degree or higher | 1,533 (88.3%) | 102 (5.9%) |
| Total | 4,236 (79.5%) | 261 (4.9%) |
Employment Occupations by Sex in Howell
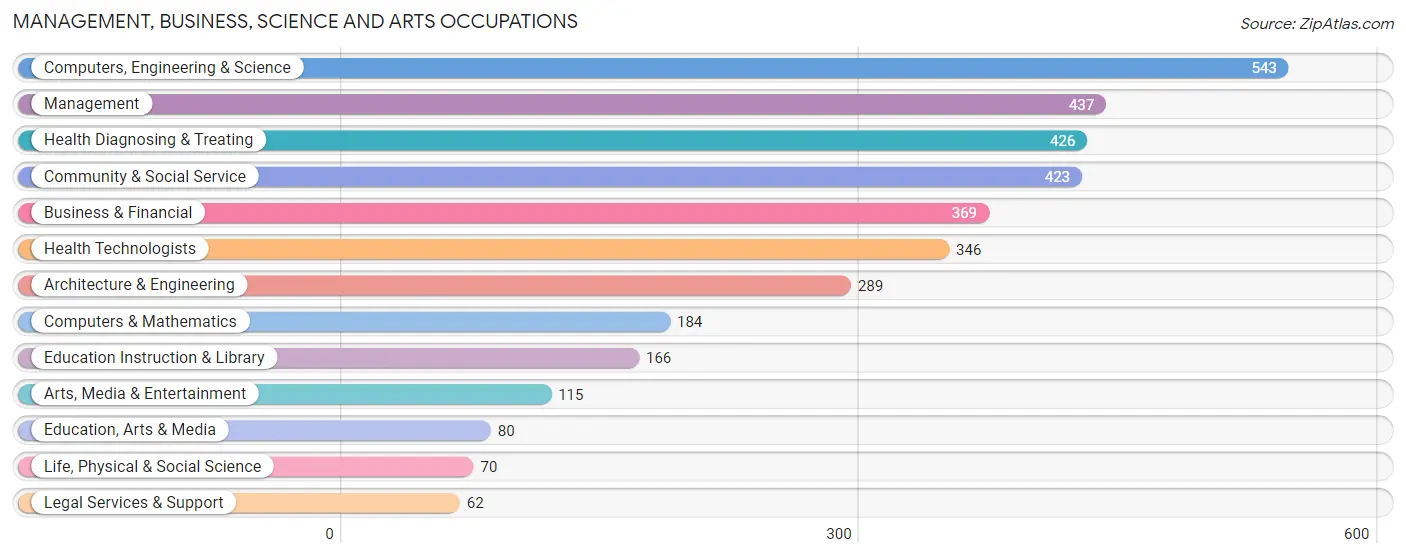
Management, Business, Science and Arts Occupations
The most common Management, Business, Science and Arts occupations in Howell are Computers, Engineering & Science (543 | 10.0%), Management (437 | 8.1%), Health Diagnosing & Treating (426 | 7.9%), Community & Social Service (423 | 7.8%), and Business & Financial (369 | 6.8%).
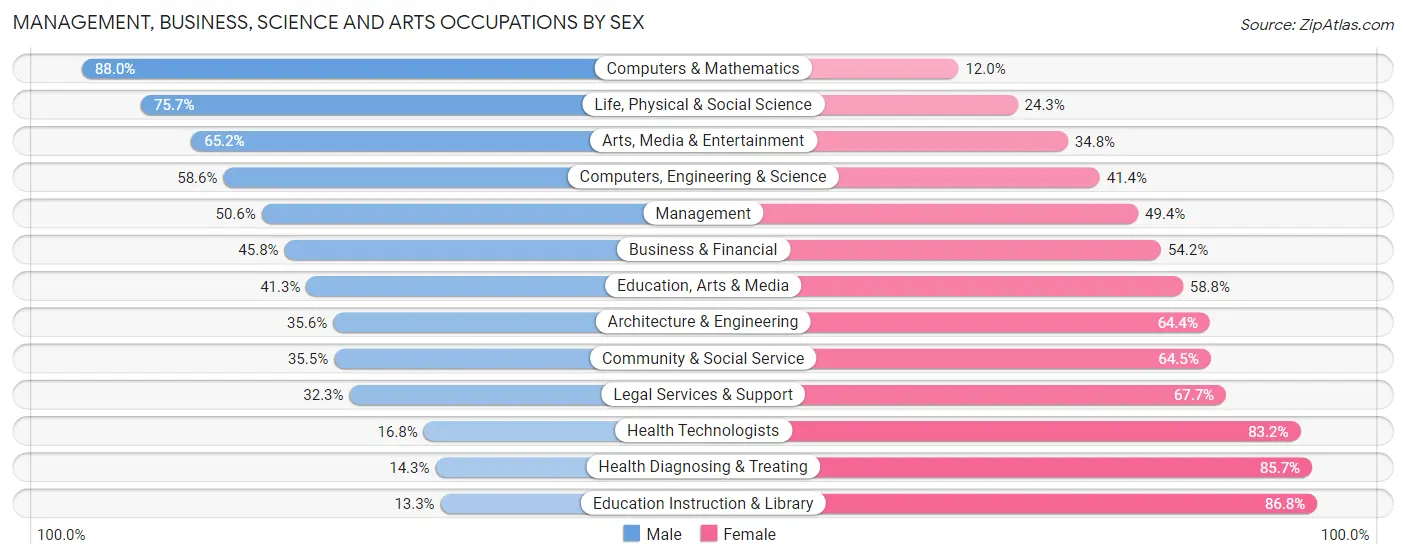
Management, Business, Science and Arts Occupations by Sex
Within the Management, Business, Science and Arts occupations in Howell, the most male-oriented occupations are Computers & Mathematics (88.0%), Life, Physical & Social Science (75.7%), and Arts, Media & Entertainment (65.2%), while the most female-oriented occupations are Education Instruction & Library (86.8%), Health Diagnosing & Treating (85.7%), and Health Technologists (83.2%).
| Occupation | Male | Female |
| Management | 221 (50.6%) | 216 (49.4%) |
| Business & Financial | 169 (45.8%) | 200 (54.2%) |
| Computers, Engineering & Science | 318 (58.6%) | 225 (41.4%) |
| Computers & Mathematics | 162 (88.0%) | 22 (12.0%) |
| Architecture & Engineering | 103 (35.6%) | 186 (64.4%) |
| Life, Physical & Social Science | 53 (75.7%) | 17 (24.3%) |
| Community & Social Service | 150 (35.5%) | 273 (64.5%) |
| Education, Arts & Media | 33 (41.2%) | 47 (58.8%) |
| Legal Services & Support | 20 (32.3%) | 42 (67.7%) |
| Education Instruction & Library | 22 (13.3%) | 144 (86.8%) |
| Arts, Media & Entertainment | 75 (65.2%) | 40 (34.8%) |
| Health Diagnosing & Treating | 61 (14.3%) | 365 (85.7%) |
| Health Technologists | 58 (16.8%) | 288 (83.2%) |
| Total (Category) | 919 (41.8%) | 1,279 (58.2%) |
| Total (Overall) | 2,735 (50.5%) | 2,675 (49.4%) |
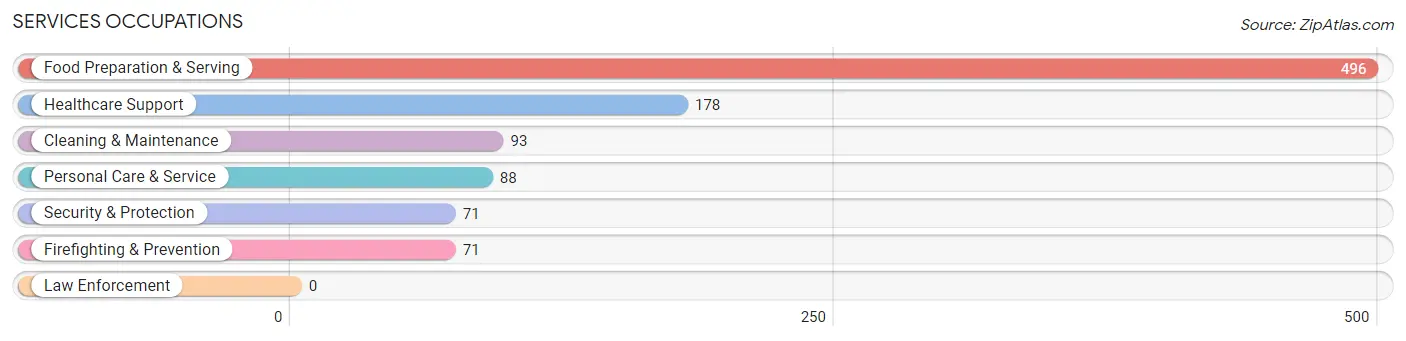
Services Occupations
The most common Services occupations in Howell are Food Preparation & Serving (496 | 9.2%), Healthcare Support (178 | 3.3%), Cleaning & Maintenance (93 | 1.7%), Personal Care & Service (88 | 1.6%), and Security & Protection (71 | 1.3%).
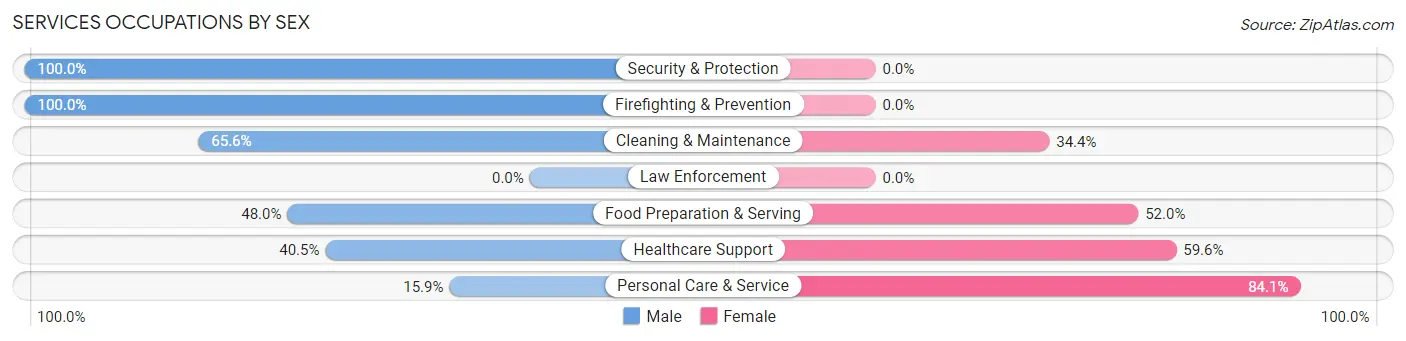
Services Occupations by Sex
Within the Services occupations in Howell, the most male-oriented occupations are Security & Protection (100.0%), Firefighting & Prevention (100.0%), and Cleaning & Maintenance (65.6%), while the most female-oriented occupations are Personal Care & Service (84.1%), Healthcare Support (59.6%), and Food Preparation & Serving (52.0%).
| Occupation | Male | Female |
| Healthcare Support | 72 (40.5%) | 106 (59.6%) |
| Security & Protection | 71 (100.0%) | 0 (0.0%) |
| Firefighting & Prevention | 71 (100.0%) | 0 (0.0%) |
| Law Enforcement | 0 (0.0%) | 0 (0.0%) |
| Food Preparation & Serving | 238 (48.0%) | 258 (52.0%) |
| Cleaning & Maintenance | 61 (65.6%) | 32 (34.4%) |
| Personal Care & Service | 14 (15.9%) | 74 (84.1%) |
| Total (Category) | 456 (49.2%) | 470 (50.8%) |
| Total (Overall) | 2,735 (50.5%) | 2,675 (49.4%) |
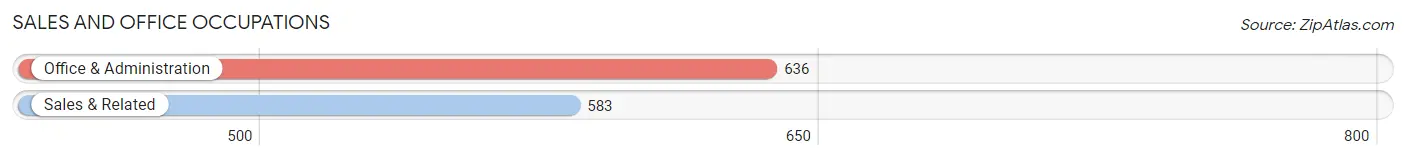
Sales and Office Occupations
The most common Sales and Office occupations in Howell are Office & Administration (636 | 11.8%), and Sales & Related (583 | 10.8%).
Sales and Office Occupations by Sex
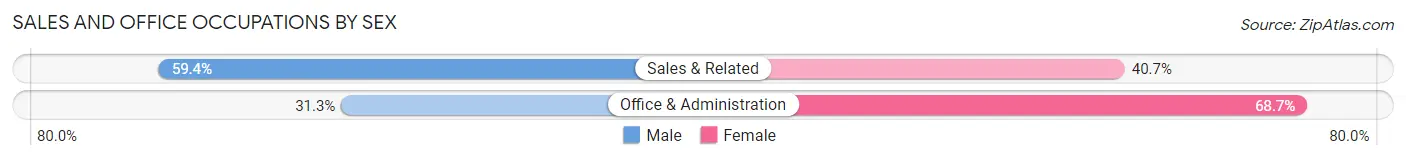
| Occupation | Male | Female |
| Sales & Related | 346 (59.4%) | 237 (40.6%) |
| Office & Administration | 199 (31.3%) | 437 (68.7%) |
| Total (Category) | 545 (44.7%) | 674 (55.3%) |
| Total (Overall) | 2,735 (50.5%) | 2,675 (49.4%) |
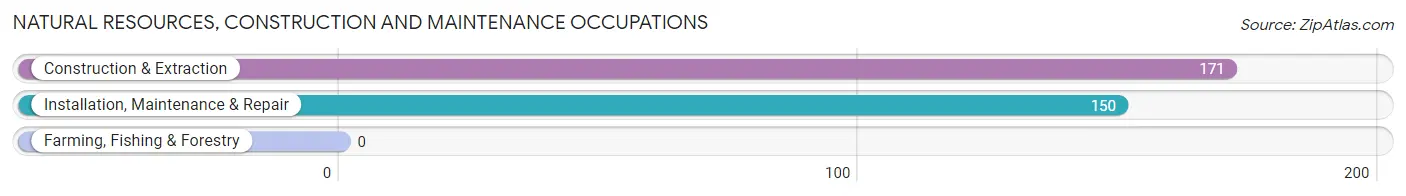
Natural Resources, Construction and Maintenance Occupations
The most common Natural Resources, Construction and Maintenance occupations in Howell are Construction & Extraction (171 | 3.2%), and Installation, Maintenance & Repair (150 | 2.8%).
Natural Resources, Construction and Maintenance Occupations by Sex
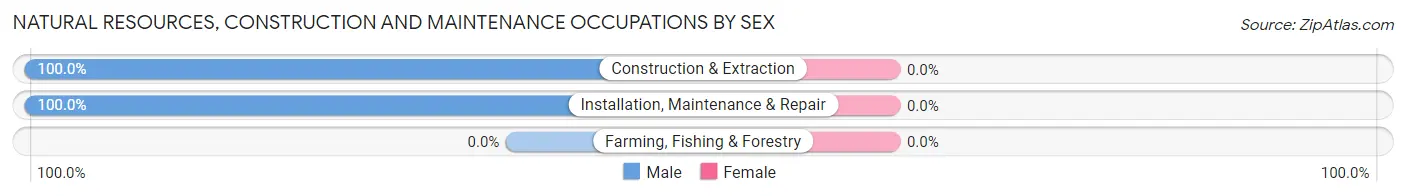
| Occupation | Male | Female |
| Farming, Fishing & Forestry | 0 (0.0%) | 0 (0.0%) |
| Construction & Extraction | 171 (100.0%) | 0 (0.0%) |
| Installation, Maintenance & Repair | 150 (100.0%) | 0 (0.0%) |
| Total (Category) | 321 (100.0%) | 0 (0.0%) |
| Total (Overall) | 2,735 (50.5%) | 2,675 (49.4%) |
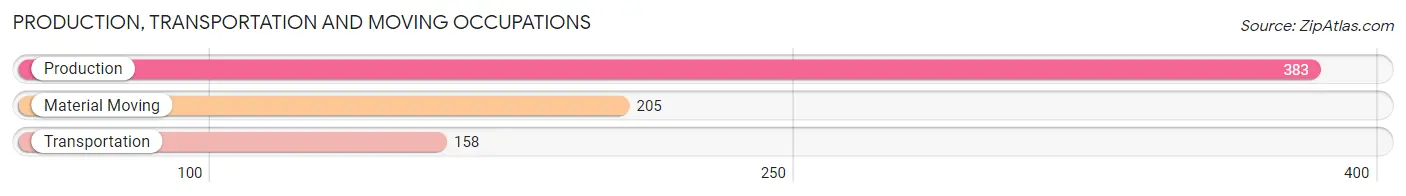
Production, Transportation and Moving Occupations
The most common Production, Transportation and Moving occupations in Howell are Production (383 | 7.1%), Material Moving (205 | 3.8%), and Transportation (158 | 2.9%).
Production, Transportation and Moving Occupations by Sex
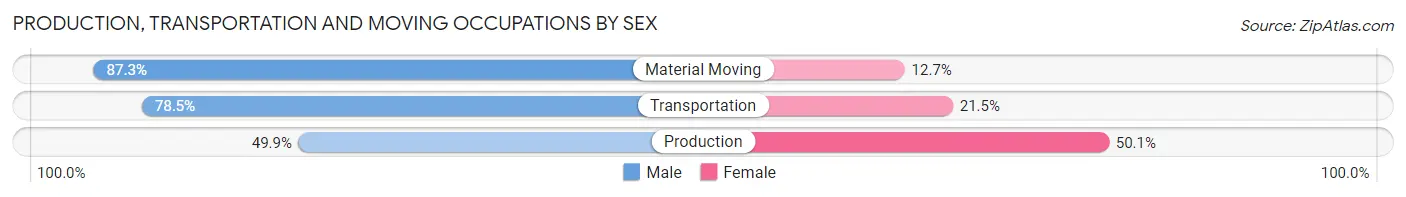
| Occupation | Male | Female |
| Production | 191 (49.9%) | 192 (50.1%) |
| Transportation | 124 (78.5%) | 34 (21.5%) |
| Material Moving | 179 (87.3%) | 26 (12.7%) |
| Total (Category) | 494 (66.2%) | 252 (33.8%) |
| Total (Overall) | 2,735 (50.5%) | 2,675 (49.4%) |
Employment Industries by Sex in Howell
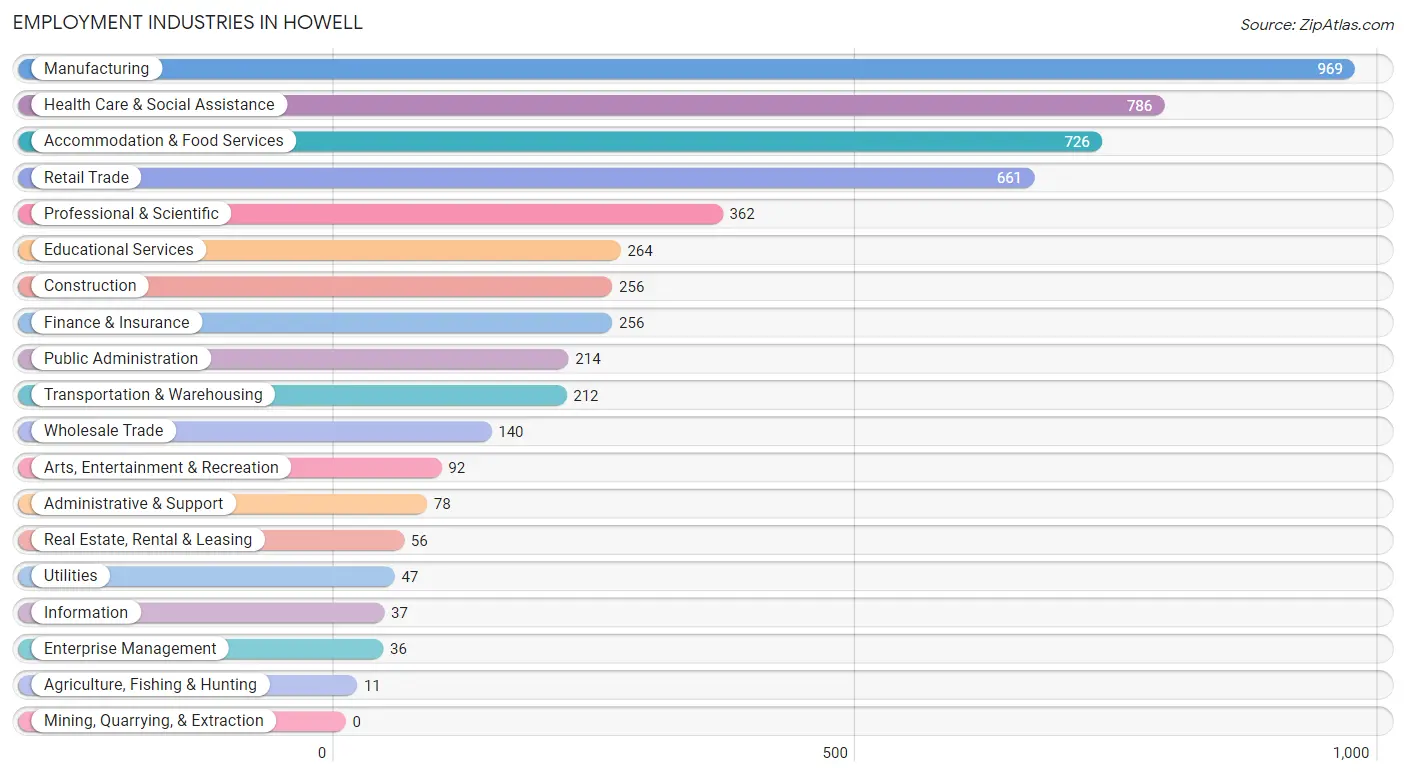
Employment Industries in Howell
The major employment industries in Howell include Manufacturing (969 | 17.9%), Health Care & Social Assistance (786 | 14.5%), Accommodation & Food Services (726 | 13.4%), Retail Trade (661 | 12.2%), and Professional & Scientific (362 | 6.7%).
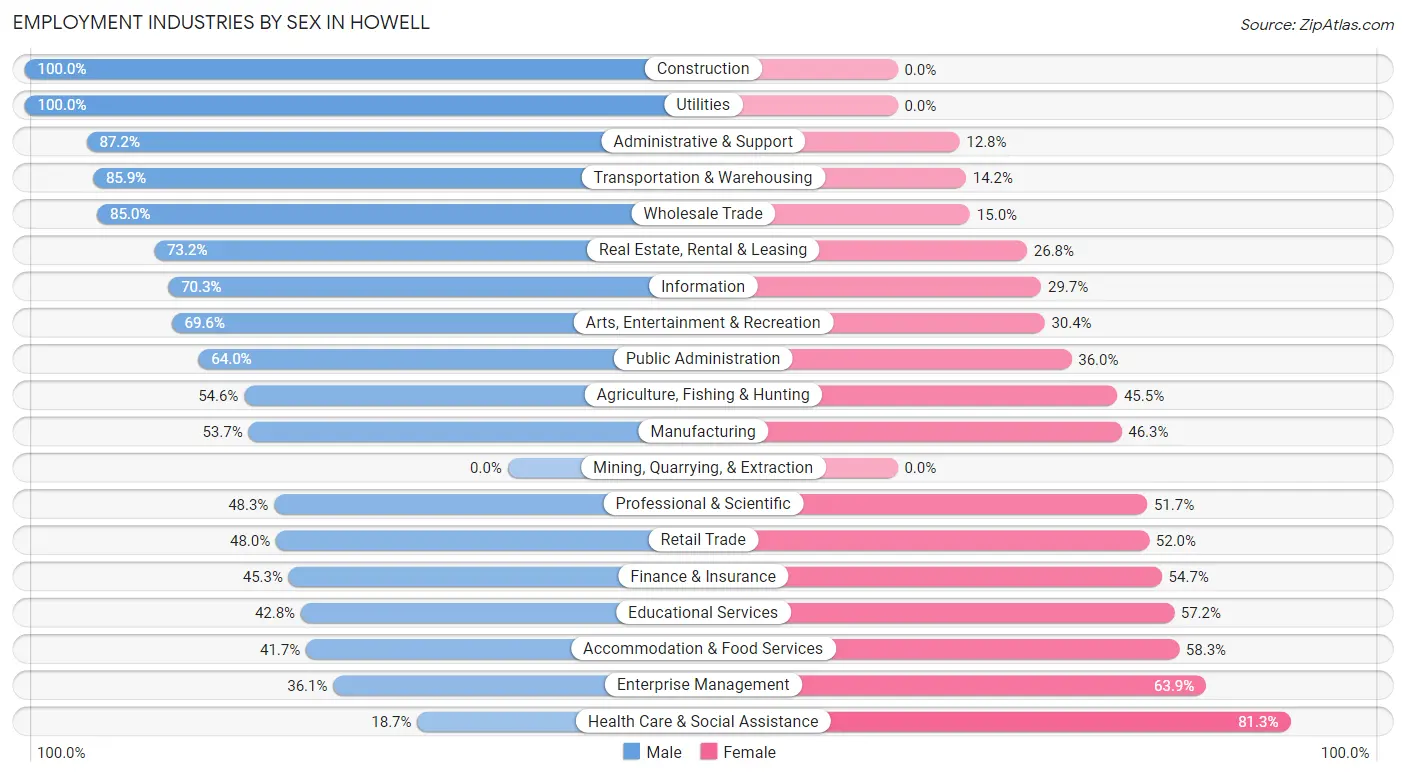
Employment Industries by Sex in Howell
The Howell industries that see more men than women are Construction (100.0%), Utilities (100.0%), and Administrative & Support (87.2%), whereas the industries that tend to have a higher number of women are Health Care & Social Assistance (81.3%), Enterprise Management (63.9%), and Accommodation & Food Services (58.3%).
| Industry | Male | Female |
| Agriculture, Fishing & Hunting | 6 (54.5%) | 5 (45.5%) |
| Mining, Quarrying, & Extraction | 0 (0.0%) | 0 (0.0%) |
| Construction | 256 (100.0%) | 0 (0.0%) |
| Manufacturing | 520 (53.7%) | 449 (46.3%) |
| Wholesale Trade | 119 (85.0%) | 21 (15.0%) |
| Retail Trade | 317 (48.0%) | 344 (52.0%) |
| Transportation & Warehousing | 182 (85.9%) | 30 (14.1%) |
| Utilities | 47 (100.0%) | 0 (0.0%) |
| Information | 26 (70.3%) | 11 (29.7%) |
| Finance & Insurance | 116 (45.3%) | 140 (54.7%) |
| Real Estate, Rental & Leasing | 41 (73.2%) | 15 (26.8%) |
| Professional & Scientific | 175 (48.3%) | 187 (51.7%) |
| Enterprise Management | 13 (36.1%) | 23 (63.9%) |
| Administrative & Support | 68 (87.2%) | 10 (12.8%) |
| Educational Services | 113 (42.8%) | 151 (57.2%) |
| Health Care & Social Assistance | 147 (18.7%) | 639 (81.3%) |
| Arts, Entertainment & Recreation | 64 (69.6%) | 28 (30.4%) |
| Accommodation & Food Services | 303 (41.7%) | 423 (58.3%) |
| Public Administration | 137 (64.0%) | 77 (36.0%) |
| Total | 2,735 (50.5%) | 2,675 (49.4%) |
Education in Howell
School Enrollment in Howell
The most common levels of schooling among the 2,064 students in Howell are high school (478 | 23.2%), college / undergraduate (471 | 22.8%), and middle school (366 | 17.7%).
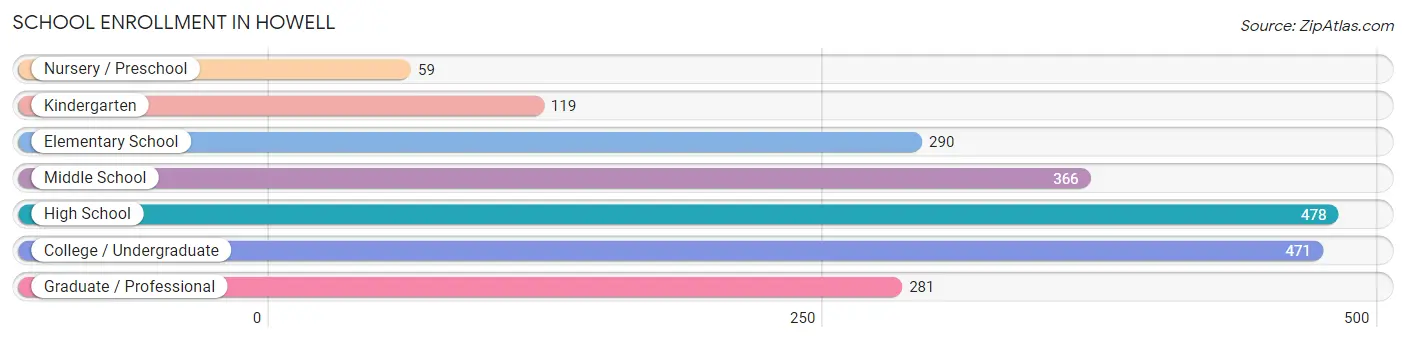
| School Level | # Students | % Students |
| Nursery / Preschool | 59 | 2.9% |
| Kindergarten | 119 | 5.8% |
| Elementary School | 290 | 14.1% |
| Middle School | 366 | 17.7% |
| High School | 478 | 23.2% |
| College / Undergraduate | 471 | 22.8% |
| Graduate / Professional | 281 | 13.6% |
| Total | 2,064 | 100.0% |
School Enrollment by Age by Funding Source in Howell
Out of a total of 2,064 students who are enrolled in schools in Howell, 231 (11.2%) attend a private institution, while the remaining 1,833 (88.8%) are enrolled in public schools. The age group of 3 to 4 year olds has the highest likelihood of being enrolled in private schools, with 17 (56.7% in the age bracket) enrolled. Conversely, the age group of 35 years and over has the lowest likelihood of being enrolled in a private school, with 90 (100.0% in the age bracket) attending a public institution.
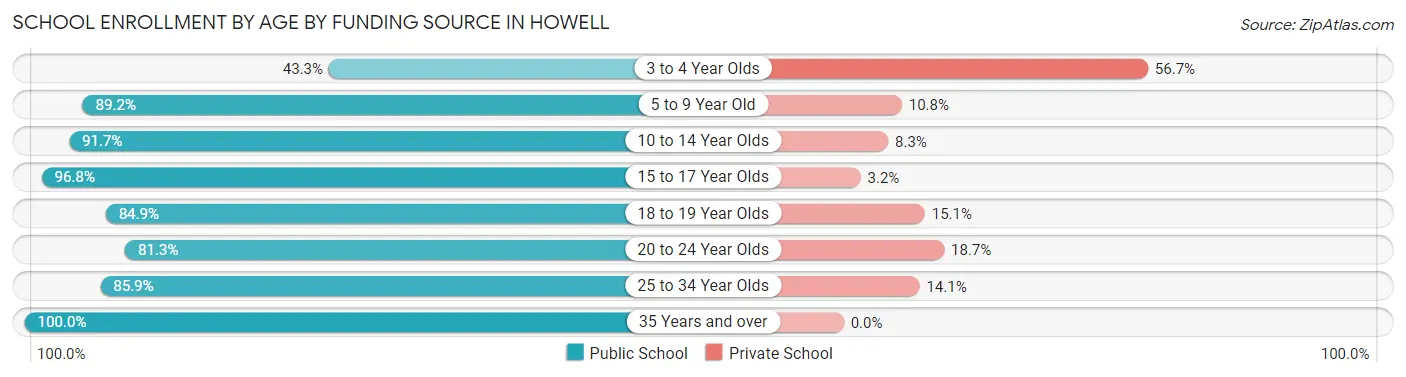
| Age Bracket | Public School | Private School |
| 3 to 4 Year Olds | 13 (43.3%) | 17 (56.7%) |
| 5 to 9 Year Old | 379 (89.2%) | 46 (10.8%) |
| 10 to 14 Year Olds | 443 (91.7%) | 40 (8.3%) |
| 15 to 17 Year Olds | 306 (96.8%) | 10 (3.2%) |
| 18 to 19 Year Olds | 118 (84.9%) | 21 (15.1%) |
| 20 to 24 Year Olds | 265 (81.3%) | 61 (18.7%) |
| 25 to 34 Year Olds | 219 (85.9%) | 36 (14.1%) |
| 35 Years and over | 90 (100.0%) | 0 (0.0%) |
| Total | 1,833 (88.8%) | 231 (11.2%) |
Educational Attainment by Field of Study in Howell
Business (611 | 27.5%), education (276 | 12.4%), science & technology (231 | 10.4%), bio, nature & agricultural (160 | 7.2%), and arts & humanities (132 | 5.9%) are the most common fields of study among 2,221 individuals in Howell who have obtained a bachelor's degree or higher.
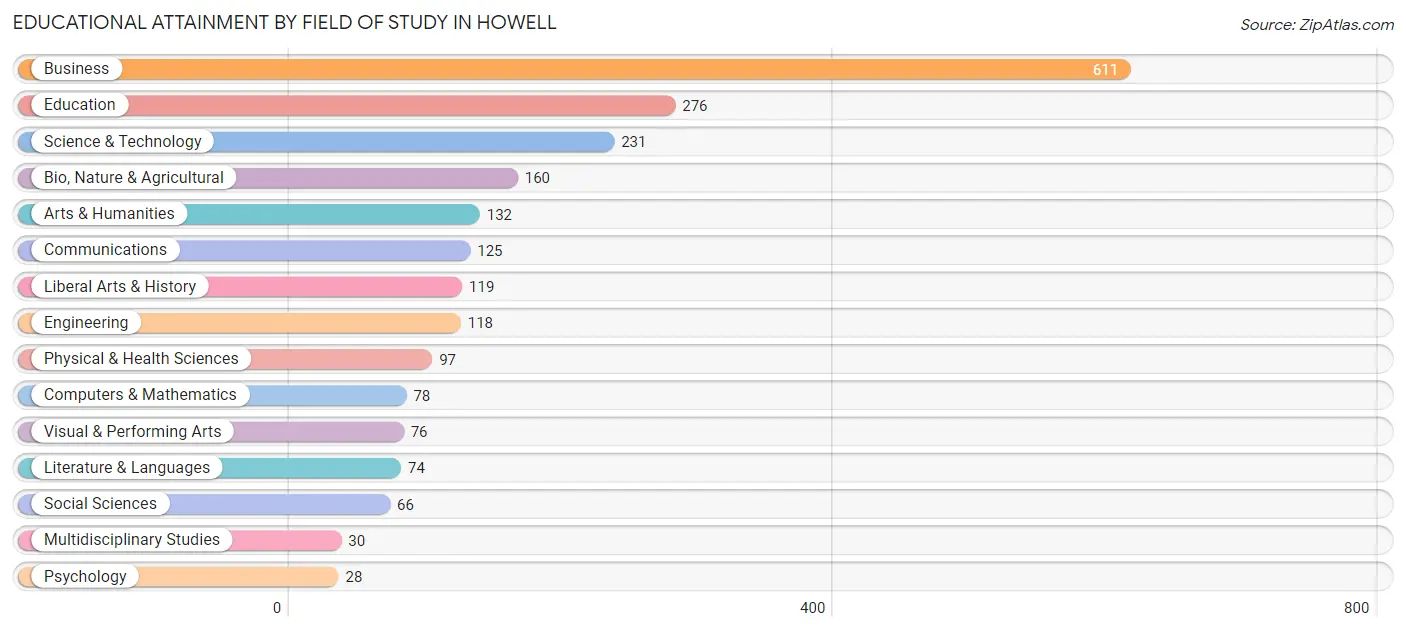
| Field of Study | # Graduates | % Graduates |
| Computers & Mathematics | 78 | 3.5% |
| Bio, Nature & Agricultural | 160 | 7.2% |
| Physical & Health Sciences | 97 | 4.4% |
| Psychology | 28 | 1.3% |
| Social Sciences | 66 | 3.0% |
| Engineering | 118 | 5.3% |
| Multidisciplinary Studies | 30 | 1.3% |
| Science & Technology | 231 | 10.4% |
| Business | 611 | 27.5% |
| Education | 276 | 12.4% |
| Literature & Languages | 74 | 3.3% |
| Liberal Arts & History | 119 | 5.4% |
| Visual & Performing Arts | 76 | 3.4% |
| Communications | 125 | 5.6% |
| Arts & Humanities | 132 | 5.9% |
| Total | 2,221 | 100.0% |
Transportation & Commute in Howell
Vehicle Availability by Sex in Howell
The most prevalent vehicle ownership categories in Howell are males with 2 vehicles (1,445, accounting for 53.3%) and females with 2 vehicles (1,129, making up 54.2%).
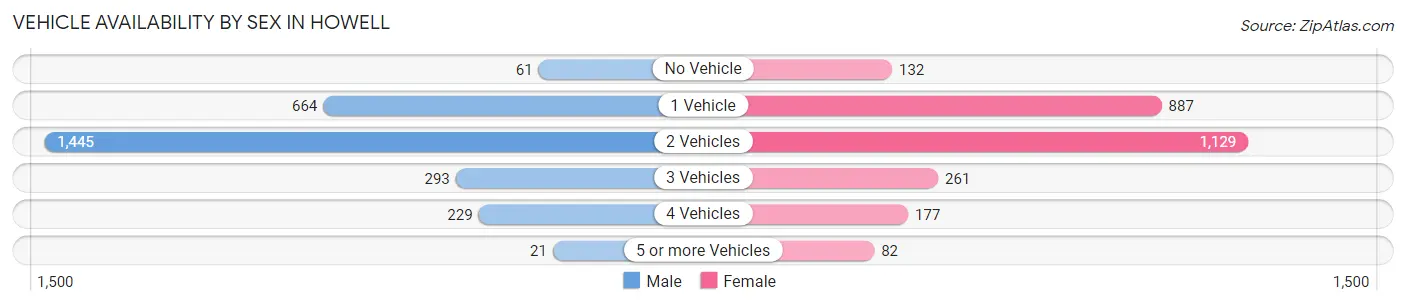
| Vehicles Available | Male | Female |
| No Vehicle | 61 (2.2%) | 132 (5.0%) |
| 1 Vehicle | 664 (24.5%) | 887 (33.3%) |
| 2 Vehicles | 1,445 (53.3%) | 1,129 (42.3%) |
| 3 Vehicles | 293 (10.8%) | 261 (9.8%) |
| 4 Vehicles | 229 (8.4%) | 177 (6.6%) |
| 5 or more Vehicles | 21 (0.8%) | 82 (3.1%) |
| Total | 2,713 (100.0%) | 2,668 (100.0%) |
Commute Time in Howell
The most frequently occuring commute durations in Howell are 15 to 19 minutes (771 commuters, 15.3%), 10 to 14 minutes (699 commuters, 13.8%), and 5 to 9 minutes (648 commuters, 12.8%).
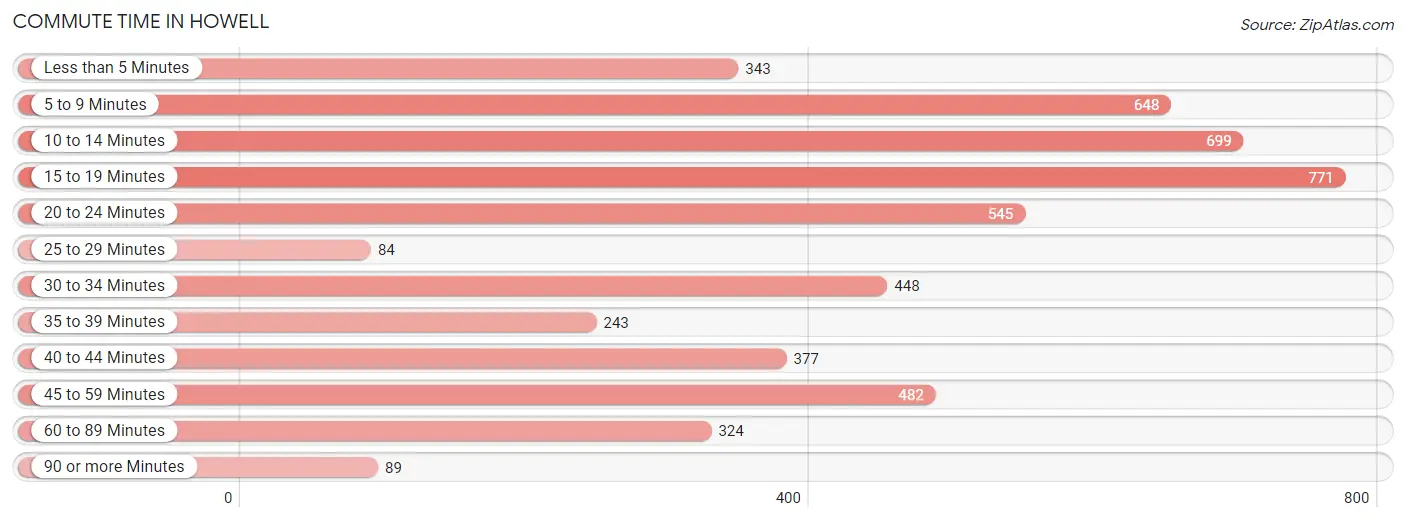
| Commute Time | # Commuters | % Commuters |
| Less than 5 Minutes | 343 | 6.8% |
| 5 to 9 Minutes | 648 | 12.8% |
| 10 to 14 Minutes | 699 | 13.8% |
| 15 to 19 Minutes | 771 | 15.3% |
| 20 to 24 Minutes | 545 | 10.8% |
| 25 to 29 Minutes | 84 | 1.7% |
| 30 to 34 Minutes | 448 | 8.9% |
| 35 to 39 Minutes | 243 | 4.8% |
| 40 to 44 Minutes | 377 | 7.5% |
| 45 to 59 Minutes | 482 | 9.5% |
| 60 to 89 Minutes | 324 | 6.4% |
| 90 or more Minutes | 89 | 1.8% |
Commute Time by Sex in Howell
The most common commute times in Howell are 15 to 19 minutes (415 commuters, 16.4%) for males and 10 to 14 minutes (482 commuters, 19.1%) for females.
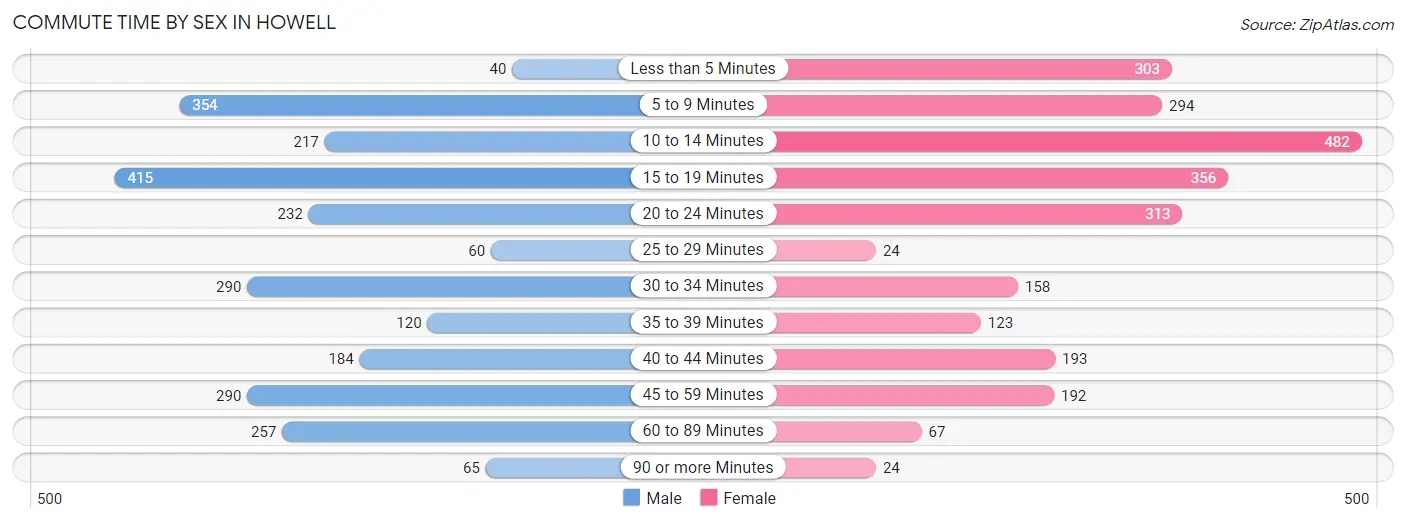
| Commute Time | Male | Female |
| Less than 5 Minutes | 40 (1.6%) | 303 (12.0%) |
| 5 to 9 Minutes | 354 (14.0%) | 294 (11.6%) |
| 10 to 14 Minutes | 217 (8.6%) | 482 (19.1%) |
| 15 to 19 Minutes | 415 (16.4%) | 356 (14.1%) |
| 20 to 24 Minutes | 232 (9.2%) | 313 (12.4%) |
| 25 to 29 Minutes | 60 (2.4%) | 24 (0.9%) |
| 30 to 34 Minutes | 290 (11.5%) | 158 (6.2%) |
| 35 to 39 Minutes | 120 (4.8%) | 123 (4.9%) |
| 40 to 44 Minutes | 184 (7.3%) | 193 (7.6%) |
| 45 to 59 Minutes | 290 (11.5%) | 192 (7.6%) |
| 60 to 89 Minutes | 257 (10.2%) | 67 (2.6%) |
| 90 or more Minutes | 65 (2.6%) | 24 (0.9%) |
Time of Departure to Work by Sex in Howell
The most frequent times of departure to work in Howell are 6:30 AM to 6:59 AM (381, 15.1%) for males and 12:00 PM to 3:59 PM (567, 22.4%) for females.
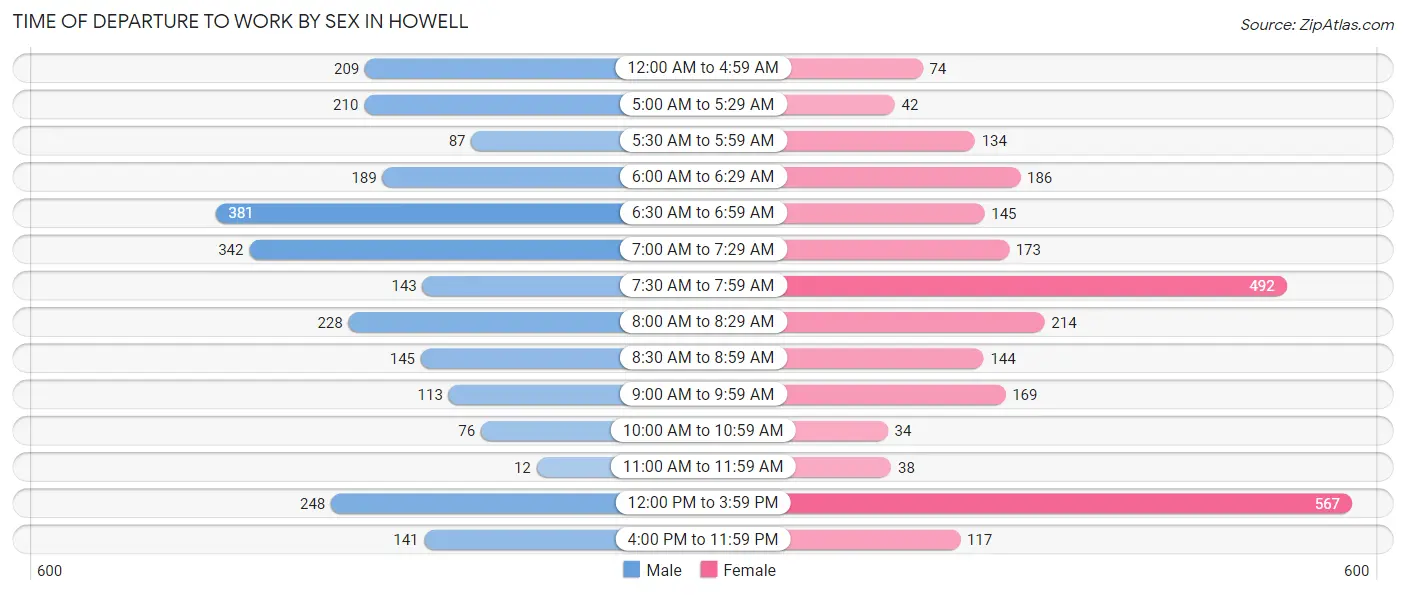
| Time of Departure | Male | Female |
| 12:00 AM to 4:59 AM | 209 (8.3%) | 74 (2.9%) |
| 5:00 AM to 5:29 AM | 210 (8.3%) | 42 (1.7%) |
| 5:30 AM to 5:59 AM | 87 (3.5%) | 134 (5.3%) |
| 6:00 AM to 6:29 AM | 189 (7.5%) | 186 (7.3%) |
| 6:30 AM to 6:59 AM | 381 (15.1%) | 145 (5.7%) |
| 7:00 AM to 7:29 AM | 342 (13.6%) | 173 (6.8%) |
| 7:30 AM to 7:59 AM | 143 (5.7%) | 492 (19.5%) |
| 8:00 AM to 8:29 AM | 228 (9.0%) | 214 (8.5%) |
| 8:30 AM to 8:59 AM | 145 (5.7%) | 144 (5.7%) |
| 9:00 AM to 9:59 AM | 113 (4.5%) | 169 (6.7%) |
| 10:00 AM to 10:59 AM | 76 (3.0%) | 34 (1.3%) |
| 11:00 AM to 11:59 AM | 12 (0.5%) | 38 (1.5%) |
| 12:00 PM to 3:59 PM | 248 (9.8%) | 567 (22.4%) |
| 4:00 PM to 11:59 PM | 141 (5.6%) | 117 (4.6%) |
| Total | 2,524 (100.0%) | 2,529 (100.0%) |
Housing Occupancy in Howell
Occupancy by Ownership in Howell
Of the total 4,839 dwellings in Howell, owner-occupied units account for 2,326 (48.1%), while renter-occupied units make up 2,513 (51.9%).
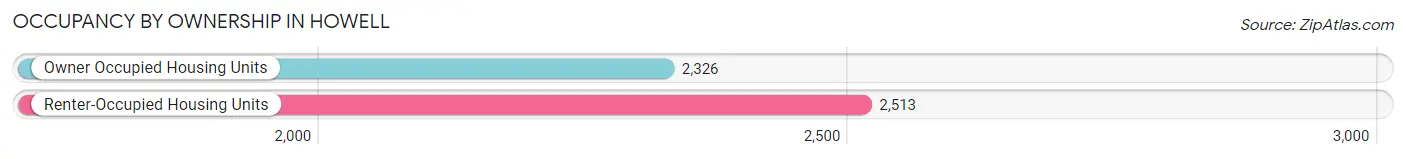
| Occupancy | # Housing Units | % Housing Units |
| Owner Occupied Housing Units | 2,326 | 48.1% |
| Renter-Occupied Housing Units | 2,513 | 51.9% |
| Total Occupied Housing Units | 4,839 | 100.0% |
Occupancy by Household Size in Howell
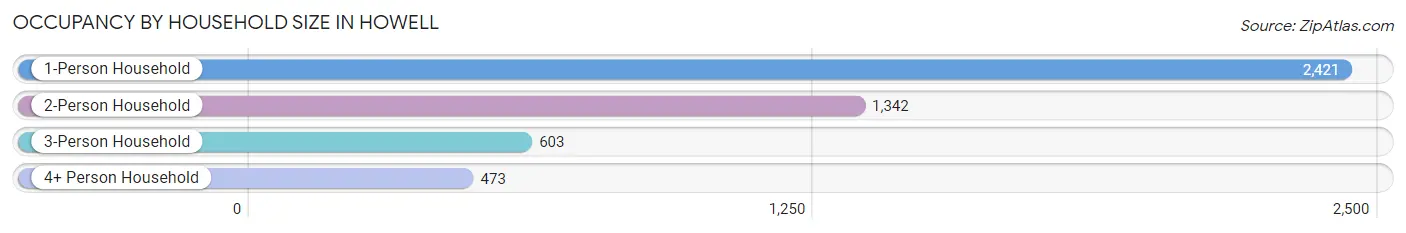
| Household Size | # Housing Units | % Housing Units |
| 1-Person Household | 2,421 | 50.0% |
| 2-Person Household | 1,342 | 27.7% |
| 3-Person Household | 603 | 12.5% |
| 4+ Person Household | 473 | 9.8% |
| Total Housing Units | 4,839 | 100.0% |
Occupancy by Ownership by Household Size in Howell
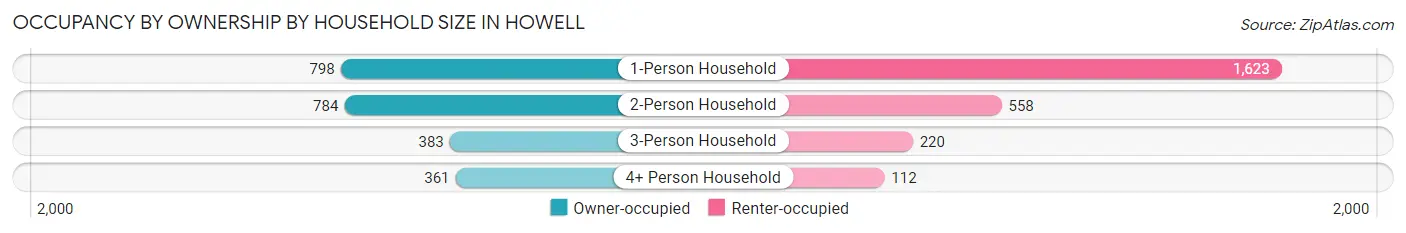
| Household Size | Owner-occupied | Renter-occupied |
| 1-Person Household | 798 (33.0%) | 1,623 (67.0%) |
| 2-Person Household | 784 (58.4%) | 558 (41.6%) |
| 3-Person Household | 383 (63.5%) | 220 (36.5%) |
| 4+ Person Household | 361 (76.3%) | 112 (23.7%) |
| Total Housing Units | 2,326 (48.1%) | 2,513 (51.9%) |
Occupancy by Educational Attainment in Howell
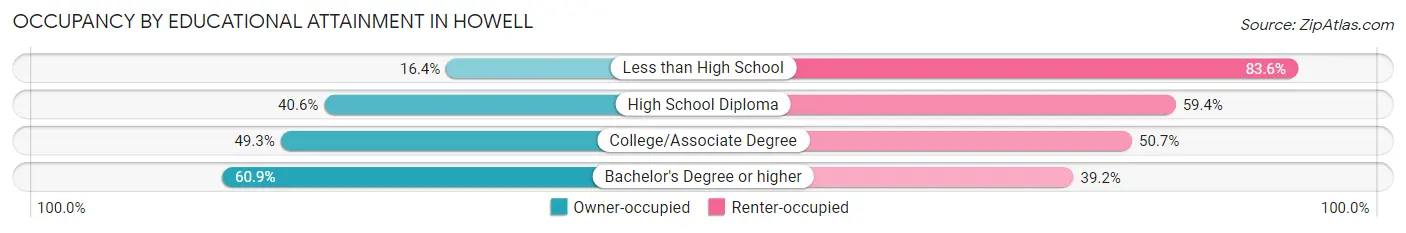
| Household Size | Owner-occupied | Renter-occupied |
| Less than High School | 47 (16.4%) | 239 (83.6%) |
| High School Diploma | 573 (40.6%) | 838 (59.4%) |
| College/Associate Degree | 876 (49.3%) | 902 (50.7%) |
| Bachelor's Degree or higher | 830 (60.9%) | 534 (39.2%) |
Occupancy by Age of Householder in Howell
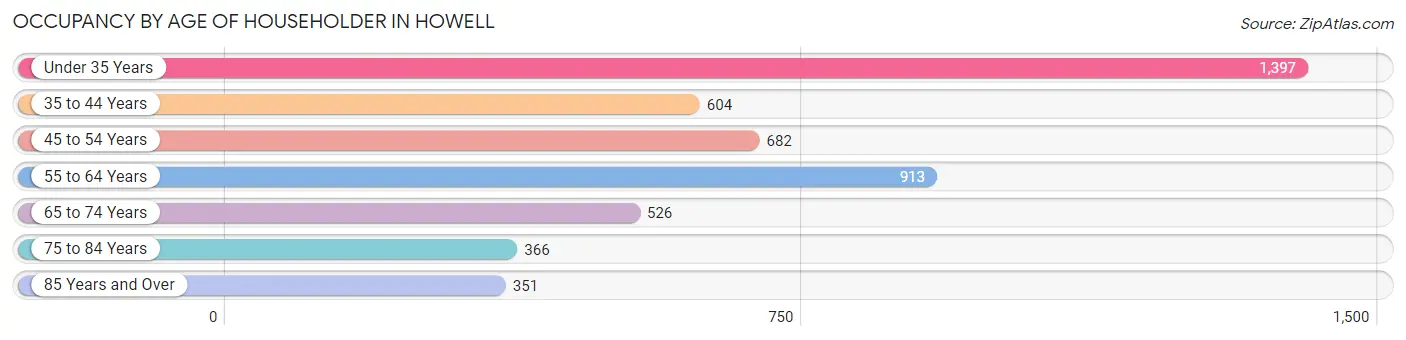
| Age Bracket | # Households | % Households |
| Under 35 Years | 1,397 | 28.9% |
| 35 to 44 Years | 604 | 12.5% |
| 45 to 54 Years | 682 | 14.1% |
| 55 to 64 Years | 913 | 18.9% |
| 65 to 74 Years | 526 | 10.9% |
| 75 to 84 Years | 366 | 7.6% |
| 85 Years and Over | 351 | 7.2% |
| Total | 4,839 | 100.0% |
Housing Finances in Howell
Median Income by Occupancy in Howell
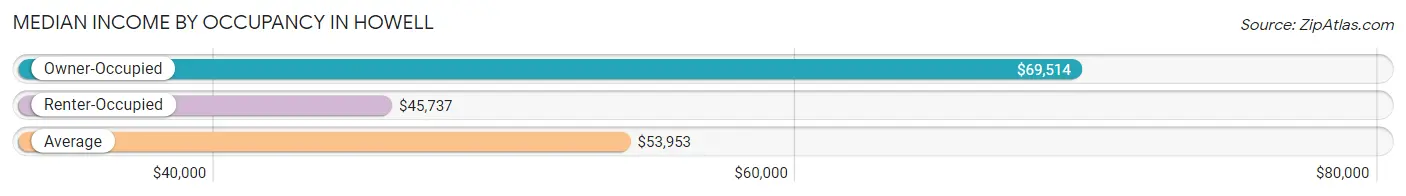
| Occupancy Type | # Households | Median Income |
| Owner-Occupied | 2,326 (48.1%) | $69,514 |
| Renter-Occupied | 2,513 (51.9%) | $45,737 |
| Average | 4,839 (100.0%) | $53,953 |
Occupancy by Householder Income Bracket in Howell
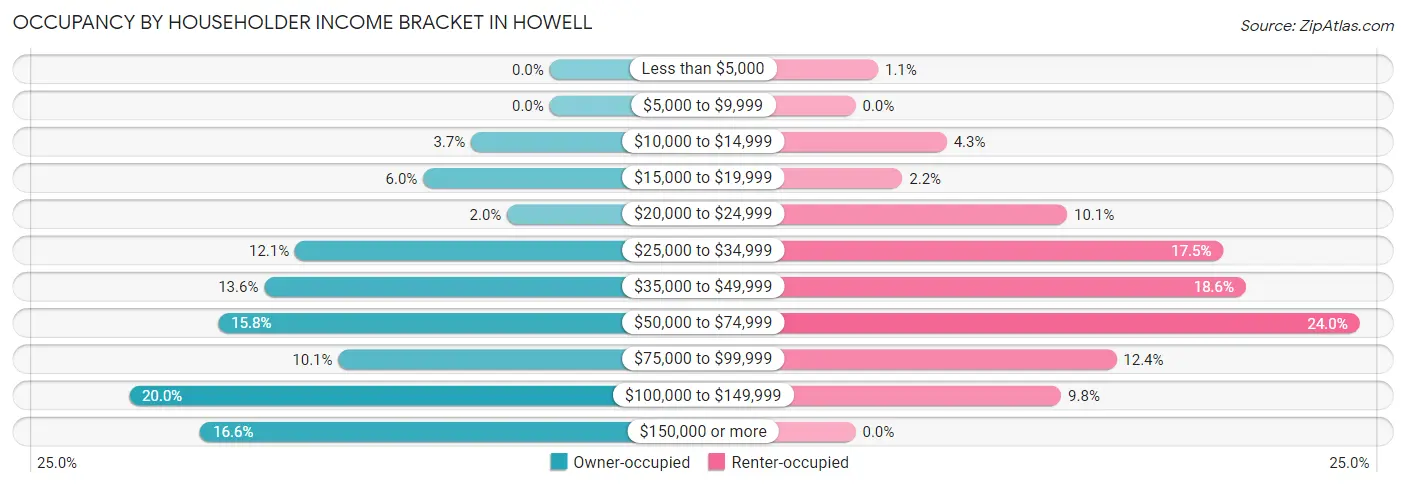
| Income Bracket | Owner-occupied | Renter-occupied |
| Less than $5,000 | 0 (0.0%) | 27 (1.1%) |
| $5,000 to $9,999 | 0 (0.0%) | 0 (0.0%) |
| $10,000 to $14,999 | 87 (3.7%) | 109 (4.3%) |
| $15,000 to $19,999 | 140 (6.0%) | 56 (2.2%) |
| $20,000 to $24,999 | 47 (2.0%) | 253 (10.1%) |
| $25,000 to $34,999 | 282 (12.1%) | 440 (17.5%) |
| $35,000 to $49,999 | 316 (13.6%) | 467 (18.6%) |
| $50,000 to $74,999 | 367 (15.8%) | 603 (24.0%) |
| $75,000 to $99,999 | 234 (10.1%) | 312 (12.4%) |
| $100,000 to $149,999 | 466 (20.0%) | 246 (9.8%) |
| $150,000 or more | 387 (16.6%) | 0 (0.0%) |
| Total | 2,326 (100.0%) | 2,513 (100.0%) |
Monthly Housing Cost Tiers in Howell
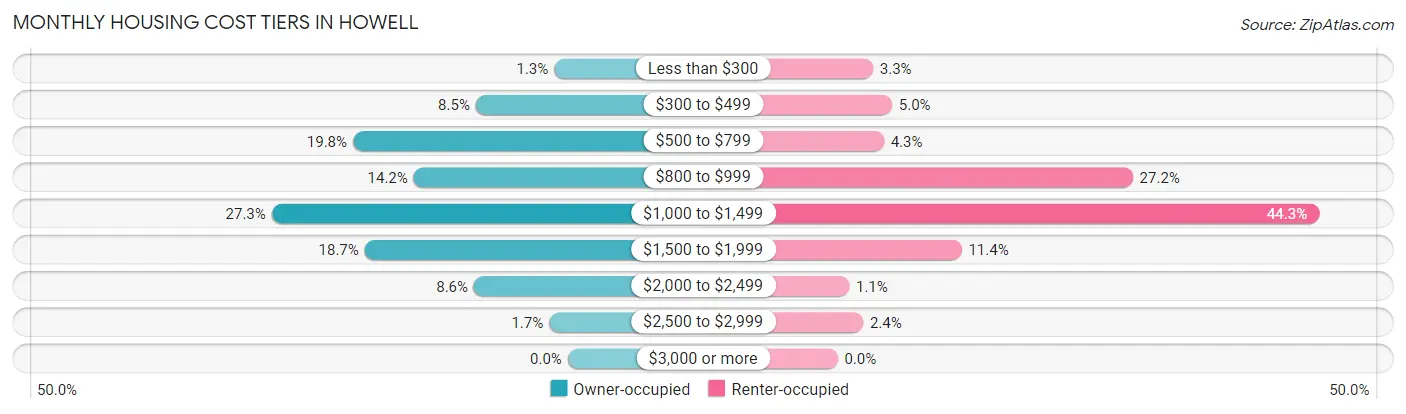
| Monthly Cost | Owner-occupied | Renter-occupied |
| Less than $300 | 29 (1.3%) | 82 (3.3%) |
| $300 to $499 | 197 (8.5%) | 126 (5.0%) |
| $500 to $799 | 460 (19.8%) | 107 (4.3%) |
| $800 to $999 | 330 (14.2%) | 683 (27.2%) |
| $1,000 to $1,499 | 634 (27.3%) | 1,114 (44.3%) |
| $1,500 to $1,999 | 435 (18.7%) | 287 (11.4%) |
| $2,000 to $2,499 | 201 (8.6%) | 27 (1.1%) |
| $2,500 to $2,999 | 40 (1.7%) | 59 (2.4%) |
| $3,000 or more | 0 (0.0%) | 0 (0.0%) |
| Total | 2,326 (100.0%) | 2,513 (100.0%) |
Physical Housing Characteristics in Howell
Housing Structures in Howell
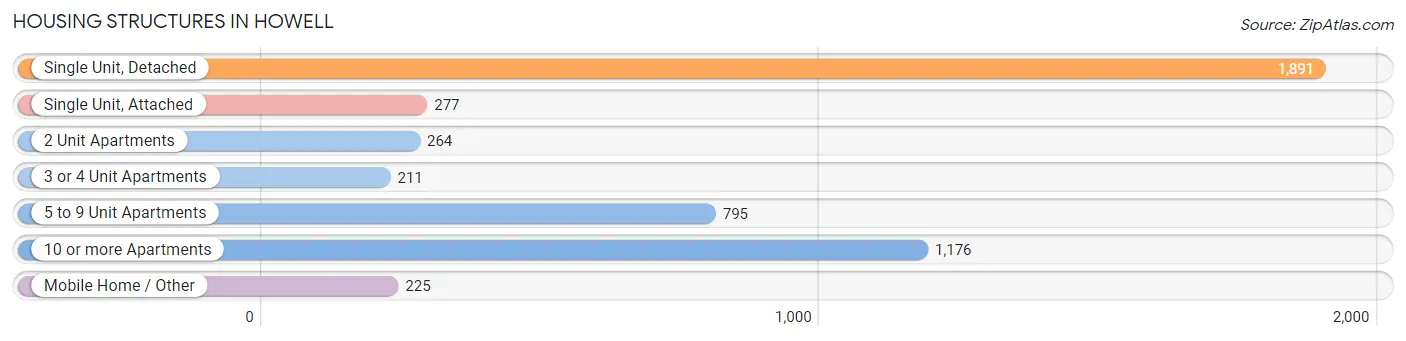
| Structure Type | # Housing Units | % Housing Units |
| Single Unit, Detached | 1,891 | 39.1% |
| Single Unit, Attached | 277 | 5.7% |
| 2 Unit Apartments | 264 | 5.5% |
| 3 or 4 Unit Apartments | 211 | 4.4% |
| 5 to 9 Unit Apartments | 795 | 16.4% |
| 10 or more Apartments | 1,176 | 24.3% |
| Mobile Home / Other | 225 | 4.6% |
| Total | 4,839 | 100.0% |
Housing Structures by Occupancy in Howell
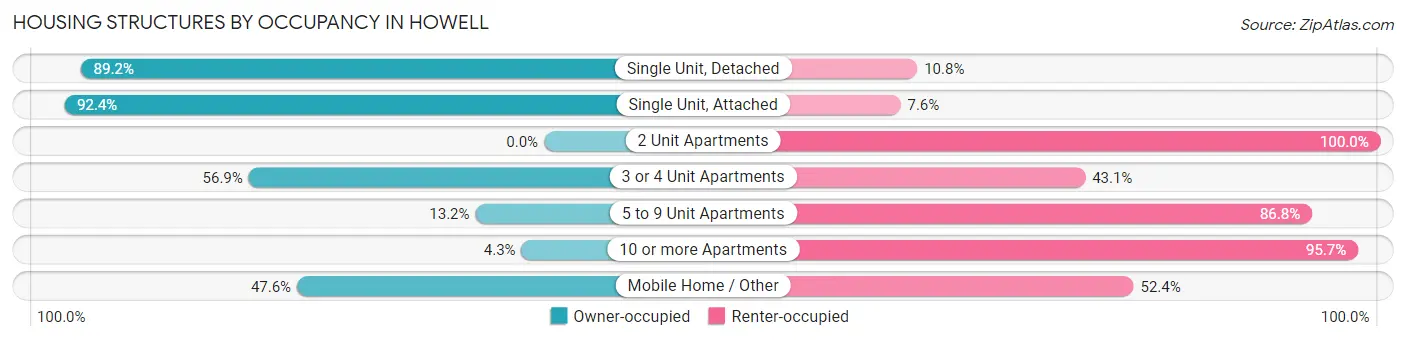
| Structure Type | Owner-occupied | Renter-occupied |
| Single Unit, Detached | 1,687 (89.2%) | 204 (10.8%) |
| Single Unit, Attached | 256 (92.4%) | 21 (7.6%) |
| 2 Unit Apartments | 0 (0.0%) | 264 (100.0%) |
| 3 or 4 Unit Apartments | 120 (56.9%) | 91 (43.1%) |
| 5 to 9 Unit Apartments | 105 (13.2%) | 690 (86.8%) |
| 10 or more Apartments | 51 (4.3%) | 1,125 (95.7%) |
| Mobile Home / Other | 107 (47.6%) | 118 (52.4%) |
| Total | 2,326 (48.1%) | 2,513 (51.9%) |
Housing Structures by Number of Rooms in Howell
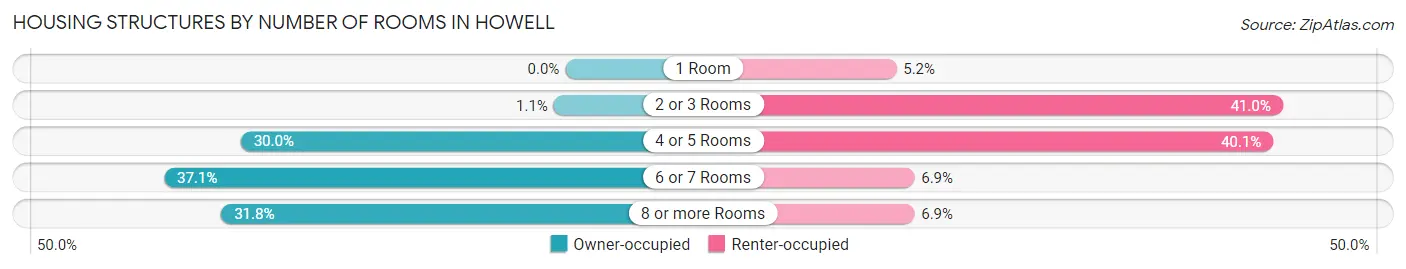
| Number of Rooms | Owner-occupied | Renter-occupied |
| 1 Room | 0 (0.0%) | 131 (5.2%) |
| 2 or 3 Rooms | 25 (1.1%) | 1,029 (40.9%) |
| 4 or 5 Rooms | 698 (30.0%) | 1,007 (40.1%) |
| 6 or 7 Rooms | 863 (37.1%) | 173 (6.9%) |
| 8 or more Rooms | 740 (31.8%) | 173 (6.9%) |
| Total | 2,326 (100.0%) | 2,513 (100.0%) |
Housing Structure by Heating Type in Howell
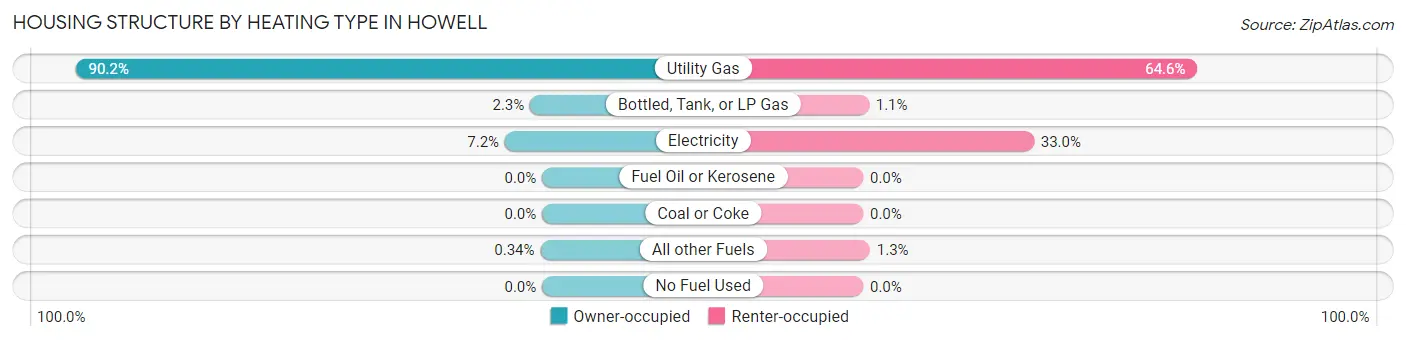
| Heating Type | Owner-occupied | Renter-occupied |
| Utility Gas | 2,097 (90.1%) | 1,623 (64.6%) |
| Bottled, Tank, or LP Gas | 54 (2.3%) | 28 (1.1%) |
| Electricity | 167 (7.2%) | 829 (33.0%) |
| Fuel Oil or Kerosene | 0 (0.0%) | 0 (0.0%) |
| Coal or Coke | 0 (0.0%) | 0 (0.0%) |
| All other Fuels | 8 (0.3%) | 33 (1.3%) |
| No Fuel Used | 0 (0.0%) | 0 (0.0%) |
| Total | 2,326 (100.0%) | 2,513 (100.0%) |
Household Vehicle Usage in Howell
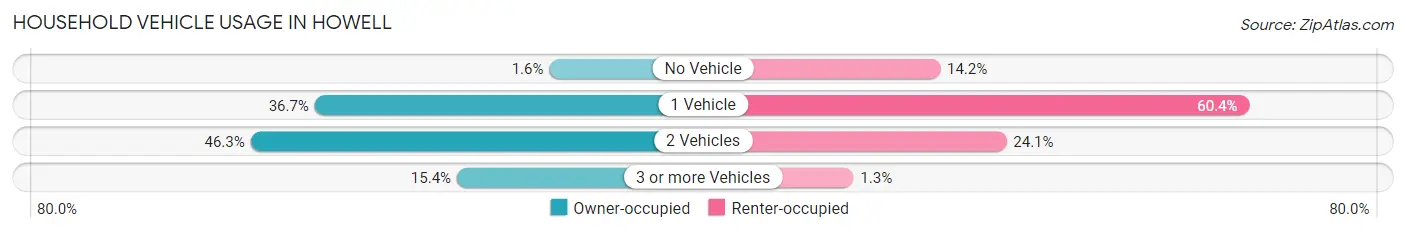
| Vehicles per Household | Owner-occupied | Renter-occupied |
| No Vehicle | 38 (1.6%) | 357 (14.2%) |
| 1 Vehicle | 853 (36.7%) | 1,518 (60.4%) |
| 2 Vehicles | 1,076 (46.3%) | 606 (24.1%) |
| 3 or more Vehicles | 359 (15.4%) | 32 (1.3%) |
| Total | 2,326 (100.0%) | 2,513 (100.0%) |
Real Estate & Mortgages in Howell
Real Estate and Mortgage Overview in Howell
| Characteristic | Without Mortgage | With Mortgage |
| Housing Units | 794 | 1,532 |
| Median Property Value | $198,400 | $242,200 |
| Median Household Income | $43,889 | $347 |
| Monthly Housing Costs | $574 | $0 |
| Real Estate Taxes | $2,532 | $17 |
Property Value by Mortgage Status in Howell
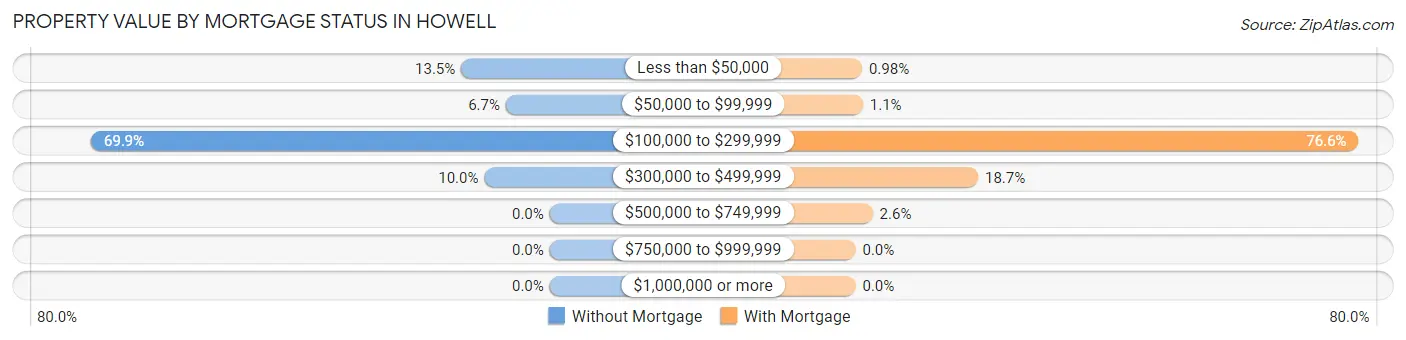
| Property Value | Without Mortgage | With Mortgage |
| Less than $50,000 | 107 (13.5%) | 15 (1.0%) |
| $50,000 to $99,999 | 53 (6.7%) | 17 (1.1%) |
| $100,000 to $299,999 | 555 (69.9%) | 1,174 (76.6%) |
| $300,000 to $499,999 | 79 (10.0%) | 286 (18.7%) |
| $500,000 to $749,999 | 0 (0.0%) | 40 (2.6%) |
| $750,000 to $999,999 | 0 (0.0%) | 0 (0.0%) |
| $1,000,000 or more | 0 (0.0%) | 0 (0.0%) |
| Total | 794 (100.0%) | 1,532 (100.0%) |
Household Income by Mortgage Status in Howell
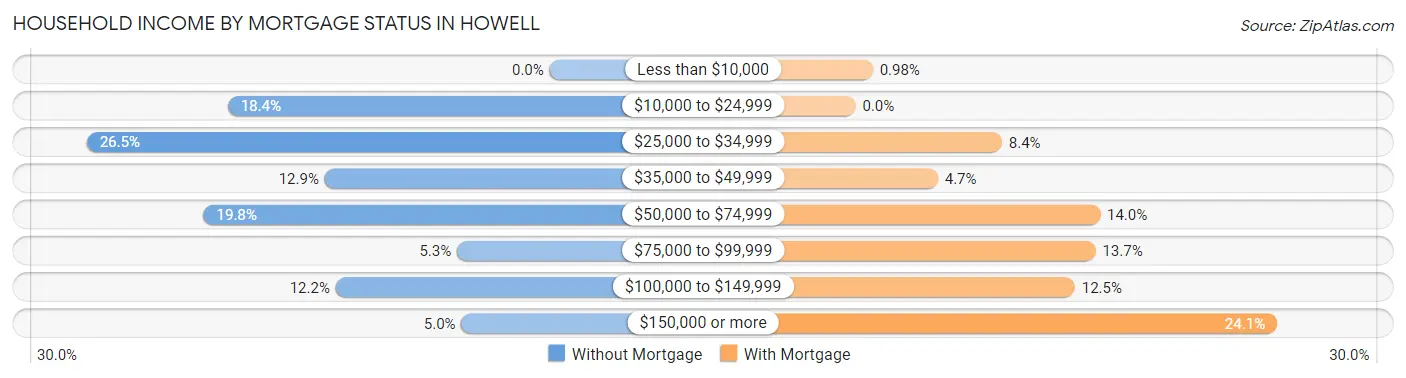
| Household Income | Without Mortgage | With Mortgage |
| Less than $10,000 | 0 (0.0%) | 15 (1.0%) |
| $10,000 to $24,999 | 146 (18.4%) | 0 (0.0%) |
| $25,000 to $34,999 | 210 (26.5%) | 128 (8.4%) |
| $35,000 to $49,999 | 102 (12.9%) | 72 (4.7%) |
| $50,000 to $74,999 | 157 (19.8%) | 214 (14.0%) |
| $75,000 to $99,999 | 42 (5.3%) | 210 (13.7%) |
| $100,000 to $149,999 | 97 (12.2%) | 192 (12.5%) |
| $150,000 or more | 40 (5.0%) | 369 (24.1%) |
| Total | 794 (100.0%) | 1,532 (100.0%) |
Property Value to Household Income Ratio in Howell
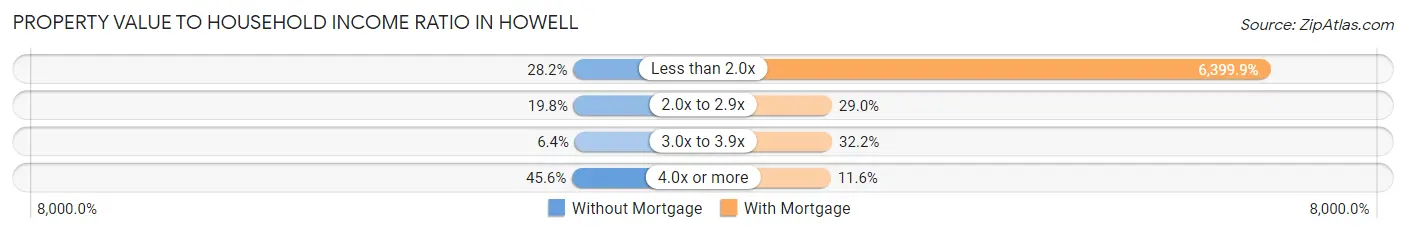
| Value-to-Income Ratio | Without Mortgage | With Mortgage |
| Less than 2.0x | 224 (28.2%) | 98,047 (6,399.9%) |
| 2.0x to 2.9x | 157 (19.8%) | 444 (29.0%) |
| 3.0x to 3.9x | 51 (6.4%) | 493 (32.2%) |
| 4.0x or more | 362 (45.6%) | 177 (11.6%) |
| Total | 794 (100.0%) | 1,532 (100.0%) |
Real Estate Taxes by Mortgage Status in Howell
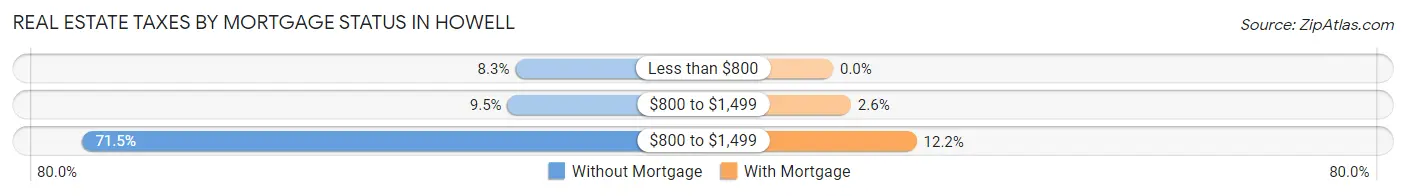
| Property Taxes | Without Mortgage | With Mortgage |
| Less than $800 | 66 (8.3%) | 0 (0.0%) |
| $800 to $1,499 | 75 (9.5%) | 40 (2.6%) |
| $800 to $1,499 | 568 (71.5%) | 187 (12.2%) |
| Total | 794 (100.0%) | 1,532 (100.0%) |
Health & Disability in Howell
Health Insurance Coverage by Age in Howell
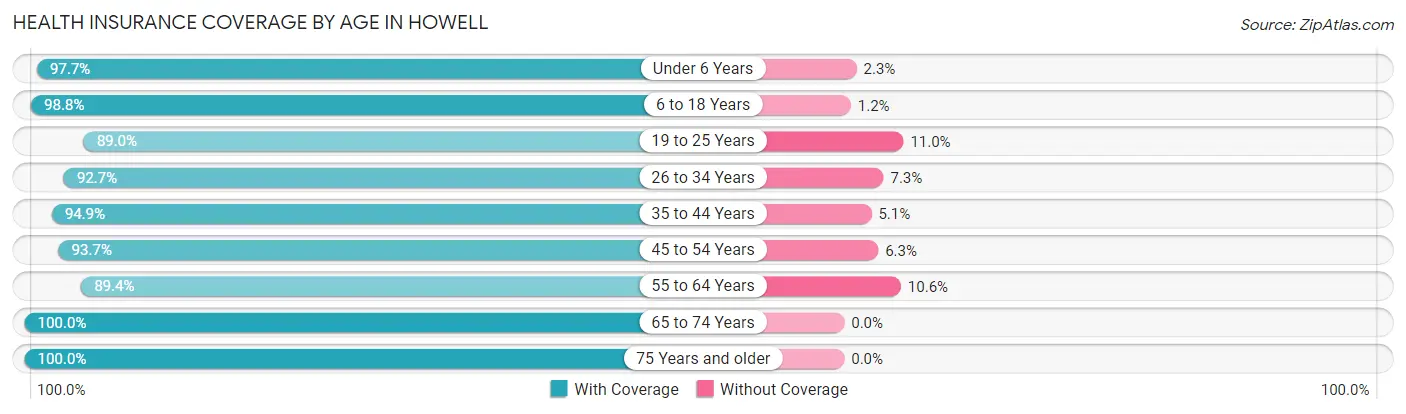
| Age Bracket | With Coverage | Without Coverage |
| Under 6 Years | 596 (97.7%) | 14 (2.3%) |
| 6 to 18 Years | 1,211 (98.8%) | 15 (1.2%) |
| 19 to 25 Years | 1,121 (89.0%) | 139 (11.0%) |
| 26 to 34 Years | 1,506 (92.7%) | 119 (7.3%) |
| 35 to 44 Years | 1,012 (94.9%) | 54 (5.1%) |
| 45 to 54 Years | 917 (93.7%) | 62 (6.3%) |
| 55 to 64 Years | 1,127 (89.4%) | 133 (10.6%) |
| 65 to 74 Years | 756 (100.0%) | 0 (0.0%) |
| 75 Years and older | 811 (100.0%) | 0 (0.0%) |
| Total | 9,057 (94.4%) | 536 (5.6%) |
Health Insurance Coverage by Citizenship Status in Howell
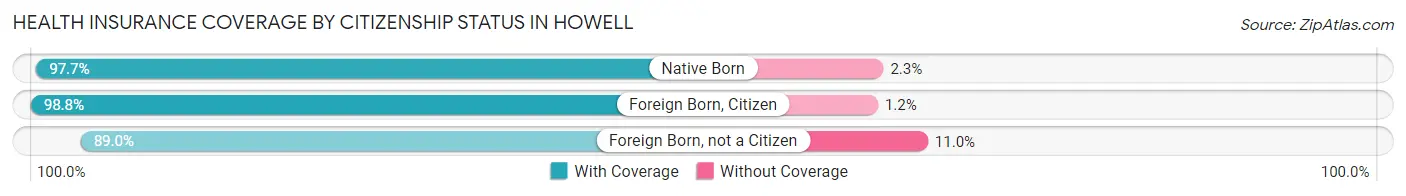
| Citizenship Status | With Coverage | Without Coverage |
| Native Born | 596 (97.7%) | 14 (2.3%) |
| Foreign Born, Citizen | 1,211 (98.8%) | 15 (1.2%) |
| Foreign Born, not a Citizen | 1,121 (89.0%) | 139 (11.0%) |
Health Insurance Coverage by Household Income in Howell
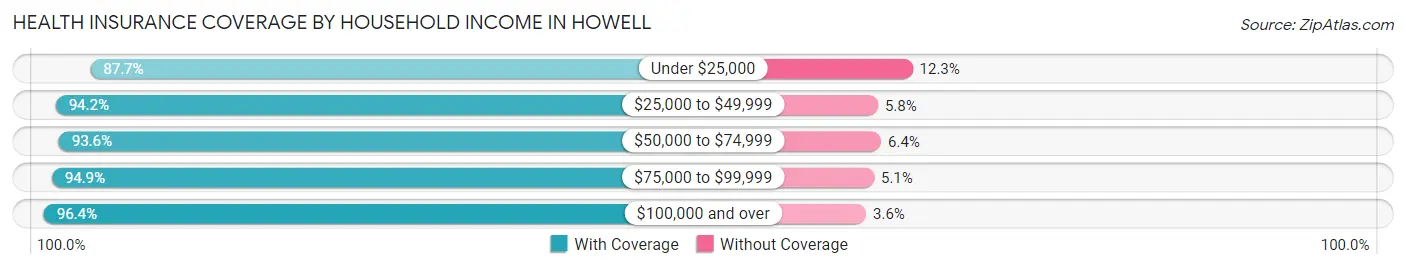
| Household Income | With Coverage | Without Coverage |
| Under $25,000 | 754 (87.7%) | 106 (12.3%) |
| $25,000 to $49,999 | 2,030 (94.2%) | 126 (5.8%) |
| $50,000 to $74,999 | 1,691 (93.6%) | 116 (6.4%) |
| $75,000 to $99,999 | 1,042 (94.9%) | 56 (5.1%) |
| $100,000 and over | 3,529 (96.4%) | 132 (3.6%) |
Public vs Private Health Insurance Coverage by Age in Howell
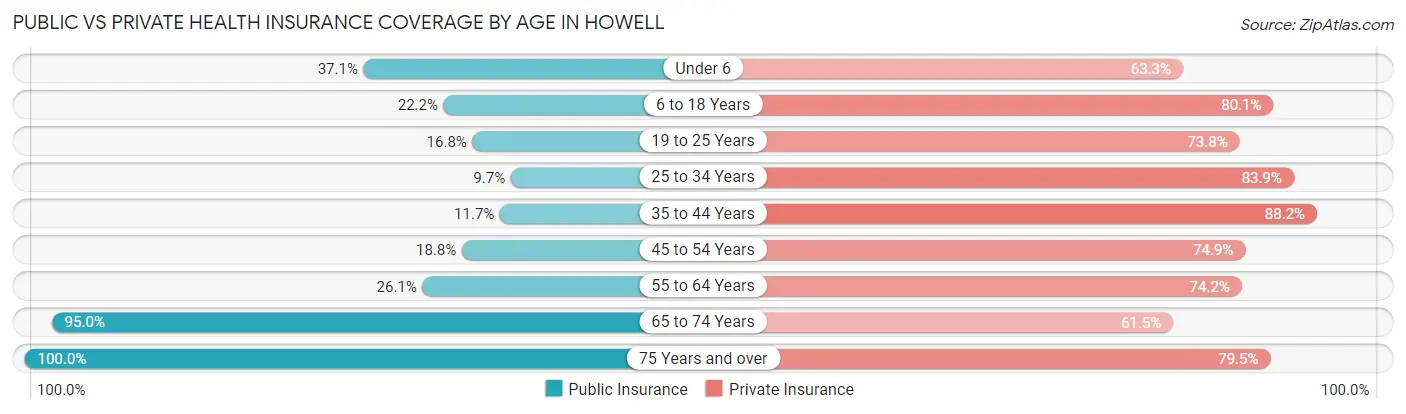
| Age Bracket | Public Insurance | Private Insurance |
| Under 6 | 226 (37.0%) | 386 (63.3%) |
| 6 to 18 Years | 272 (22.2%) | 982 (80.1%) |
| 19 to 25 Years | 212 (16.8%) | 930 (73.8%) |
| 25 to 34 Years | 158 (9.7%) | 1,363 (83.9%) |
| 35 to 44 Years | 125 (11.7%) | 940 (88.2%) |
| 45 to 54 Years | 184 (18.8%) | 733 (74.9%) |
| 55 to 64 Years | 329 (26.1%) | 935 (74.2%) |
| 65 to 74 Years | 718 (95.0%) | 465 (61.5%) |
| 75 Years and over | 811 (100.0%) | 645 (79.5%) |
| Total | 3,035 (31.6%) | 7,379 (76.9%) |
Disability Status by Sex by Age in Howell
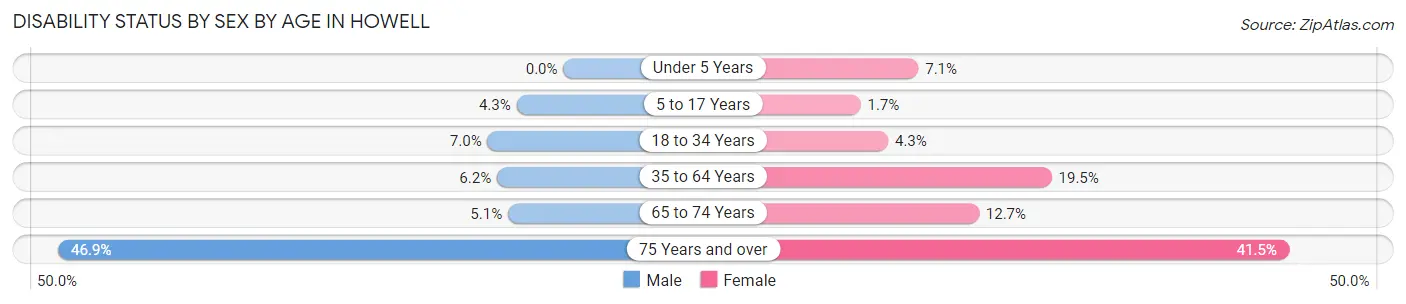
| Age Bracket | Male | Female |
| Under 5 Years | 0 (0.0%) | 11 (7.1%) |
| 5 to 17 Years | 32 (4.3%) | 9 (1.7%) |
| 18 to 34 Years | 109 (7.0%) | 61 (4.3%) |
| 35 to 64 Years | 90 (6.2%) | 359 (19.5%) |
| 65 to 74 Years | 13 (5.1%) | 64 (12.7%) |
| 75 Years and over | 83 (46.9%) | 263 (41.5%) |
Disability Class by Sex by Age in Howell
Disability Class: Hearing Difficulty
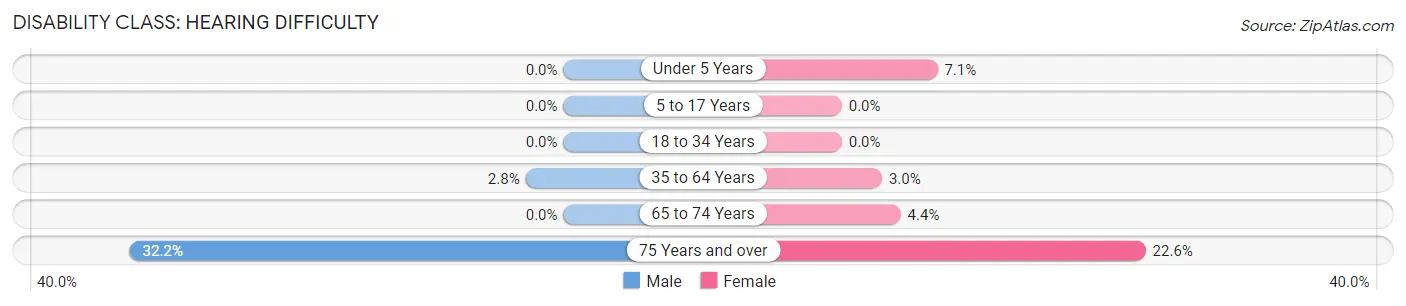
| Age Bracket | Male | Female |
| Under 5 Years | 0 (0.0%) | 11 (7.1%) |
| 5 to 17 Years | 0 (0.0%) | 0 (0.0%) |
| 18 to 34 Years | 0 (0.0%) | 0 (0.0%) |
| 35 to 64 Years | 41 (2.8%) | 55 (3.0%) |
| 65 to 74 Years | 0 (0.0%) | 22 (4.4%) |
| 75 Years and over | 57 (32.2%) | 143 (22.6%) |
Disability Class: Vision Difficulty
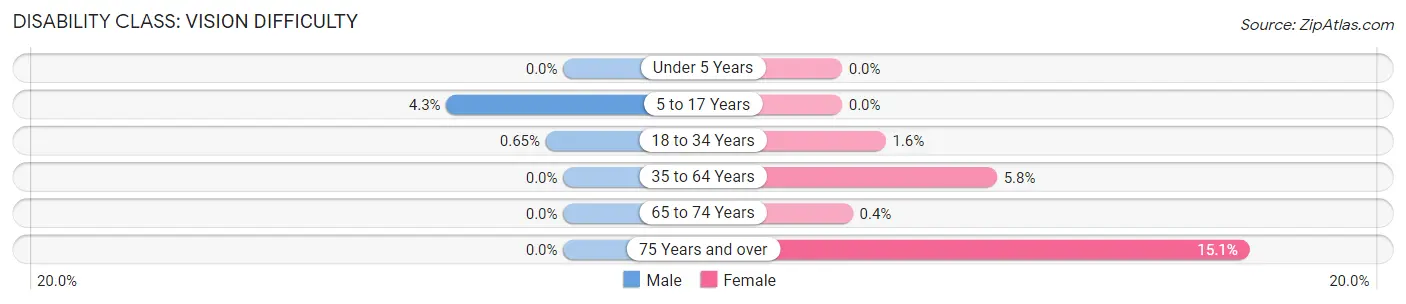
| Age Bracket | Male | Female |
| Under 5 Years | 0 (0.0%) | 0 (0.0%) |
| 5 to 17 Years | 32 (4.3%) | 0 (0.0%) |
| 18 to 34 Years | 10 (0.6%) | 23 (1.6%) |
| 35 to 64 Years | 0 (0.0%) | 106 (5.8%) |
| 65 to 74 Years | 0 (0.0%) | 2 (0.4%) |
| 75 Years and over | 0 (0.0%) | 96 (15.1%) |
Disability Class: Cognitive Difficulty
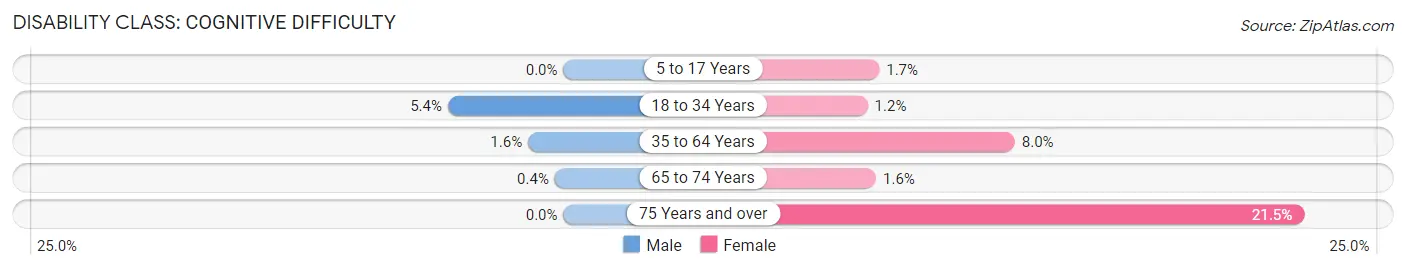
| Age Bracket | Male | Female |
| 5 to 17 Years | 0 (0.0%) | 9 (1.7%) |
| 18 to 34 Years | 83 (5.4%) | 17 (1.2%) |
| 35 to 64 Years | 24 (1.6%) | 148 (8.0%) |
| 65 to 74 Years | 1 (0.4%) | 8 (1.6%) |
| 75 Years and over | 0 (0.0%) | 136 (21.4%) |
Disability Class: Ambulatory Difficulty
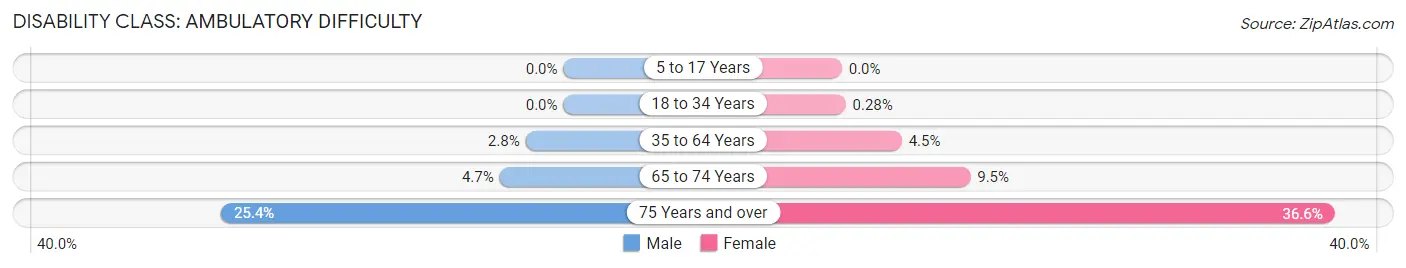
| Age Bracket | Male | Female |
| 5 to 17 Years | 0 (0.0%) | 0 (0.0%) |
| 18 to 34 Years | 0 (0.0%) | 4 (0.3%) |
| 35 to 64 Years | 41 (2.8%) | 82 (4.4%) |
| 65 to 74 Years | 12 (4.7%) | 48 (9.5%) |
| 75 Years and over | 45 (25.4%) | 232 (36.6%) |
Disability Class: Self-Care Difficulty
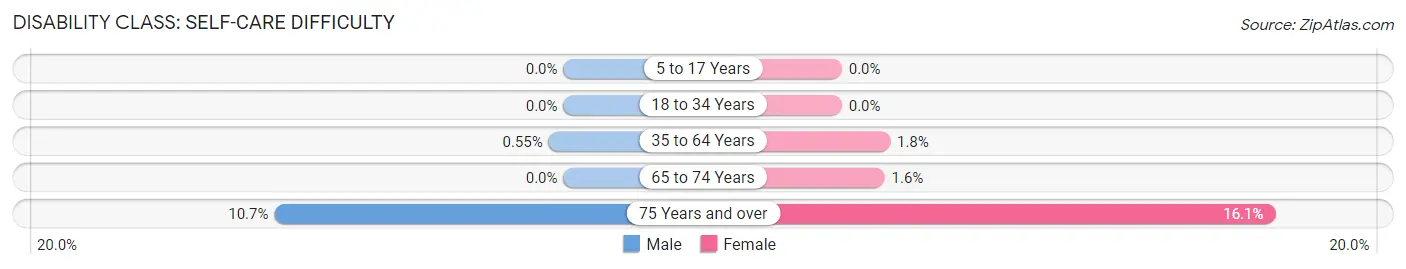
| Age Bracket | Male | Female |
| 5 to 17 Years | 0 (0.0%) | 0 (0.0%) |
| 18 to 34 Years | 0 (0.0%) | 0 (0.0%) |
| 35 to 64 Years | 8 (0.5%) | 33 (1.8%) |
| 65 to 74 Years | 0 (0.0%) | 8 (1.6%) |
| 75 Years and over | 19 (10.7%) | 102 (16.1%) |
Technology Access in Howell
Computing Device Access in Howell
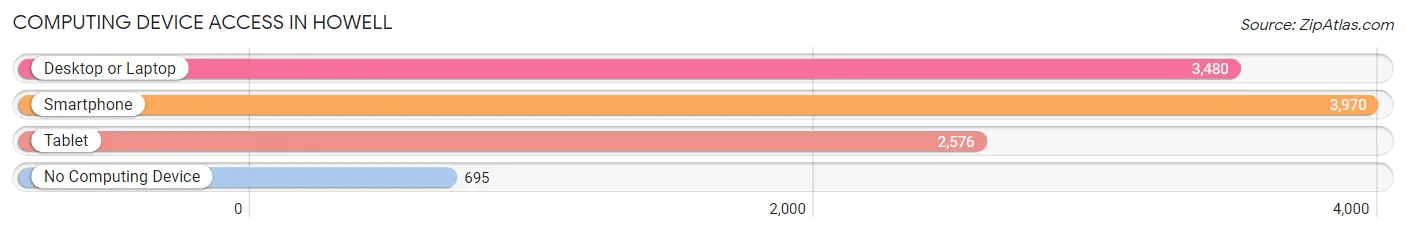
| Device Type | # Households | % Households |
| Desktop or Laptop | 3,480 | 71.9% |
| Smartphone | 3,970 | 82.0% |
| Tablet | 2,576 | 53.2% |
| No Computing Device | 695 | 14.4% |
| Total | 4,839 | 100.0% |
Internet Access in Howell
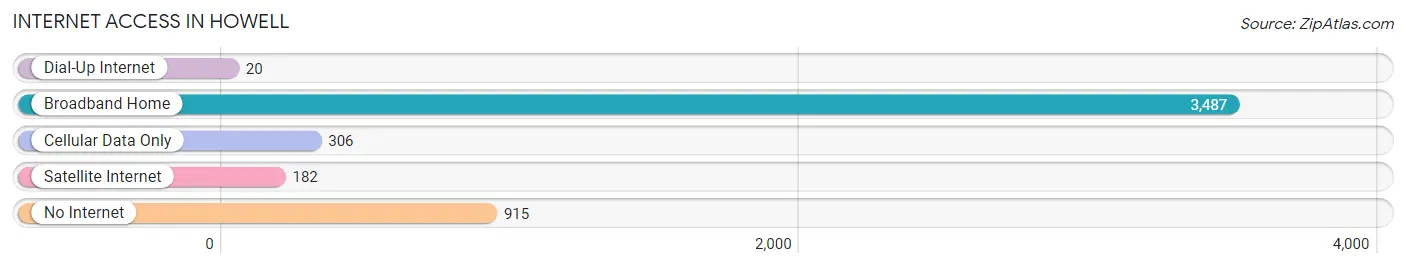
| Internet Type | # Households | % Households |
| Dial-Up Internet | 20 | 0.4% |
| Broadband Home | 3,487 | 72.1% |
| Cellular Data Only | 306 | 6.3% |
| Satellite Internet | 182 | 3.8% |
| No Internet | 915 | 18.9% |
| Total | 4,839 | 100.0% |
Howell Summary
Howell, Michigan is a city located in Livingston County, Michigan, United States. It is the county seat of Livingston County and is located about 45 miles northwest of Detroit. The city has a population of 9,489 as of the 2010 census.
History
The area that is now Howell was first settled in 1836 by William Howell, a veteran of the War of 1812. He purchased land from the government and built a log cabin on the site. The area was known as Howell's Settlement and was the first permanent settlement in Livingston County. In 1837, the settlement was incorporated as the Village of Howell. The village was named after William Howell, who was the first settler in the area.
In 1838, the first post office was established in the village. In 1845, the village was reincorporated as the City of Howell. The city was named after William Howell, who was the first settler in the area.
In 1846, the first school was established in the city. In 1848, the first newspaper, the Livingston County Democrat, was established in the city. In 1851, the first bank was established in the city.
In 1855, the first railroad was built in the city. The railroad connected Howell to Detroit and other cities in Michigan. In 1867, the first telephone line was established in the city.
In 1871, the first fire department was established in the city. In 1872, the first public library was established in the city. In 1873, the first hospital was established in the city.
In 1875, the first electric light plant was established in the city. In 1876, the first waterworks was established in the city. In 1877, the first sewer system was established in the city.
In 1878, the first public park was established in the city. In 1879, the first high school was established in the city. In 1880, the first public library building was constructed in the city.
In 1881, the first electric streetcar line was established in the city. In 1882, the first public library building was completed in the city. In 1883, the first public library building was dedicated in the city.
In 1884, the first public library building was expanded in the city. In 1885, the first public library building was remodeled in the city. In 1886, the first public library building was renovated in the city.
In 1887, the first public library building was enlarged in the city. In 1888, the first public library building was remodeled and enlarged in the city. In 1889, the first public library building was remodeled and enlarged again in the city.
In 1890, the first public library building was remodeled and enlarged yet again in the city. In 1891, the first public library building was remodeled and enlarged yet again in the city. In 1892, the first public library building was remodeled and enlarged yet again in the city.
In 1893, the first public library building was remodeled and enlarged yet again in the city. In 1894, the first public library building was remodeled and enlarged yet again in the city. In 1895, the first public library building was remodeled and enlarged yet again in the city.
In 1896, the first public library building was remodeled and enlarged yet again in the city. In 1897, the first public library building was remodeled and enlarged yet again in the city. In 1898, the first public library building was remodeled and enlarged yet again in the city.
In 1899, the first public library building was remodeled and enlarged yet again in the city. In 1900, the first public library building was remodeled and enlarged yet again in the city. In 1901, the first public library building was remodeled and enlarged yet again in the city.
Geography
Howell is located at 42°35′N 83°54′W (42.58, -83.90). According to the United States Census Bureau, the city has a total area of 5.2 square miles (13.4 km2), all land.
Economy
Howell is home to a variety of businesses and industries. The city is home to several manufacturing companies, including automotive parts, medical equipment, and food processing. The city is also home to several retail stores, restaurants, and other businesses.
The city is also home to several educational institutions, including Cleary University, Howell Public Schools, and Livingston County Catholic Schools.
Demographics
As of the 2010 census, there were 9,489 people, 3,845 households, and 2,541 families residing in the city. The population density was 1,827.2 people per square mile (706.2/km2). There were 4,093 housing units at an average density of 790.2 per square mile (305.3/km2). The racial makeup of the city was 94.2% White, 1.3% African American, 0.3% Native American, 1.2% Asian, 0.1% Pacific Islander, 1.2% from other races, and 1.7% from two or more races. Hispanic or Latino of any race were 3.7% of the population.
There were 3,845 households, out of which 32.2% had children under the age of 18 living with them, 49.2% were married couples living together, 11.7% had a female householder with no husband present, and 34.2% were non-families. 28.7% of all households were made up of individuals, and 10.2% had someone living alone who was 65 years of age or older. The average household size was 2.45 and the average family size was 3.02.
In the city, the population was spread out, with 25.2% under the age of 18, 8.2% from 18 to 24, 30.2% from 25 to 44, 22.7% from 45 to 64, and 13.7% who were 65 years of age or older. The median age was 36 years. For every 100 females, there were 93.2 males. For every 100 females age 18 and over, there were 89.7 males.
The median income for a household in the city was $45,945, and the median income for a family was $54,945. Males had a median income of $41,945 versus $30,945 for females. The per capita income for the city was $22,945. About 5.2% of families and 7.2% of the population were below the poverty line, including 9.2% of those under age 18 and 6.2% of those age 65 or over.
Common Questions
What is Per Capita Income in Howell?
Per Capita income in Howell is $37,300.
What is the Median Family Income in Howell?
Median Family Income in Howell is $86,739.
What is the Median Household income in Howell?
Median Household Income in Howell is $53,953.
What is Income or Wage Gap in Howell?
Income or Wage Gap in Howell is 22.8%.
Women in Howell earn 77.2 cents for every dollar earned by a man.
What is Family Income Deficit in Howell?
Family Income Deficit in Howell is $8,669.
Families that are below poverty line in Howell earn $8,669 less on average than the poverty threshold level.
What is Inequality or Gini Index in Howell?
Inequality or Gini Index in Howell is 0.39.
What is the Total Population of Howell?
Total Population of Howell is 10,067.
What is the Total Male Population of Howell?
Total Male Population of Howell is 4,807.
What is the Total Female Population of Howell?
Total Female Population of Howell is 5,260.
What is the Ratio of Males per 100 Females in Howell?
There are 91.39 Males per 100 Females in Howell.
What is the Ratio of Females per 100 Males in Howell?
There are 109.42 Females per 100 Males in Howell.
What is the Median Population Age in Howell?
Median Population Age in Howell is 37.4 Years.
What is the Average Family Size in Howell
Average Family Size in Howell is 2.9 People.
What is the Average Household Size in Howell
Average Household Size in Howell is 2.0 People.
How Large is the Labor Force in Howell?
There are 5,659 People in the Labor Forcein in Howell.
What is the Percentage of People in the Labor Force in Howell?
66.4% of People are in the Labor Force in Howell.
What is the Unemployment Rate in Howell?
Unemployment Rate in Howell is 4.4%.