Adrian, MI Map & Demographics
Adrian Map
Adrian Overview
$24,078
PER CAPITA INCOME
$53,250
AVG FAMILY INCOME
$40,797
AVG HOUSEHOLD INCOME
28.3%
WAGE / INCOME GAP [ % ]
71.7¢/ $1
WAGE / INCOME GAP [ $ ]
$12,864
FAMILY INCOME DEFICIT
0.44
INEQUALITY / GINI INDEX
20,607
TOTAL POPULATION
9,946
MALE POPULATION
10,661
FEMALE POPULATION
93.29
MALES / 100 FEMALES
107.19
FEMALES / 100 MALES
34.9
MEDIAN AGE
2.9
AVG FAMILY SIZE
2.3
AVG HOUSEHOLD SIZE
8,878
LABOR FORCE [ PEOPLE ]
52.4%
PERCENT IN LABOR FORCE
4.8%
UNEMPLOYMENT RATE
Adrian Zip Codes
Adrian Area Codes
Income in Adrian
Income Overview in Adrian
Per Capita Income in Adrian is $24,078, while median incomes of families and households are $53,250 and $40,797 respectively.
| Characteristic | Number | Measure |
| Per Capita Income | 20,607 | $24,078 |
| Median Family Income | 4,330 | $53,250 |
| Mean Family Income | 4,330 | $65,379 |
| Median Household Income | 7,960 | $40,797 |
| Mean Household Income | 7,960 | $56,217 |
| Income Deficit | 4,330 | $12,864 |
| Wage / Income Gap (%) | 20,607 | 28.28% |
| Wage / Income Gap ($) | 20,607 | 71.72¢ per $1 |
| Gini / Inequality Index | 20,607 | 0.44 |
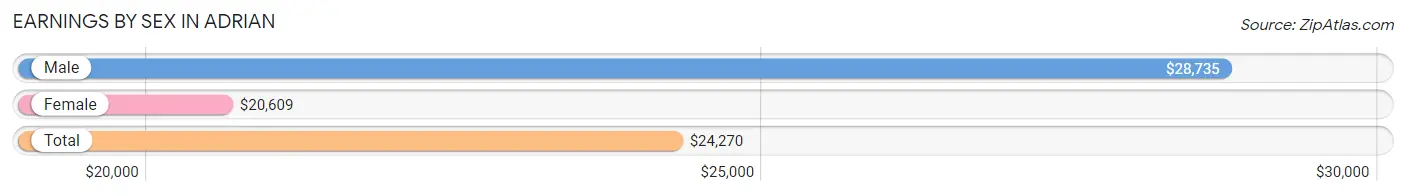
Earnings by Sex in Adrian
Average Earnings in Adrian are $24,270, $28,735 for men and $20,609 for women, a difference of 28.3%.
| Sex | Number | Average Earnings |
| Male | 5,531 (53.3%) | $28,735 |
| Female | 4,854 (46.7%) | $20,609 |
| Total | 10,385 (100.0%) | $24,270 |
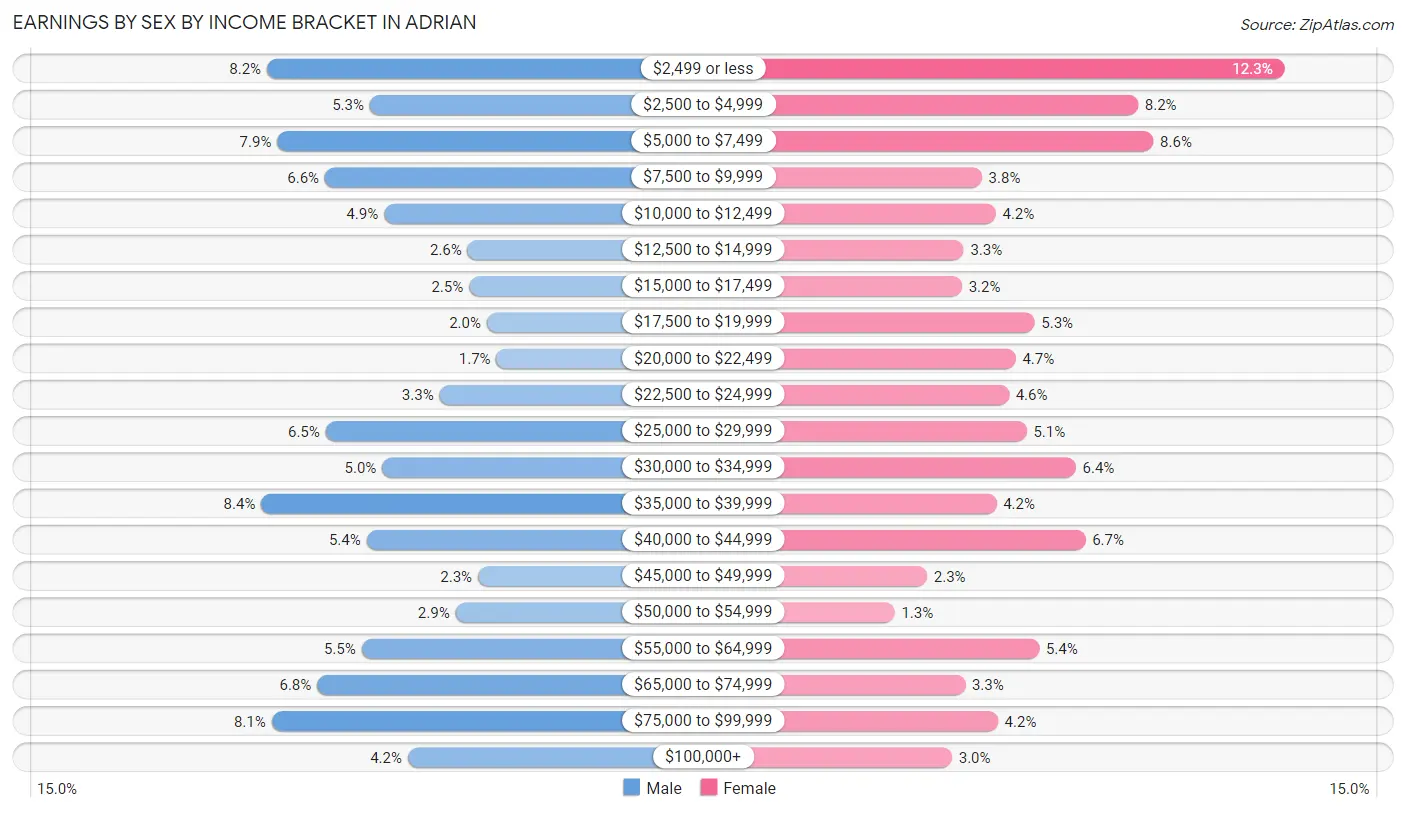
Earnings by Sex by Income Bracket in Adrian
The most common earnings brackets in Adrian are $35,000 to $39,999 for men (462 | 8.4%) and $2,499 or less for women (597 | 12.3%).
| Income | Male | Female |
| $2,499 or less | 453 (8.2%) | 597 (12.3%) |
| $2,500 to $4,999 | 293 (5.3%) | 397 (8.2%) |
| $5,000 to $7,499 | 437 (7.9%) | 418 (8.6%) |
| $7,500 to $9,999 | 363 (6.6%) | 184 (3.8%) |
| $10,000 to $12,499 | 271 (4.9%) | 203 (4.2%) |
| $12,500 to $14,999 | 141 (2.5%) | 159 (3.3%) |
| $15,000 to $17,499 | 139 (2.5%) | 157 (3.2%) |
| $17,500 to $19,999 | 111 (2.0%) | 256 (5.3%) |
| $20,000 to $22,499 | 96 (1.7%) | 230 (4.7%) |
| $22,500 to $24,999 | 185 (3.3%) | 221 (4.5%) |
| $25,000 to $29,999 | 362 (6.5%) | 245 (5.1%) |
| $30,000 to $34,999 | 274 (5.0%) | 312 (6.4%) |
| $35,000 to $39,999 | 462 (8.4%) | 204 (4.2%) |
| $40,000 to $44,999 | 298 (5.4%) | 325 (6.7%) |
| $45,000 to $49,999 | 125 (2.3%) | 109 (2.2%) |
| $50,000 to $54,999 | 160 (2.9%) | 65 (1.3%) |
| $55,000 to $64,999 | 306 (5.5%) | 262 (5.4%) |
| $65,000 to $74,999 | 375 (6.8%) | 161 (3.3%) |
| $75,000 to $99,999 | 446 (8.1%) | 206 (4.2%) |
| $100,000+ | 234 (4.2%) | 143 (2.9%) |
| Total | 5,531 (100.0%) | 4,854 (100.0%) |
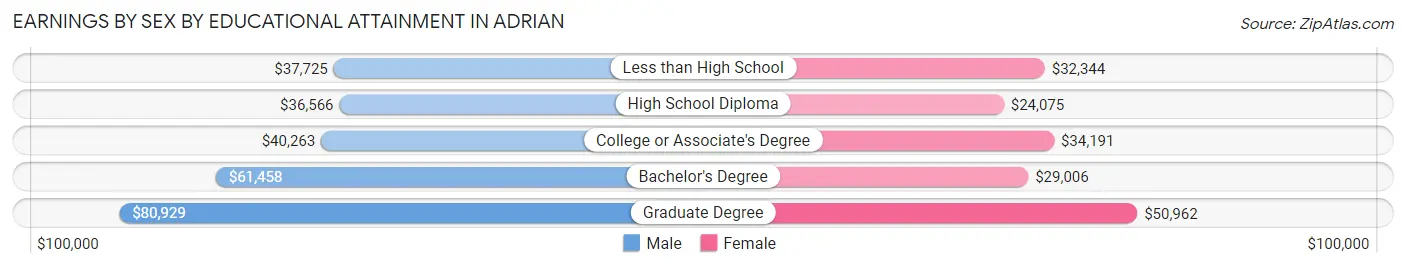
Earnings by Sex by Educational Attainment in Adrian
Average earnings in Adrian are $39,142 for men and $30,685 for women, a difference of 21.6%. Men with an educational attainment of graduate degree enjoy the highest average annual earnings of $80,929, while those with high school diploma education earn the least with $36,566. Women with an educational attainment of graduate degree earn the most with the average annual earnings of $50,962, while those with high school diploma education have the smallest earnings of $24,075.
| Educational Attainment | Male Income | Female Income |
| Less than High School | $37,725 | $32,344 |
| High School Diploma | $36,566 | $24,075 |
| College or Associate's Degree | $40,263 | $34,191 |
| Bachelor's Degree | $61,458 | $29,006 |
| Graduate Degree | $80,929 | $50,962 |
| Total | $39,142 | $30,685 |
Family Income in Adrian
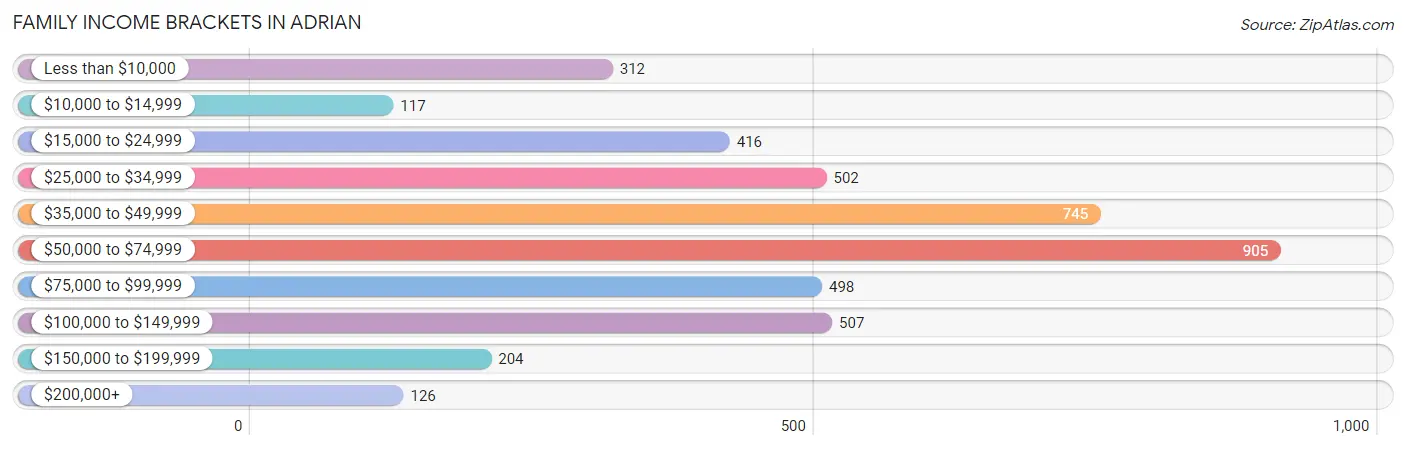
Family Income Brackets in Adrian
According to the Adrian family income data, there are 905 families falling into the $50,000 to $74,999 income range, which is the most common income bracket and makes up 20.9% of all families. Conversely, the $10,000 to $14,999 income bracket is the least frequent group with only 117 families (2.7%) belonging to this category.
| Income Bracket | # Families | % Families |
| Less than $10,000 | 312 | 7.2% |
| $10,000 to $14,999 | 117 | 2.7% |
| $15,000 to $24,999 | 416 | 9.6% |
| $25,000 to $34,999 | 502 | 11.6% |
| $35,000 to $49,999 | 745 | 17.2% |
| $50,000 to $74,999 | 905 | 20.9% |
| $75,000 to $99,999 | 498 | 11.5% |
| $100,000 to $149,999 | 507 | 11.7% |
| $150,000 to $199,999 | 204 | 4.7% |
| $200,000+ | 126 | 2.9% |
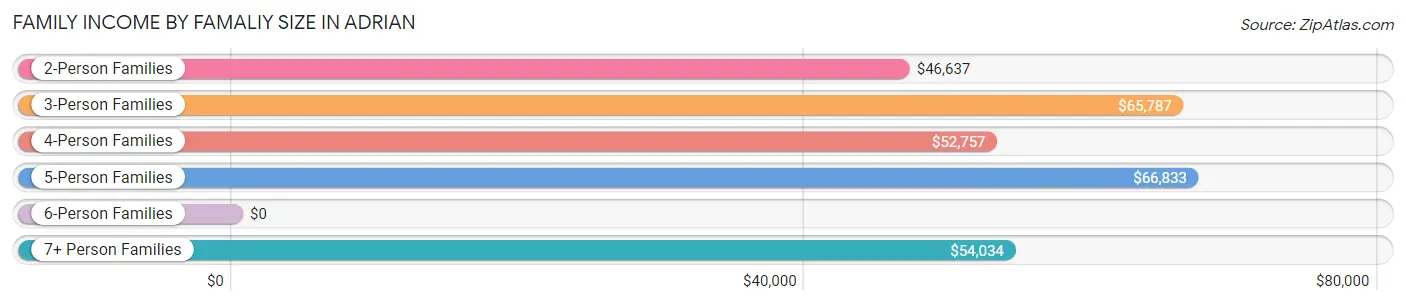
Family Income by Famaliy Size in Adrian
5-person families (374 | 8.6%) account for the highest median family income in Adrian with $66,833 per family, while 2-person families (2,297 | 53.0%) have the highest median income of $23,318 per family member.
| Income Bracket | # Families | Median Income |
| 2-Person Families | 2,297 (53.0%) | $46,637 |
| 3-Person Families | 860 (19.9%) | $65,787 |
| 4-Person Families | 537 (12.4%) | $52,757 |
| 5-Person Families | 374 (8.6%) | $66,833 |
| 6-Person Families | 123 (2.8%) | $0 |
| 7+ Person Families | 139 (3.2%) | $54,034 |
| Total | 4,330 (100.0%) | $53,250 |
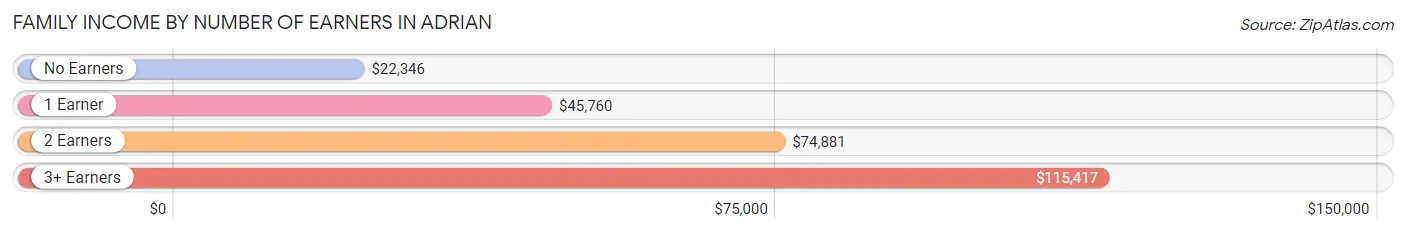
Family Income by Number of Earners in Adrian
The median family income in Adrian is $53,250, with families comprising 3+ earners (240) having the highest median family income of $115,417, while families with no earners (947) have the lowest median family income of $22,346, accounting for 5.5% and 21.9% of families, respectively.
| Number of Earners | # Families | Median Income |
| No Earners | 947 (21.9%) | $22,346 |
| 1 Earner | 1,831 (42.3%) | $45,760 |
| 2 Earners | 1,312 (30.3%) | $74,881 |
| 3+ Earners | 240 (5.5%) | $115,417 |
| Total | 4,330 (100.0%) | $53,250 |
Household Income in Adrian
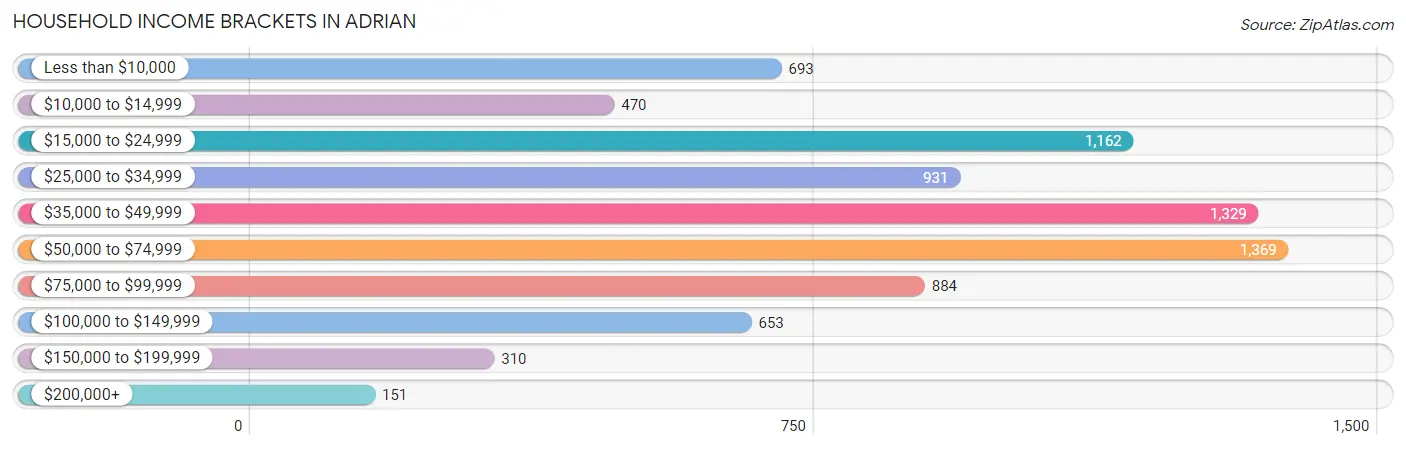
Household Income Brackets in Adrian
With 1,369 households falling in the category, the $50,000 to $74,999 income range is the most frequent in Adrian, accounting for 17.2% of all households. In contrast, only 151 households (1.9%) fall into the $200,000+ income bracket, making it the least populous group.
| Income Bracket | # Households | % Households |
| Less than $10,000 | 693 | 8.7% |
| $10,000 to $14,999 | 470 | 5.9% |
| $15,000 to $24,999 | 1,162 | 14.6% |
| $25,000 to $34,999 | 931 | 11.7% |
| $35,000 to $49,999 | 1,329 | 16.7% |
| $50,000 to $74,999 | 1,369 | 17.2% |
| $75,000 to $99,999 | 884 | 11.1% |
| $100,000 to $149,999 | 653 | 8.2% |
| $150,000 to $199,999 | 310 | 3.9% |
| $200,000+ | 151 | 1.9% |
Household Income by Householder Age in Adrian
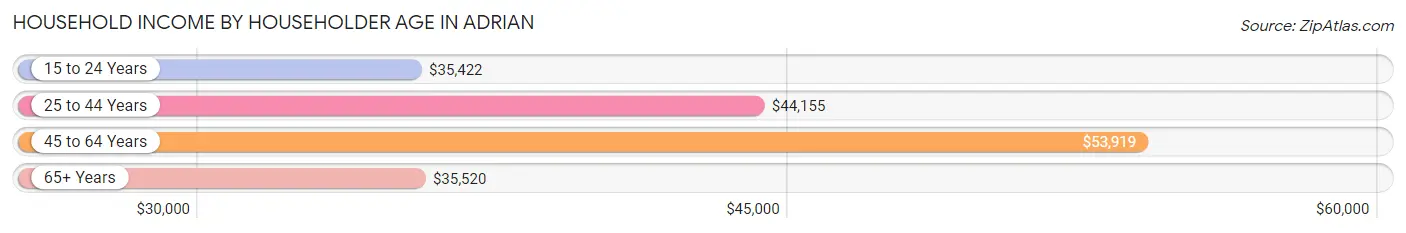
The median household income in Adrian is $40,797, with the highest median household income of $53,919 found in the 45 to 64 years age bracket for the primary householder. A total of 2,617 households (32.9%) fall into this category. Meanwhile, the 15 to 24 years age bracket for the primary householder has the lowest median household income of $35,422, with 585 households (7.3%) in this group.
| Income Bracket | # Households | Median Income |
| 15 to 24 Years | 585 (7.3%) | $35,422 |
| 25 to 44 Years | 2,479 (31.1%) | $44,155 |
| 45 to 64 Years | 2,617 (32.9%) | $53,919 |
| 65+ Years | 2,279 (28.6%) | $35,520 |
| Total | 7,960 (100.0%) | $40,797 |
Poverty in Adrian
Income Below Poverty by Sex and Age in Adrian
With 21.0% poverty level for males and 25.5% for females among the residents of Adrian, 18 to 24 year old males and 16 and 17 year old females are the most vulnerable to poverty, with 547 males (46.4%) and 91 females (65.5%) in their respective age groups living below the poverty level.
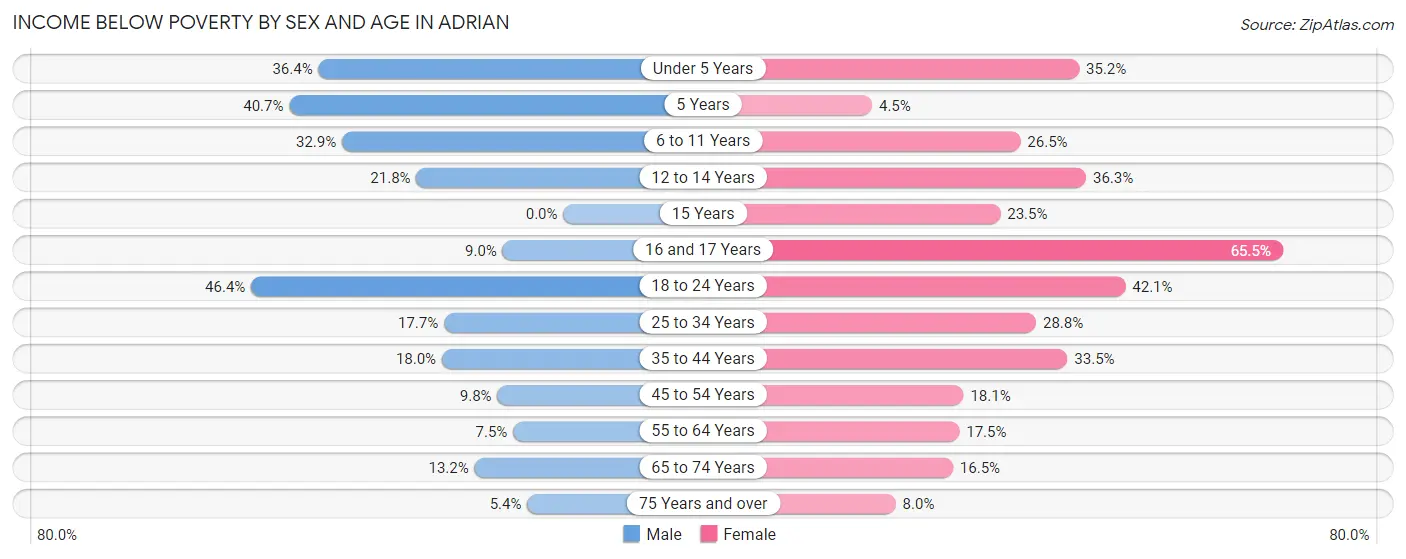
| Age Bracket | Male | Female |
| Under 5 Years | 188 (36.4%) | 203 (35.2%) |
| 5 Years | 70 (40.7%) | 4 (4.5%) |
| 6 to 11 Years | 209 (32.9%) | 179 (26.5%) |
| 12 to 14 Years | 67 (21.8%) | 169 (36.3%) |
| 15 Years | 0 (0.0%) | 16 (23.5%) |
| 16 and 17 Years | 21 (9.0%) | 91 (65.5%) |
| 18 to 24 Years | 547 (46.4%) | 416 (42.1%) |
| 25 to 34 Years | 230 (17.7%) | 349 (28.8%) |
| 35 to 44 Years | 194 (18.0%) | 332 (33.5%) |
| 45 to 54 Years | 114 (9.8%) | 180 (18.1%) |
| 55 to 64 Years | 61 (7.4%) | 222 (17.4%) |
| 65 to 74 Years | 110 (13.2%) | 187 (16.5%) |
| 75 Years and over | 26 (5.3%) | 69 (8.0%) |
| Total | 1,837 (21.0%) | 2,417 (25.5%) |
Income Above Poverty by Sex and Age in Adrian
According to the poverty statistics in Adrian, males aged 15 years and females aged 5 years are the age groups that are most secure financially, with 100.0% of males and 95.5% of females in these age groups living above the poverty line.
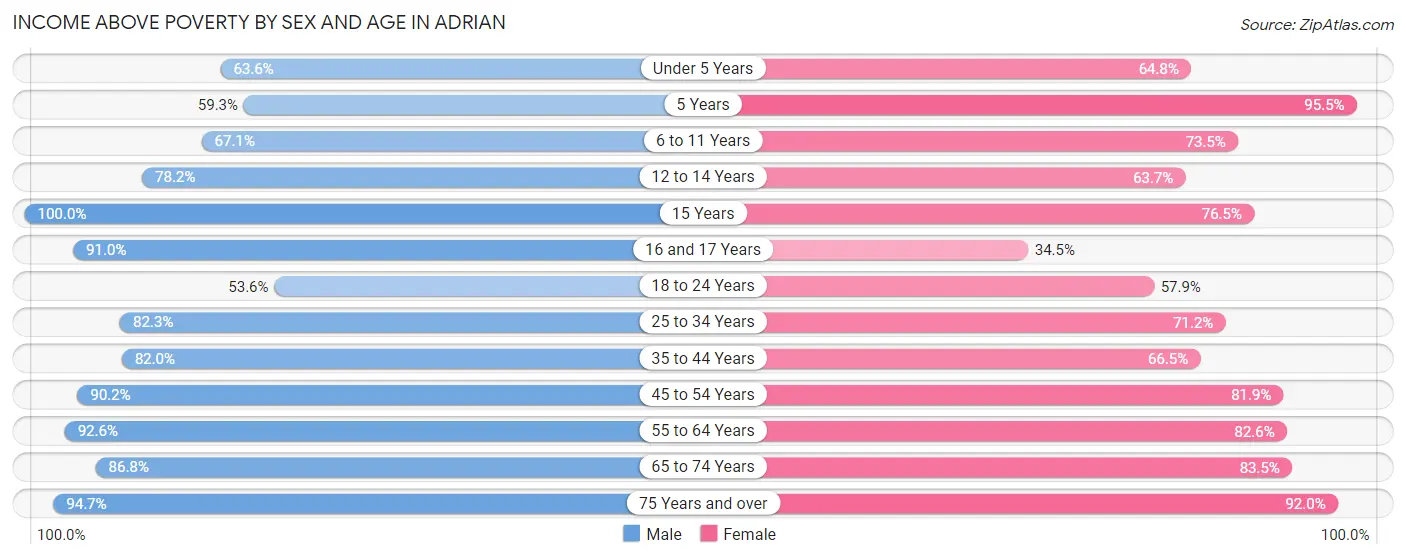
| Age Bracket | Male | Female |
| Under 5 Years | 329 (63.6%) | 373 (64.8%) |
| 5 Years | 102 (59.3%) | 85 (95.5%) |
| 6 to 11 Years | 427 (67.1%) | 496 (73.5%) |
| 12 to 14 Years | 240 (78.2%) | 297 (63.7%) |
| 15 Years | 20 (100.0%) | 52 (76.5%) |
| 16 and 17 Years | 212 (91.0%) | 48 (34.5%) |
| 18 to 24 Years | 633 (53.6%) | 572 (57.9%) |
| 25 to 34 Years | 1,068 (82.3%) | 861 (71.2%) |
| 35 to 44 Years | 882 (82.0%) | 659 (66.5%) |
| 45 to 54 Years | 1,050 (90.2%) | 816 (81.9%) |
| 55 to 64 Years | 758 (92.5%) | 1,050 (82.6%) |
| 65 to 74 Years | 724 (86.8%) | 946 (83.5%) |
| 75 Years and over | 460 (94.7%) | 794 (92.0%) |
| Total | 6,905 (79.0%) | 7,049 (74.5%) |
Income Below Poverty Among Married-Couple Families in Adrian
The poverty statistics for married-couple families in Adrian show that 13.8% or 349 of the total 2,522 families live below the poverty line. Families with 5 or more children have the highest poverty rate of 31.2%, comprising of 10 families. On the other hand, families with no children have the lowest poverty rate of 7.4%, which includes 115 families.
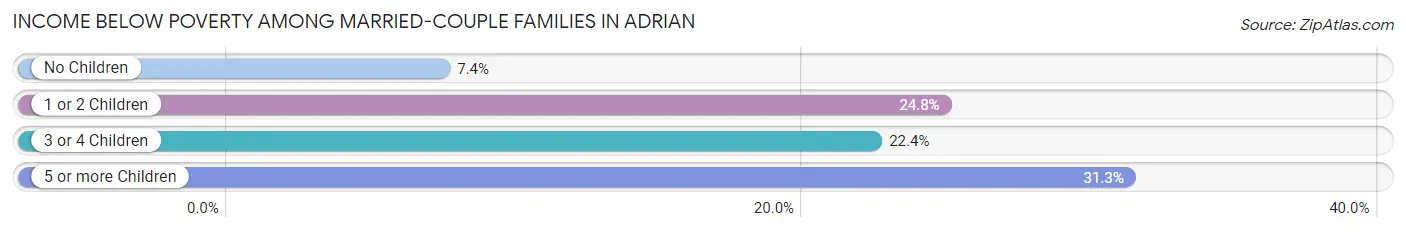
| Children | Above Poverty | Below Poverty |
| No Children | 1,442 (92.6%) | 115 (7.4%) |
| 1 or 2 Children | 460 (75.2%) | 152 (24.8%) |
| 3 or 4 Children | 249 (77.6%) | 72 (22.4%) |
| 5 or more Children | 22 (68.8%) | 10 (31.2%) |
| Total | 2,173 (86.2%) | 349 (13.8%) |
Income Below Poverty Among Single-Parent Households in Adrian
According to the poverty data in Adrian, 15.6% or 113 single-father households and 32.1% or 347 single-mother households are living below the poverty line. Among single-father households, those with 1 or 2 children have the highest poverty rate, with 113 households (28.5%) experiencing poverty. Likewise, among single-mother households, those with 5 or more children have the highest poverty rate, with 57 households (100.0%) falling below the poverty line.
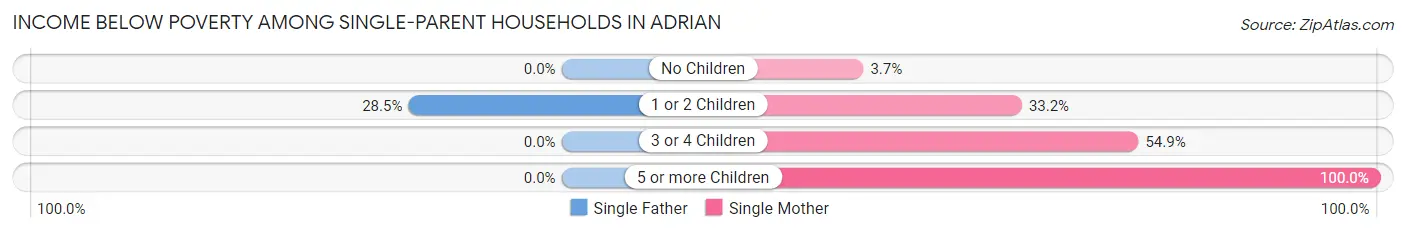
| Children | Single Father | Single Mother |
| No Children | 0 (0.0%) | 11 (3.7%) |
| 1 or 2 Children | 113 (28.5%) | 184 (33.2%) |
| 3 or 4 Children | 0 (0.0%) | 95 (54.9%) |
| 5 or more Children | 0 (0.0%) | 57 (100.0%) |
| Total | 113 (15.6%) | 347 (32.1%) |
Income Below Poverty Among Married-Couple vs Single-Parent Households in Adrian
The poverty data for Adrian shows that 349 of the married-couple family households (13.8%) and 460 of the single-parent households (25.4%) are living below the poverty level. Within the married-couple family households, those with 5 or more children have the highest poverty rate, with 10 households (31.2%) falling below the poverty line. Among the single-parent households, those with 5 or more children have the highest poverty rate, with 57 household (100.0%) living below poverty.
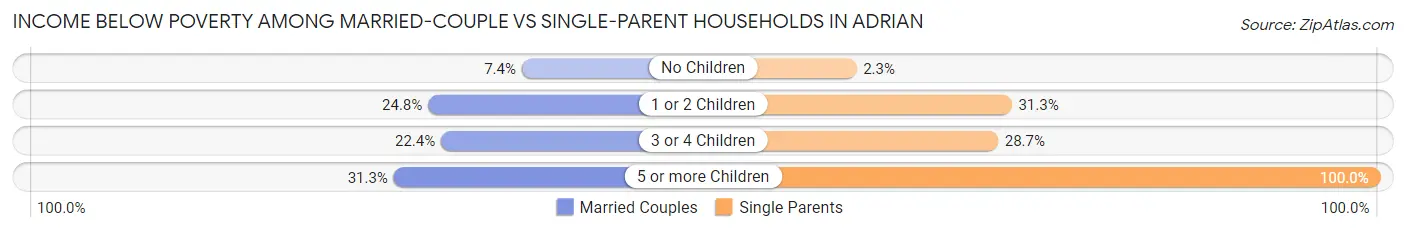
| Children | Married-Couple Families | Single-Parent Households |
| No Children | 115 (7.4%) | 11 (2.3%) |
| 1 or 2 Children | 152 (24.8%) | 297 (31.3%) |
| 3 or 4 Children | 72 (22.4%) | 95 (28.7%) |
| 5 or more Children | 10 (31.2%) | 57 (100.0%) |
| Total | 349 (13.8%) | 460 (25.4%) |
Race in Adrian
The most populous races in Adrian are White / Caucasian (17,425 | 84.6%), Hispanic or Latino (4,464 | 21.7%), and Two or more Races (1,722 | 8.4%).
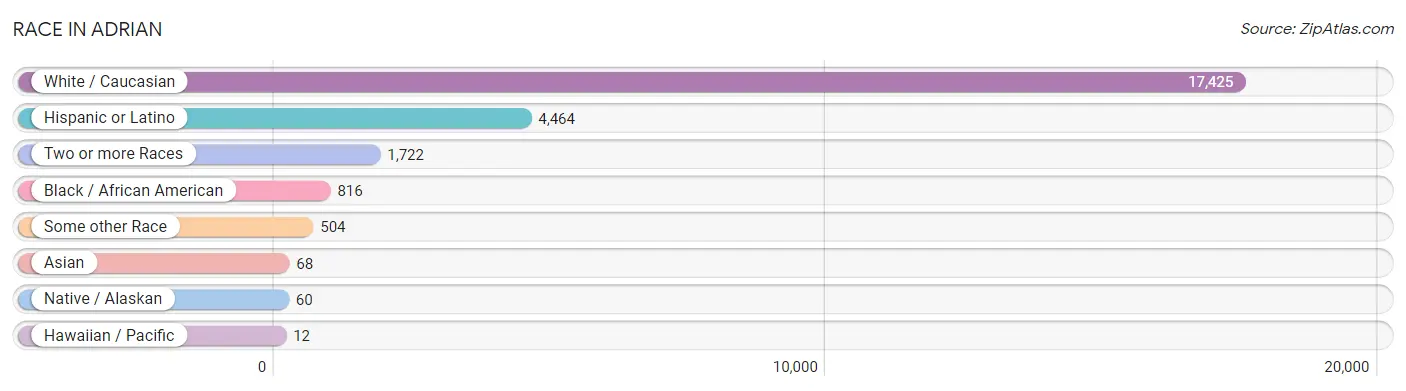
| Race | # Population | % Population |
| Asian | 68 | 0.3% |
| Black / African American | 816 | 4.0% |
| Hawaiian / Pacific | 12 | 0.1% |
| Hispanic or Latino | 4,464 | 21.7% |
| Native / Alaskan | 60 | 0.3% |
| White / Caucasian | 17,425 | 84.6% |
| Two or more Races | 1,722 | 8.4% |
| Some other Race | 504 | 2.5% |
| Total | 20,607 | 100.0% |
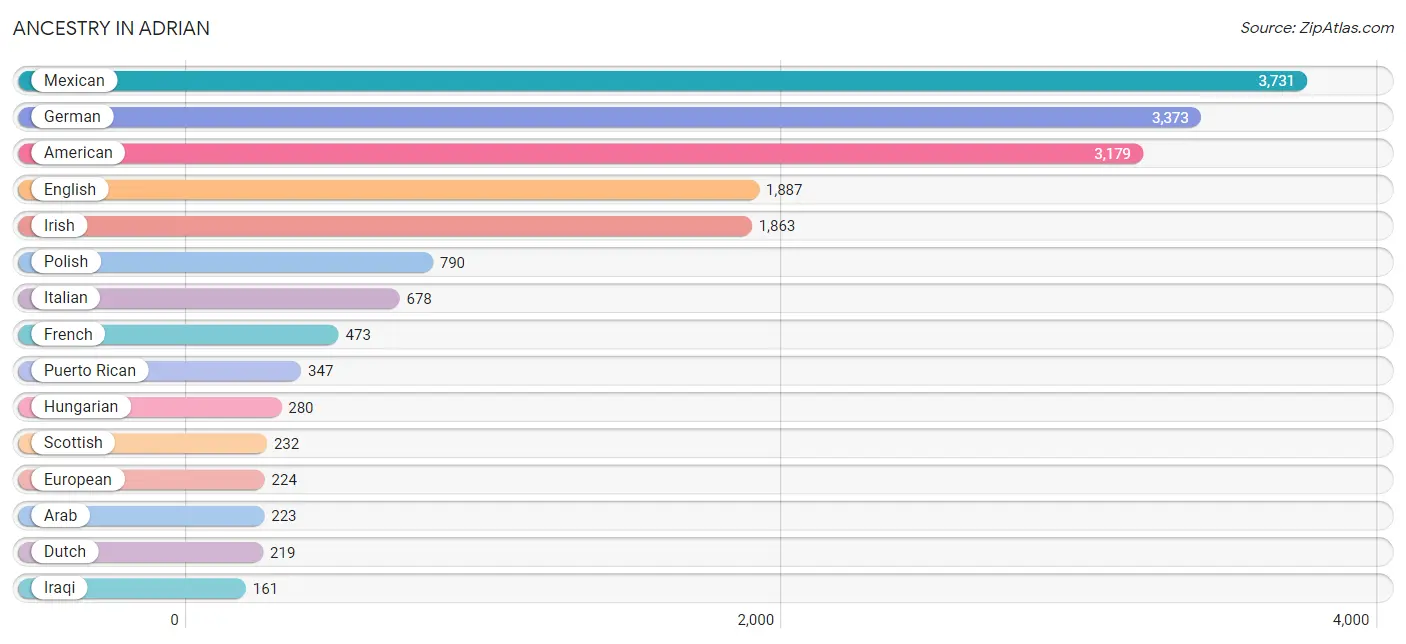
Ancestry in Adrian
The most populous ancestries reported in Adrian are Mexican (3,731 | 18.1%), German (3,373 | 16.4%), American (3,179 | 15.4%), English (1,887 | 9.2%), and Irish (1,863 | 9.0%), together accounting for 68.1% of all Adrian residents.
| Ancestry | # Population | % Population |
| African | 1 | 0.0% |
| American | 3,179 | 15.4% |
| Arab | 223 | 1.1% |
| Argentinean | 26 | 0.1% |
| Armenian | 10 | 0.1% |
| Australian | 19 | 0.1% |
| Austrian | 10 | 0.1% |
| Belgian | 70 | 0.3% |
| Bhutanese | 20 | 0.1% |
| Blackfeet | 28 | 0.1% |
| British | 51 | 0.3% |
| Canadian | 97 | 0.5% |
| Central American | 22 | 0.1% |
| Cherokee | 65 | 0.3% |
| Chippewa | 11 | 0.1% |
| Choctaw | 16 | 0.1% |
| Colombian | 14 | 0.1% |
| Croatian | 5 | 0.0% |
| Cuban | 29 | 0.1% |
| Czech | 20 | 0.1% |
| Danish | 13 | 0.1% |
| Dominican | 31 | 0.2% |
| Dutch | 219 | 1.1% |
| Eastern European | 29 | 0.1% |
| Ecuadorian | 37 | 0.2% |
| English | 1,887 | 9.2% |
| European | 224 | 1.1% |
| Finnish | 55 | 0.3% |
| French | 473 | 2.3% |
| French American Indian | 9 | 0.0% |
| French Canadian | 133 | 0.6% |
| German | 3,373 | 16.4% |
| Greek | 21 | 0.1% |
| Guatemalan | 13 | 0.1% |
| Hungarian | 280 | 1.4% |
| Indian (Asian) | 78 | 0.4% |
| Iraqi | 161 | 0.8% |
| Irish | 1,863 | 9.0% |
| Italian | 678 | 3.3% |
| Korean | 52 | 0.3% |
| Laotian | 30 | 0.2% |
| Lebanese | 34 | 0.2% |
| Lithuanian | 5 | 0.0% |
| Macedonian | 6 | 0.0% |
| Mexican | 3,731 | 18.1% |
| Mexican American Indian | 9 | 0.0% |
| Native Hawaiian | 19 | 0.1% |
| Northern European | 47 | 0.2% |
| Norwegian | 56 | 0.3% |
| Pennsylvania German | 11 | 0.1% |
| Peruvian | 57 | 0.3% |
| Polish | 790 | 3.8% |
| Portuguese | 14 | 0.1% |
| Puerto Rican | 347 | 1.7% |
| Romanian | 88 | 0.4% |
| Russian | 38 | 0.2% |
| Salvadoran | 9 | 0.0% |
| Scandinavian | 9 | 0.0% |
| Scotch-Irish | 96 | 0.5% |
| Scottish | 232 | 1.1% |
| Serbian | 25 | 0.1% |
| Slovene | 5 | 0.0% |
| South American | 134 | 0.6% |
| Spaniard | 89 | 0.4% |
| Spanish | 10 | 0.1% |
| Subsaharan African | 10 | 0.1% |
| Swedish | 41 | 0.2% |
| Swiss | 66 | 0.3% |
| Thai | 4 | 0.0% |
| Ukrainian | 9 | 0.0% |
| Welsh | 83 | 0.4% |
| West Indian | 6 | 0.0% |
| Yugoslavian | 5 | 0.0% | View All 73 Rows |
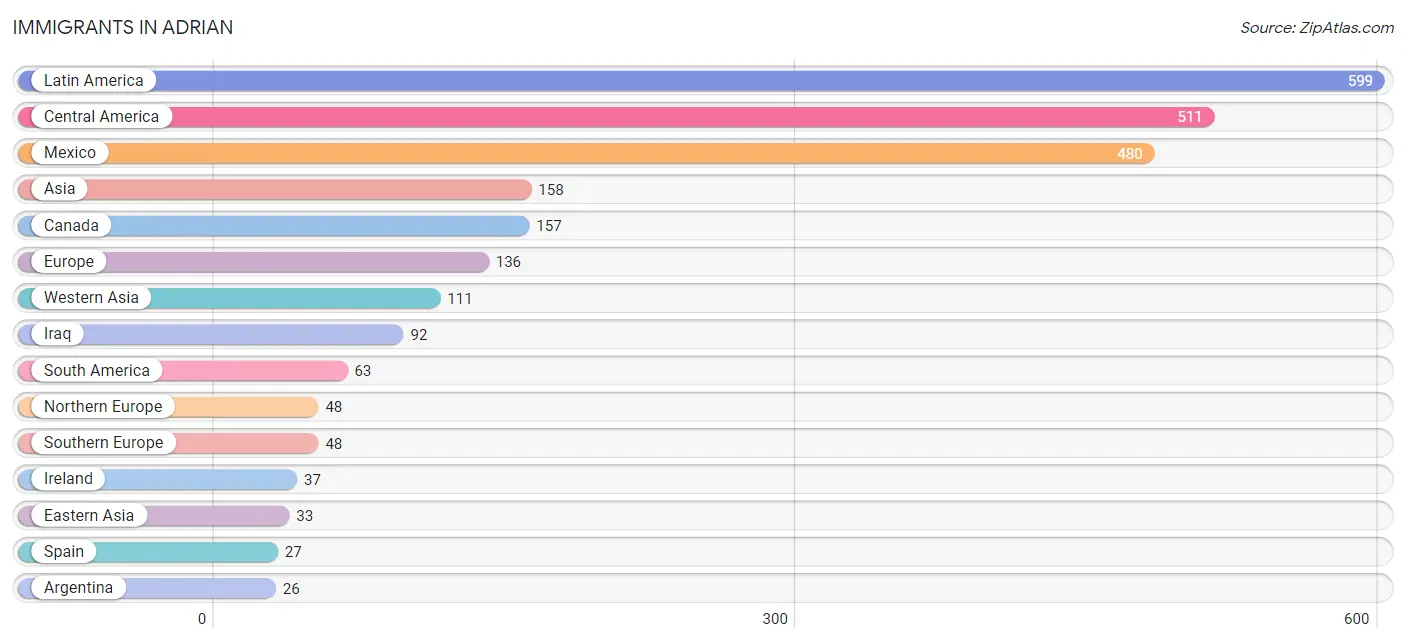
Immigrants in Adrian
The most numerous immigrant groups reported in Adrian came from Latin America (599 | 2.9%), Central America (511 | 2.5%), Mexico (480 | 2.3%), Asia (158 | 0.8%), and Canada (157 | 0.8%), together accounting for 9.2% of all Adrian residents.
| Immigration Origin | # Population | % Population |
| Argentina | 26 | 0.1% |
| Asia | 158 | 0.8% |
| Barbados | 6 | 0.0% |
| Canada | 157 | 0.8% |
| Caribbean | 25 | 0.1% |
| Central America | 511 | 2.5% |
| China | 26 | 0.1% |
| Colombia | 12 | 0.1% |
| Czechoslovakia | 2 | 0.0% |
| Dominican Republic | 19 | 0.1% |
| Eastern Asia | 33 | 0.2% |
| Eastern Europe | 22 | 0.1% |
| El Salvador | 18 | 0.1% |
| Europe | 136 | 0.7% |
| Germany | 18 | 0.1% |
| Greece | 21 | 0.1% |
| Guatemala | 13 | 0.1% |
| India | 4 | 0.0% |
| Iraq | 92 | 0.4% |
| Ireland | 37 | 0.2% |
| Japan | 7 | 0.0% |
| Jordan | 9 | 0.0% |
| Latin America | 599 | 2.9% |
| Mexico | 480 | 2.3% |
| Northern Europe | 48 | 0.2% |
| Peru | 25 | 0.1% |
| Philippines | 10 | 0.1% |
| Poland | 8 | 0.0% |
| Serbia | 6 | 0.0% |
| South America | 63 | 0.3% |
| South Central Asia | 4 | 0.0% |
| South Eastern Asia | 10 | 0.1% |
| Southern Europe | 48 | 0.2% |
| Spain | 27 | 0.1% |
| Sweden | 2 | 0.0% |
| Syria | 10 | 0.1% |
| Western Asia | 111 | 0.5% |
| Western Europe | 18 | 0.1% | View All 38 Rows |
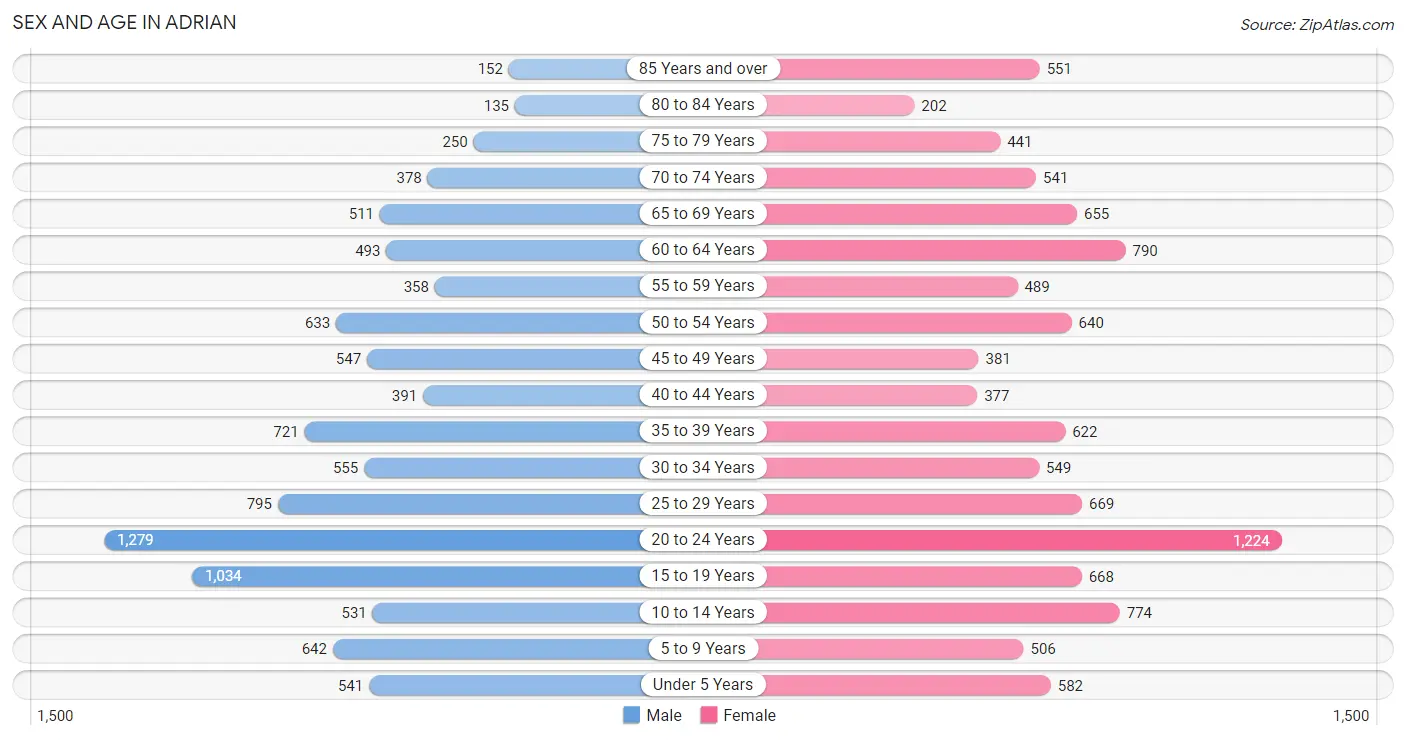
Sex and Age in Adrian
Sex and Age in Adrian
The most populous age groups in Adrian are 20 to 24 Years (1,279 | 12.9%) for men and 20 to 24 Years (1,224 | 11.5%) for women.
| Age Bracket | Male | Female |
| Under 5 Years | 541 (5.4%) | 582 (5.5%) |
| 5 to 9 Years | 642 (6.5%) | 506 (4.8%) |
| 10 to 14 Years | 531 (5.3%) | 774 (7.3%) |
| 15 to 19 Years | 1,034 (10.4%) | 668 (6.3%) |
| 20 to 24 Years | 1,279 (12.9%) | 1,224 (11.5%) |
| 25 to 29 Years | 795 (8.0%) | 669 (6.3%) |
| 30 to 34 Years | 555 (5.6%) | 549 (5.1%) |
| 35 to 39 Years | 721 (7.2%) | 622 (5.8%) |
| 40 to 44 Years | 391 (3.9%) | 377 (3.5%) |
| 45 to 49 Years | 547 (5.5%) | 381 (3.6%) |
| 50 to 54 Years | 633 (6.4%) | 640 (6.0%) |
| 55 to 59 Years | 358 (3.6%) | 489 (4.6%) |
| 60 to 64 Years | 493 (5.0%) | 790 (7.4%) |
| 65 to 69 Years | 511 (5.1%) | 655 (6.1%) |
| 70 to 74 Years | 378 (3.8%) | 541 (5.1%) |
| 75 to 79 Years | 250 (2.5%) | 441 (4.1%) |
| 80 to 84 Years | 135 (1.4%) | 202 (1.9%) |
| 85 Years and over | 152 (1.5%) | 551 (5.2%) |
| Total | 9,946 (100.0%) | 10,661 (100.0%) |
Families and Households in Adrian
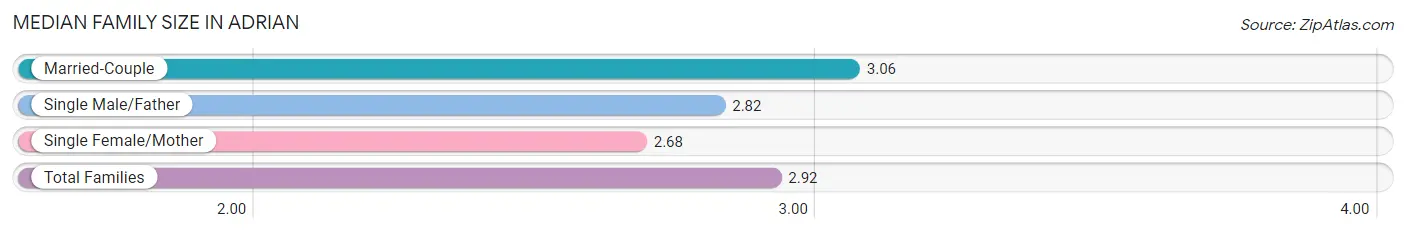
Median Family Size in Adrian
The median family size in Adrian is 2.92 persons per family, with married-couple families (2,522 | 58.2%) accounting for the largest median family size of 3.06 persons per family. On the other hand, single female/mother families (1,082 | 25.0%) represent the smallest median family size with 2.68 persons per family.
| Family Type | # Families | Family Size |
| Married-Couple | 2,522 (58.2%) | 3.06 |
| Single Male/Father | 726 (16.8%) | 2.82 |
| Single Female/Mother | 1,082 (25.0%) | 2.68 |
| Total Families | 4,330 (100.0%) | 2.92 |
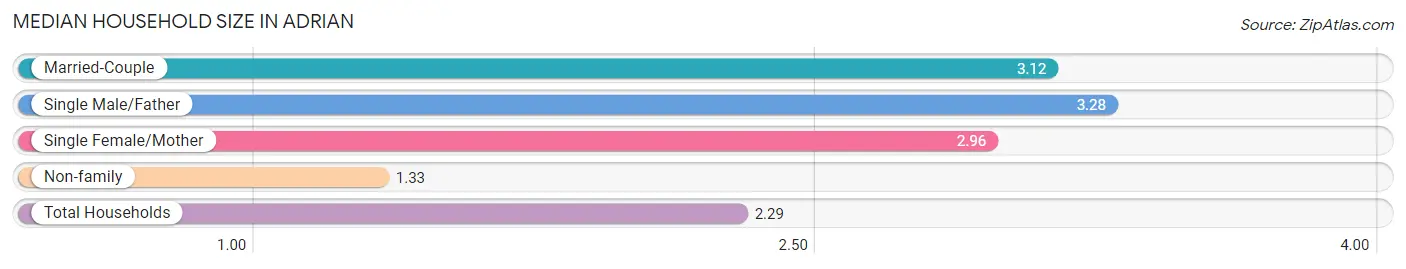
Median Household Size in Adrian
The median household size in Adrian is 2.29 persons per household, with single male/father households (726 | 9.1%) accounting for the largest median household size of 3.28 persons per household. non-family households (3,630 | 45.6%) represent the smallest median household size with 1.33 persons per household.
| Household Type | # Households | Household Size |
| Married-Couple | 2,522 (31.7%) | 3.12 |
| Single Male/Father | 726 (9.1%) | 3.28 |
| Single Female/Mother | 1,082 (13.6%) | 2.96 |
| Non-family | 3,630 (45.6%) | 1.33 |
| Total Households | 7,960 (100.0%) | 2.29 |
Household Size by Marriage Status in Adrian
Out of a total of 7,960 households in Adrian, 4,330 (54.4%) are family households, while 3,630 (45.6%) are nonfamily households. The most numerous type of family households are 2-person households, comprising 2,063, and the most common type of nonfamily households are 1-person households, comprising 2,954.
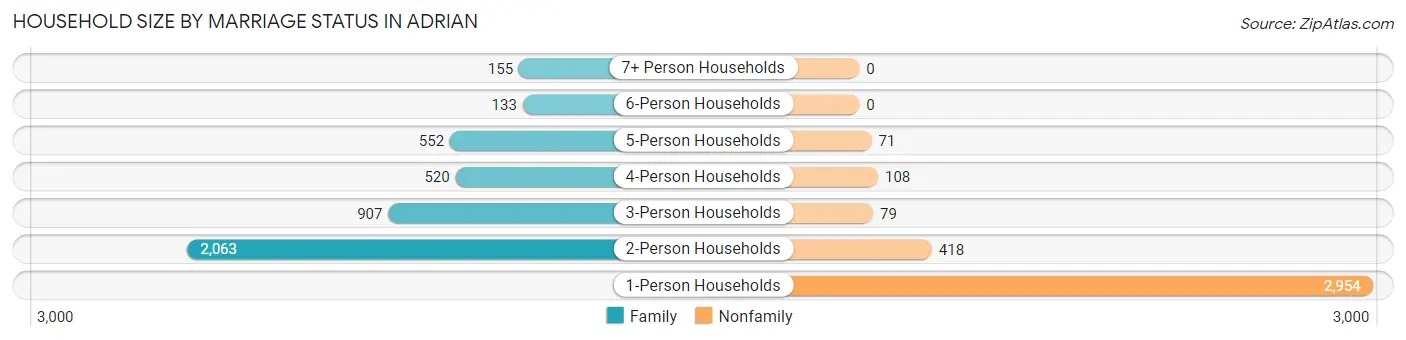
| Household Size | Family Households | Nonfamily Households |
| 1-Person Households | - | 2,954 (37.1%) |
| 2-Person Households | 2,063 (25.9%) | 418 (5.2%) |
| 3-Person Households | 907 (11.4%) | 79 (1.0%) |
| 4-Person Households | 520 (6.5%) | 108 (1.4%) |
| 5-Person Households | 552 (6.9%) | 71 (0.9%) |
| 6-Person Households | 133 (1.7%) | 0 (0.0%) |
| 7+ Person Households | 155 (1.9%) | 0 (0.0%) |
| Total | 4,330 (54.4%) | 3,630 (45.6%) |
Female Fertility in Adrian
Fertility by Age in Adrian
Average fertility rate in Adrian is 65.0 births per 1,000 women. Women in the age bracket of 20 to 34 years have the highest fertility rate with 108.0 births per 1,000 women. Women in the age bracket of 20 to 34 years acount for 89.5% of all women with births.
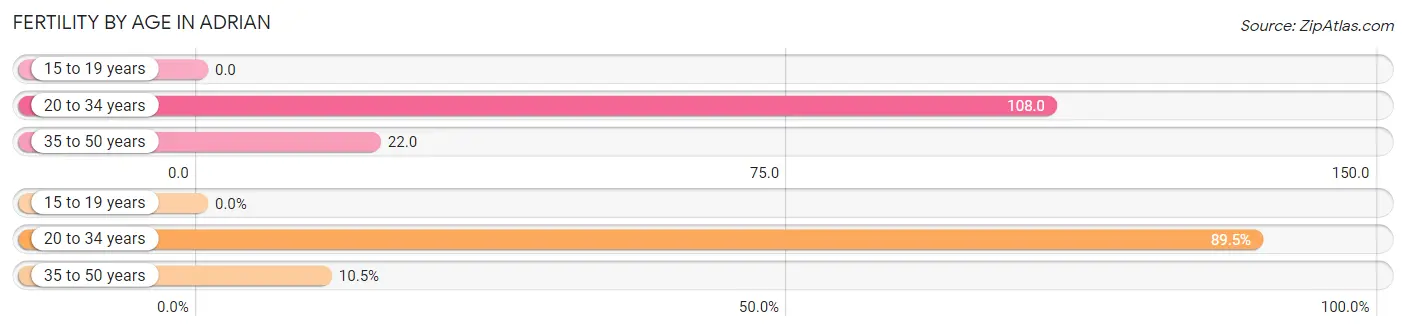
| Age Bracket | Women with Births | Births / 1,000 Women |
| 15 to 19 years | 0 (0.0%) | 0.0 |
| 20 to 34 years | 264 (89.5%) | 108.0 |
| 35 to 50 years | 31 (10.5%) | 22.0 |
| Total | 295 (100.0%) | 65.0 |
Fertility by Age by Marriage Status in Adrian
34.2% of women with births (295) in Adrian are married. The highest percentage of unmarried women with births falls into 20 to 34 years age bracket with 73.5% of them unmarried at the time of birth, while the lowest percentage of unmarried women with births belong to 35 to 50 years age bracket with 0.0% of them unmarried.
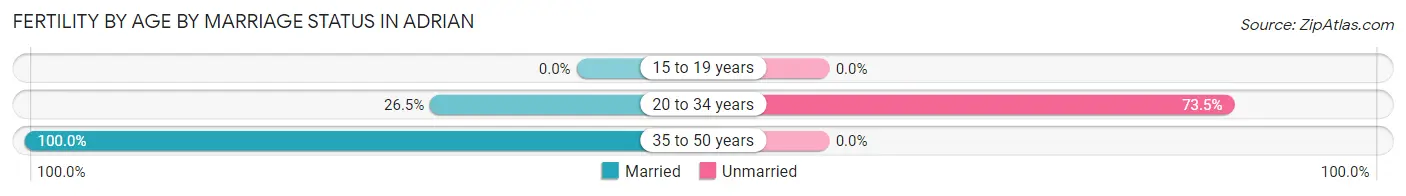
| Age Bracket | Married | Unmarried |
| 15 to 19 years | 0 (0.0%) | 0 (0.0%) |
| 20 to 34 years | 70 (26.5%) | 194 (73.5%) |
| 35 to 50 years | 31 (100.0%) | 0 (0.0%) |
| Total | 101 (34.2%) | 194 (65.8%) |
Fertility by Education in Adrian
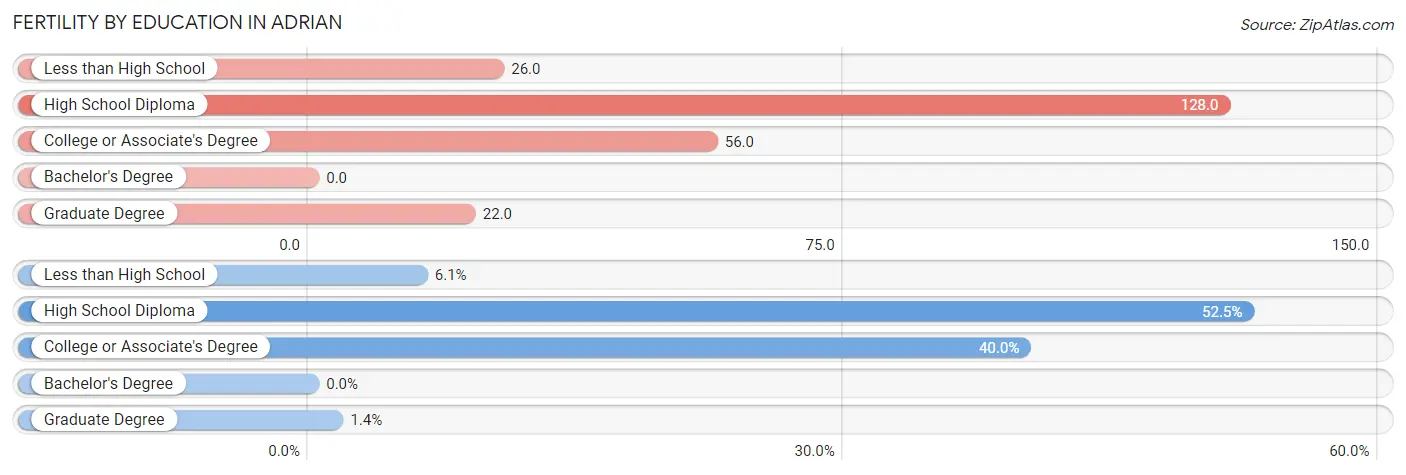
| Educational Attainment | Women with Births | Births / 1,000 Women |
| Less than High School | 18 (6.1%) | 26.0 |
| High School Diploma | 155 (52.5%) | 128.0 |
| College or Associate's Degree | 118 (40.0%) | 56.0 |
| Bachelor's Degree | 0 (0.0%) | 0.0 |
| Graduate Degree | 4 (1.4%) | 22.0 |
| Total | 295 (100.0%) | 65.0 |
Fertility by Education by Marriage Status in Adrian
65.8% of women with births in Adrian are unmarried. Women with the educational attainment of less than high school are most likely to be married with 100.0% of them married at childbirth, while women with the educational attainment of college or associate's degree are least likely to be married with 94.1% of them unmarried at childbirth.
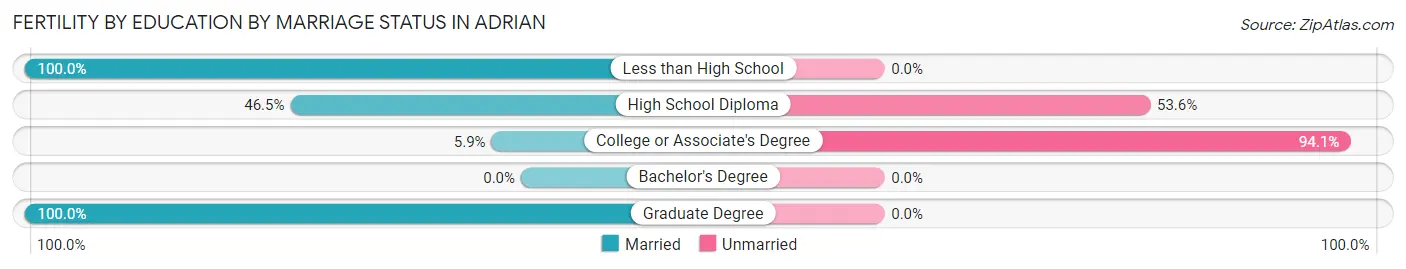
| Educational Attainment | Married | Unmarried |
| Less than High School | 18 (100.0%) | 0 (0.0%) |
| High School Diploma | 72 (46.5%) | 83 (53.5%) |
| College or Associate's Degree | 7 (5.9%) | 111 (94.1%) |
| Bachelor's Degree | 0 (0.0%) | 0 (0.0%) |
| Graduate Degree | 4 (100.0%) | 0 (0.0%) |
| Total | 101 (34.2%) | 194 (65.8%) |
Employment Characteristics in Adrian
Employment by Class of Employer in Adrian
Among the 8,322 employed individuals in Adrian, private company employees (5,717 | 68.7%), not-for-profit organizations (1,132 | 13.6%), and self-employed (not incorporated) (572 | 6.9%) make up the most common classes of employment.
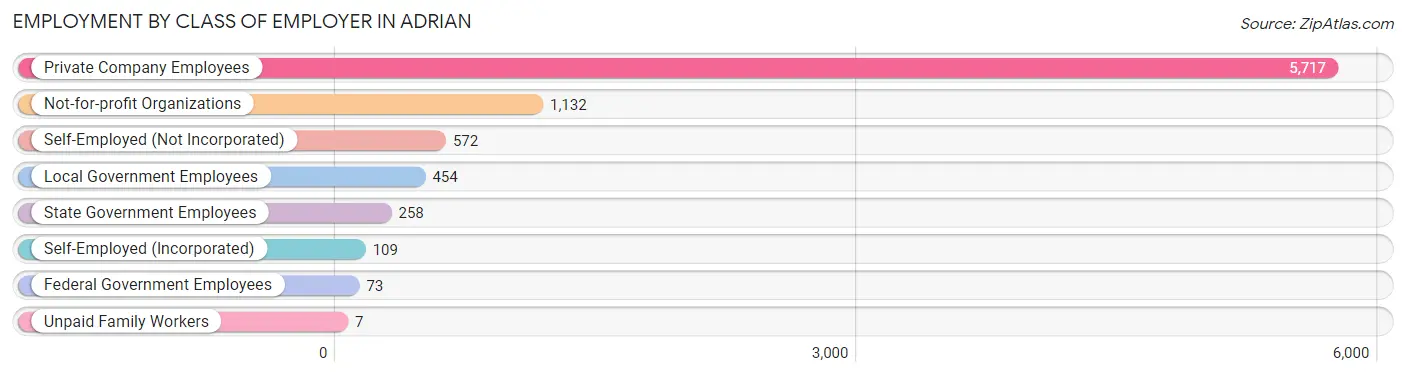
| Employer Class | # Employees | % Employees |
| Private Company Employees | 5,717 | 68.7% |
| Self-Employed (Incorporated) | 109 | 1.3% |
| Self-Employed (Not Incorporated) | 572 | 6.9% |
| Not-for-profit Organizations | 1,132 | 13.6% |
| Local Government Employees | 454 | 5.5% |
| State Government Employees | 258 | 3.1% |
| Federal Government Employees | 73 | 0.9% |
| Unpaid Family Workers | 7 | 0.1% |
| Total | 8,322 | 100.0% |
Employment Status by Age in Adrian
According to the labor force statistics for Adrian, out of the total population over 16 years of age (16,943), 52.4% or 8,878 individuals are in the labor force, with 4.8% or 426 of them unemployed. The age group with the highest labor force participation rate is 25 to 29 years, with 84.5% or 1,237 individuals in the labor force. Within the labor force, the 30 to 34 years age range has the highest percentage of unemployed individuals, with 14.1% or 122 of them being unemployed.
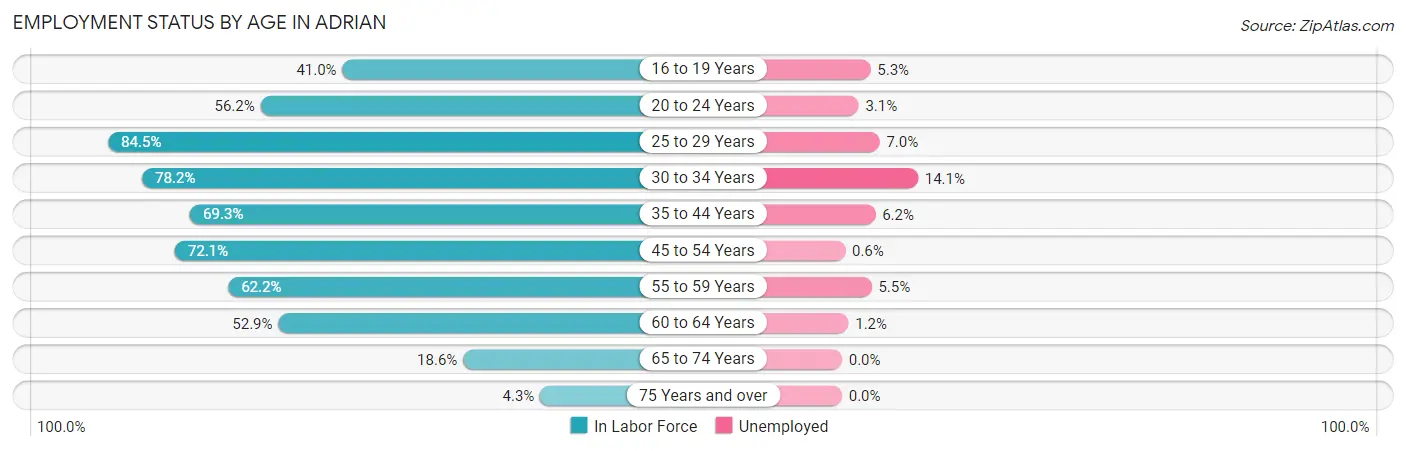
| Age Bracket | In Labor Force | Unemployed |
| 16 to 19 Years | 662 (41.0%) | 35 (5.3%) |
| 20 to 24 Years | 1,407 (56.2%) | 44 (3.1%) |
| 25 to 29 Years | 1,237 (84.5%) | 87 (7.0%) |
| 30 to 34 Years | 863 (78.2%) | 122 (14.1%) |
| 35 to 44 Years | 1,463 (69.3%) | 91 (6.2%) |
| 45 to 54 Years | 1,587 (72.1%) | 10 (0.6%) |
| 55 to 59 Years | 527 (62.2%) | 29 (5.5%) |
| 60 to 64 Years | 679 (52.9%) | 8 (1.2%) |
| 65 to 74 Years | 388 (18.6%) | 0 (0.0%) |
| 75 Years and over | 74 (4.3%) | 0 (0.0%) |
| Total | 8,878 (52.4%) | 426 (4.8%) |
Employment Status by Educational Attainment in Adrian
According to labor force statistics for Adrian, 70.5% of individuals (6,352) out of the total population between 25 and 64 years of age (9,010) are in the labor force, with 5.4% or 343 of them being unemployed. The group with the highest labor force participation rate are those with the educational attainment of bachelor's degree or higher, with 87.1% or 1,199 individuals in the labor force. Within the labor force, individuals with less than high school education have the highest percentage of unemployment, with 18.2% or 82 of them being unemployed.
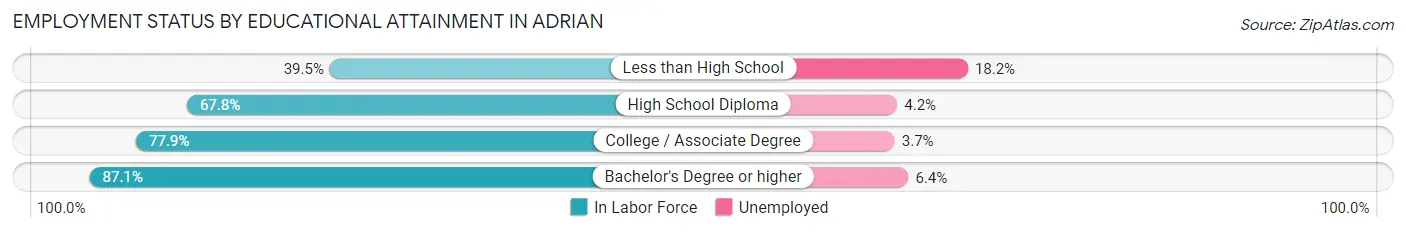
| Educational Attainment | In Labor Force | Unemployed |
| Less than High School | 450 (39.5%) | 207 (18.2%) |
| High School Diploma | 2,353 (67.8%) | 146 (4.2%) |
| College / Associate Degree | 2,354 (77.9%) | 112 (3.7%) |
| Bachelor's Degree or higher | 1,199 (87.1%) | 88 (6.4%) |
| Total | 6,352 (70.5%) | 487 (5.4%) |
Employment Occupations by Sex in Adrian
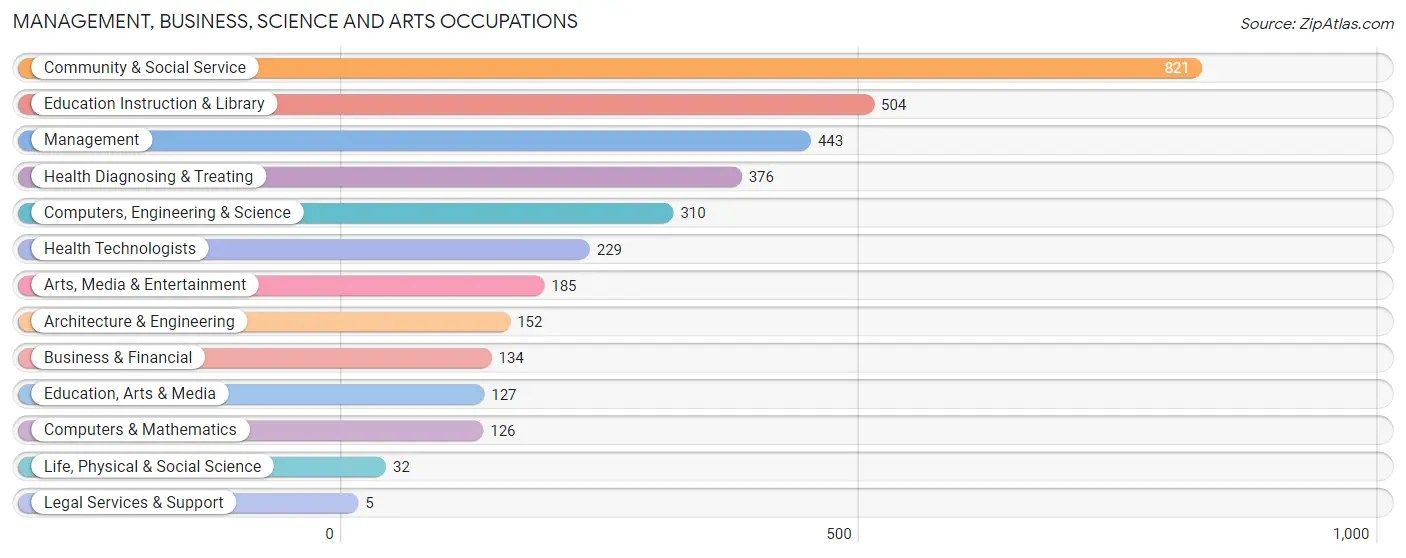
Management, Business, Science and Arts Occupations
The most common Management, Business, Science and Arts occupations in Adrian are Community & Social Service (821 | 9.7%), Education Instruction & Library (504 | 6.0%), Management (443 | 5.2%), Health Diagnosing & Treating (376 | 4.5%), and Computers, Engineering & Science (310 | 3.7%).
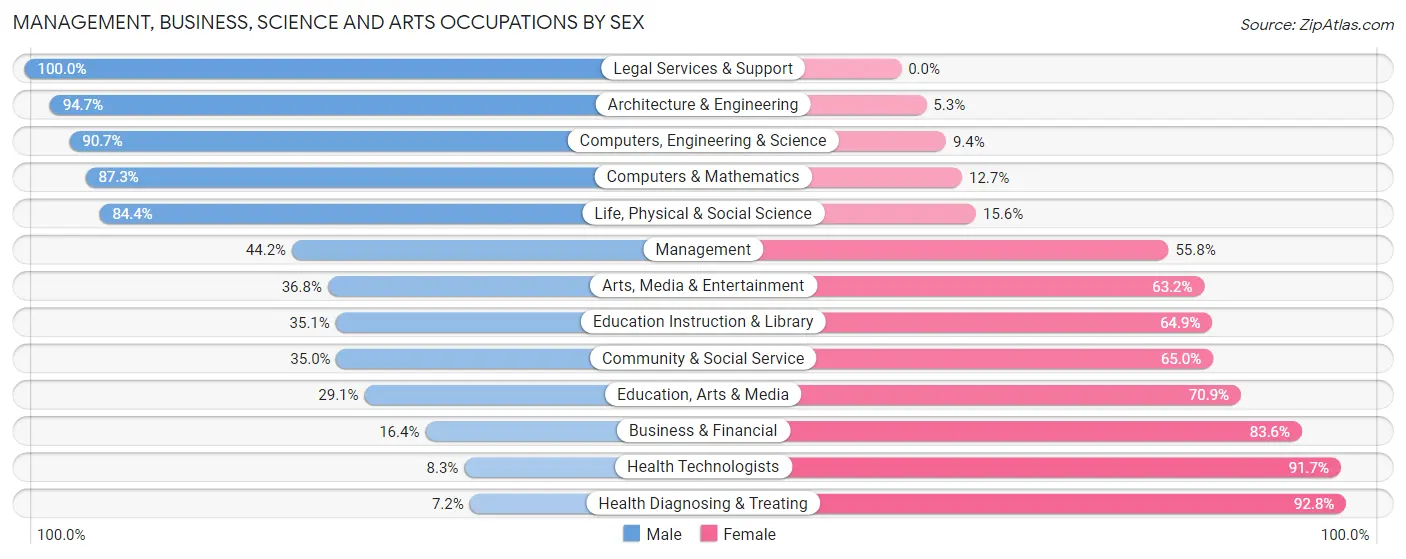
Management, Business, Science and Arts Occupations by Sex
Within the Management, Business, Science and Arts occupations in Adrian, the most male-oriented occupations are Legal Services & Support (100.0%), Architecture & Engineering (94.7%), and Computers, Engineering & Science (90.6%), while the most female-oriented occupations are Health Diagnosing & Treating (92.8%), Health Technologists (91.7%), and Business & Financial (83.6%).
| Occupation | Male | Female |
| Management | 196 (44.2%) | 247 (55.8%) |
| Business & Financial | 22 (16.4%) | 112 (83.6%) |
| Computers, Engineering & Science | 281 (90.6%) | 29 (9.3%) |
| Computers & Mathematics | 110 (87.3%) | 16 (12.7%) |
| Architecture & Engineering | 144 (94.7%) | 8 (5.3%) |
| Life, Physical & Social Science | 27 (84.4%) | 5 (15.6%) |
| Community & Social Service | 287 (35.0%) | 534 (65.0%) |
| Education, Arts & Media | 37 (29.1%) | 90 (70.9%) |
| Legal Services & Support | 5 (100.0%) | 0 (0.0%) |
| Education Instruction & Library | 177 (35.1%) | 327 (64.9%) |
| Arts, Media & Entertainment | 68 (36.8%) | 117 (63.2%) |
| Health Diagnosing & Treating | 27 (7.2%) | 349 (92.8%) |
| Health Technologists | 19 (8.3%) | 210 (91.7%) |
| Total (Category) | 813 (39.0%) | 1,271 (61.0%) |
| Total (Overall) | 4,525 (53.6%) | 3,912 (46.4%) |
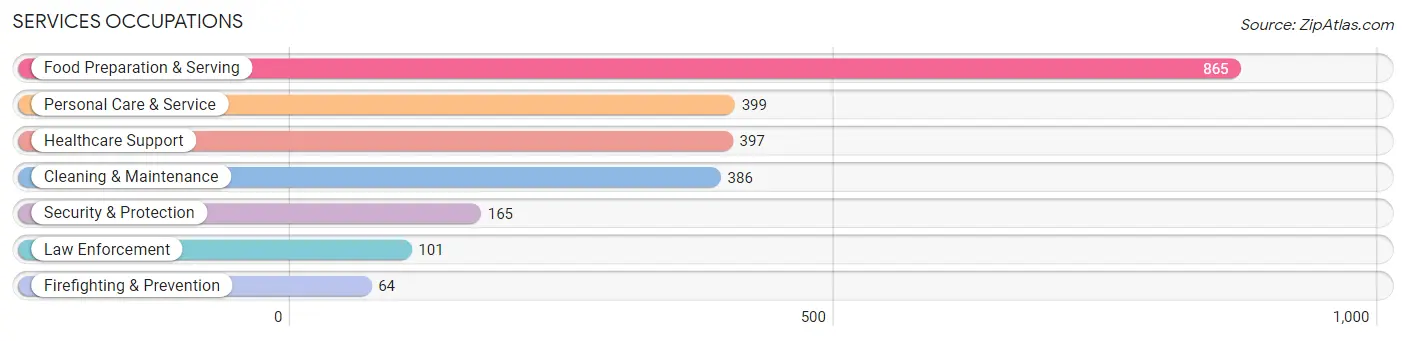
Services Occupations
The most common Services occupations in Adrian are Food Preparation & Serving (865 | 10.2%), Personal Care & Service (399 | 4.7%), Healthcare Support (397 | 4.7%), Cleaning & Maintenance (386 | 4.6%), and Security & Protection (165 | 2.0%).
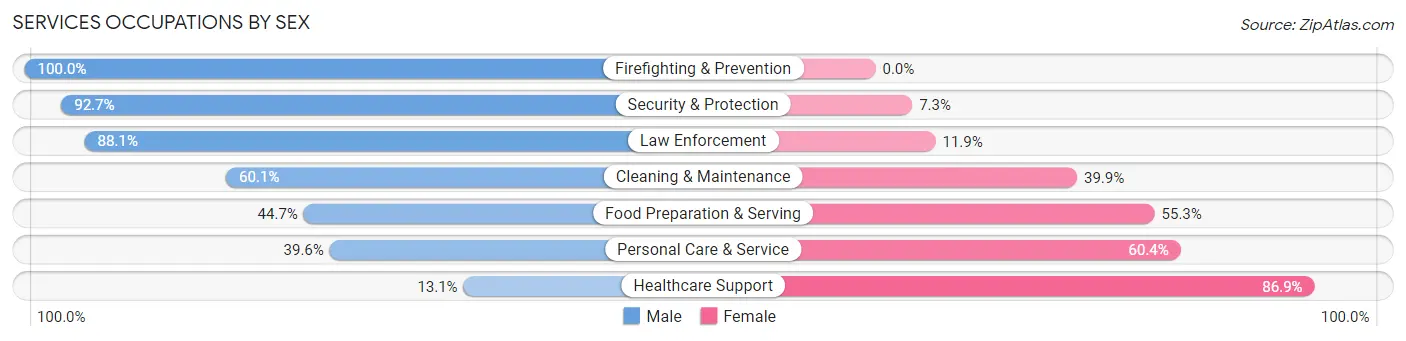
Services Occupations by Sex
Within the Services occupations in Adrian, the most male-oriented occupations are Firefighting & Prevention (100.0%), Security & Protection (92.7%), and Law Enforcement (88.1%), while the most female-oriented occupations are Healthcare Support (86.9%), Personal Care & Service (60.4%), and Food Preparation & Serving (55.3%).
| Occupation | Male | Female |
| Healthcare Support | 52 (13.1%) | 345 (86.9%) |
| Security & Protection | 153 (92.7%) | 12 (7.3%) |
| Firefighting & Prevention | 64 (100.0%) | 0 (0.0%) |
| Law Enforcement | 89 (88.1%) | 12 (11.9%) |
| Food Preparation & Serving | 387 (44.7%) | 478 (55.3%) |
| Cleaning & Maintenance | 232 (60.1%) | 154 (39.9%) |
| Personal Care & Service | 158 (39.6%) | 241 (60.4%) |
| Total (Category) | 982 (44.4%) | 1,230 (55.6%) |
| Total (Overall) | 4,525 (53.6%) | 3,912 (46.4%) |
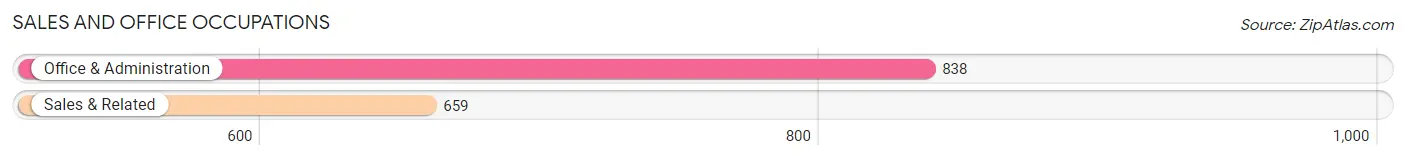
Sales and Office Occupations
The most common Sales and Office occupations in Adrian are Office & Administration (838 | 9.9%), and Sales & Related (659 | 7.8%).
Sales and Office Occupations by Sex
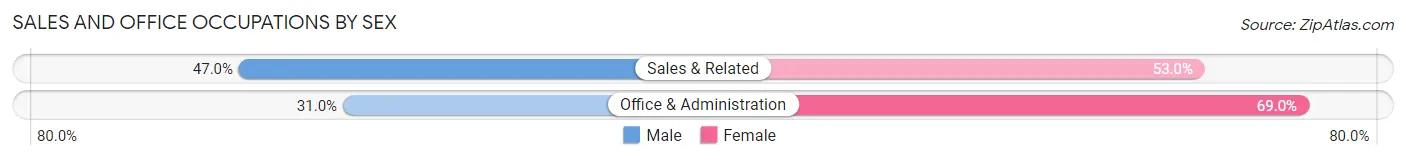
| Occupation | Male | Female |
| Sales & Related | 310 (47.0%) | 349 (53.0%) |
| Office & Administration | 260 (31.0%) | 578 (69.0%) |
| Total (Category) | 570 (38.1%) | 927 (61.9%) |
| Total (Overall) | 4,525 (53.6%) | 3,912 (46.4%) |
Natural Resources, Construction and Maintenance Occupations
The most common Natural Resources, Construction and Maintenance occupations in Adrian are Farming, Fishing & Forestry (238 | 2.8%), Construction & Extraction (233 | 2.8%), and Installation, Maintenance & Repair (155 | 1.8%).
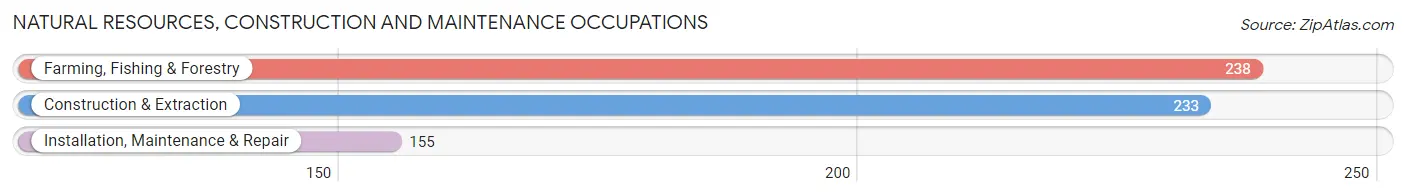
Natural Resources, Construction and Maintenance Occupations by Sex
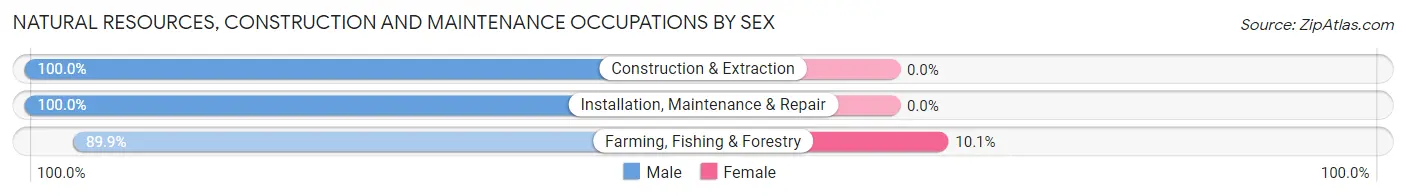
| Occupation | Male | Female |
| Farming, Fishing & Forestry | 214 (89.9%) | 24 (10.1%) |
| Construction & Extraction | 233 (100.0%) | 0 (0.0%) |
| Installation, Maintenance & Repair | 155 (100.0%) | 0 (0.0%) |
| Total (Category) | 602 (96.2%) | 24 (3.8%) |
| Total (Overall) | 4,525 (53.6%) | 3,912 (46.4%) |
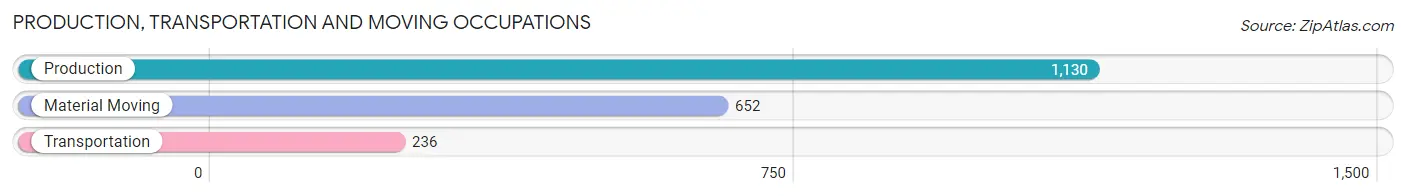
Production, Transportation and Moving Occupations
The most common Production, Transportation and Moving occupations in Adrian are Production (1,130 | 13.4%), Material Moving (652 | 7.7%), and Transportation (236 | 2.8%).
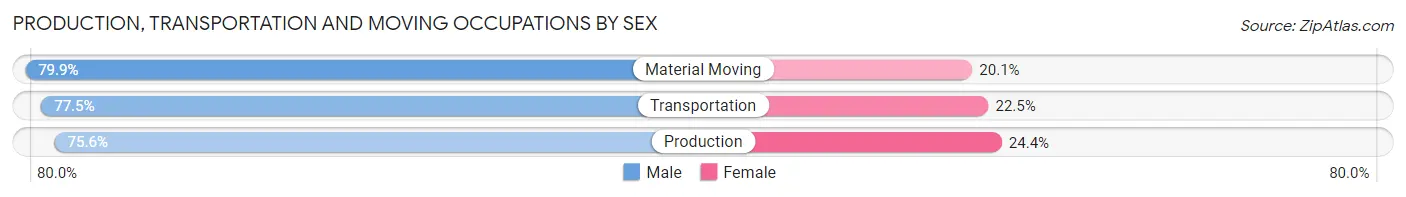
Production, Transportation and Moving Occupations by Sex
| Occupation | Male | Female |
| Production | 854 (75.6%) | 276 (24.4%) |
| Transportation | 183 (77.5%) | 53 (22.5%) |
| Material Moving | 521 (79.9%) | 131 (20.1%) |
| Total (Category) | 1,558 (77.2%) | 460 (22.8%) |
| Total (Overall) | 4,525 (53.6%) | 3,912 (46.4%) |
Employment Industries by Sex in Adrian
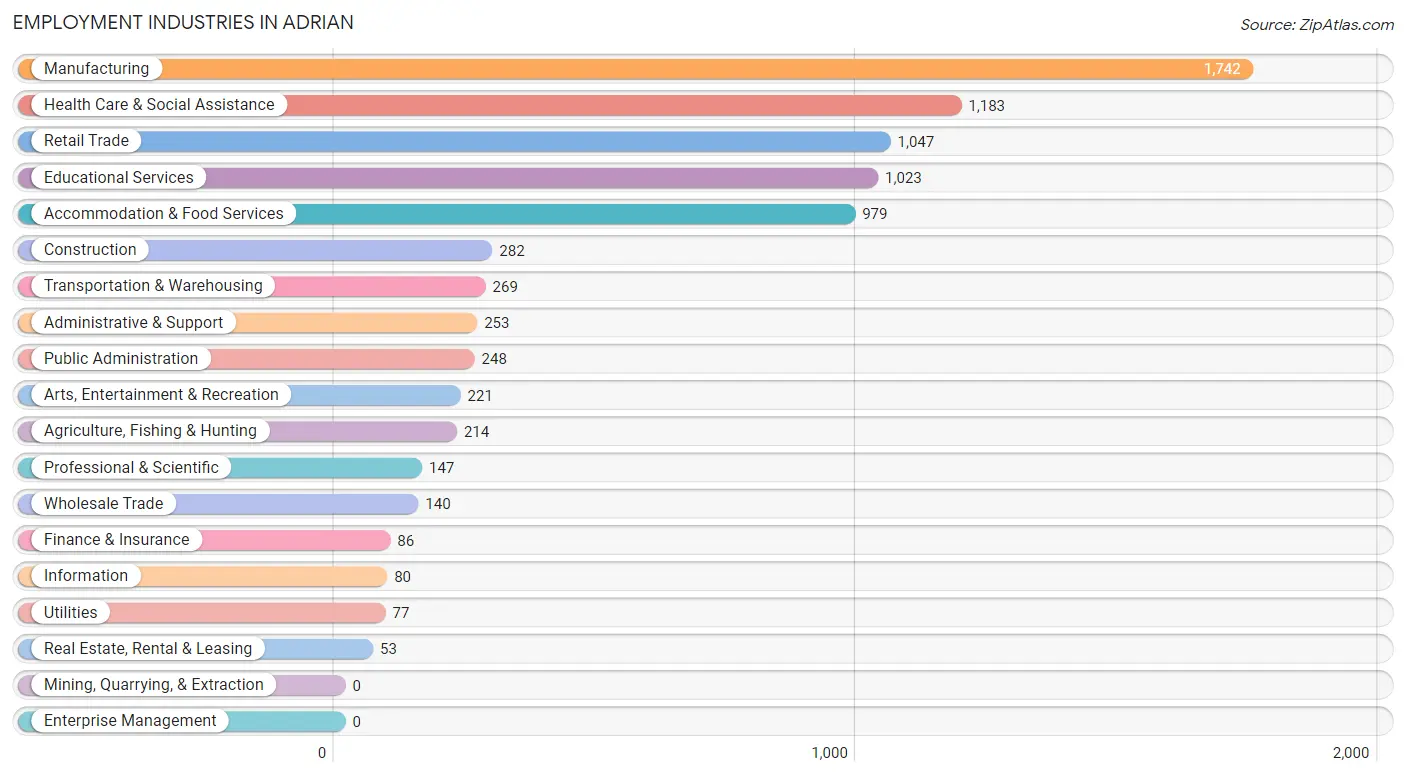
Employment Industries in Adrian
The major employment industries in Adrian include Manufacturing (1,742 | 20.6%), Health Care & Social Assistance (1,183 | 14.0%), Retail Trade (1,047 | 12.4%), Educational Services (1,023 | 12.1%), and Accommodation & Food Services (979 | 11.6%).
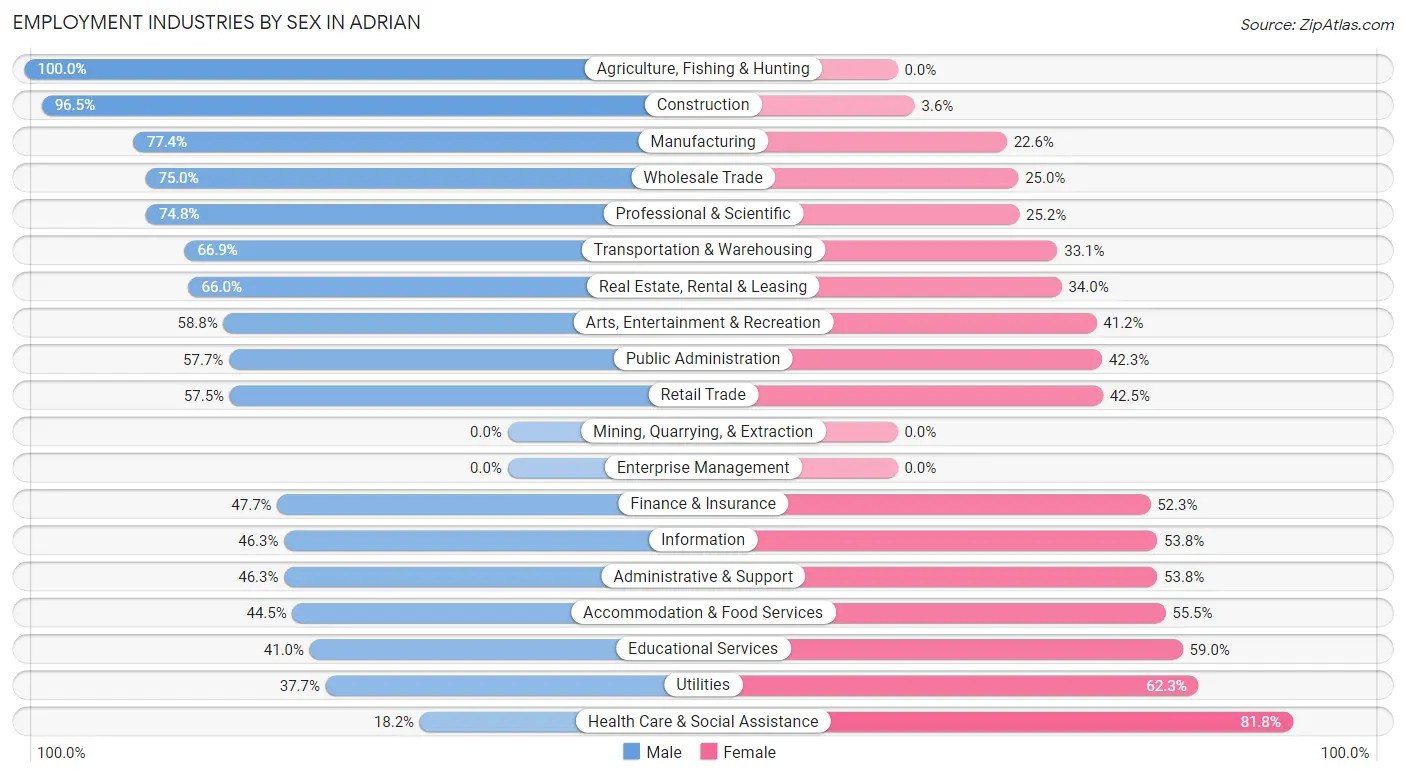
Employment Industries by Sex in Adrian
The Adrian industries that see more men than women are Agriculture, Fishing & Hunting (100.0%), Construction (96.5%), and Manufacturing (77.4%), whereas the industries that tend to have a higher number of women are Health Care & Social Assistance (81.8%), Utilities (62.3%), and Educational Services (59.0%).
| Industry | Male | Female |
| Agriculture, Fishing & Hunting | 214 (100.0%) | 0 (0.0%) |
| Mining, Quarrying, & Extraction | 0 (0.0%) | 0 (0.0%) |
| Construction | 272 (96.5%) | 10 (3.5%) |
| Manufacturing | 1,348 (77.4%) | 394 (22.6%) |
| Wholesale Trade | 105 (75.0%) | 35 (25.0%) |
| Retail Trade | 602 (57.5%) | 445 (42.5%) |
| Transportation & Warehousing | 180 (66.9%) | 89 (33.1%) |
| Utilities | 29 (37.7%) | 48 (62.3%) |
| Information | 37 (46.3%) | 43 (53.7%) |
| Finance & Insurance | 41 (47.7%) | 45 (52.3%) |
| Real Estate, Rental & Leasing | 35 (66.0%) | 18 (34.0%) |
| Professional & Scientific | 110 (74.8%) | 37 (25.2%) |
| Enterprise Management | 0 (0.0%) | 0 (0.0%) |
| Administrative & Support | 117 (46.3%) | 136 (53.7%) |
| Educational Services | 419 (41.0%) | 604 (59.0%) |
| Health Care & Social Assistance | 215 (18.2%) | 968 (81.8%) |
| Arts, Entertainment & Recreation | 130 (58.8%) | 91 (41.2%) |
| Accommodation & Food Services | 436 (44.5%) | 543 (55.5%) |
| Public Administration | 143 (57.7%) | 105 (42.3%) |
| Total | 4,525 (53.6%) | 3,912 (46.4%) |
Education in Adrian
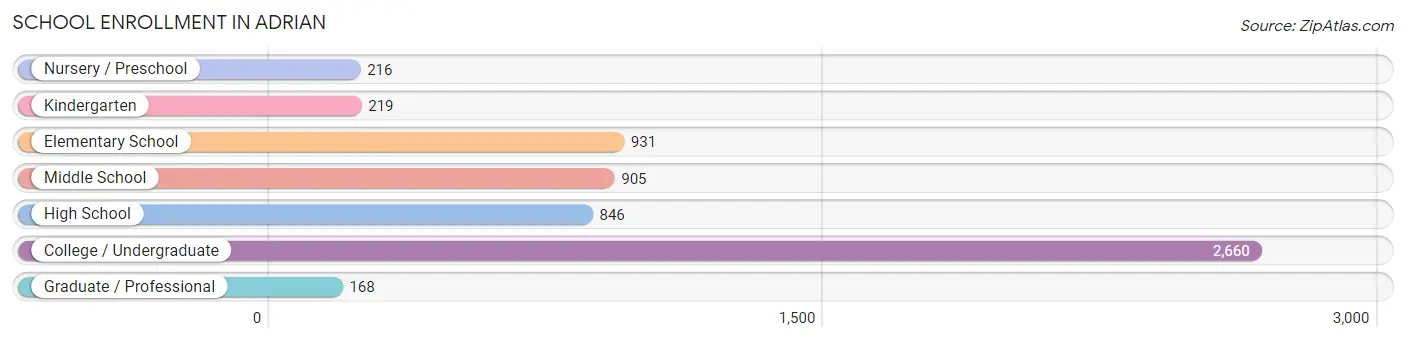
School Enrollment in Adrian
The most common levels of schooling among the 5,945 students in Adrian are college / undergraduate (2,660 | 44.7%), elementary school (931 | 15.7%), and middle school (905 | 15.2%).
| School Level | # Students | % Students |
| Nursery / Preschool | 216 | 3.6% |
| Kindergarten | 219 | 3.7% |
| Elementary School | 931 | 15.7% |
| Middle School | 905 | 15.2% |
| High School | 846 | 14.2% |
| College / Undergraduate | 2,660 | 44.7% |
| Graduate / Professional | 168 | 2.8% |
| Total | 5,945 | 100.0% |
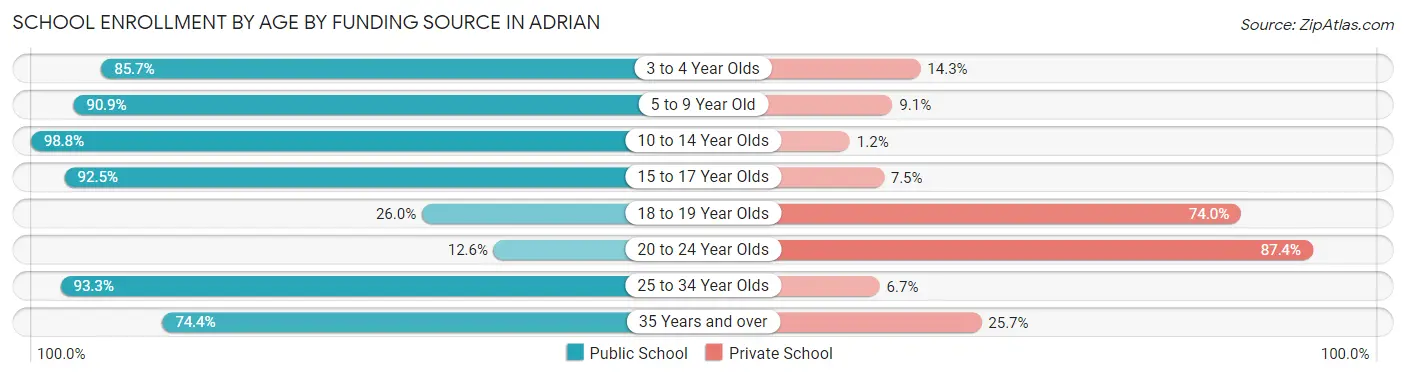
School Enrollment by Age by Funding Source in Adrian
Out of a total of 5,945 students who are enrolled in schools in Adrian, 2,378 (40.0%) attend a private institution, while the remaining 3,567 (60.0%) are enrolled in public schools. The age group of 20 to 24 year olds has the highest likelihood of being enrolled in private schools, with 1,310 (87.4% in the age bracket) enrolled. Conversely, the age group of 10 to 14 year olds has the lowest likelihood of being enrolled in a private school, with 1,196 (98.8% in the age bracket) attending a public institution.
| Age Bracket | Public School | Private School |
| 3 to 4 Year Olds | 150 (85.7%) | 25 (14.3%) |
| 5 to 9 Year Old | 931 (90.9%) | 93 (9.1%) |
| 10 to 14 Year Olds | 1,196 (98.8%) | 14 (1.2%) |
| 15 to 17 Year Olds | 409 (92.5%) | 33 (7.5%) |
| 18 to 19 Year Olds | 284 (26.0%) | 809 (74.0%) |
| 20 to 24 Year Olds | 189 (12.6%) | 1,310 (87.4%) |
| 25 to 34 Year Olds | 181 (93.3%) | 13 (6.7%) |
| 35 Years and over | 229 (74.4%) | 79 (25.7%) |
| Total | 3,567 (60.0%) | 2,378 (40.0%) |
Educational Attainment by Field of Study in Adrian
Education (534 | 18.8%), business (375 | 13.2%), arts & humanities (269 | 9.5%), liberal arts & history (221 | 7.8%), and visual & performing arts (220 | 7.7%) are the most common fields of study among 2,844 individuals in Adrian who have obtained a bachelor's degree or higher.
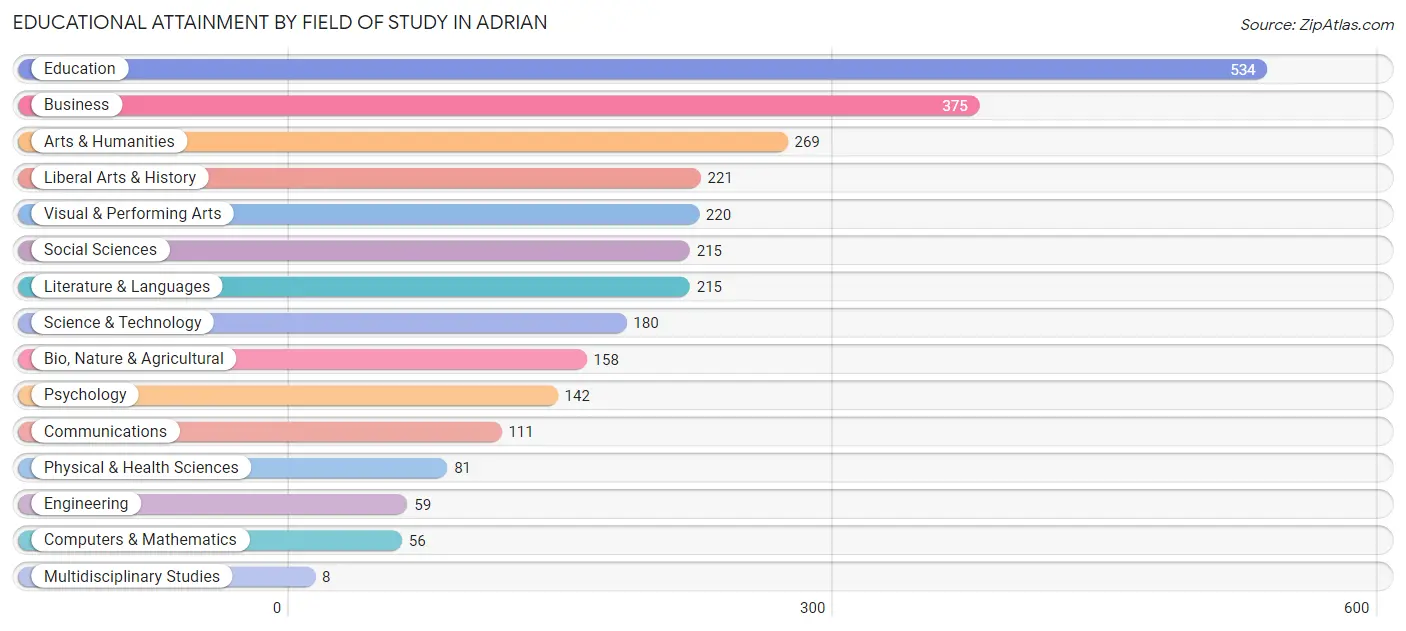
| Field of Study | # Graduates | % Graduates |
| Computers & Mathematics | 56 | 2.0% |
| Bio, Nature & Agricultural | 158 | 5.6% |
| Physical & Health Sciences | 81 | 2.9% |
| Psychology | 142 | 5.0% |
| Social Sciences | 215 | 7.6% |
| Engineering | 59 | 2.1% |
| Multidisciplinary Studies | 8 | 0.3% |
| Science & Technology | 180 | 6.3% |
| Business | 375 | 13.2% |
| Education | 534 | 18.8% |
| Literature & Languages | 215 | 7.6% |
| Liberal Arts & History | 221 | 7.8% |
| Visual & Performing Arts | 220 | 7.7% |
| Communications | 111 | 3.9% |
| Arts & Humanities | 269 | 9.5% |
| Total | 2,844 | 100.0% |
Transportation & Commute in Adrian
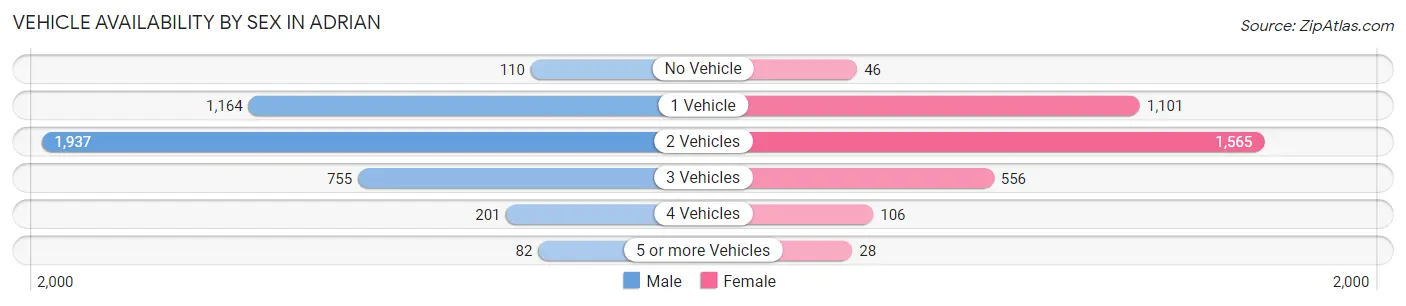
Vehicle Availability by Sex in Adrian
The most prevalent vehicle ownership categories in Adrian are males with 2 vehicles (1,937, accounting for 45.6%) and females with 2 vehicles (1,565, making up 56.9%).
| Vehicles Available | Male | Female |
| No Vehicle | 110 (2.6%) | 46 (1.3%) |
| 1 Vehicle | 1,164 (27.4%) | 1,101 (32.4%) |
| 2 Vehicles | 1,937 (45.6%) | 1,565 (46.0%) |
| 3 Vehicles | 755 (17.8%) | 556 (16.3%) |
| 4 Vehicles | 201 (4.7%) | 106 (3.1%) |
| 5 or more Vehicles | 82 (1.9%) | 28 (0.8%) |
| Total | 4,249 (100.0%) | 3,402 (100.0%) |
Commute Time in Adrian
The most frequently occuring commute durations in Adrian are 5 to 9 minutes (2,420 commuters, 31.1%), 10 to 14 minutes (1,335 commuters, 17.2%), and less than 5 minutes (709 commuters, 9.1%).
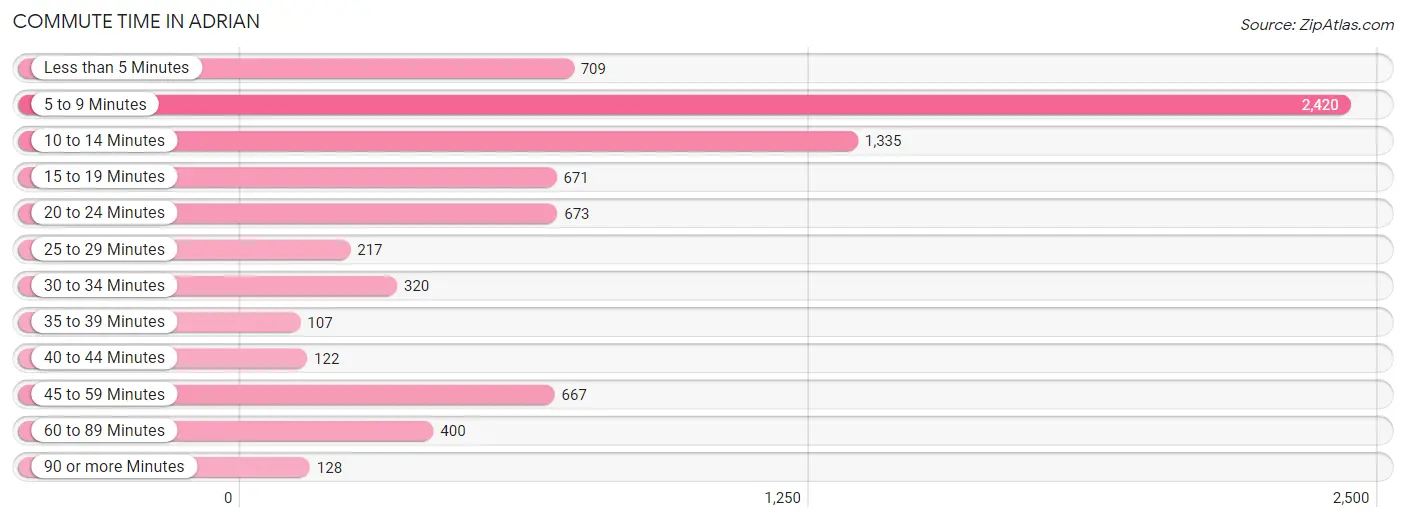
| Commute Time | # Commuters | % Commuters |
| Less than 5 Minutes | 709 | 9.1% |
| 5 to 9 Minutes | 2,420 | 31.1% |
| 10 to 14 Minutes | 1,335 | 17.2% |
| 15 to 19 Minutes | 671 | 8.6% |
| 20 to 24 Minutes | 673 | 8.7% |
| 25 to 29 Minutes | 217 | 2.8% |
| 30 to 34 Minutes | 320 | 4.1% |
| 35 to 39 Minutes | 107 | 1.4% |
| 40 to 44 Minutes | 122 | 1.6% |
| 45 to 59 Minutes | 667 | 8.6% |
| 60 to 89 Minutes | 400 | 5.1% |
| 90 or more Minutes | 128 | 1.7% |
Commute Time by Sex in Adrian
The most common commute times in Adrian are 5 to 9 minutes (934 commuters, 21.9%) for males and 5 to 9 minutes (1,486 commuters, 42.4%) for females.
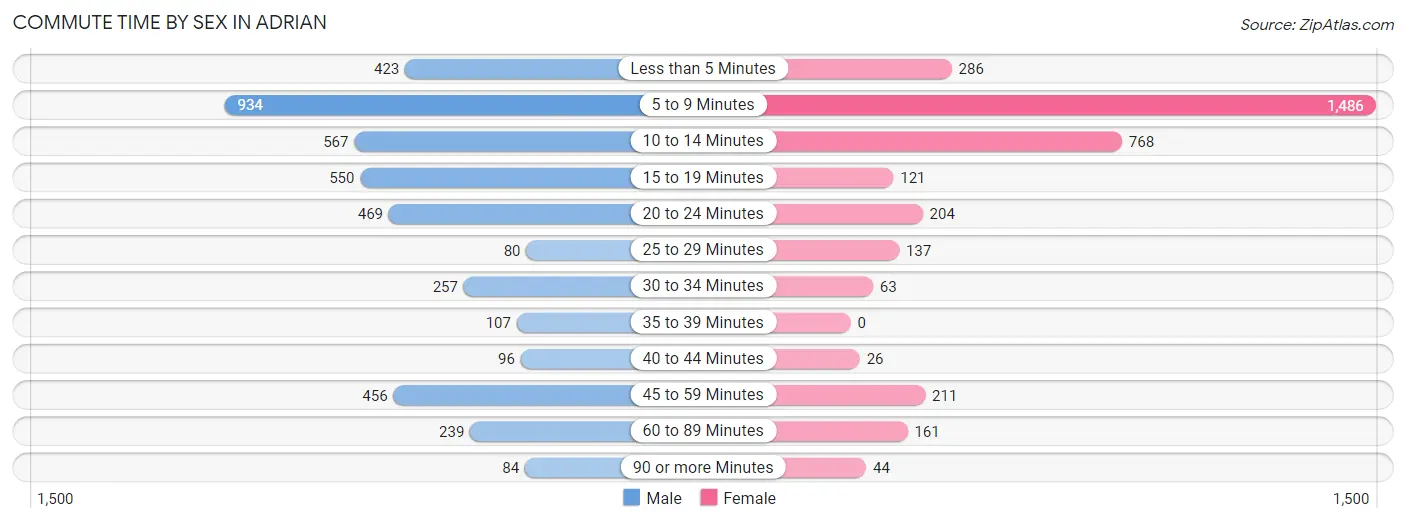
| Commute Time | Male | Female |
| Less than 5 Minutes | 423 (9.9%) | 286 (8.2%) |
| 5 to 9 Minutes | 934 (21.9%) | 1,486 (42.4%) |
| 10 to 14 Minutes | 567 (13.3%) | 768 (21.9%) |
| 15 to 19 Minutes | 550 (12.9%) | 121 (3.5%) |
| 20 to 24 Minutes | 469 (11.0%) | 204 (5.8%) |
| 25 to 29 Minutes | 80 (1.9%) | 137 (3.9%) |
| 30 to 34 Minutes | 257 (6.0%) | 63 (1.8%) |
| 35 to 39 Minutes | 107 (2.5%) | 0 (0.0%) |
| 40 to 44 Minutes | 96 (2.2%) | 26 (0.7%) |
| 45 to 59 Minutes | 456 (10.7%) | 211 (6.0%) |
| 60 to 89 Minutes | 239 (5.6%) | 161 (4.6%) |
| 90 or more Minutes | 84 (2.0%) | 44 (1.3%) |
Time of Departure to Work by Sex in Adrian
The most frequent times of departure to work in Adrian are 4:00 PM to 11:59 PM (496, 11.6%) for males and 7:30 AM to 7:59 AM (575, 16.4%) for females.
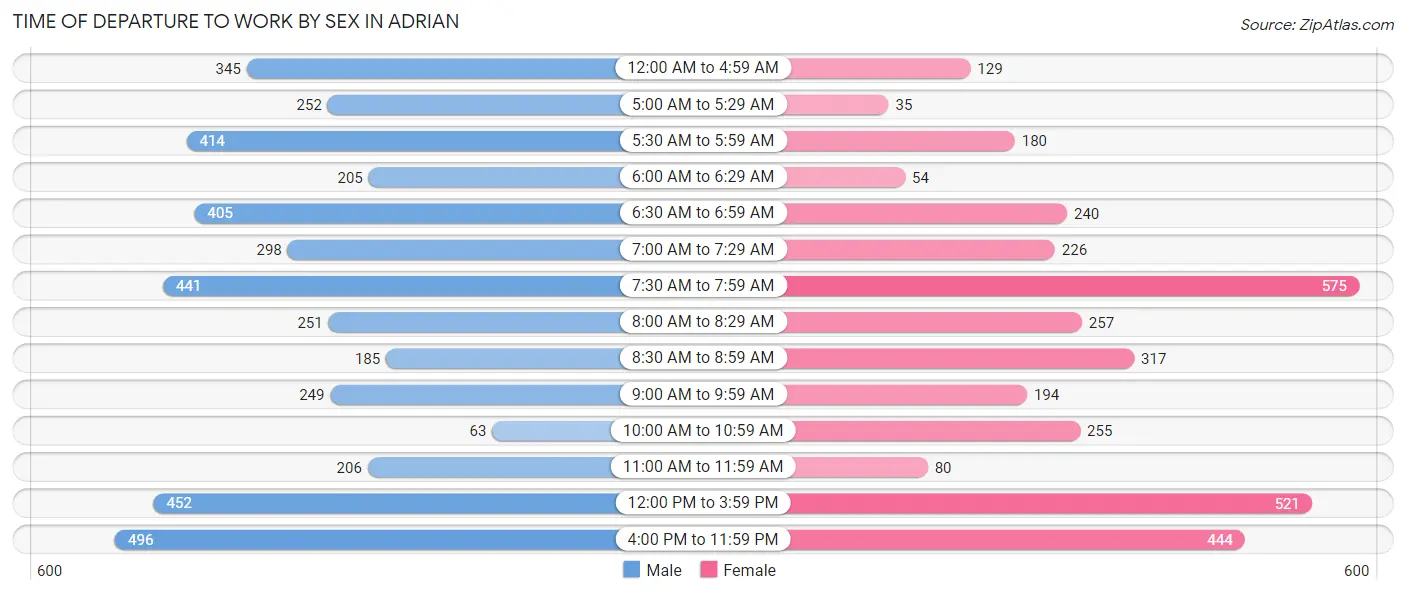
| Time of Departure | Male | Female |
| 12:00 AM to 4:59 AM | 345 (8.1%) | 129 (3.7%) |
| 5:00 AM to 5:29 AM | 252 (5.9%) | 35 (1.0%) |
| 5:30 AM to 5:59 AM | 414 (9.7%) | 180 (5.1%) |
| 6:00 AM to 6:29 AM | 205 (4.8%) | 54 (1.5%) |
| 6:30 AM to 6:59 AM | 405 (9.5%) | 240 (6.8%) |
| 7:00 AM to 7:29 AM | 298 (7.0%) | 226 (6.4%) |
| 7:30 AM to 7:59 AM | 441 (10.3%) | 575 (16.4%) |
| 8:00 AM to 8:29 AM | 251 (5.9%) | 257 (7.3%) |
| 8:30 AM to 8:59 AM | 185 (4.3%) | 317 (9.0%) |
| 9:00 AM to 9:59 AM | 249 (5.8%) | 194 (5.5%) |
| 10:00 AM to 10:59 AM | 63 (1.5%) | 255 (7.3%) |
| 11:00 AM to 11:59 AM | 206 (4.8%) | 80 (2.3%) |
| 12:00 PM to 3:59 PM | 452 (10.6%) | 521 (14.9%) |
| 4:00 PM to 11:59 PM | 496 (11.6%) | 444 (12.7%) |
| Total | 4,262 (100.0%) | 3,507 (100.0%) |
Housing Occupancy in Adrian
Occupancy by Ownership in Adrian
Of the total 7,960 dwellings in Adrian, owner-occupied units account for 4,287 (53.9%), while renter-occupied units make up 3,673 (46.1%).
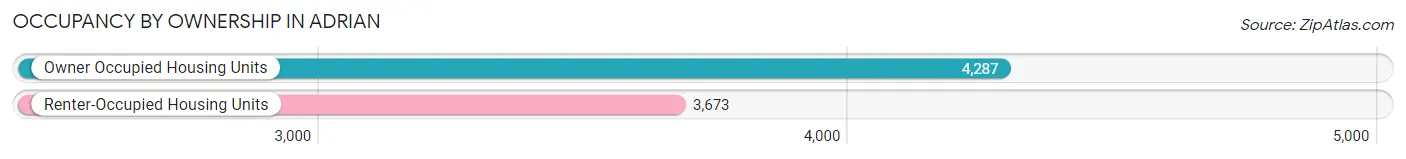
| Occupancy | # Housing Units | % Housing Units |
| Owner Occupied Housing Units | 4,287 | 53.9% |
| Renter-Occupied Housing Units | 3,673 | 46.1% |
| Total Occupied Housing Units | 7,960 | 100.0% |
Occupancy by Household Size in Adrian
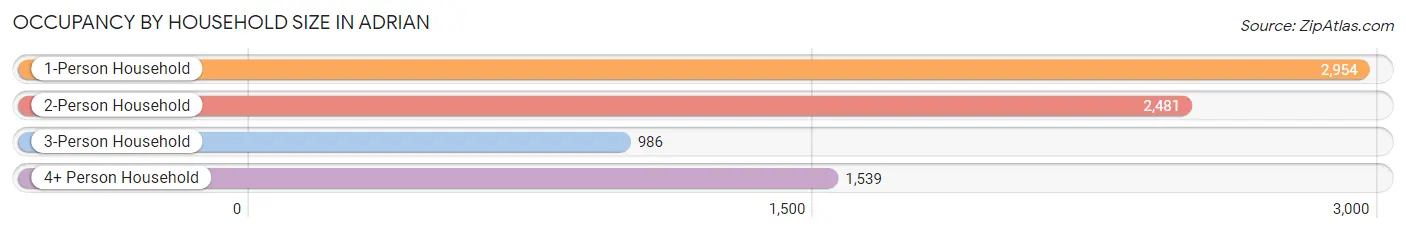
| Household Size | # Housing Units | % Housing Units |
| 1-Person Household | 2,954 | 37.1% |
| 2-Person Household | 2,481 | 31.2% |
| 3-Person Household | 986 | 12.4% |
| 4+ Person Household | 1,539 | 19.3% |
| Total Housing Units | 7,960 | 100.0% |
Occupancy by Ownership by Household Size in Adrian
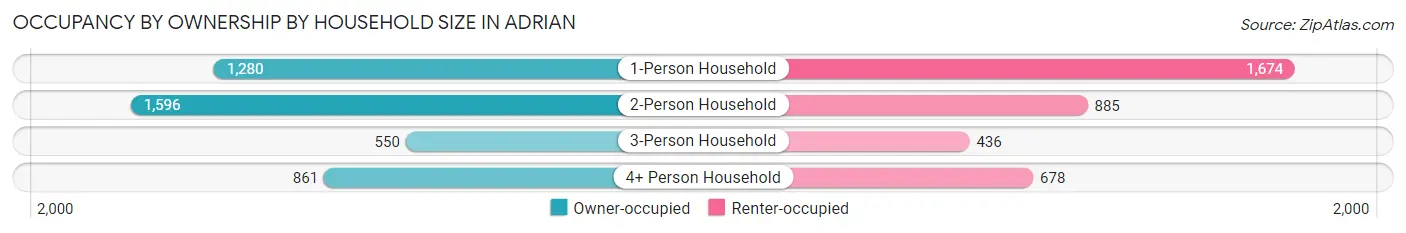
| Household Size | Owner-occupied | Renter-occupied |
| 1-Person Household | 1,280 (43.3%) | 1,674 (56.7%) |
| 2-Person Household | 1,596 (64.3%) | 885 (35.7%) |
| 3-Person Household | 550 (55.8%) | 436 (44.2%) |
| 4+ Person Household | 861 (55.9%) | 678 (44.1%) |
| Total Housing Units | 4,287 (53.9%) | 3,673 (46.1%) |
Occupancy by Educational Attainment in Adrian
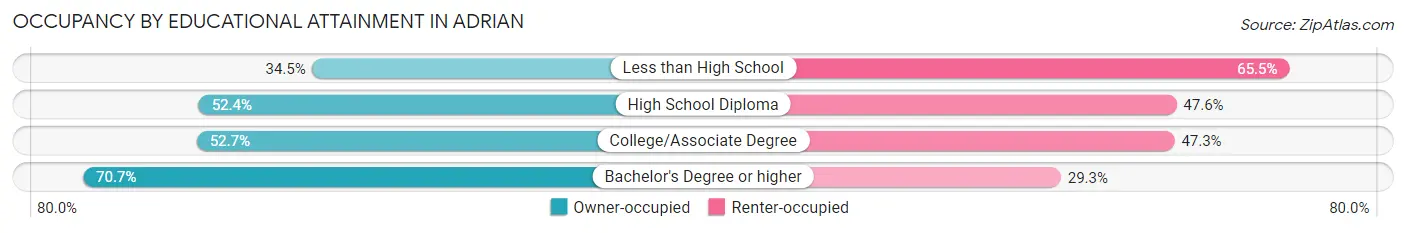
| Household Size | Owner-occupied | Renter-occupied |
| Less than High School | 341 (34.5%) | 648 (65.5%) |
| High School Diploma | 1,384 (52.4%) | 1,258 (47.6%) |
| College/Associate Degree | 1,459 (52.7%) | 1,310 (47.3%) |
| Bachelor's Degree or higher | 1,103 (70.7%) | 457 (29.3%) |
Occupancy by Age of Householder in Adrian
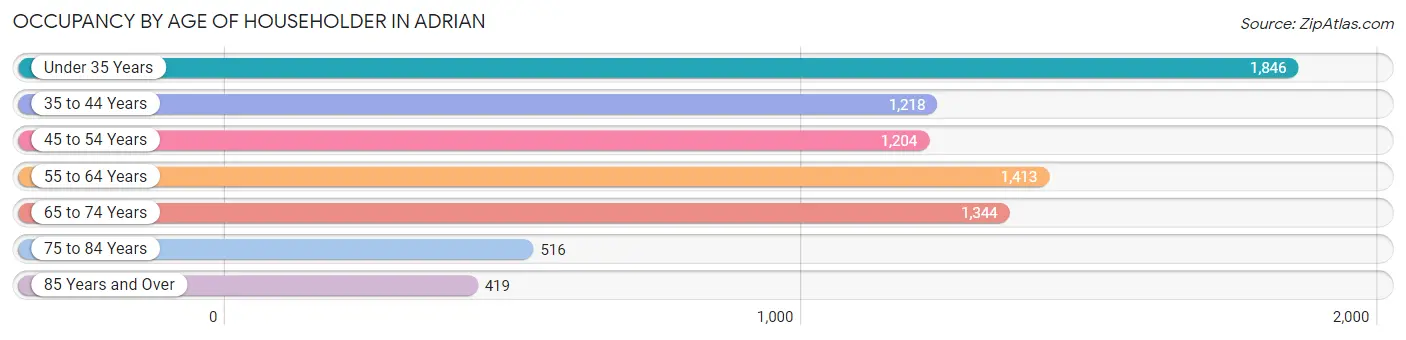
| Age Bracket | # Households | % Households |
| Under 35 Years | 1,846 | 23.2% |
| 35 to 44 Years | 1,218 | 15.3% |
| 45 to 54 Years | 1,204 | 15.1% |
| 55 to 64 Years | 1,413 | 17.7% |
| 65 to 74 Years | 1,344 | 16.9% |
| 75 to 84 Years | 516 | 6.5% |
| 85 Years and Over | 419 | 5.3% |
| Total | 7,960 | 100.0% |
Housing Finances in Adrian
Median Income by Occupancy in Adrian
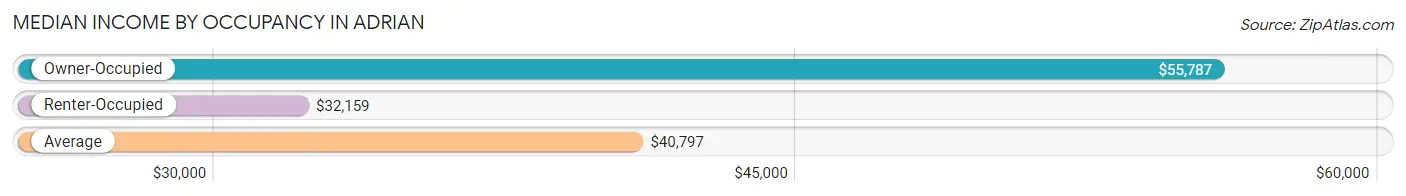
| Occupancy Type | # Households | Median Income |
| Owner-Occupied | 4,287 (53.9%) | $55,787 |
| Renter-Occupied | 3,673 (46.1%) | $32,159 |
| Average | 7,960 (100.0%) | $40,797 |
Occupancy by Householder Income Bracket in Adrian
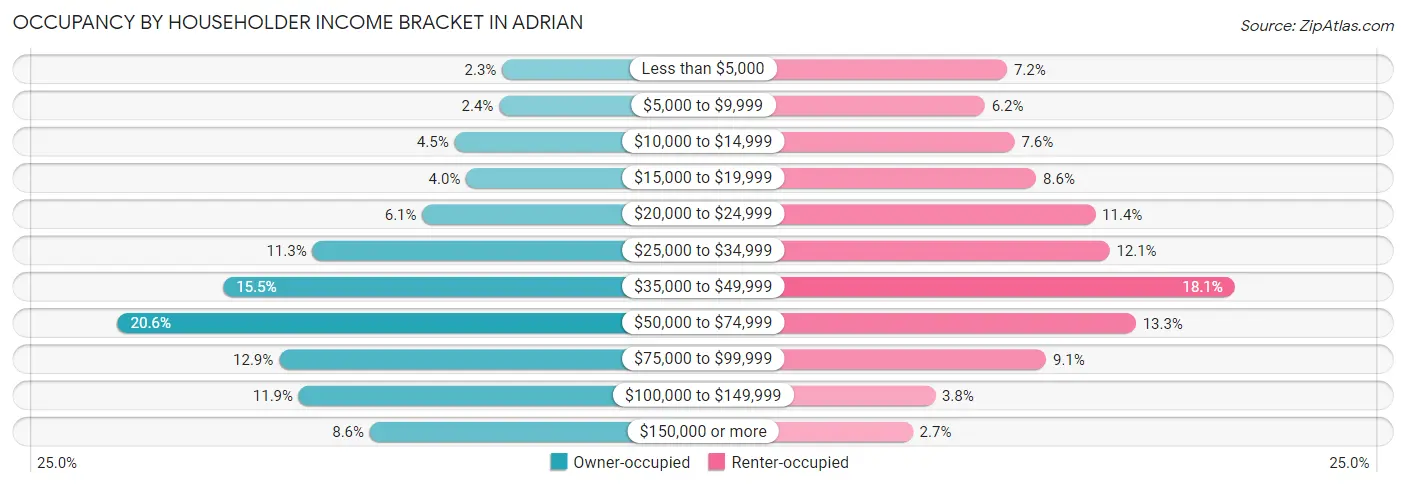
| Income Bracket | Owner-occupied | Renter-occupied |
| Less than $5,000 | 97 (2.3%) | 265 (7.2%) |
| $5,000 to $9,999 | 103 (2.4%) | 226 (6.1%) |
| $10,000 to $14,999 | 194 (4.5%) | 278 (7.6%) |
| $15,000 to $19,999 | 170 (4.0%) | 316 (8.6%) |
| $20,000 to $24,999 | 260 (6.1%) | 419 (11.4%) |
| $25,000 to $34,999 | 484 (11.3%) | 444 (12.1%) |
| $35,000 to $49,999 | 666 (15.5%) | 663 (18.0%) |
| $50,000 to $74,999 | 882 (20.6%) | 490 (13.3%) |
| $75,000 to $99,999 | 552 (12.9%) | 333 (9.1%) |
| $100,000 to $149,999 | 512 (11.9%) | 139 (3.8%) |
| $150,000 or more | 367 (8.6%) | 100 (2.7%) |
| Total | 4,287 (100.0%) | 3,673 (100.0%) |
Monthly Housing Cost Tiers in Adrian
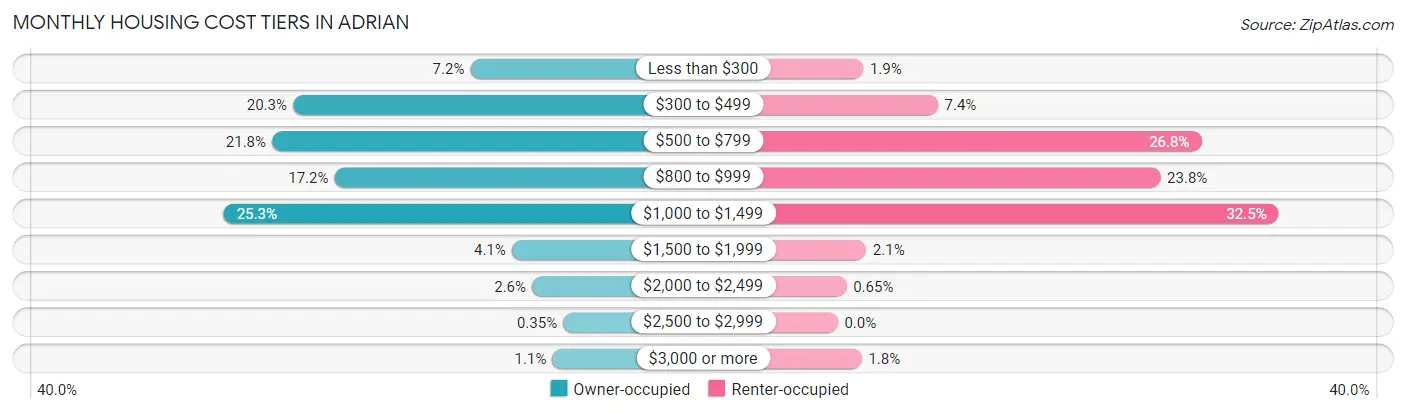
| Monthly Cost | Owner-occupied | Renter-occupied |
| Less than $300 | 308 (7.2%) | 69 (1.9%) |
| $300 to $499 | 868 (20.3%) | 271 (7.4%) |
| $500 to $799 | 934 (21.8%) | 984 (26.8%) |
| $800 to $999 | 737 (17.2%) | 873 (23.8%) |
| $1,000 to $1,499 | 1,086 (25.3%) | 1,193 (32.5%) |
| $1,500 to $1,999 | 177 (4.1%) | 77 (2.1%) |
| $2,000 to $2,499 | 113 (2.6%) | 24 (0.6%) |
| $2,500 to $2,999 | 15 (0.4%) | 0 (0.0%) |
| $3,000 or more | 49 (1.1%) | 65 (1.8%) |
| Total | 4,287 (100.0%) | 3,673 (100.0%) |
Physical Housing Characteristics in Adrian
Housing Structures in Adrian
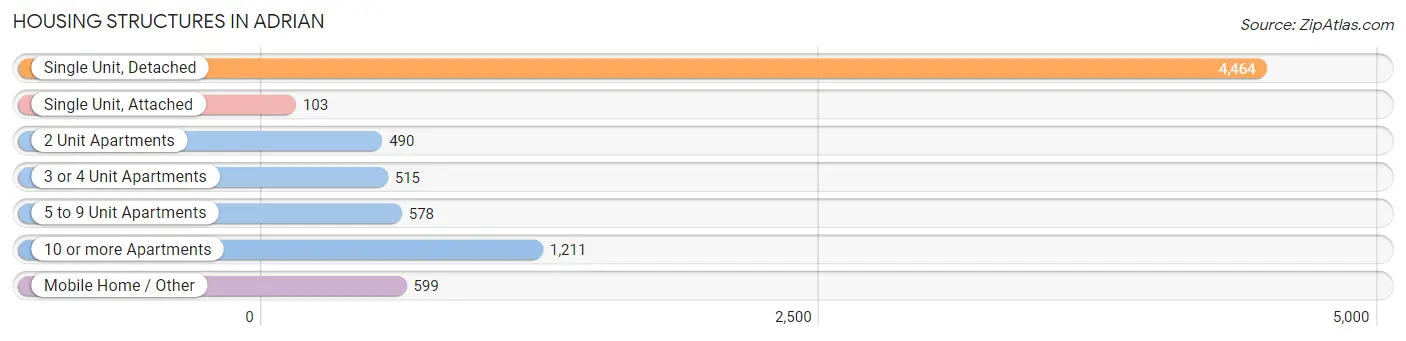
| Structure Type | # Housing Units | % Housing Units |
| Single Unit, Detached | 4,464 | 56.1% |
| Single Unit, Attached | 103 | 1.3% |
| 2 Unit Apartments | 490 | 6.2% |
| 3 or 4 Unit Apartments | 515 | 6.5% |
| 5 to 9 Unit Apartments | 578 | 7.3% |
| 10 or more Apartments | 1,211 | 15.2% |
| Mobile Home / Other | 599 | 7.5% |
| Total | 7,960 | 100.0% |
Housing Structures by Occupancy in Adrian
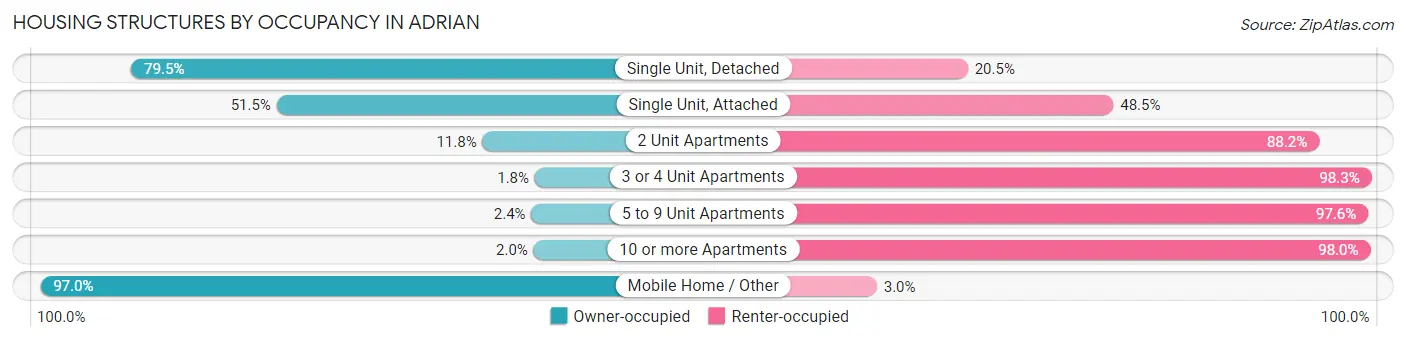
| Structure Type | Owner-occupied | Renter-occupied |
| Single Unit, Detached | 3,548 (79.5%) | 916 (20.5%) |
| Single Unit, Attached | 53 (51.5%) | 50 (48.5%) |
| 2 Unit Apartments | 58 (11.8%) | 432 (88.2%) |
| 3 or 4 Unit Apartments | 9 (1.8%) | 506 (98.3%) |
| 5 to 9 Unit Apartments | 14 (2.4%) | 564 (97.6%) |
| 10 or more Apartments | 24 (2.0%) | 1,187 (98.0%) |
| Mobile Home / Other | 581 (97.0%) | 18 (3.0%) |
| Total | 4,287 (53.9%) | 3,673 (46.1%) |
Housing Structures by Number of Rooms in Adrian
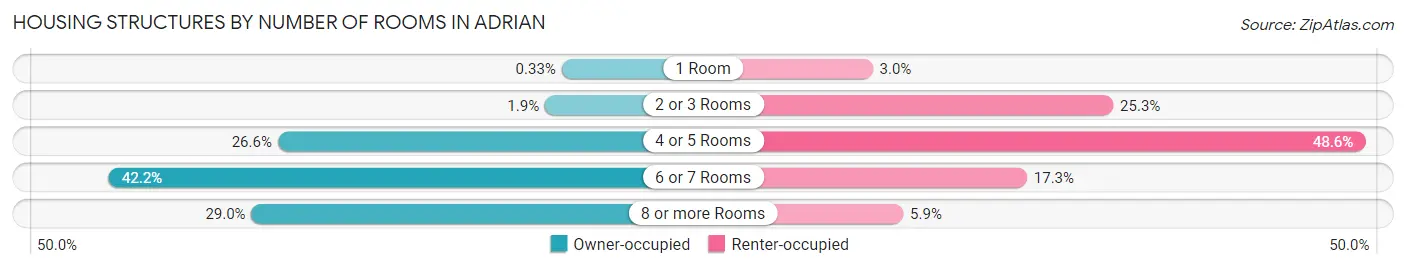
| Number of Rooms | Owner-occupied | Renter-occupied |
| 1 Room | 14 (0.3%) | 111 (3.0%) |
| 2 or 3 Rooms | 80 (1.9%) | 928 (25.3%) |
| 4 or 5 Rooms | 1,140 (26.6%) | 1,784 (48.6%) |
| 6 or 7 Rooms | 1,809 (42.2%) | 635 (17.3%) |
| 8 or more Rooms | 1,244 (29.0%) | 215 (5.9%) |
| Total | 4,287 (100.0%) | 3,673 (100.0%) |
Housing Structure by Heating Type in Adrian
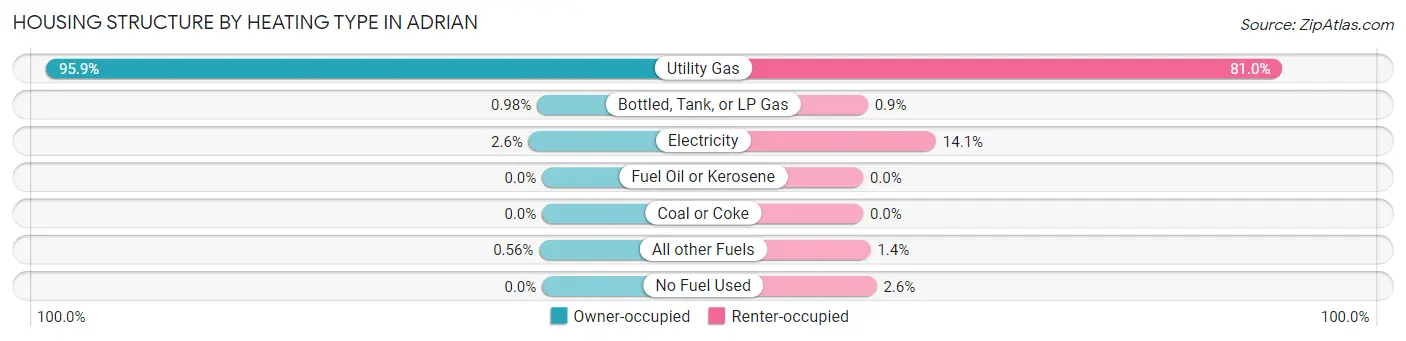
| Heating Type | Owner-occupied | Renter-occupied |
| Utility Gas | 4,110 (95.9%) | 2,975 (81.0%) |
| Bottled, Tank, or LP Gas | 42 (1.0%) | 33 (0.9%) |
| Electricity | 111 (2.6%) | 517 (14.1%) |
| Fuel Oil or Kerosene | 0 (0.0%) | 0 (0.0%) |
| Coal or Coke | 0 (0.0%) | 0 (0.0%) |
| All other Fuels | 24 (0.6%) | 53 (1.4%) |
| No Fuel Used | 0 (0.0%) | 95 (2.6%) |
| Total | 4,287 (100.0%) | 3,673 (100.0%) |
Household Vehicle Usage in Adrian
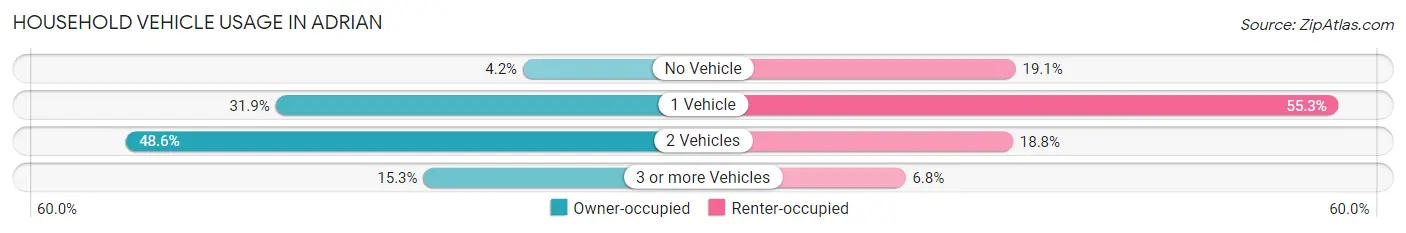
| Vehicles per Household | Owner-occupied | Renter-occupied |
| No Vehicle | 179 (4.2%) | 702 (19.1%) |
| 1 Vehicle | 1,367 (31.9%) | 2,031 (55.3%) |
| 2 Vehicles | 2,084 (48.6%) | 691 (18.8%) |
| 3 or more Vehicles | 657 (15.3%) | 249 (6.8%) |
| Total | 4,287 (100.0%) | 3,673 (100.0%) |
Real Estate & Mortgages in Adrian
Real Estate and Mortgage Overview in Adrian
| Characteristic | Without Mortgage | With Mortgage |
| Housing Units | 1,871 | 2,416 |
| Median Property Value | $99,100 | $113,500 |
| Median Household Income | $42,904 | $218 |
| Monthly Housing Costs | $470 | $49 |
| Real Estate Taxes | $1,767 | $97 |
Property Value by Mortgage Status in Adrian
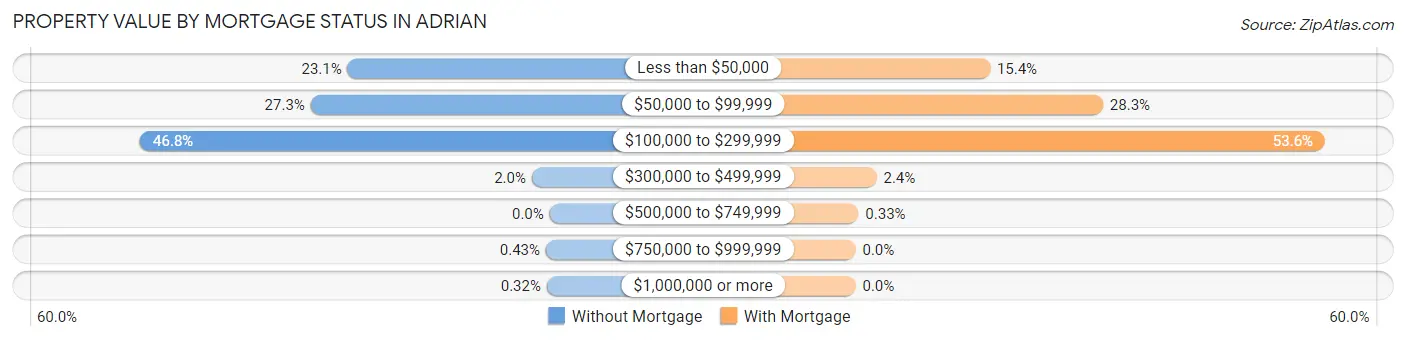
| Property Value | Without Mortgage | With Mortgage |
| Less than $50,000 | 432 (23.1%) | 371 (15.4%) |
| $50,000 to $99,999 | 511 (27.3%) | 683 (28.3%) |
| $100,000 to $299,999 | 876 (46.8%) | 1,296 (53.6%) |
| $300,000 to $499,999 | 38 (2.0%) | 58 (2.4%) |
| $500,000 to $749,999 | 0 (0.0%) | 8 (0.3%) |
| $750,000 to $999,999 | 8 (0.4%) | 0 (0.0%) |
| $1,000,000 or more | 6 (0.3%) | 0 (0.0%) |
| Total | 1,871 (100.0%) | 2,416 (100.0%) |
Household Income by Mortgage Status in Adrian
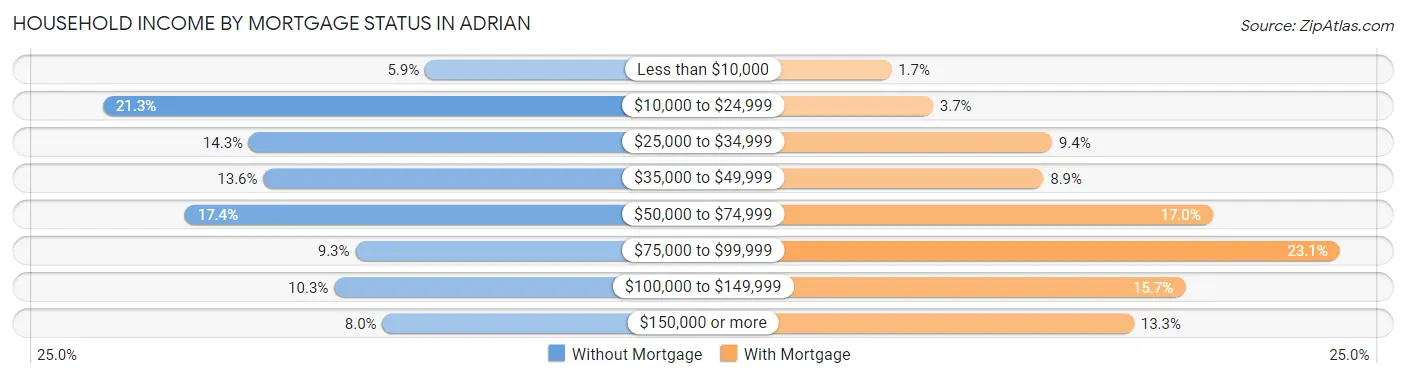
| Household Income | Without Mortgage | With Mortgage |
| Less than $10,000 | 111 (5.9%) | 41 (1.7%) |
| $10,000 to $24,999 | 398 (21.3%) | 89 (3.7%) |
| $25,000 to $34,999 | 268 (14.3%) | 226 (9.3%) |
| $35,000 to $49,999 | 255 (13.6%) | 216 (8.9%) |
| $50,000 to $74,999 | 325 (17.4%) | 411 (17.0%) |
| $75,000 to $99,999 | 173 (9.2%) | 557 (23.1%) |
| $100,000 to $149,999 | 192 (10.3%) | 379 (15.7%) |
| $150,000 or more | 149 (8.0%) | 320 (13.3%) |
| Total | 1,871 (100.0%) | 2,416 (100.0%) |
Property Value to Household Income Ratio in Adrian
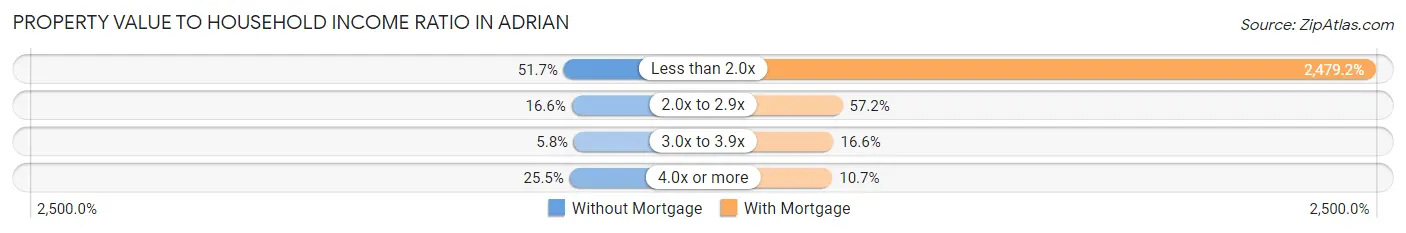
| Value-to-Income Ratio | Without Mortgage | With Mortgage |
| Less than 2.0x | 968 (51.7%) | 59,897 (2,479.2%) |
| 2.0x to 2.9x | 311 (16.6%) | 1,383 (57.2%) |
| 3.0x to 3.9x | 108 (5.8%) | 401 (16.6%) |
| 4.0x or more | 477 (25.5%) | 258 (10.7%) |
| Total | 1,871 (100.0%) | 2,416 (100.0%) |
Real Estate Taxes by Mortgage Status in Adrian
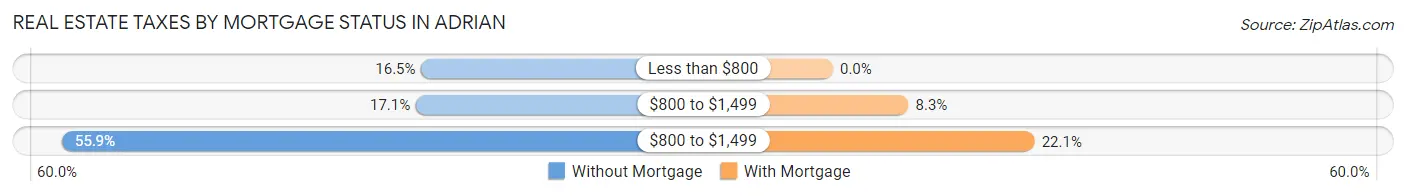
| Property Taxes | Without Mortgage | With Mortgage |
| Less than $800 | 309 (16.5%) | 0 (0.0%) |
| $800 to $1,499 | 320 (17.1%) | 200 (8.3%) |
| $800 to $1,499 | 1,046 (55.9%) | 534 (22.1%) |
| Total | 1,871 (100.0%) | 2,416 (100.0%) |
Health & Disability in Adrian
Health Insurance Coverage by Age in Adrian
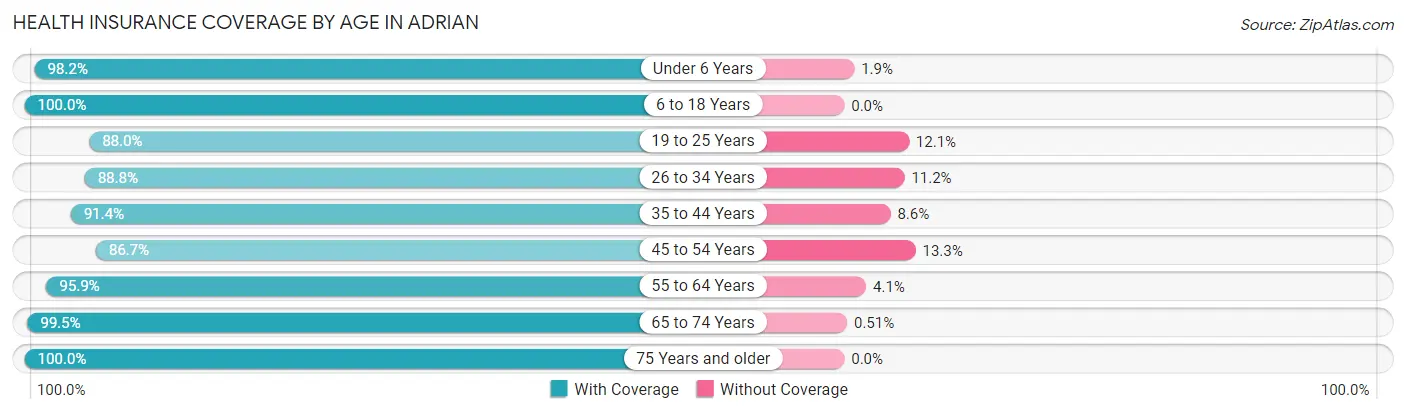
| Age Bracket | With Coverage | Without Coverage |
| Under 6 Years | 1,382 (98.2%) | 26 (1.8%) |
| 6 to 18 Years | 3,066 (100.0%) | 0 (0.0%) |
| 19 to 25 Years | 3,176 (87.9%) | 435 (12.0%) |
| 26 to 34 Years | 1,931 (88.8%) | 244 (11.2%) |
| 35 to 44 Years | 1,868 (91.4%) | 176 (8.6%) |
| 45 to 54 Years | 1,873 (86.7%) | 287 (13.3%) |
| 55 to 64 Years | 2,006 (95.9%) | 85 (4.1%) |
| 65 to 74 Years | 1,957 (99.5%) | 10 (0.5%) |
| 75 Years and older | 1,349 (100.0%) | 0 (0.0%) |
| Total | 18,608 (93.6%) | 1,263 (6.4%) |
Health Insurance Coverage by Citizenship Status in Adrian
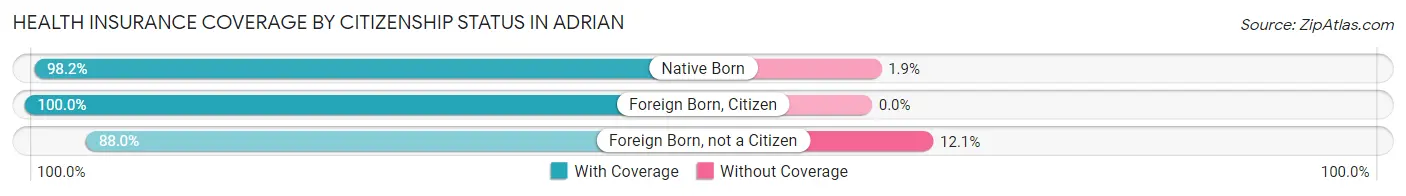
| Citizenship Status | With Coverage | Without Coverage |
| Native Born | 1,382 (98.2%) | 26 (1.8%) |
| Foreign Born, Citizen | 3,066 (100.0%) | 0 (0.0%) |
| Foreign Born, not a Citizen | 3,176 (87.9%) | 435 (12.0%) |
Health Insurance Coverage by Household Income in Adrian
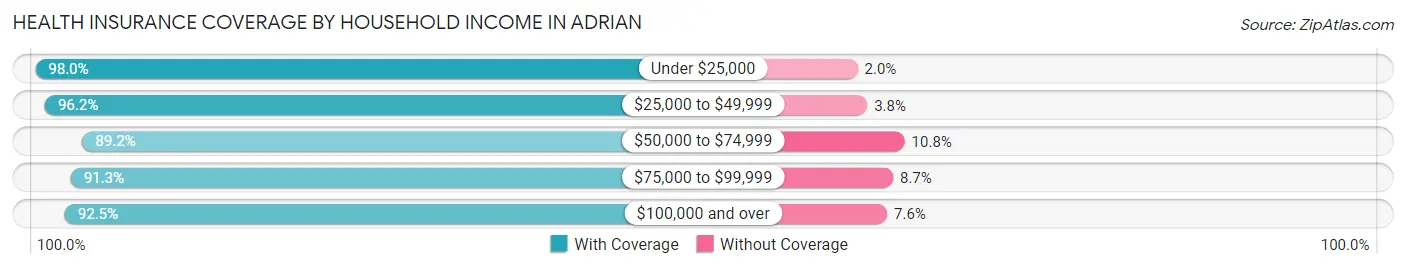
| Household Income | With Coverage | Without Coverage |
| Under $25,000 | 3,792 (98.0%) | 78 (2.0%) |
| $25,000 to $49,999 | 4,371 (96.2%) | 174 (3.8%) |
| $50,000 to $74,999 | 3,150 (89.2%) | 383 (10.8%) |
| $75,000 to $99,999 | 2,553 (91.3%) | 242 (8.7%) |
| $100,000 and over | 3,222 (92.4%) | 263 (7.5%) |
Public vs Private Health Insurance Coverage by Age in Adrian
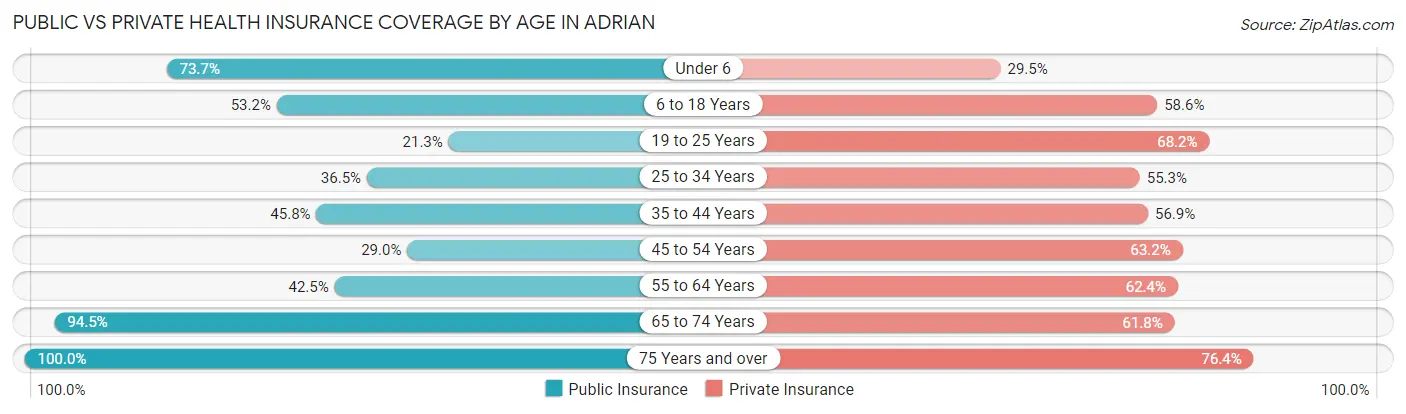
| Age Bracket | Public Insurance | Private Insurance |
| Under 6 | 1,037 (73.7%) | 415 (29.5%) |
| 6 to 18 Years | 1,631 (53.2%) | 1,795 (58.6%) |
| 19 to 25 Years | 769 (21.3%) | 2,463 (68.2%) |
| 25 to 34 Years | 793 (36.5%) | 1,203 (55.3%) |
| 35 to 44 Years | 937 (45.8%) | 1,162 (56.9%) |
| 45 to 54 Years | 626 (29.0%) | 1,366 (63.2%) |
| 55 to 64 Years | 888 (42.5%) | 1,304 (62.4%) |
| 65 to 74 Years | 1,858 (94.5%) | 1,215 (61.8%) |
| 75 Years and over | 1,349 (100.0%) | 1,031 (76.4%) |
| Total | 9,888 (49.8%) | 11,954 (60.2%) |
Disability Status by Sex by Age in Adrian
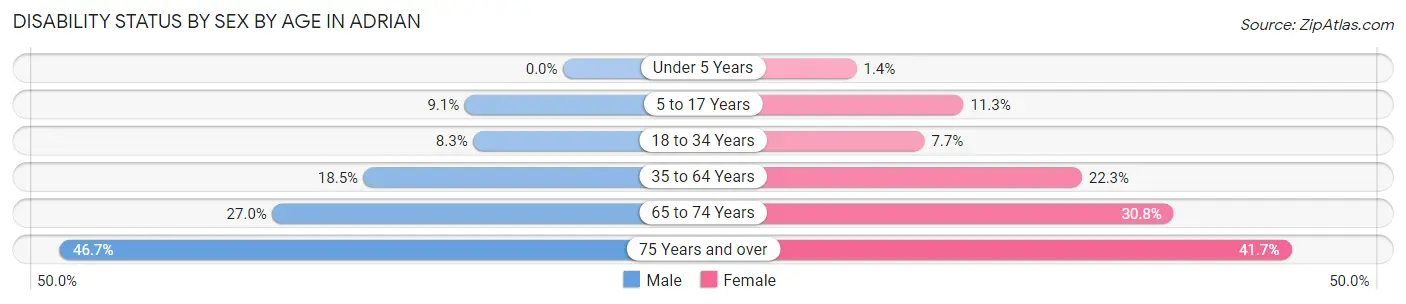
| Age Bracket | Male | Female |
| Under 5 Years | 0 (0.0%) | 8 (1.4%) |
| 5 to 17 Years | 130 (9.1%) | 168 (11.3%) |
| 18 to 34 Years | 279 (8.3%) | 221 (7.7%) |
| 35 to 64 Years | 562 (18.5%) | 726 (22.3%) |
| 65 to 74 Years | 225 (27.0%) | 349 (30.8%) |
| 75 Years and over | 227 (46.7%) | 360 (41.7%) |
Disability Class by Sex by Age in Adrian
Disability Class: Hearing Difficulty
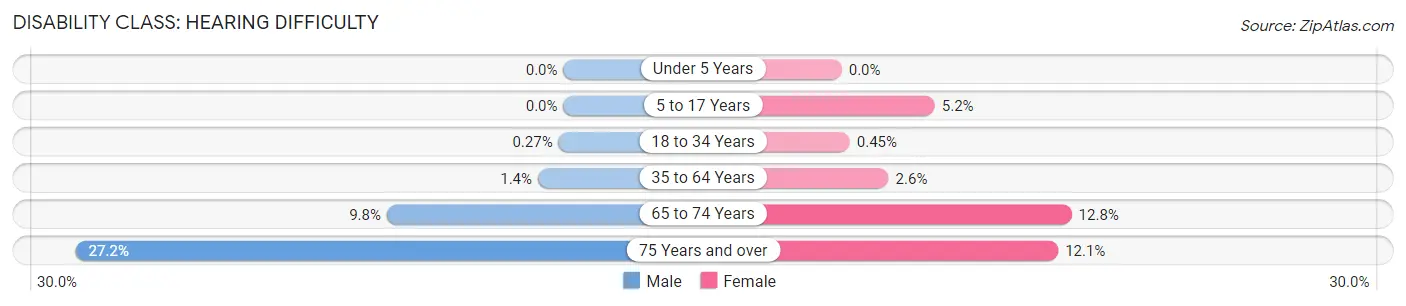
| Age Bracket | Male | Female |
| Under 5 Years | 0 (0.0%) | 0 (0.0%) |
| 5 to 17 Years | 0 (0.0%) | 77 (5.2%) |
| 18 to 34 Years | 9 (0.3%) | 13 (0.4%) |
| 35 to 64 Years | 43 (1.4%) | 85 (2.6%) |
| 65 to 74 Years | 82 (9.8%) | 145 (12.8%) |
| 75 Years and over | 132 (27.2%) | 104 (12.0%) |
Disability Class: Vision Difficulty
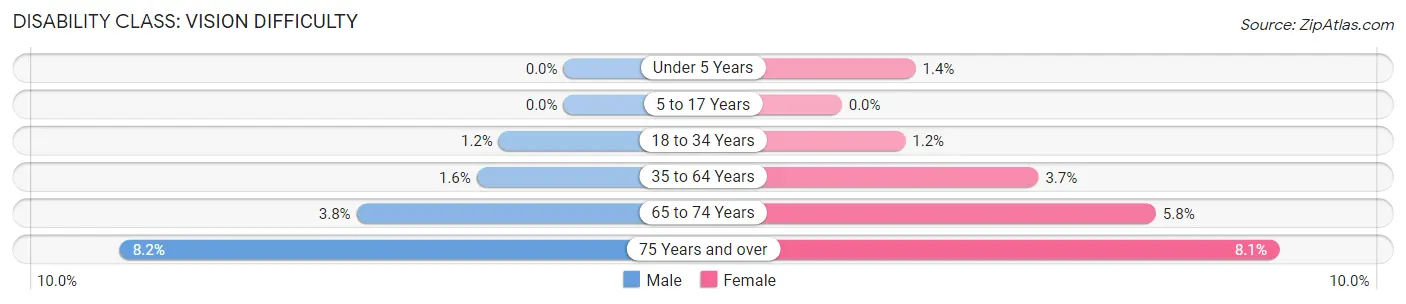
| Age Bracket | Male | Female |
| Under 5 Years | 0 (0.0%) | 8 (1.4%) |
| 5 to 17 Years | 0 (0.0%) | 0 (0.0%) |
| 18 to 34 Years | 40 (1.2%) | 34 (1.2%) |
| 35 to 64 Years | 49 (1.6%) | 119 (3.6%) |
| 65 to 74 Years | 32 (3.8%) | 66 (5.8%) |
| 75 Years and over | 40 (8.2%) | 70 (8.1%) |
Disability Class: Cognitive Difficulty
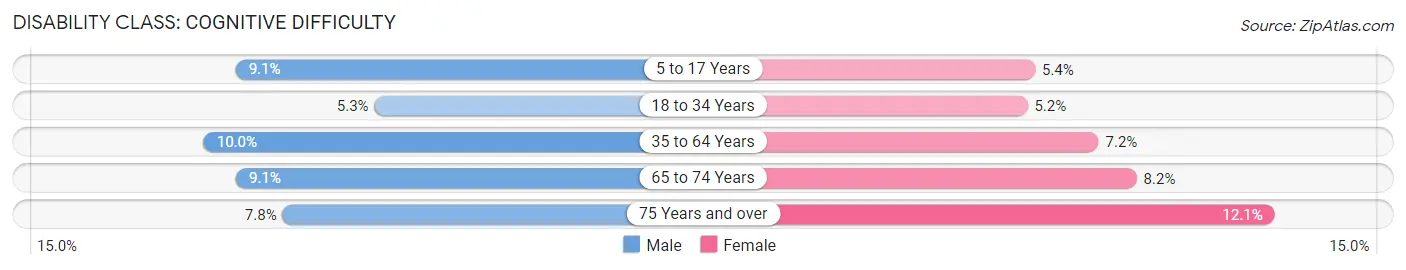
| Age Bracket | Male | Female |
| 5 to 17 Years | 130 (9.1%) | 80 (5.4%) |
| 18 to 34 Years | 176 (5.3%) | 149 (5.2%) |
| 35 to 64 Years | 304 (10.0%) | 233 (7.1%) |
| 65 to 74 Years | 76 (9.1%) | 93 (8.2%) |
| 75 Years and over | 38 (7.8%) | 104 (12.0%) |
Disability Class: Ambulatory Difficulty
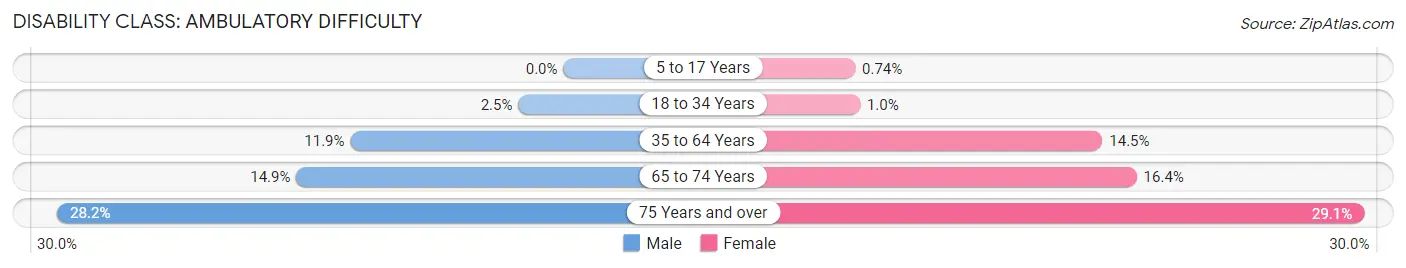
| Age Bracket | Male | Female |
| 5 to 17 Years | 0 (0.0%) | 11 (0.7%) |
| 18 to 34 Years | 84 (2.5%) | 29 (1.0%) |
| 35 to 64 Years | 360 (11.9%) | 473 (14.5%) |
| 65 to 74 Years | 124 (14.9%) | 186 (16.4%) |
| 75 Years and over | 137 (28.2%) | 251 (29.1%) |
Disability Class: Self-Care Difficulty
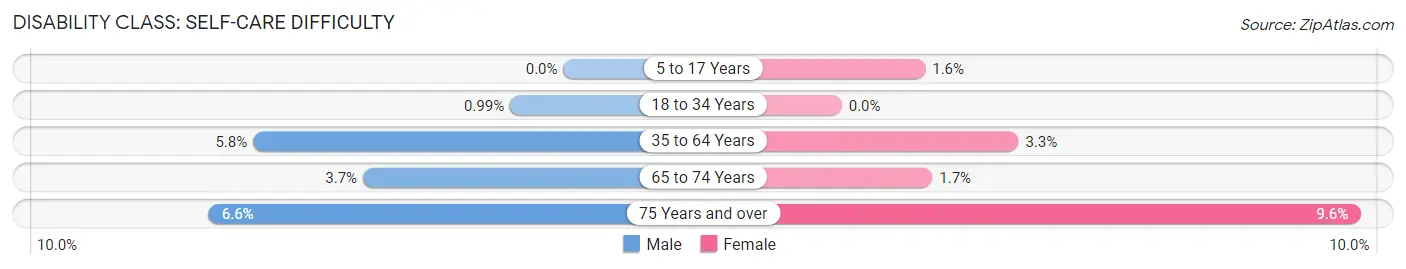
| Age Bracket | Male | Female |
| 5 to 17 Years | 0 (0.0%) | 23 (1.5%) |
| 18 to 34 Years | 33 (1.0%) | 0 (0.0%) |
| 35 to 64 Years | 175 (5.8%) | 107 (3.3%) |
| 65 to 74 Years | 31 (3.7%) | 19 (1.7%) |
| 75 Years and over | 32 (6.6%) | 83 (9.6%) |
Technology Access in Adrian
Computing Device Access in Adrian
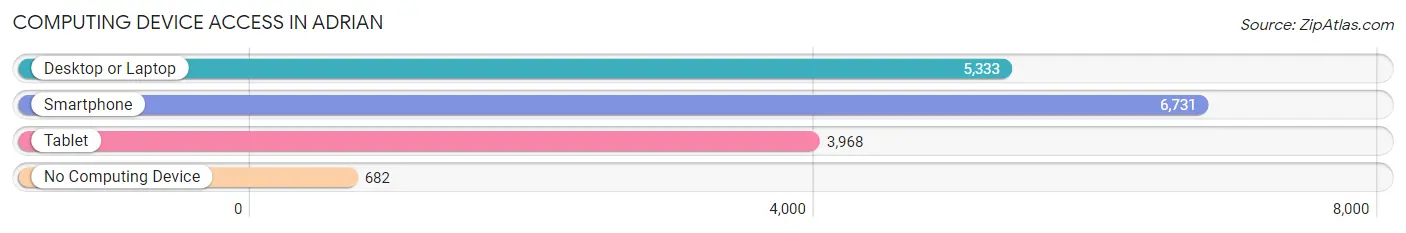
| Device Type | # Households | % Households |
| Desktop or Laptop | 5,333 | 67.0% |
| Smartphone | 6,731 | 84.6% |
| Tablet | 3,968 | 49.8% |
| No Computing Device | 682 | 8.6% |
| Total | 7,960 | 100.0% |
Internet Access in Adrian
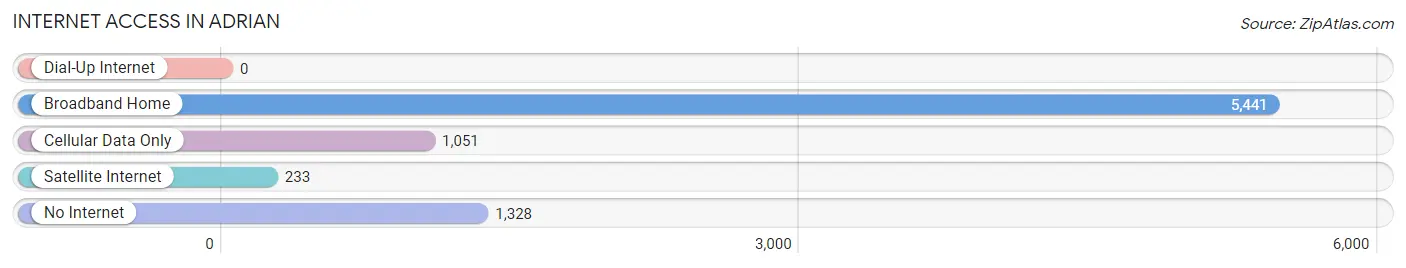
| Internet Type | # Households | % Households |
| Dial-Up Internet | 0 | 0.0% |
| Broadband Home | 5,441 | 68.3% |
| Cellular Data Only | 1,051 | 13.2% |
| Satellite Internet | 233 | 2.9% |
| No Internet | 1,328 | 16.7% |
| Total | 7,960 | 100.0% |
Adrian Summary
Adrian, Michigan is a city located in Lenawee County in the southeastern part of the state. It is the county seat and the largest city in the county. The city is situated on the banks of the River Raisin and is located about 50 miles southwest of Detroit. The population of Adrian was 21,133 at the 2010 census.
History
Adrian was founded in 1826 by Addison Comstock, a surveyor from New York. He named the city after his father, Adrian Comstock. The city was incorporated in 1828 and became the county seat of Lenawee County in 1829.
Adrian was an important stop on the Underground Railroad, a network of secret routes and safe houses used by African-American slaves to escape to freedom in the northern United States and Canada. The city was also a major center for the lumber industry in the late 19th century.
Geography
Adrian is located at 41°54'N 84°04'W (41.9000, -84.0667). According to the United States Census Bureau, the city has a total area of 8.2 square miles (21.2 km2), of which 8.1 square miles (21.0 km2) is land and 0.1 square miles (0.2 km2) is water.
Economy
Adrian is home to several major employers, including the Tecumseh Products Company, which manufactures small engines and outdoor power equipment, and the Adrian Steel Company, which manufactures commercial vehicle equipment. The city is also home to several smaller businesses, including manufacturing, retail, and service industries.
Demographics
As of the 2010 census, there were 21,133 people, 8,093 households, and 5,068 families residing in the city. The population density was 2,611.2 people per square mile (1,005.2/km2). There were 8,837 housing units at an average density of 1,093.2 per square mile (422.2/km2). The racial makeup of the city was 87.2% White, 8.2% African American, 0.4% Native American, 0.7% Asian, 0.1% Pacific Islander, 1.2% from other races, and 2.2% from two or more races. Hispanic or Latino of any race were 4.2% of the population.
The median income for a household in the city was $37,845, and the median income for a family was $48,919. Males had a median income of $36,945 versus $26,845 for females. The per capita income for the city was $19,845. About 8.7% of families and 11.2% of the population were below the poverty line, including 16.2% of those under age 18 and 6.7% of those age 65 or over.
Common Questions
What is Per Capita Income in Adrian?
Per Capita income in Adrian is $24,078.
What is the Median Family Income in Adrian?
Median Family Income in Adrian is $53,250.
What is the Median Household income in Adrian?
Median Household Income in Adrian is $40,797.
What is Income or Wage Gap in Adrian?
Income or Wage Gap in Adrian is 28.3%.
Women in Adrian earn 71.7 cents for every dollar earned by a man.
What is Family Income Deficit in Adrian?
Family Income Deficit in Adrian is $12,864.
Families that are below poverty line in Adrian earn $12,864 less on average than the poverty threshold level.
What is Inequality or Gini Index in Adrian?
Inequality or Gini Index in Adrian is 0.44.
What is the Total Population of Adrian?
Total Population of Adrian is 20,607.
What is the Total Male Population of Adrian?
Total Male Population of Adrian is 9,946.
What is the Total Female Population of Adrian?
Total Female Population of Adrian is 10,661.
What is the Ratio of Males per 100 Females in Adrian?
There are 93.29 Males per 100 Females in Adrian.
What is the Ratio of Females per 100 Males in Adrian?
There are 107.19 Females per 100 Males in Adrian.
What is the Median Population Age in Adrian?
Median Population Age in Adrian is 34.9 Years.
What is the Average Family Size in Adrian
Average Family Size in Adrian is 2.9 People.
What is the Average Household Size in Adrian
Average Household Size in Adrian is 2.3 People.
How Large is the Labor Force in Adrian?
There are 8,878 People in the Labor Forcein in Adrian.
What is the Percentage of People in the Labor Force in Adrian?
52.4% of People are in the Labor Force in Adrian.
What is the Unemployment Rate in Adrian?
Unemployment Rate in Adrian is 4.8%.