Eau Claire, MI Map & Demographics
Eau Claire Map
Eau Claire Overview
$28,380
PER CAPITA INCOME
$72,500
AVG FAMILY INCOME
$61,667
AVG HOUSEHOLD INCOME
22.2%
WAGE / INCOME GAP [ % ]
77.8¢/ $1
WAGE / INCOME GAP [ $ ]
0.39
INEQUALITY / GINI INDEX
604
TOTAL POPULATION
355
MALE POPULATION
249
FEMALE POPULATION
142.57
MALES / 100 FEMALES
70.14
FEMALES / 100 MALES
35.6
MEDIAN AGE
3.8
AVG FAMILY SIZE
2.8
AVG HOUSEHOLD SIZE
319
LABOR FORCE [ PEOPLE ]
70.1%
PERCENT IN LABOR FORCE
2.8%
UNEMPLOYMENT RATE
Eau Claire Zip Codes
Eau Claire Area Codes
Income in Eau Claire
Income Overview in Eau Claire
Per Capita Income in Eau Claire is $28,380, while median incomes of families and households are $72,500 and $61,667 respectively.
| Characteristic | Number | Measure |
| Per Capita Income | 604 | $28,380 |
| Median Family Income | 122 | $72,500 |
| Mean Family Income | 122 | $84,687 |
| Median Household Income | 216 | $61,667 |
| Mean Household Income | 216 | $72,023 |
| Income Deficit | 122 | $0 |
| Wage / Income Gap (%) | 604 | 22.20% |
| Wage / Income Gap ($) | 604 | 77.80¢ per $1 |
| Gini / Inequality Index | 604 | 0.39 |
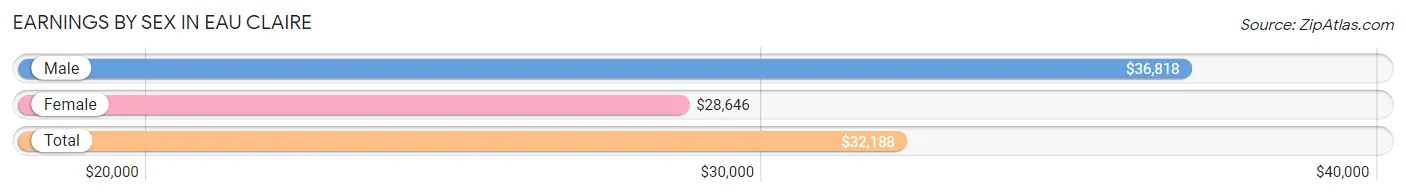
Earnings by Sex in Eau Claire
Average Earnings in Eau Claire are $32,188, $36,818 for men and $28,646 for women, a difference of 22.2%.
| Sex | Number | Average Earnings |
| Male | 182 (54.0%) | $36,818 |
| Female | 155 (46.0%) | $28,646 |
| Total | 337 (100.0%) | $32,188 |
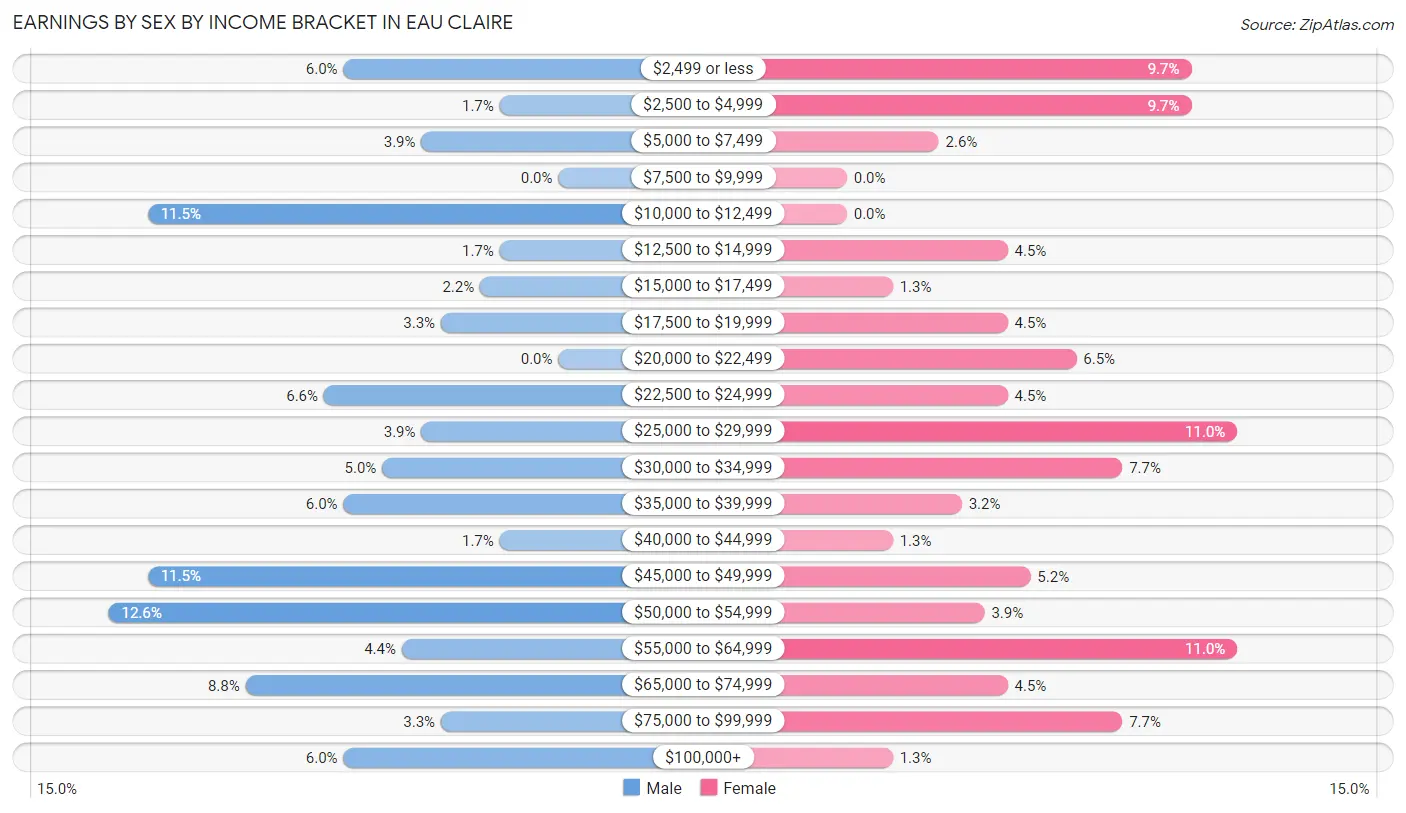
Earnings by Sex by Income Bracket in Eau Claire
The most common earnings brackets in Eau Claire are $50,000 to $54,999 for men (23 | 12.6%) and $25,000 to $29,999 for women (17 | 11.0%).
| Income | Male | Female |
| $2,499 or less | 11 (6.0%) | 15 (9.7%) |
| $2,500 to $4,999 | 3 (1.7%) | 15 (9.7%) |
| $5,000 to $7,499 | 7 (3.8%) | 4 (2.6%) |
| $7,500 to $9,999 | 0 (0.0%) | 0 (0.0%) |
| $10,000 to $12,499 | 21 (11.5%) | 0 (0.0%) |
| $12,500 to $14,999 | 3 (1.7%) | 7 (4.5%) |
| $15,000 to $17,499 | 4 (2.2%) | 2 (1.3%) |
| $17,500 to $19,999 | 6 (3.3%) | 7 (4.5%) |
| $20,000 to $22,499 | 0 (0.0%) | 10 (6.5%) |
| $22,500 to $24,999 | 12 (6.6%) | 7 (4.5%) |
| $25,000 to $29,999 | 7 (3.8%) | 17 (11.0%) |
| $30,000 to $34,999 | 9 (5.0%) | 12 (7.7%) |
| $35,000 to $39,999 | 11 (6.0%) | 5 (3.2%) |
| $40,000 to $44,999 | 3 (1.7%) | 2 (1.3%) |
| $45,000 to $49,999 | 21 (11.5%) | 8 (5.2%) |
| $50,000 to $54,999 | 23 (12.6%) | 6 (3.9%) |
| $55,000 to $64,999 | 8 (4.4%) | 17 (11.0%) |
| $65,000 to $74,999 | 16 (8.8%) | 7 (4.5%) |
| $75,000 to $99,999 | 6 (3.3%) | 12 (7.7%) |
| $100,000+ | 11 (6.0%) | 2 (1.3%) |
| Total | 182 (100.0%) | 155 (100.0%) |
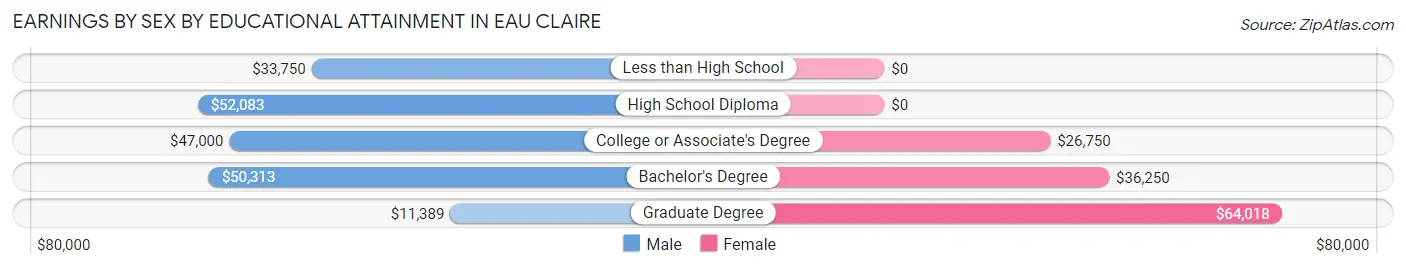
Earnings by Sex by Educational Attainment in Eau Claire
Average earnings in Eau Claire are $45,987 for men and $34,107 for women, a difference of 25.8%. Men with an educational attainment of high school diploma enjoy the highest average annual earnings of $52,083, while those with graduate degree education earn the least with $11,389. Women with an educational attainment of graduate degree earn the most with the average annual earnings of $64,018, while those with college or associate's degree education have the smallest earnings of $26,750.
| Educational Attainment | Male Income | Female Income |
| Less than High School | $33,750 | $0 |
| High School Diploma | $52,083 | $0 |
| College or Associate's Degree | $47,000 | $26,750 |
| Bachelor's Degree | $50,313 | $36,250 |
| Graduate Degree | $11,389 | $64,018 |
| Total | $45,987 | $34,107 |
Family Income in Eau Claire
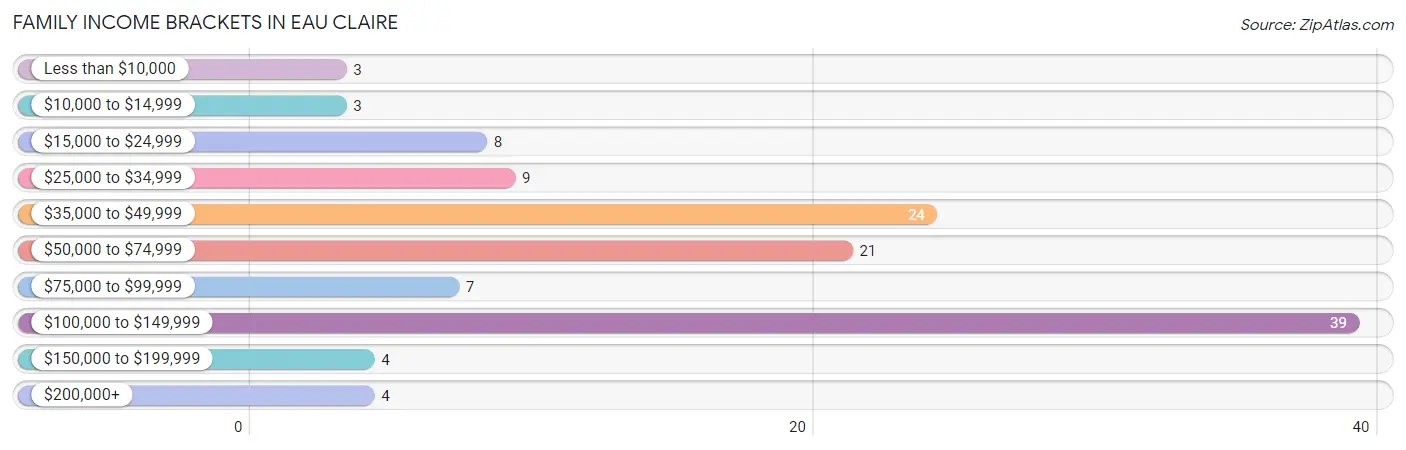
Family Income Brackets in Eau Claire
According to the Eau Claire family income data, there are 39 families falling into the $100,000 to $149,999 income range, which is the most common income bracket and makes up 32.0% of all families. Conversely, the less than $10,000 income bracket is the least frequent group with only 3 families (2.5%) belonging to this category.
| Income Bracket | # Families | % Families |
| Less than $10,000 | 3 | 2.5% |
| $10,000 to $14,999 | 3 | 2.5% |
| $15,000 to $24,999 | 8 | 6.6% |
| $25,000 to $34,999 | 9 | 7.4% |
| $35,000 to $49,999 | 24 | 19.7% |
| $50,000 to $74,999 | 21 | 17.2% |
| $75,000 to $99,999 | 7 | 5.7% |
| $100,000 to $149,999 | 39 | 32.0% |
| $150,000 to $199,999 | 4 | 3.3% |
| $200,000+ | 4 | 3.3% |
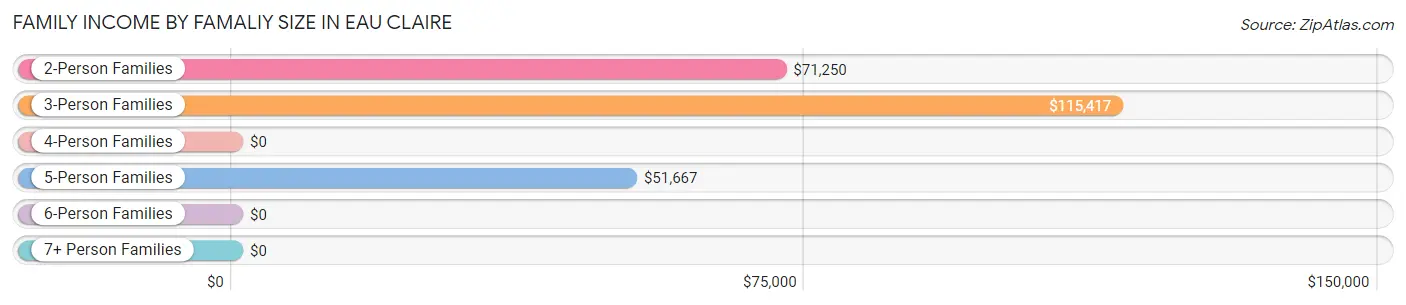
Family Income by Famaliy Size in Eau Claire
3-person families (39 | 32.0%) account for the highest median family income in Eau Claire with $115,417 per family, while 3-person families (39 | 32.0%) have the highest median income of $38,472 per family member.
| Income Bracket | # Families | Median Income |
| 2-Person Families | 40 (32.8%) | $71,250 |
| 3-Person Families | 39 (32.0%) | $115,417 |
| 4-Person Families | 26 (21.3%) | $0 |
| 5-Person Families | 8 (6.6%) | $51,667 |
| 6-Person Families | 9 (7.4%) | $0 |
| 7+ Person Families | 0 (0.0%) | $0 |
| Total | 122 (100.0%) | $72,500 |
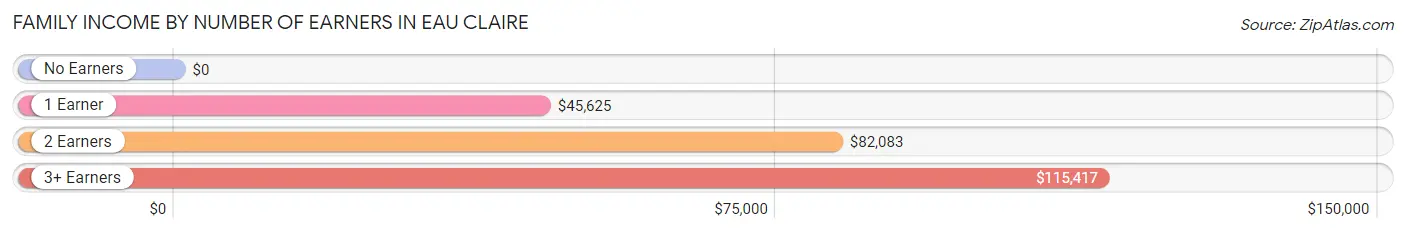
Family Income by Number of Earners in Eau Claire
| Number of Earners | # Families | Median Income |
| No Earners | 6 (4.9%) | $0 |
| 1 Earner | 32 (26.2%) | $45,625 |
| 2 Earners | 61 (50.0%) | $82,083 |
| 3+ Earners | 23 (18.9%) | $115,417 |
| Total | 122 (100.0%) | $72,500 |
Household Income in Eau Claire
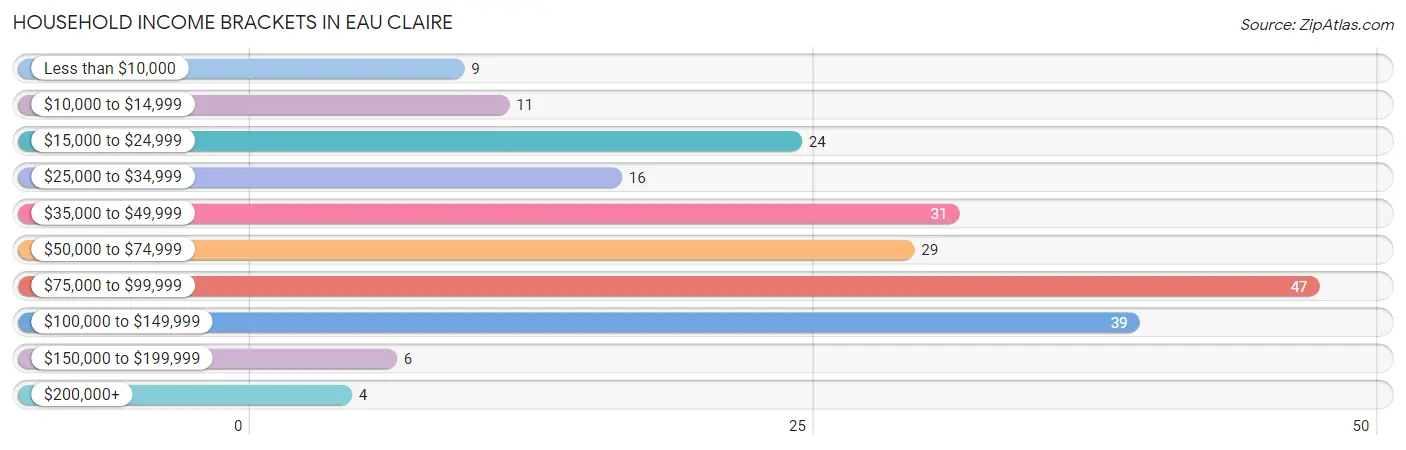
Household Income Brackets in Eau Claire
With 47 households falling in the category, the $75,000 to $99,999 income range is the most frequent in Eau Claire, accounting for 21.8% of all households. In contrast, only 4 households (1.8%) fall into the $200,000+ income bracket, making it the least populous group.
| Income Bracket | # Households | % Households |
| Less than $10,000 | 9 | 4.2% |
| $10,000 to $14,999 | 11 | 5.1% |
| $15,000 to $24,999 | 24 | 11.1% |
| $25,000 to $34,999 | 16 | 7.4% |
| $35,000 to $49,999 | 31 | 14.4% |
| $50,000 to $74,999 | 29 | 13.4% |
| $75,000 to $99,999 | 47 | 21.8% |
| $100,000 to $149,999 | 39 | 18.1% |
| $150,000 to $199,999 | 6 | 2.8% |
| $200,000+ | 4 | 1.9% |
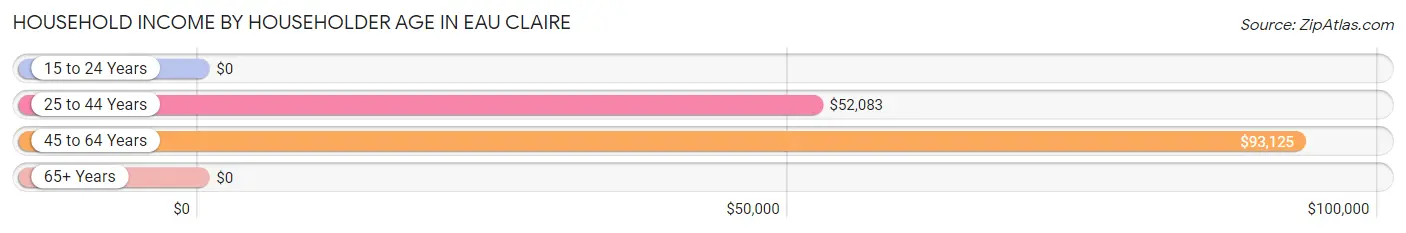
Household Income by Householder Age in Eau Claire
The median household income in Eau Claire is $61,667, with the highest median household income of $93,125 found in the 45 to 64 years age bracket for the primary householder. A total of 74 households (34.3%) fall into this category. Meanwhile, the 15 to 24 years age bracket for the primary householder has the lowest median household income of $0, with 7 households (3.2%) in this group.
| Income Bracket | # Households | Median Income |
| 15 to 24 Years | 7 (3.2%) | $0 |
| 25 to 44 Years | 83 (38.4%) | $52,083 |
| 45 to 64 Years | 74 (34.3%) | $93,125 |
| 65+ Years | 52 (24.1%) | $0 |
| Total | 216 (100.0%) | $61,667 |
Poverty in Eau Claire
Income Below Poverty by Sex and Age in Eau Claire
With 17.5% poverty level for males and 20.5% for females among the residents of Eau Claire, 35 to 44 year old males and 18 to 24 year old females are the most vulnerable to poverty, with 16 males (38.1%) and 11 females (52.4%) in their respective age groups living below the poverty level.
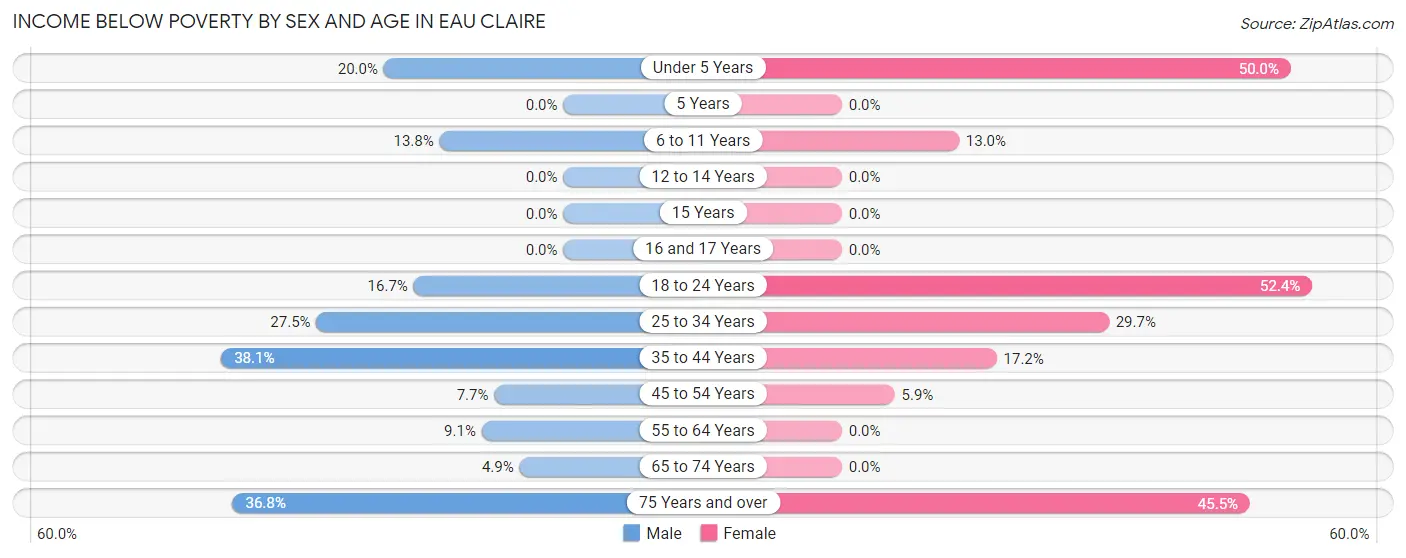
| Age Bracket | Male | Female |
| Under 5 Years | 9 (20.0%) | 13 (50.0%) |
| 5 Years | 0 (0.0%) | 0 (0.0%) |
| 6 to 11 Years | 4 (13.8%) | 3 (13.0%) |
| 12 to 14 Years | 0 (0.0%) | 0 (0.0%) |
| 15 Years | 0 (0.0%) | 0 (0.0%) |
| 16 and 17 Years | 0 (0.0%) | 0 (0.0%) |
| 18 to 24 Years | 6 (16.7%) | 11 (52.4%) |
| 25 to 34 Years | 11 (27.5%) | 11 (29.7%) |
| 35 to 44 Years | 16 (38.1%) | 5 (17.2%) |
| 45 to 54 Years | 3 (7.7%) | 3 (5.9%) |
| 55 to 64 Years | 4 (9.1%) | 0 (0.0%) |
| 65 to 74 Years | 2 (4.9%) | 0 (0.0%) |
| 75 Years and over | 7 (36.8%) | 5 (45.5%) |
| Total | 62 (17.5%) | 51 (20.5%) |
Income Above Poverty by Sex and Age in Eau Claire
According to the poverty statistics in Eau Claire, males aged 5 years and females aged 5 years are the age groups that are most secure financially, with 100.0% of males and 100.0% of females in these age groups living above the poverty line.
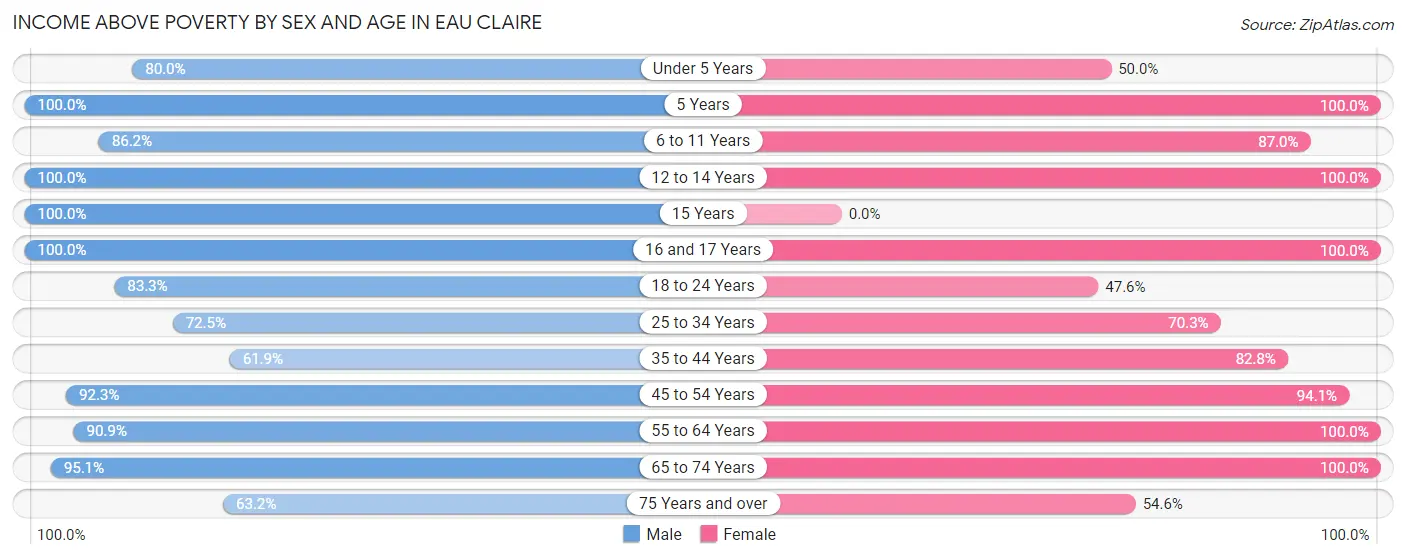
| Age Bracket | Male | Female |
| Under 5 Years | 36 (80.0%) | 13 (50.0%) |
| 5 Years | 6 (100.0%) | 3 (100.0%) |
| 6 to 11 Years | 25 (86.2%) | 20 (87.0%) |
| 12 to 14 Years | 10 (100.0%) | 4 (100.0%) |
| 15 Years | 3 (100.0%) | 0 (0.0%) |
| 16 and 17 Years | 1 (100.0%) | 11 (100.0%) |
| 18 to 24 Years | 30 (83.3%) | 10 (47.6%) |
| 25 to 34 Years | 29 (72.5%) | 26 (70.3%) |
| 35 to 44 Years | 26 (61.9%) | 24 (82.8%) |
| 45 to 54 Years | 36 (92.3%) | 48 (94.1%) |
| 55 to 64 Years | 40 (90.9%) | 26 (100.0%) |
| 65 to 74 Years | 39 (95.1%) | 7 (100.0%) |
| 75 Years and over | 12 (63.2%) | 6 (54.5%) |
| Total | 293 (82.5%) | 198 (79.5%) |
Income Below Poverty Among Married-Couple Families in Eau Claire
The poverty statistics for married-couple families in Eau Claire show that 13.5% or 12 of the total 89 families live below the poverty line. Families with 1 or 2 children have the highest poverty rate of 19.1%, comprising of 8 families. On the other hand, families with 3 or 4 children have the lowest poverty rate of 0.0%, which includes 0 families.
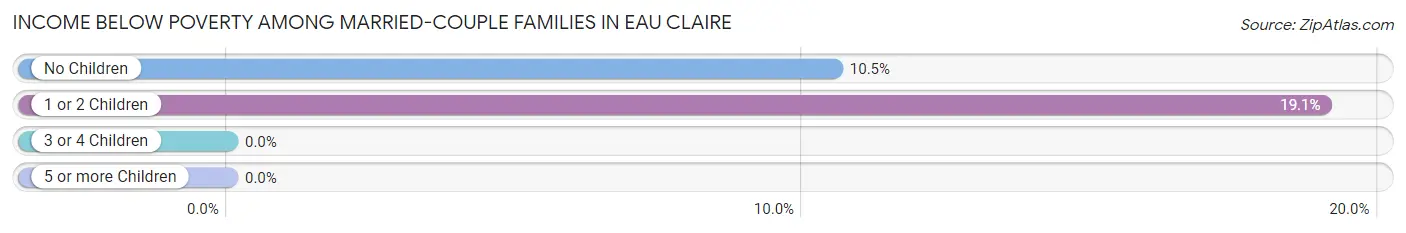
| Children | Above Poverty | Below Poverty |
| No Children | 34 (89.5%) | 4 (10.5%) |
| 1 or 2 Children | 34 (80.9%) | 8 (19.1%) |
| 3 or 4 Children | 9 (100.0%) | 0 (0.0%) |
| 5 or more Children | 0 (0.0%) | 0 (0.0%) |
| Total | 77 (86.5%) | 12 (13.5%) |
Income Below Poverty Among Single-Parent Households in Eau Claire
According to the poverty data in Eau Claire, 38.5% or 5 single-father households and 20.0% or 4 single-mother households are living below the poverty line. Among single-father households, those with 3 or 4 children have the highest poverty rate, with 2 households (100.0%) experiencing poverty. Likewise, among single-mother households, those with 1 or 2 children have the highest poverty rate, with 4 households (28.6%) falling below the poverty line.
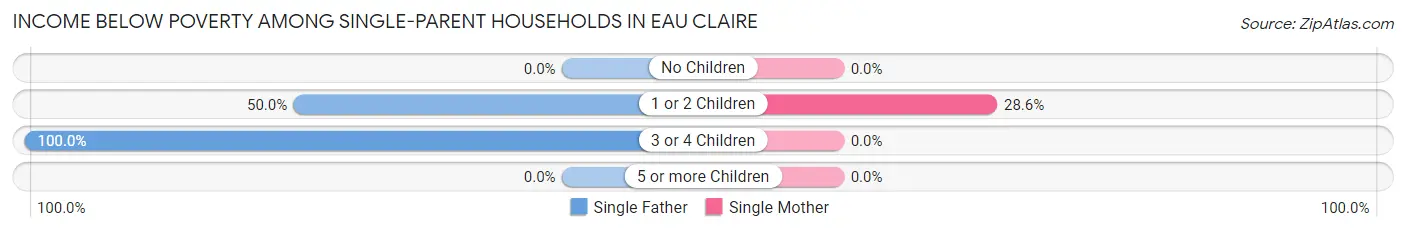
| Children | Single Father | Single Mother |
| No Children | 0 (0.0%) | 0 (0.0%) |
| 1 or 2 Children | 3 (50.0%) | 4 (28.6%) |
| 3 or 4 Children | 2 (100.0%) | 0 (0.0%) |
| 5 or more Children | 0 (0.0%) | 0 (0.0%) |
| Total | 5 (38.5%) | 4 (20.0%) |
Income Below Poverty Among Married-Couple vs Single-Parent Households in Eau Claire
The poverty data for Eau Claire shows that 12 of the married-couple family households (13.5%) and 9 of the single-parent households (27.3%) are living below the poverty level. Within the married-couple family households, those with 1 or 2 children have the highest poverty rate, with 8 households (19.1%) falling below the poverty line. Among the single-parent households, those with 3 or 4 children have the highest poverty rate, with 2 household (40.0%) living below poverty.
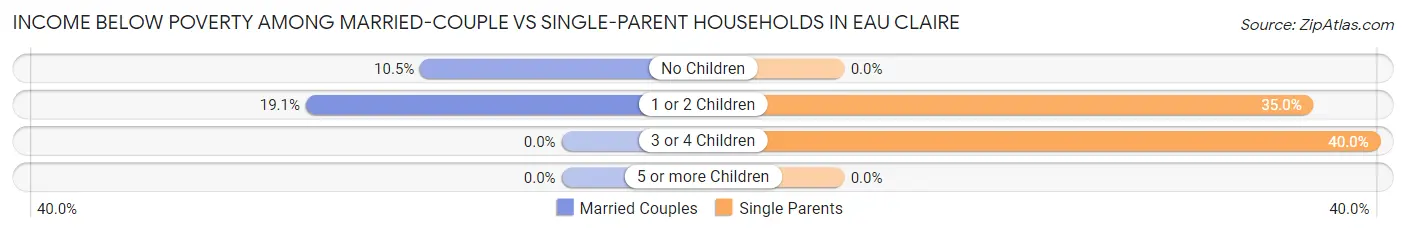
| Children | Married-Couple Families | Single-Parent Households |
| No Children | 4 (10.5%) | 0 (0.0%) |
| 1 or 2 Children | 8 (19.1%) | 7 (35.0%) |
| 3 or 4 Children | 0 (0.0%) | 2 (40.0%) |
| 5 or more Children | 0 (0.0%) | 0 (0.0%) |
| Total | 12 (13.5%) | 9 (27.3%) |
Race in Eau Claire
The most populous races in Eau Claire are White / Caucasian (477 | 79.0%), Hispanic or Latino (102 | 16.9%), and Two or more Races (61 | 10.1%).
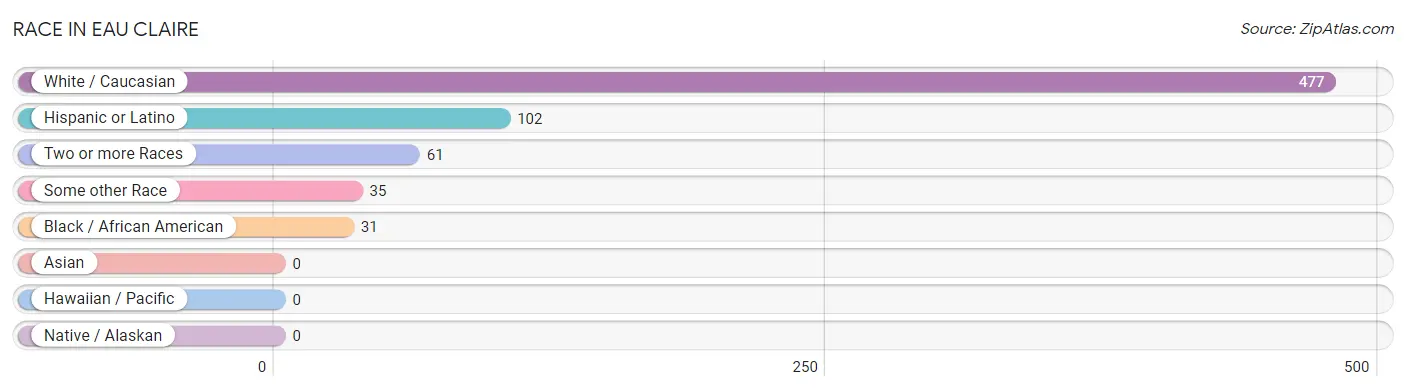
| Race | # Population | % Population |
| Asian | 0 | 0.0% |
| Black / African American | 31 | 5.1% |
| Hawaiian / Pacific | 0 | 0.0% |
| Hispanic or Latino | 102 | 16.9% |
| Native / Alaskan | 0 | 0.0% |
| White / Caucasian | 477 | 79.0% |
| Two or more Races | 61 | 10.1% |
| Some other Race | 35 | 5.8% |
| Total | 604 | 100.0% |
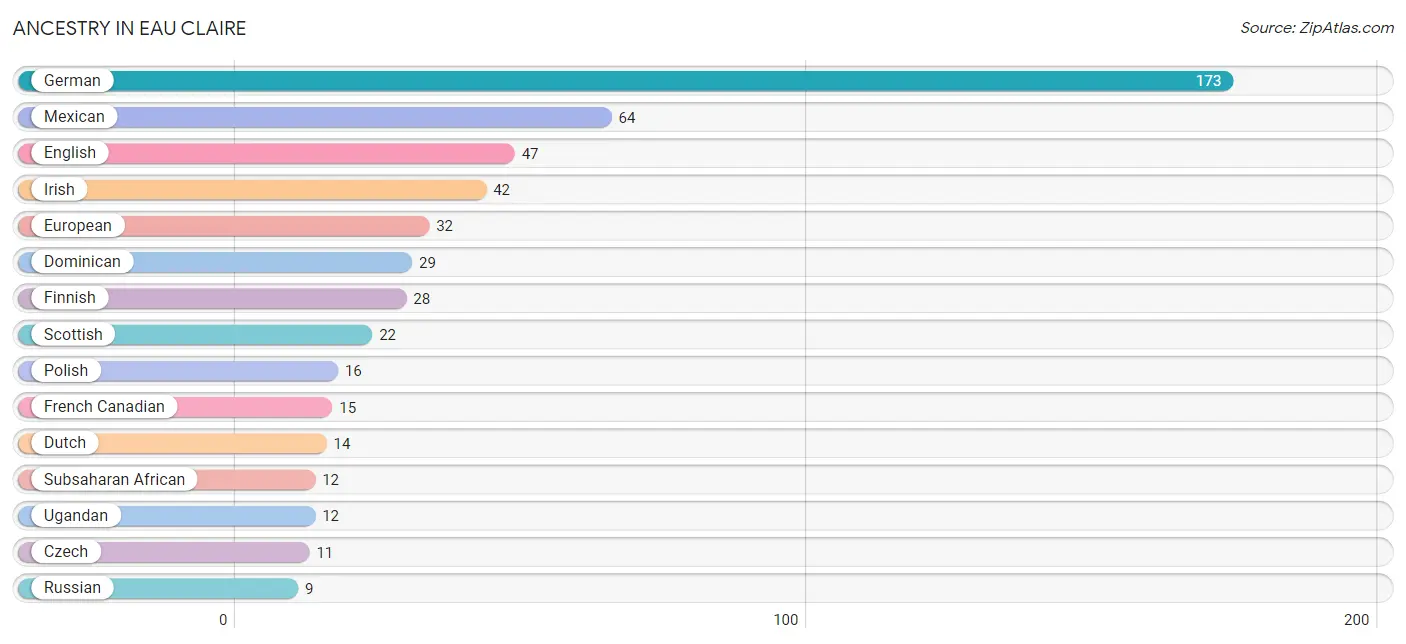
Ancestry in Eau Claire
The most populous ancestries reported in Eau Claire are German (173 | 28.6%), Mexican (64 | 10.6%), English (47 | 7.8%), Irish (42 | 7.0%), and European (32 | 5.3%), together accounting for 59.3% of all Eau Claire residents.
| Ancestry | # Population | % Population |
| American | 5 | 0.8% |
| Belgian | 2 | 0.3% |
| British | 5 | 0.8% |
| Czech | 11 | 1.8% |
| Dominican | 29 | 4.8% |
| Dutch | 14 | 2.3% |
| Ecuadorian | 4 | 0.7% |
| English | 47 | 7.8% |
| European | 32 | 5.3% |
| Finnish | 28 | 4.6% |
| French | 2 | 0.3% |
| French Canadian | 15 | 2.5% |
| German | 173 | 28.6% |
| Hungarian | 5 | 0.8% |
| Irish | 42 | 7.0% |
| Italian | 5 | 0.8% |
| Mexican | 64 | 10.6% |
| Northern European | 5 | 0.8% |
| Norwegian | 5 | 0.8% |
| Polish | 16 | 2.6% |
| Potawatomi | 1 | 0.2% |
| Puerto Rican | 5 | 0.8% |
| Russian | 9 | 1.5% |
| Scotch-Irish | 6 | 1.0% |
| Scottish | 22 | 3.6% |
| Slovak | 2 | 0.3% |
| South American | 4 | 0.7% |
| Subsaharan African | 12 | 2.0% |
| Swedish | 1 | 0.2% |
| Ugandan | 12 | 2.0% |
| Ukrainian | 2 | 0.3% | View All 31 Rows |
Immigrants in Eau Claire
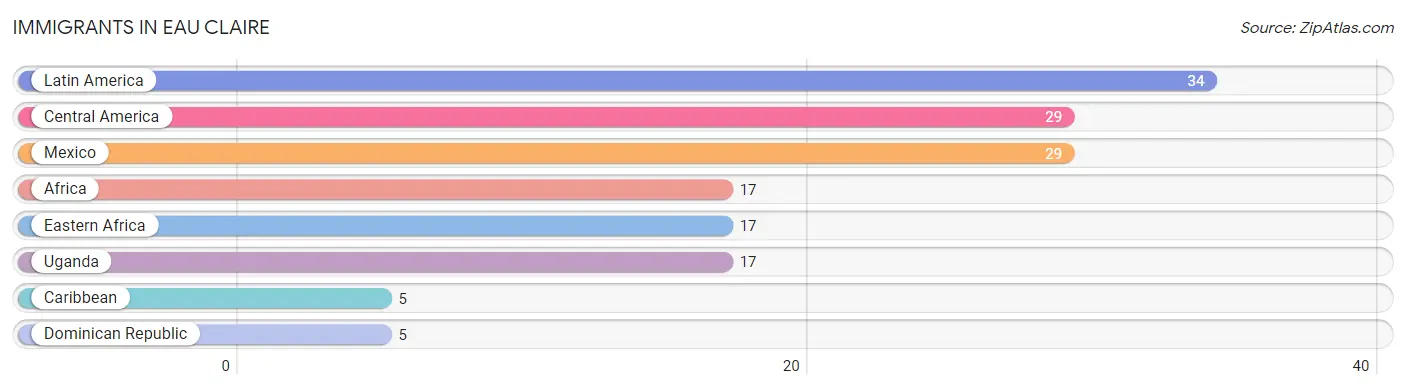
The most numerous immigrant groups reported in Eau Claire came from Latin America (34 | 5.6%), Central America (29 | 4.8%), Mexico (29 | 4.8%), Africa (17 | 2.8%), and Eastern Africa (17 | 2.8%), together accounting for 20.9% of all Eau Claire residents.
| Immigration Origin | # Population | % Population |
| Africa | 17 | 2.8% |
| Caribbean | 5 | 0.8% |
| Central America | 29 | 4.8% |
| Dominican Republic | 5 | 0.8% |
| Eastern Africa | 17 | 2.8% |
| Latin America | 34 | 5.6% |
| Mexico | 29 | 4.8% |
| Uganda | 17 | 2.8% | View All 8 Rows |
Sex and Age in Eau Claire
Sex and Age in Eau Claire
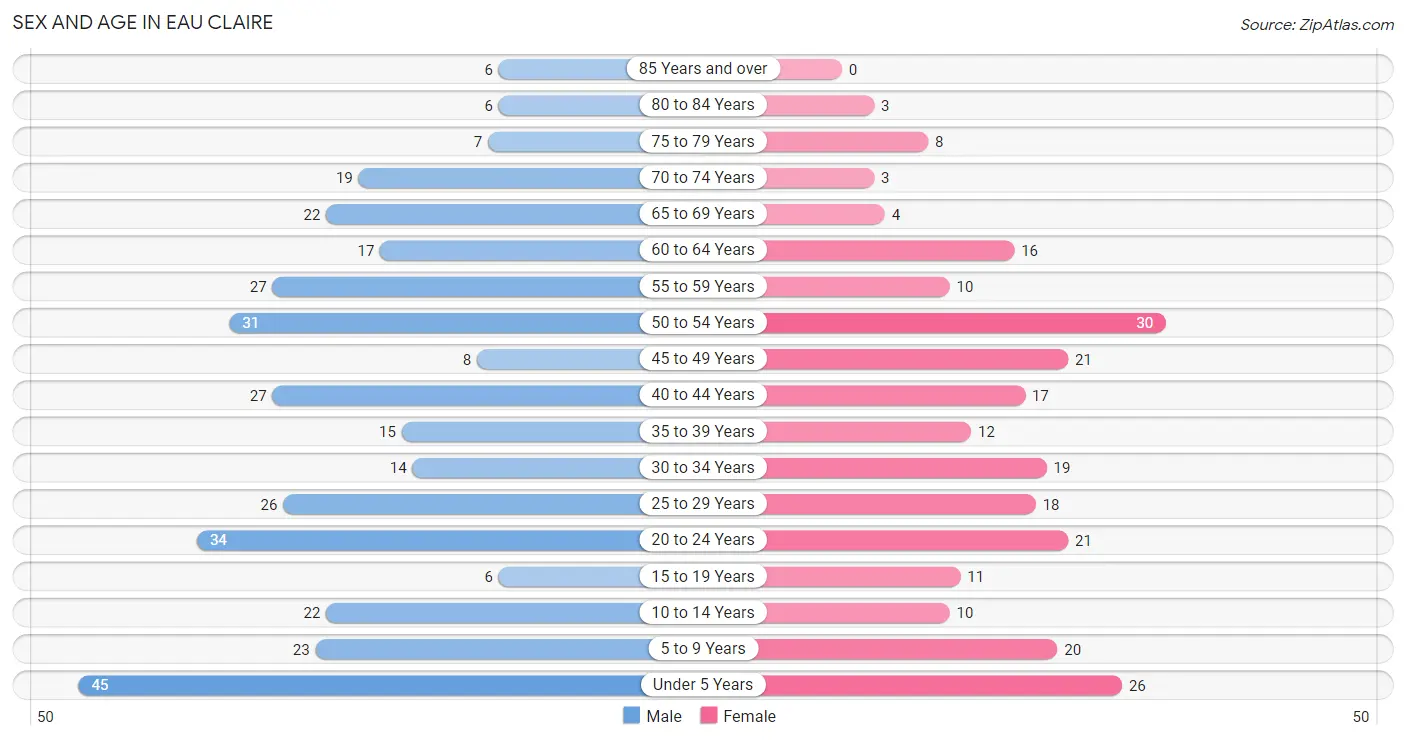
The most populous age groups in Eau Claire are Under 5 Years (45 | 12.7%) for men and 50 to 54 Years (30 | 12.0%) for women.
| Age Bracket | Male | Female |
| Under 5 Years | 45 (12.7%) | 26 (10.4%) |
| 5 to 9 Years | 23 (6.5%) | 20 (8.0%) |
| 10 to 14 Years | 22 (6.2%) | 10 (4.0%) |
| 15 to 19 Years | 6 (1.7%) | 11 (4.4%) |
| 20 to 24 Years | 34 (9.6%) | 21 (8.4%) |
| 25 to 29 Years | 26 (7.3%) | 18 (7.2%) |
| 30 to 34 Years | 14 (3.9%) | 19 (7.6%) |
| 35 to 39 Years | 15 (4.2%) | 12 (4.8%) |
| 40 to 44 Years | 27 (7.6%) | 17 (6.8%) |
| 45 to 49 Years | 8 (2.2%) | 21 (8.4%) |
| 50 to 54 Years | 31 (8.7%) | 30 (12.0%) |
| 55 to 59 Years | 27 (7.6%) | 10 (4.0%) |
| 60 to 64 Years | 17 (4.8%) | 16 (6.4%) |
| 65 to 69 Years | 22 (6.2%) | 4 (1.6%) |
| 70 to 74 Years | 19 (5.3%) | 3 (1.2%) |
| 75 to 79 Years | 7 (2.0%) | 8 (3.2%) |
| 80 to 84 Years | 6 (1.7%) | 3 (1.2%) |
| 85 Years and over | 6 (1.7%) | 0 (0.0%) |
| Total | 355 (100.0%) | 249 (100.0%) |
Families and Households in Eau Claire
Median Family Size in Eau Claire
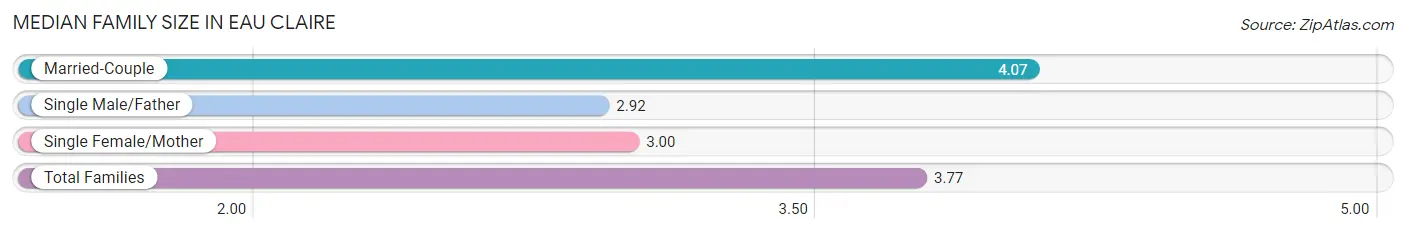
The median family size in Eau Claire is 3.77 persons per family, with married-couple families (89 | 73.0%) accounting for the largest median family size of 4.07 persons per family. On the other hand, single male/father families (13 | 10.7%) represent the smallest median family size with 2.92 persons per family.
| Family Type | # Families | Family Size |
| Married-Couple | 89 (73.0%) | 4.07 |
| Single Male/Father | 13 (10.7%) | 2.92 |
| Single Female/Mother | 20 (16.4%) | 3.00 |
| Total Families | 122 (100.0%) | 3.77 |
Median Household Size in Eau Claire
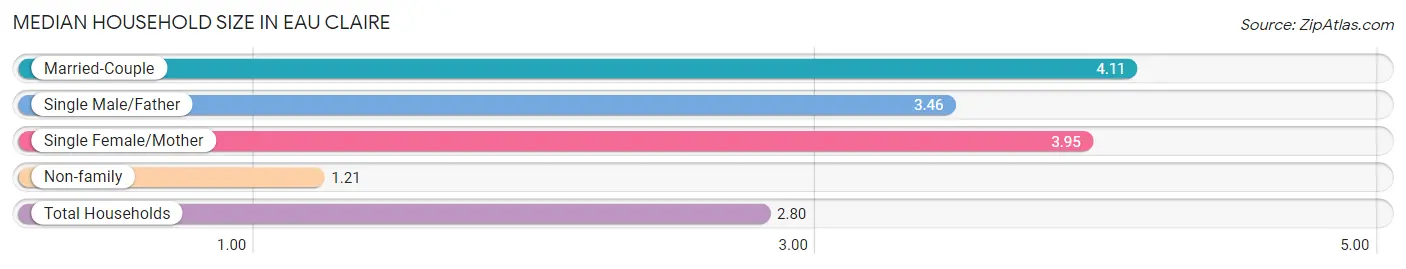
The median household size in Eau Claire is 2.80 persons per household, with married-couple households (89 | 41.2%) accounting for the largest median household size of 4.11 persons per household. non-family households (94 | 43.5%) represent the smallest median household size with 1.21 persons per household.
| Household Type | # Households | Household Size |
| Married-Couple | 89 (41.2%) | 4.11 |
| Single Male/Father | 13 (6.0%) | 3.46 |
| Single Female/Mother | 20 (9.3%) | 3.95 |
| Non-family | 94 (43.5%) | 1.21 |
| Total Households | 216 (100.0%) | 2.80 |
Household Size by Marriage Status in Eau Claire
Out of a total of 216 households in Eau Claire, 122 (56.5%) are family households, while 94 (43.5%) are nonfamily households. The most numerous type of family households are 3-person households, comprising 43, and the most common type of nonfamily households are 1-person households, comprising 76.
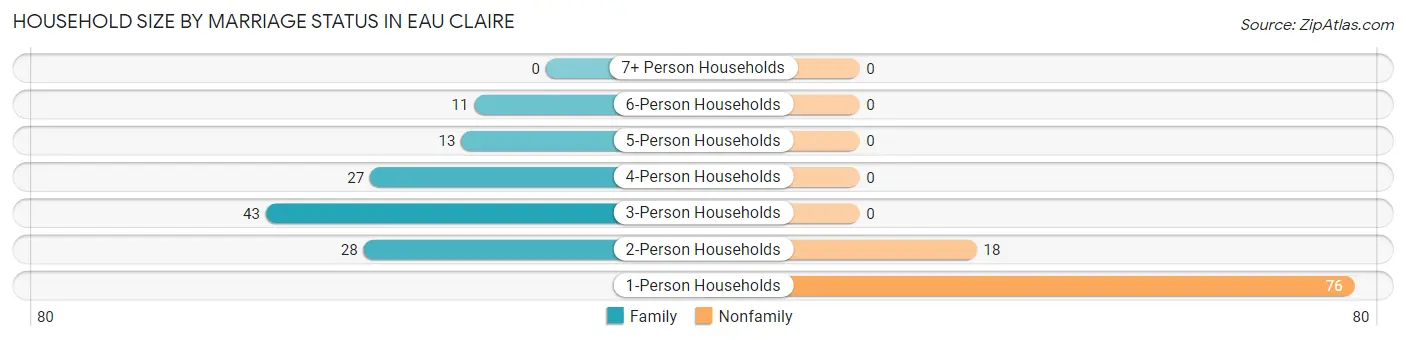
| Household Size | Family Households | Nonfamily Households |
| 1-Person Households | - | 76 (35.2%) |
| 2-Person Households | 28 (13.0%) | 18 (8.3%) |
| 3-Person Households | 43 (19.9%) | 0 (0.0%) |
| 4-Person Households | 27 (12.5%) | 0 (0.0%) |
| 5-Person Households | 13 (6.0%) | 0 (0.0%) |
| 6-Person Households | 11 (5.1%) | 0 (0.0%) |
| 7+ Person Households | 0 (0.0%) | 0 (0.0%) |
| Total | 122 (56.5%) | 94 (43.5%) |
Female Fertility in Eau Claire
Fertility by Age in Eau Claire
Average fertility rate in Eau Claire is 111.0 births per 1,000 women. Women in the age bracket of 20 to 34 years have the highest fertility rate with 207.0 births per 1,000 women. Women in the age bracket of 20 to 34 years acount for 85.7% of all women with births.
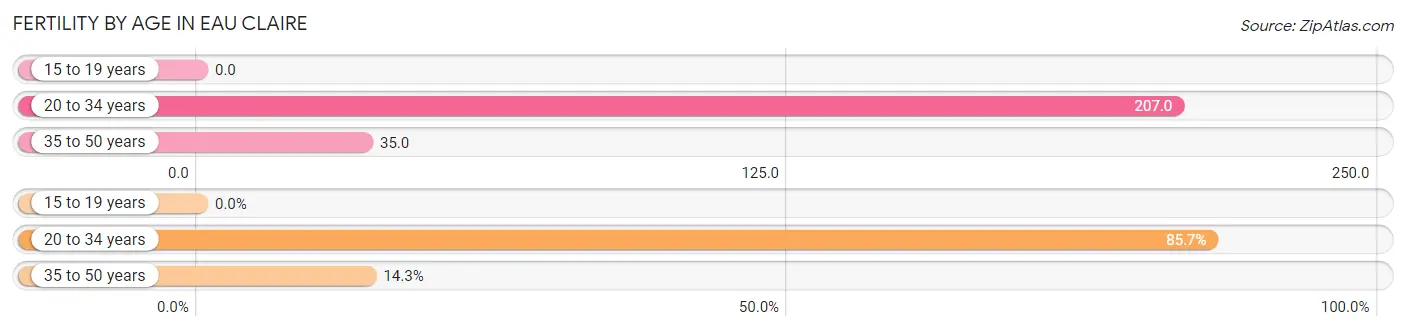
| Age Bracket | Women with Births | Births / 1,000 Women |
| 15 to 19 years | 0 (0.0%) | 0.0 |
| 20 to 34 years | 12 (85.7%) | 207.0 |
| 35 to 50 years | 2 (14.3%) | 35.0 |
| Total | 14 (100.0%) | 111.0 |
Fertility by Age by Marriage Status in Eau Claire
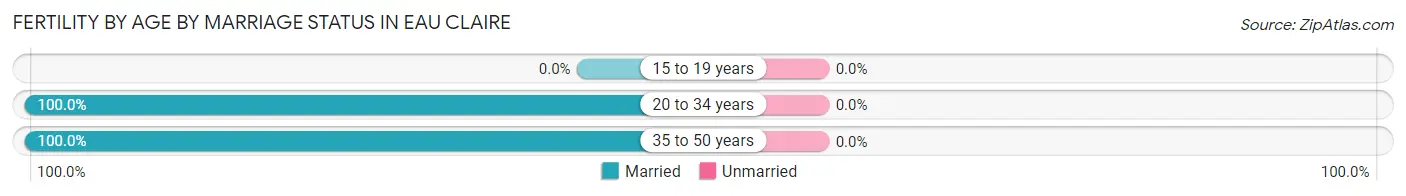
| Age Bracket | Married | Unmarried |
| 15 to 19 years | 0 (0.0%) | 0 (0.0%) |
| 20 to 34 years | 12 (100.0%) | 0 (0.0%) |
| 35 to 50 years | 2 (100.0%) | 0 (0.0%) |
| Total | 14 (100.0%) | 0 (0.0%) |
Fertility by Education in Eau Claire
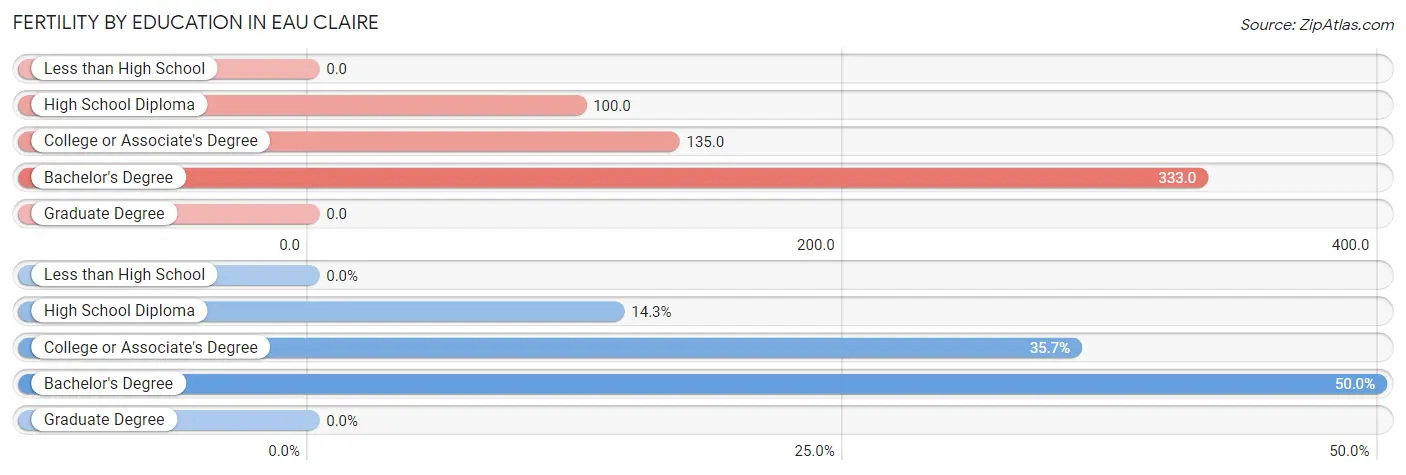
| Educational Attainment | Women with Births | Births / 1,000 Women |
| Less than High School | 0 (0.0%) | 0.0 |
| High School Diploma | 2 (14.3%) | 100.0 |
| College or Associate's Degree | 5 (35.7%) | 135.0 |
| Bachelor's Degree | 7 (50.0%) | 333.0 |
| Graduate Degree | 0 (0.0%) | 0.0 |
| Total | 14 (100.0%) | 111.0 |
Fertility by Education by Marriage Status in Eau Claire
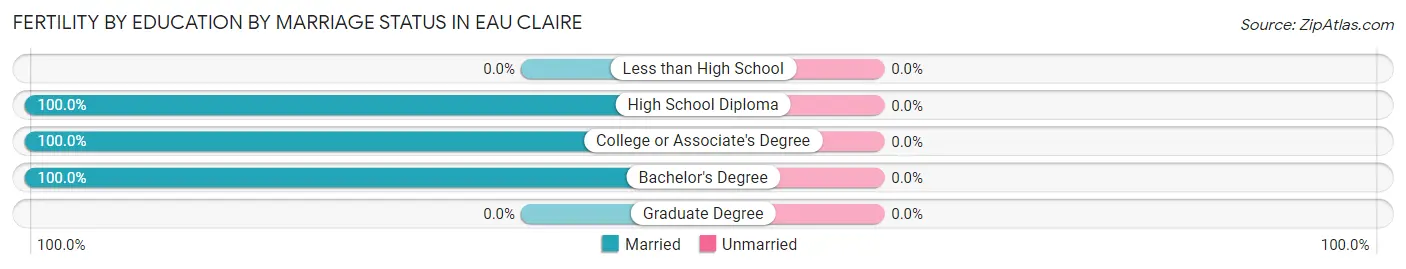
| Educational Attainment | Married | Unmarried |
| Less than High School | 0 (0.0%) | 0 (0.0%) |
| High School Diploma | 2 (100.0%) | 0 (0.0%) |
| College or Associate's Degree | 5 (100.0%) | 0 (0.0%) |
| Bachelor's Degree | 7 (100.0%) | 0 (0.0%) |
| Graduate Degree | 0 (0.0%) | 0 (0.0%) |
| Total | 14 (100.0%) | 0 (0.0%) |
Employment Characteristics in Eau Claire
Employment by Class of Employer in Eau Claire
Among the 298 employed individuals in Eau Claire, private company employees (194 | 65.1%), not-for-profit organizations (44 | 14.8%), and state government employees (18 | 6.0%) make up the most common classes of employment.
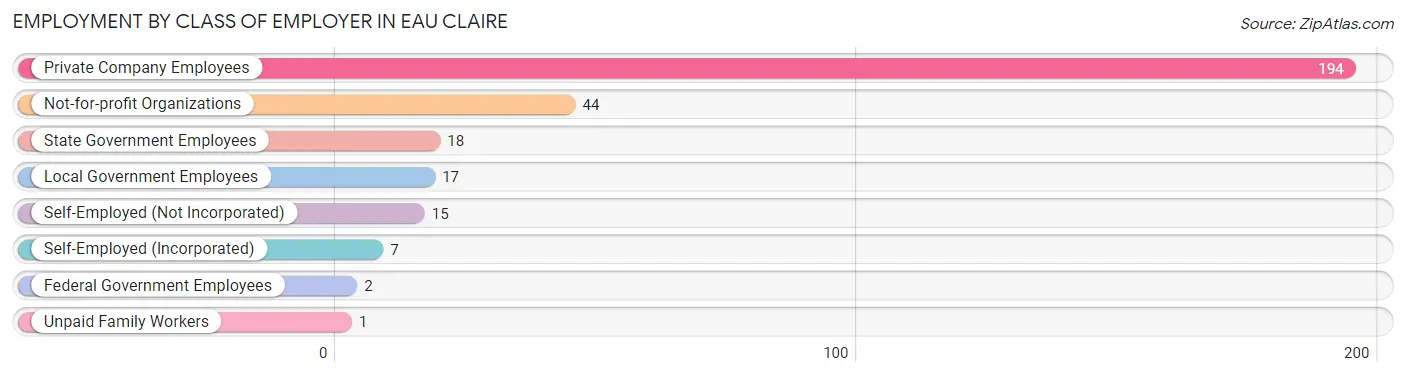
| Employer Class | # Employees | % Employees |
| Private Company Employees | 194 | 65.1% |
| Self-Employed (Incorporated) | 7 | 2.4% |
| Self-Employed (Not Incorporated) | 15 | 5.0% |
| Not-for-profit Organizations | 44 | 14.8% |
| Local Government Employees | 17 | 5.7% |
| State Government Employees | 18 | 6.0% |
| Federal Government Employees | 2 | 0.7% |
| Unpaid Family Workers | 1 | 0.3% |
| Total | 298 | 100.0% |
Employment Status by Age in Eau Claire
According to the labor force statistics for Eau Claire, out of the total population over 16 years of age (455), 70.1% or 319 individuals are in the labor force, with 2.8% or 9 of them unemployed. The age group with the highest labor force participation rate is 45 to 54 years, with 93.3% or 84 individuals in the labor force. Within the labor force, the 30 to 34 years age range has the highest percentage of unemployed individuals, with 13.8% or 4 of them being unemployed.
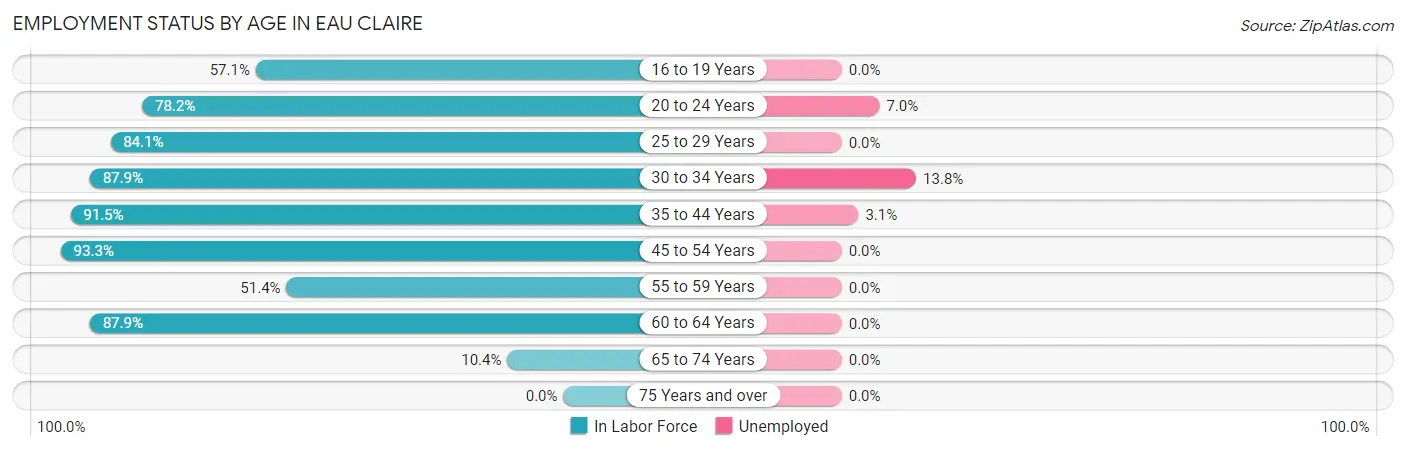
| Age Bracket | In Labor Force | Unemployed |
| 16 to 19 Years | 8 (57.1%) | 0 (0.0%) |
| 20 to 24 Years | 43 (78.2%) | 3 (7.0%) |
| 25 to 29 Years | 37 (84.1%) | 0 (0.0%) |
| 30 to 34 Years | 29 (87.9%) | 4 (13.8%) |
| 35 to 44 Years | 65 (91.5%) | 2 (3.1%) |
| 45 to 54 Years | 84 (93.3%) | 0 (0.0%) |
| 55 to 59 Years | 19 (51.4%) | 0 (0.0%) |
| 60 to 64 Years | 29 (87.9%) | 0 (0.0%) |
| 65 to 74 Years | 5 (10.4%) | 0 (0.0%) |
| 75 Years and over | 0 (0.0%) | 0 (0.0%) |
| Total | 319 (70.1%) | 9 (2.8%) |
Employment Status by Educational Attainment in Eau Claire
According to labor force statistics for Eau Claire, 85.4% of individuals (263) out of the total population between 25 and 64 years of age (308) are in the labor force, with 2.3% or 6 of them being unemployed. The group with the highest labor force participation rate are those with the educational attainment of less than high school, with 92.0% or 23 individuals in the labor force. Within the labor force, individuals with less than high school education have the highest percentage of unemployment, with 8.7% or 2 of them being unemployed.
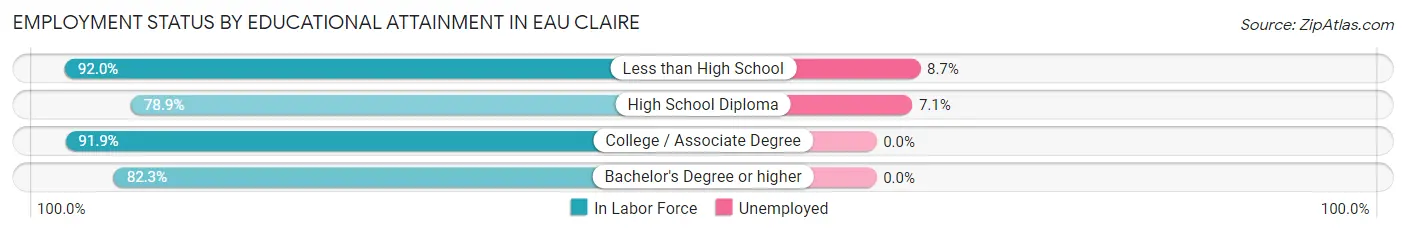
| Educational Attainment | In Labor Force | Unemployed |
| Less than High School | 23 (92.0%) | 2 (8.7%) |
| High School Diploma | 56 (78.9%) | 5 (7.1%) |
| College / Associate Degree | 91 (91.9%) | 0 (0.0%) |
| Bachelor's Degree or higher | 93 (82.3%) | 0 (0.0%) |
| Total | 263 (85.4%) | 7 (2.3%) |
Employment Occupations by Sex in Eau Claire
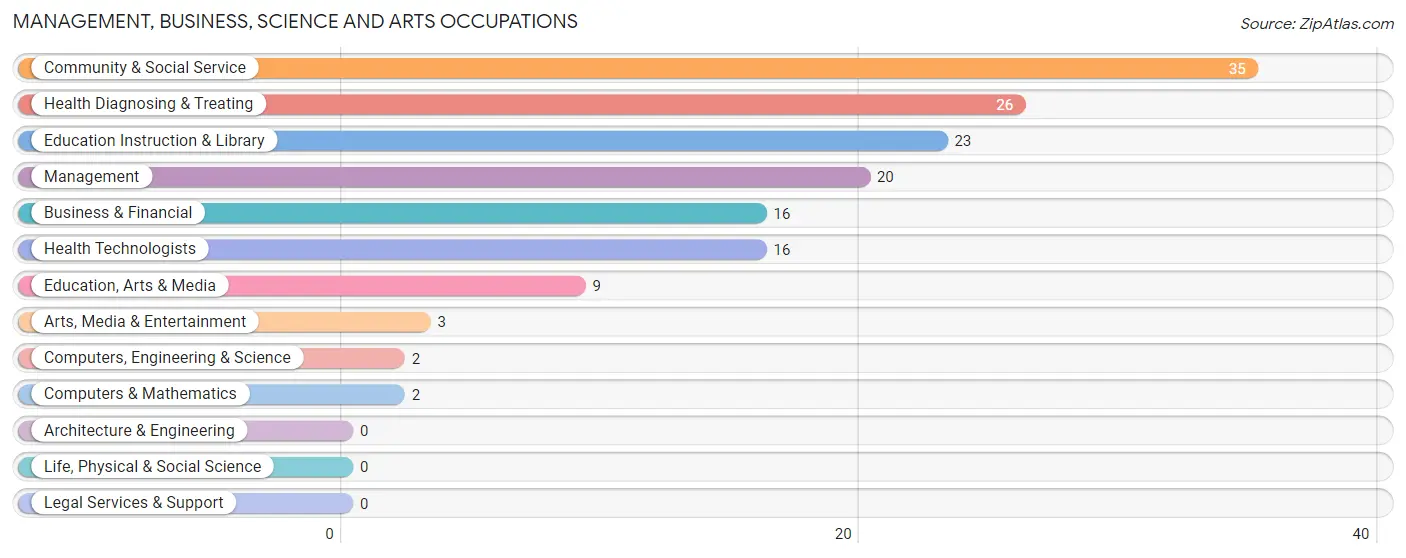
Management, Business, Science and Arts Occupations
The most common Management, Business, Science and Arts occupations in Eau Claire are Community & Social Service (35 | 11.3%), Health Diagnosing & Treating (26 | 8.4%), Education Instruction & Library (23 | 7.4%), Management (20 | 6.5%), and Business & Financial (16 | 5.2%).
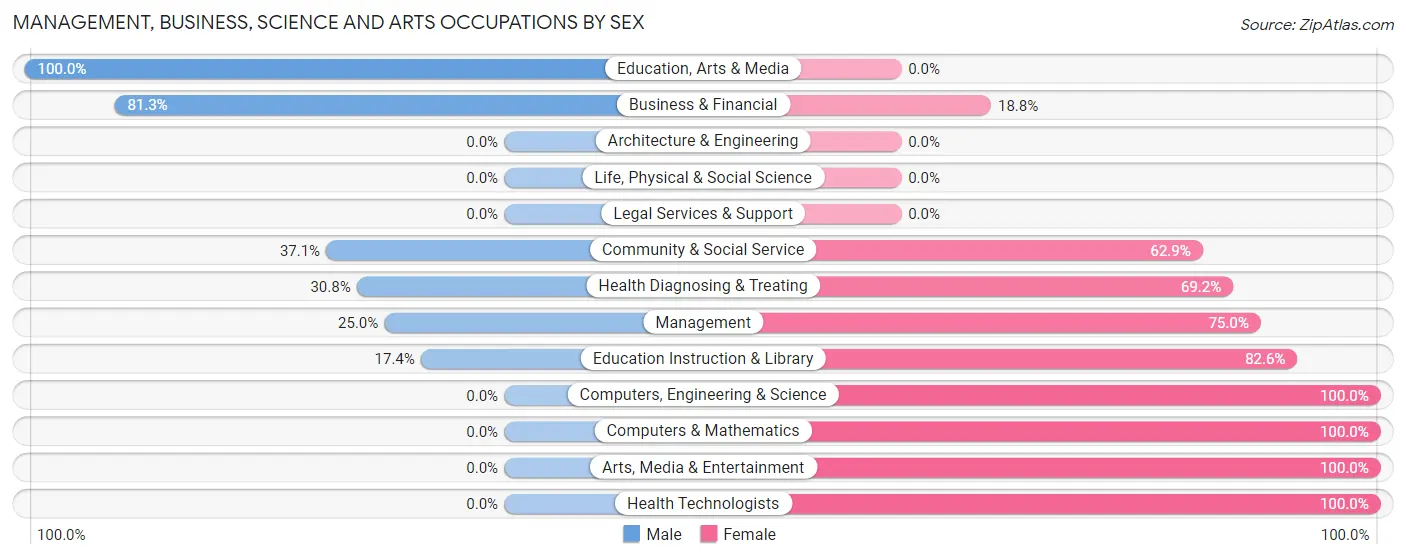
Management, Business, Science and Arts Occupations by Sex
Within the Management, Business, Science and Arts occupations in Eau Claire, the most male-oriented occupations are Education, Arts & Media (100.0%), Business & Financial (81.2%), and Community & Social Service (37.1%), while the most female-oriented occupations are Computers, Engineering & Science (100.0%), Computers & Mathematics (100.0%), and Arts, Media & Entertainment (100.0%).
| Occupation | Male | Female |
| Management | 5 (25.0%) | 15 (75.0%) |
| Business & Financial | 13 (81.2%) | 3 (18.8%) |
| Computers, Engineering & Science | 0 (0.0%) | 2 (100.0%) |
| Computers & Mathematics | 0 (0.0%) | 2 (100.0%) |
| Architecture & Engineering | 0 (0.0%) | 0 (0.0%) |
| Life, Physical & Social Science | 0 (0.0%) | 0 (0.0%) |
| Community & Social Service | 13 (37.1%) | 22 (62.9%) |
| Education, Arts & Media | 9 (100.0%) | 0 (0.0%) |
| Legal Services & Support | 0 (0.0%) | 0 (0.0%) |
| Education Instruction & Library | 4 (17.4%) | 19 (82.6%) |
| Arts, Media & Entertainment | 0 (0.0%) | 3 (100.0%) |
| Health Diagnosing & Treating | 8 (30.8%) | 18 (69.2%) |
| Health Technologists | 0 (0.0%) | 16 (100.0%) |
| Total (Category) | 39 (39.4%) | 60 (60.6%) |
| Total (Overall) | 165 (53.2%) | 145 (46.8%) |
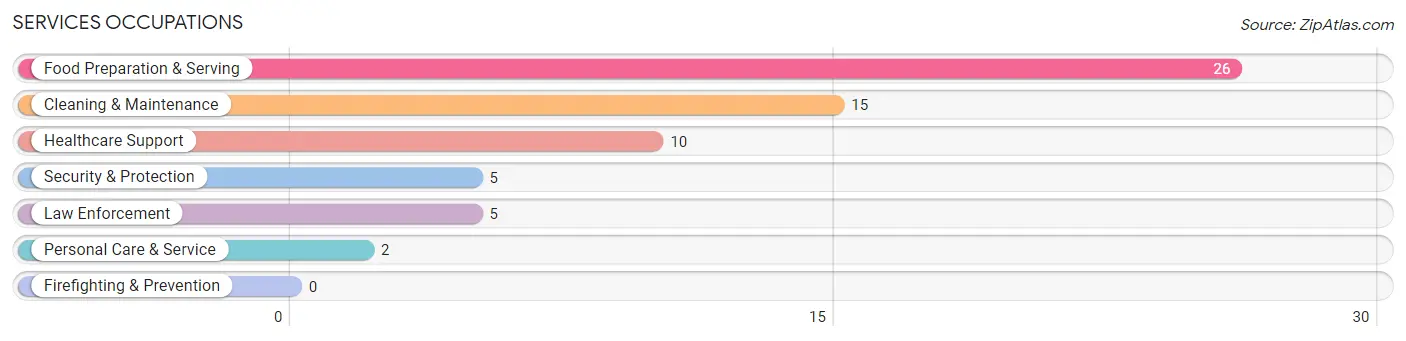
Services Occupations
The most common Services occupations in Eau Claire are Food Preparation & Serving (26 | 8.4%), Cleaning & Maintenance (15 | 4.8%), Healthcare Support (10 | 3.2%), Security & Protection (5 | 1.6%), and Law Enforcement (5 | 1.6%).
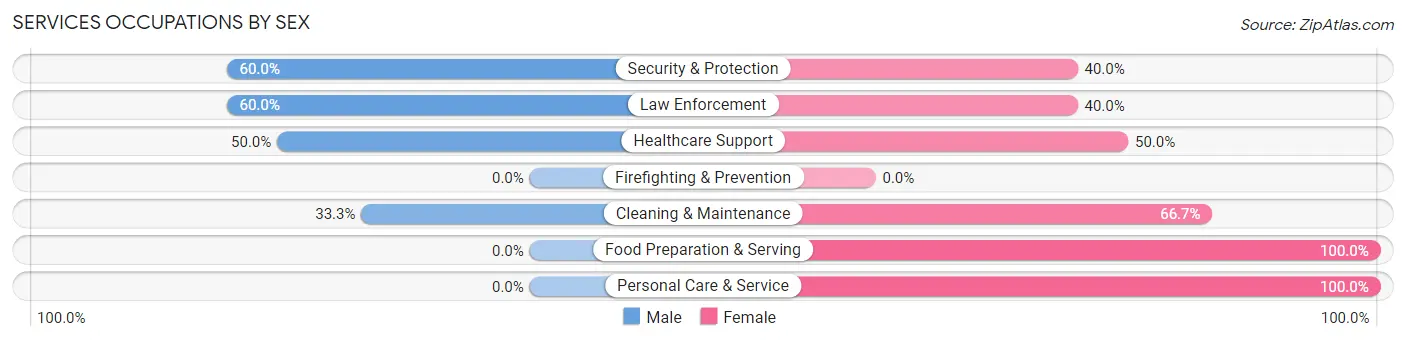
Services Occupations by Sex
Within the Services occupations in Eau Claire, the most male-oriented occupations are Security & Protection (60.0%), Law Enforcement (60.0%), and Healthcare Support (50.0%), while the most female-oriented occupations are Food Preparation & Serving (100.0%), Personal Care & Service (100.0%), and Cleaning & Maintenance (66.7%).
| Occupation | Male | Female |
| Healthcare Support | 5 (50.0%) | 5 (50.0%) |
| Security & Protection | 3 (60.0%) | 2 (40.0%) |
| Firefighting & Prevention | 0 (0.0%) | 0 (0.0%) |
| Law Enforcement | 3 (60.0%) | 2 (40.0%) |
| Food Preparation & Serving | 0 (0.0%) | 26 (100.0%) |
| Cleaning & Maintenance | 5 (33.3%) | 10 (66.7%) |
| Personal Care & Service | 0 (0.0%) | 2 (100.0%) |
| Total (Category) | 13 (22.4%) | 45 (77.6%) |
| Total (Overall) | 165 (53.2%) | 145 (46.8%) |
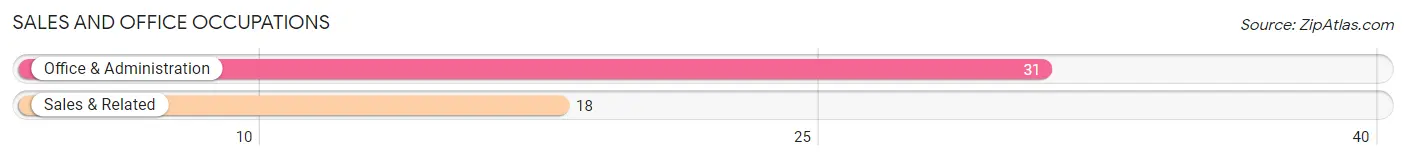
Sales and Office Occupations
The most common Sales and Office occupations in Eau Claire are Office & Administration (31 | 10.0%), and Sales & Related (18 | 5.8%).
Sales and Office Occupations by Sex
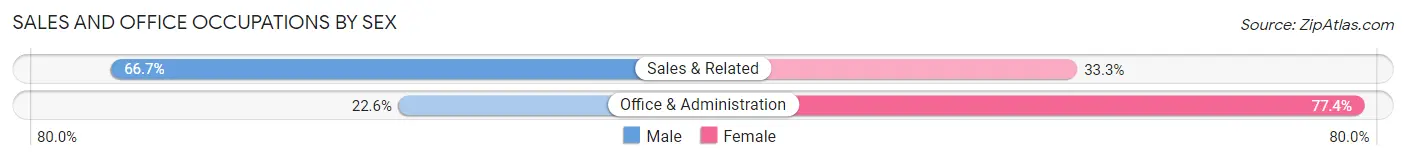
| Occupation | Male | Female |
| Sales & Related | 12 (66.7%) | 6 (33.3%) |
| Office & Administration | 7 (22.6%) | 24 (77.4%) |
| Total (Category) | 19 (38.8%) | 30 (61.2%) |
| Total (Overall) | 165 (53.2%) | 145 (46.8%) |
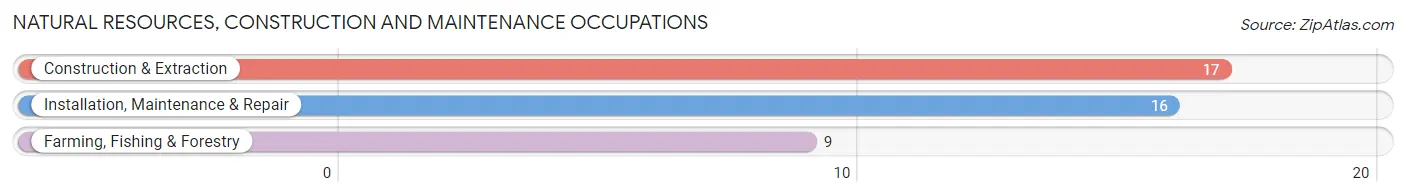
Natural Resources, Construction and Maintenance Occupations
The most common Natural Resources, Construction and Maintenance occupations in Eau Claire are Construction & Extraction (17 | 5.5%), Installation, Maintenance & Repair (16 | 5.2%), and Farming, Fishing & Forestry (9 | 2.9%).
Natural Resources, Construction and Maintenance Occupations by Sex
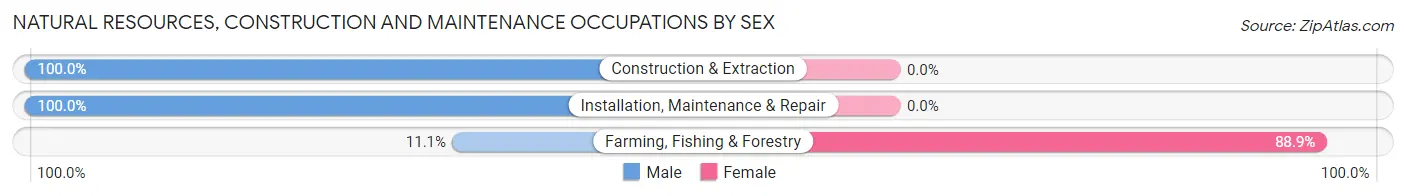
| Occupation | Male | Female |
| Farming, Fishing & Forestry | 1 (11.1%) | 8 (88.9%) |
| Construction & Extraction | 17 (100.0%) | 0 (0.0%) |
| Installation, Maintenance & Repair | 16 (100.0%) | 0 (0.0%) |
| Total (Category) | 34 (80.9%) | 8 (19.1%) |
| Total (Overall) | 165 (53.2%) | 145 (46.8%) |
Production, Transportation and Moving Occupations
The most common Production, Transportation and Moving occupations in Eau Claire are Production (50 | 16.1%), Material Moving (10 | 3.2%), and Transportation (2 | 0.6%).
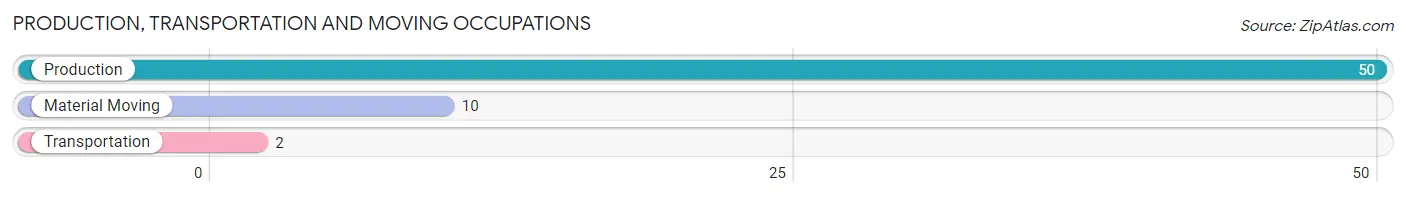
Production, Transportation and Moving Occupations by Sex
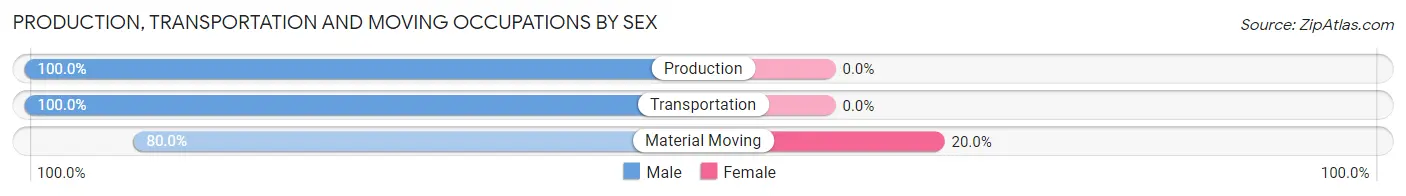
| Occupation | Male | Female |
| Production | 50 (100.0%) | 0 (0.0%) |
| Transportation | 2 (100.0%) | 0 (0.0%) |
| Material Moving | 8 (80.0%) | 2 (20.0%) |
| Total (Category) | 60 (96.8%) | 2 (3.2%) |
| Total (Overall) | 165 (53.2%) | 145 (46.8%) |
Employment Industries by Sex in Eau Claire
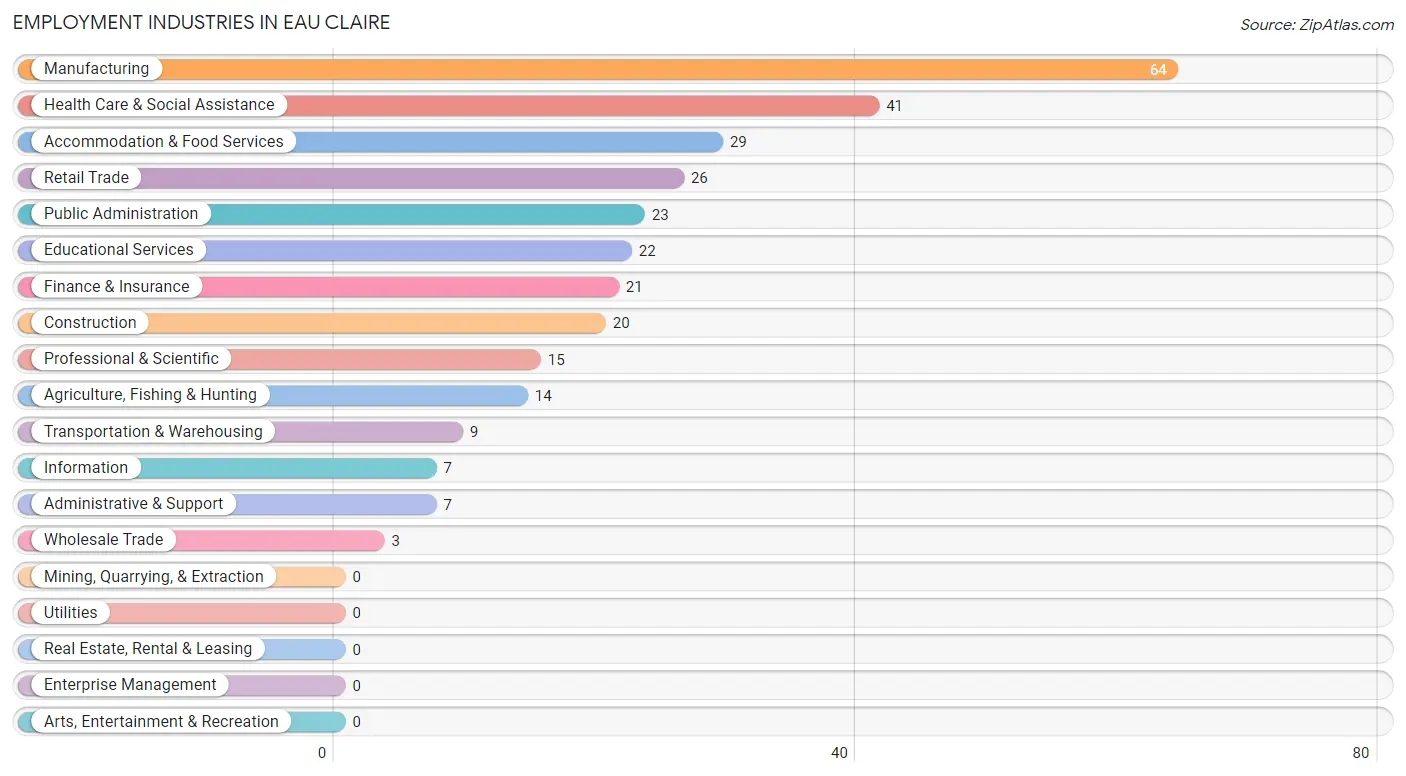
Employment Industries in Eau Claire
The major employment industries in Eau Claire include Manufacturing (64 | 20.6%), Health Care & Social Assistance (41 | 13.2%), Accommodation & Food Services (29 | 9.3%), Retail Trade (26 | 8.4%), and Public Administration (23 | 7.4%).
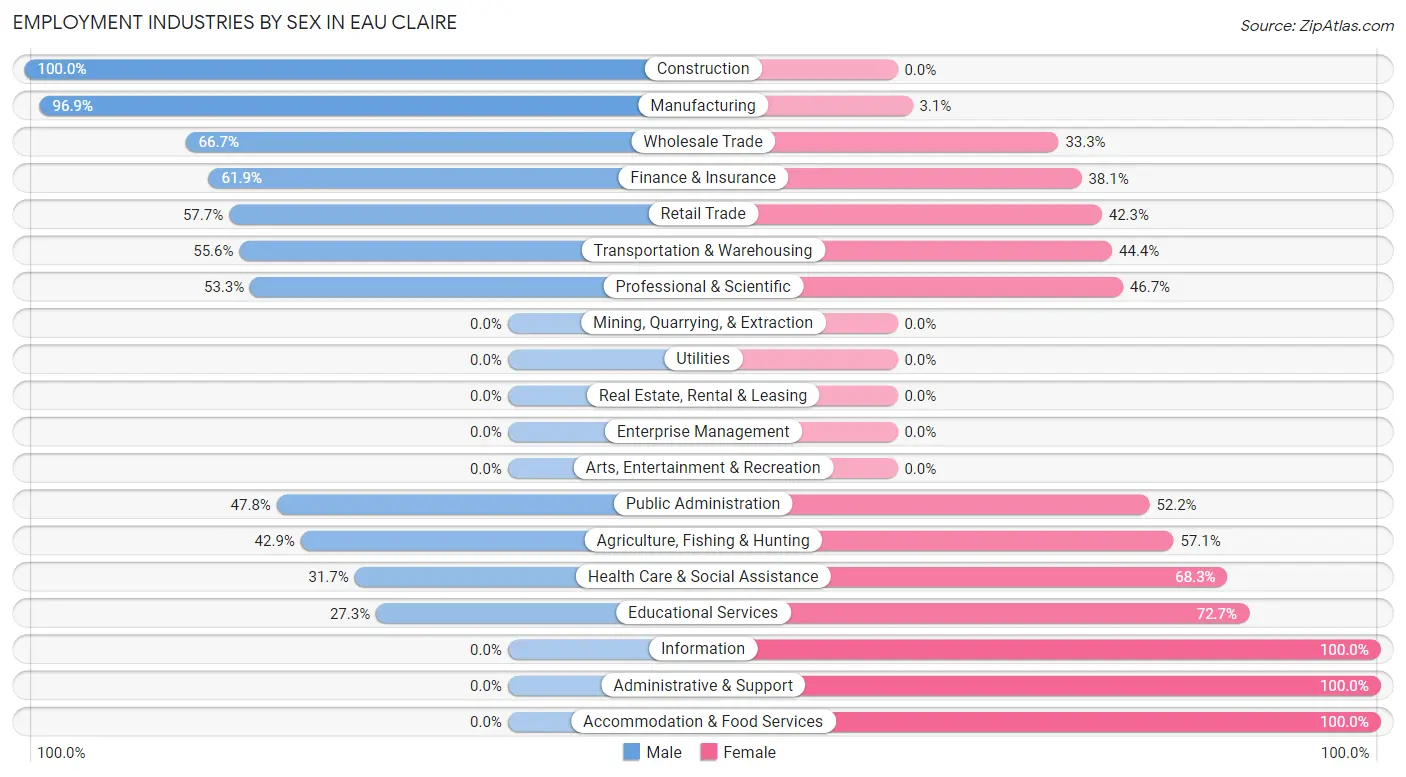
Employment Industries by Sex in Eau Claire
The Eau Claire industries that see more men than women are Construction (100.0%), Manufacturing (96.9%), and Wholesale Trade (66.7%), whereas the industries that tend to have a higher number of women are Information (100.0%), Administrative & Support (100.0%), and Accommodation & Food Services (100.0%).
| Industry | Male | Female |
| Agriculture, Fishing & Hunting | 6 (42.9%) | 8 (57.1%) |
| Mining, Quarrying, & Extraction | 0 (0.0%) | 0 (0.0%) |
| Construction | 20 (100.0%) | 0 (0.0%) |
| Manufacturing | 62 (96.9%) | 2 (3.1%) |
| Wholesale Trade | 2 (66.7%) | 1 (33.3%) |
| Retail Trade | 15 (57.7%) | 11 (42.3%) |
| Transportation & Warehousing | 5 (55.6%) | 4 (44.4%) |
| Utilities | 0 (0.0%) | 0 (0.0%) |
| Information | 0 (0.0%) | 7 (100.0%) |
| Finance & Insurance | 13 (61.9%) | 8 (38.1%) |
| Real Estate, Rental & Leasing | 0 (0.0%) | 0 (0.0%) |
| Professional & Scientific | 8 (53.3%) | 7 (46.7%) |
| Enterprise Management | 0 (0.0%) | 0 (0.0%) |
| Administrative & Support | 0 (0.0%) | 7 (100.0%) |
| Educational Services | 6 (27.3%) | 16 (72.7%) |
| Health Care & Social Assistance | 13 (31.7%) | 28 (68.3%) |
| Arts, Entertainment & Recreation | 0 (0.0%) | 0 (0.0%) |
| Accommodation & Food Services | 0 (0.0%) | 29 (100.0%) |
| Public Administration | 11 (47.8%) | 12 (52.2%) |
| Total | 165 (53.2%) | 145 (46.8%) |
Education in Eau Claire
School Enrollment in Eau Claire
The most common levels of schooling among the 112 students in Eau Claire are middle school (33 | 29.5%), elementary school (31 | 27.7%), and college / undergraduate (23 | 20.5%).
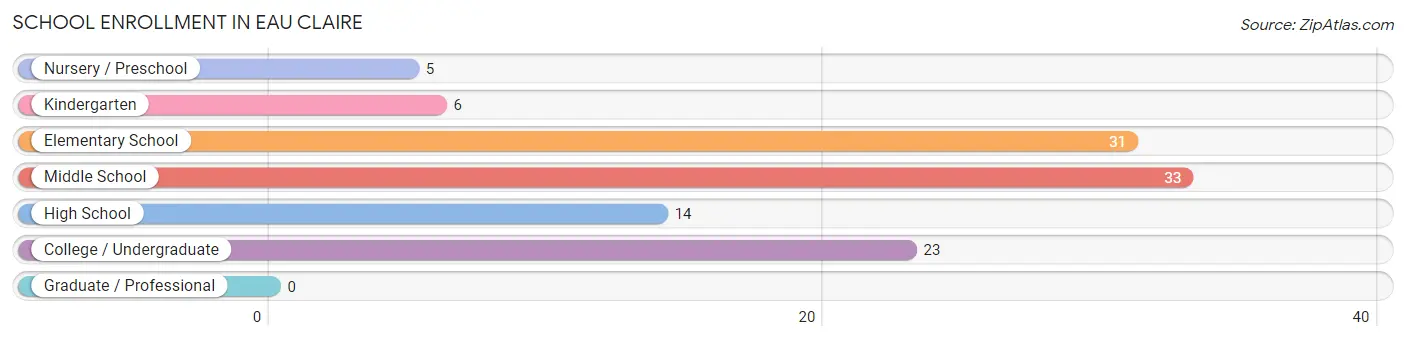
| School Level | # Students | % Students |
| Nursery / Preschool | 5 | 4.5% |
| Kindergarten | 6 | 5.4% |
| Elementary School | 31 | 27.7% |
| Middle School | 33 | 29.5% |
| High School | 14 | 12.5% |
| College / Undergraduate | 23 | 20.5% |
| Graduate / Professional | 0 | 0.0% |
| Total | 112 | 100.0% |
School Enrollment by Age by Funding Source in Eau Claire
Out of a total of 112 students who are enrolled in schools in Eau Claire, 11 (9.8%) attend a private institution, while the remaining 101 (90.2%) are enrolled in public schools. The age group of 3 to 4 year olds has the highest likelihood of being enrolled in private schools, with 4 (80.0% in the age bracket) enrolled. Conversely, the age group of 5 to 9 year old has the lowest likelihood of being enrolled in a private school, with 37 (100.0% in the age bracket) attending a public institution.
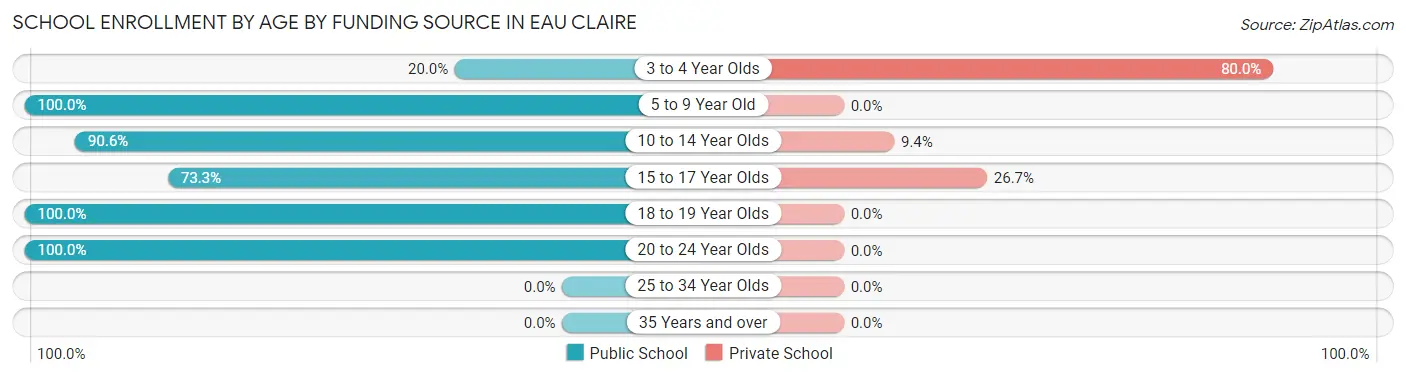
| Age Bracket | Public School | Private School |
| 3 to 4 Year Olds | 1 (20.0%) | 4 (80.0%) |
| 5 to 9 Year Old | 37 (100.0%) | 0 (0.0%) |
| 10 to 14 Year Olds | 29 (90.6%) | 3 (9.4%) |
| 15 to 17 Year Olds | 11 (73.3%) | 4 (26.7%) |
| 18 to 19 Year Olds | 2 (100.0%) | 0 (0.0%) |
| 20 to 24 Year Olds | 21 (100.0%) | 0 (0.0%) |
| 25 to 34 Year Olds | 0 (0.0%) | 0 (0.0%) |
| 35 Years and over | 0 (0.0%) | 0 (0.0%) |
| Total | 101 (90.2%) | 11 (9.8%) |
Educational Attainment by Field of Study in Eau Claire
Science & technology (34 | 21.9%), business (28 | 18.1%), liberal arts & history (23 | 14.8%), arts & humanities (23 | 14.8%), and social sciences (14 | 9.0%) are the most common fields of study among 155 individuals in Eau Claire who have obtained a bachelor's degree or higher.
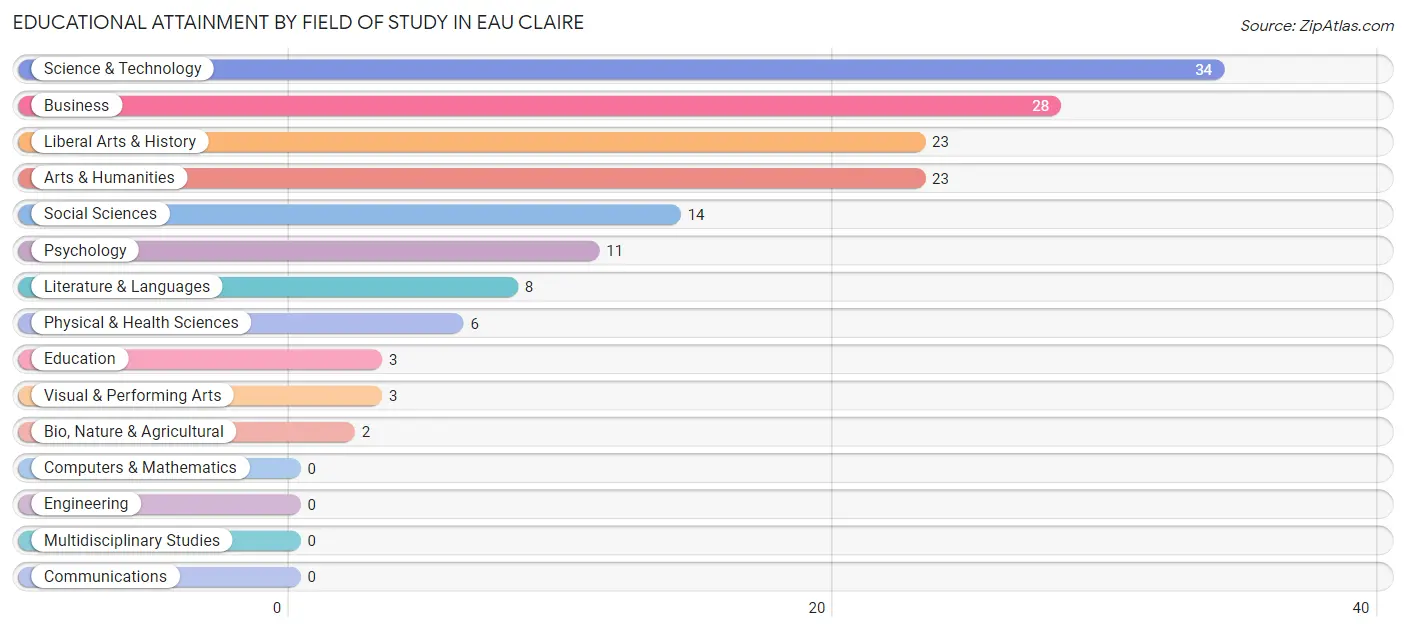
| Field of Study | # Graduates | % Graduates |
| Computers & Mathematics | 0 | 0.0% |
| Bio, Nature & Agricultural | 2 | 1.3% |
| Physical & Health Sciences | 6 | 3.9% |
| Psychology | 11 | 7.1% |
| Social Sciences | 14 | 9.0% |
| Engineering | 0 | 0.0% |
| Multidisciplinary Studies | 0 | 0.0% |
| Science & Technology | 34 | 21.9% |
| Business | 28 | 18.1% |
| Education | 3 | 1.9% |
| Literature & Languages | 8 | 5.2% |
| Liberal Arts & History | 23 | 14.8% |
| Visual & Performing Arts | 3 | 1.9% |
| Communications | 0 | 0.0% |
| Arts & Humanities | 23 | 14.8% |
| Total | 155 | 100.0% |
Transportation & Commute in Eau Claire
Vehicle Availability by Sex in Eau Claire
The most prevalent vehicle ownership categories in Eau Claire are males with 3 vehicles (74, accounting for 45.7%) and females with 3 vehicles (52, making up 54.4%).
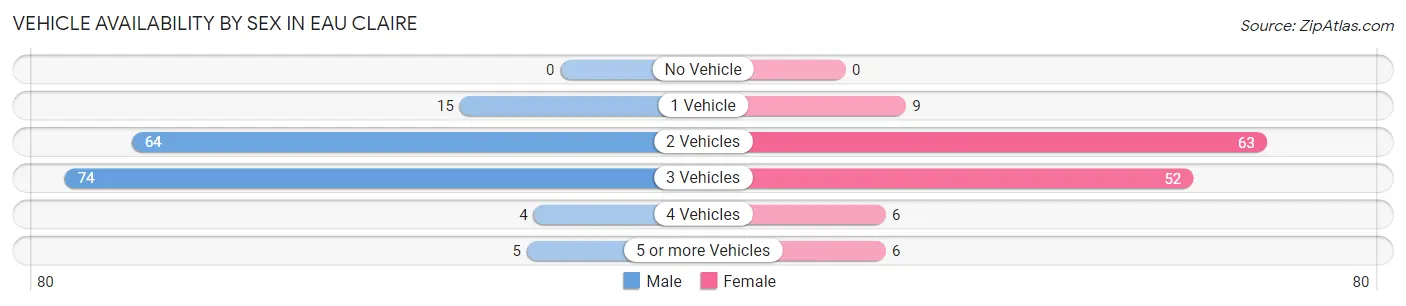
| Vehicles Available | Male | Female |
| No Vehicle | 0 (0.0%) | 0 (0.0%) |
| 1 Vehicle | 15 (9.3%) | 9 (6.6%) |
| 2 Vehicles | 64 (39.5%) | 63 (46.3%) |
| 3 Vehicles | 74 (45.7%) | 52 (38.2%) |
| 4 Vehicles | 4 (2.5%) | 6 (4.4%) |
| 5 or more Vehicles | 5 (3.1%) | 6 (4.4%) |
| Total | 162 (100.0%) | 136 (100.0%) |
Commute Time in Eau Claire
The most frequently occuring commute durations in Eau Claire are 5 to 9 minutes (40 commuters, 13.6%), 25 to 29 minutes (40 commuters, 13.6%), and 30 to 34 minutes (40 commuters, 13.6%).
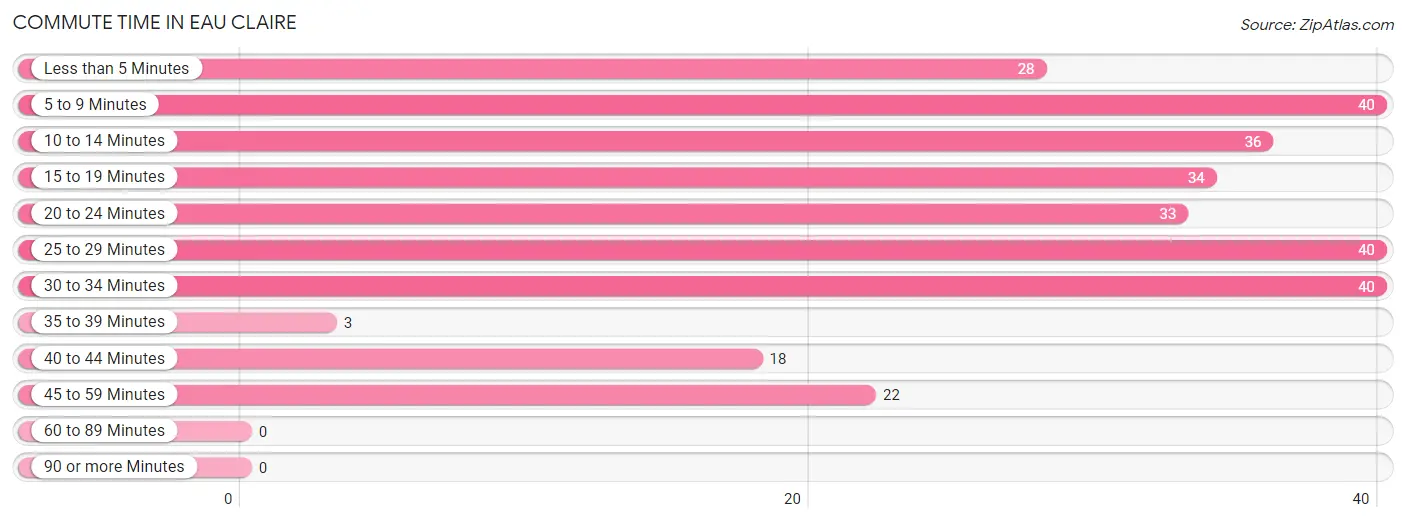
| Commute Time | # Commuters | % Commuters |
| Less than 5 Minutes | 28 | 9.5% |
| 5 to 9 Minutes | 40 | 13.6% |
| 10 to 14 Minutes | 36 | 12.2% |
| 15 to 19 Minutes | 34 | 11.6% |
| 20 to 24 Minutes | 33 | 11.2% |
| 25 to 29 Minutes | 40 | 13.6% |
| 30 to 34 Minutes | 40 | 13.6% |
| 35 to 39 Minutes | 3 | 1.0% |
| 40 to 44 Minutes | 18 | 6.1% |
| 45 to 59 Minutes | 22 | 7.5% |
| 60 to 89 Minutes | 0 | 0.0% |
| 90 or more Minutes | 0 | 0.0% |
Commute Time by Sex in Eau Claire
The most common commute times in Eau Claire are 5 to 9 minutes (31 commuters, 19.3%) for males and 25 to 29 minutes (32 commuters, 24.1%) for females.
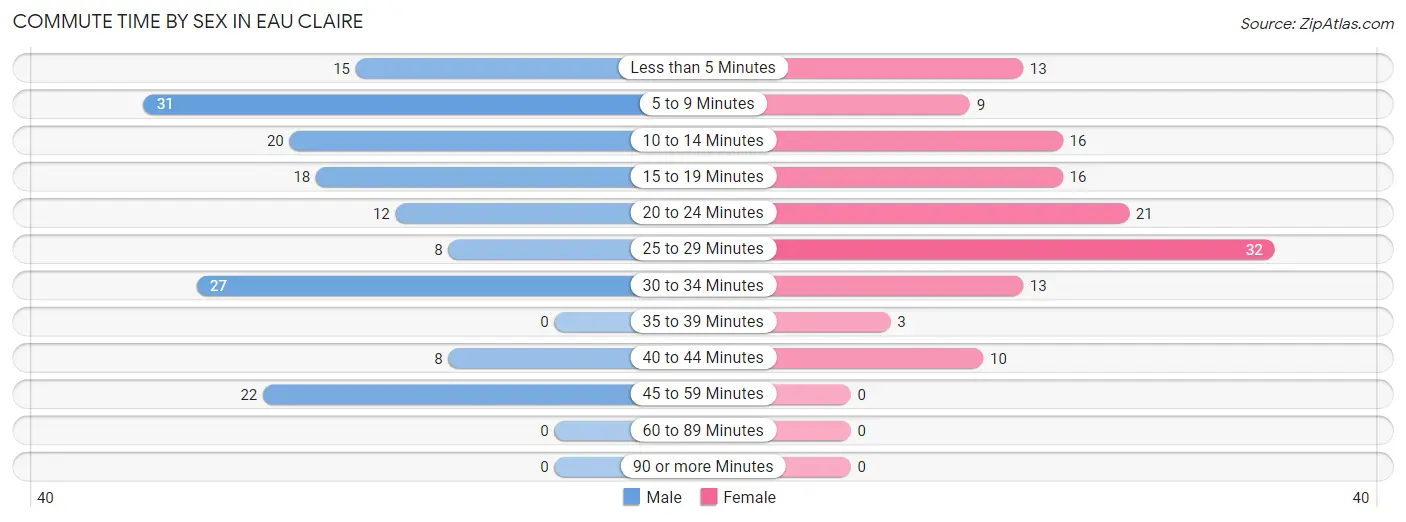
| Commute Time | Male | Female |
| Less than 5 Minutes | 15 (9.3%) | 13 (9.8%) |
| 5 to 9 Minutes | 31 (19.3%) | 9 (6.8%) |
| 10 to 14 Minutes | 20 (12.4%) | 16 (12.0%) |
| 15 to 19 Minutes | 18 (11.2%) | 16 (12.0%) |
| 20 to 24 Minutes | 12 (7.4%) | 21 (15.8%) |
| 25 to 29 Minutes | 8 (5.0%) | 32 (24.1%) |
| 30 to 34 Minutes | 27 (16.8%) | 13 (9.8%) |
| 35 to 39 Minutes | 0 (0.0%) | 3 (2.3%) |
| 40 to 44 Minutes | 8 (5.0%) | 10 (7.5%) |
| 45 to 59 Minutes | 22 (13.7%) | 0 (0.0%) |
| 60 to 89 Minutes | 0 (0.0%) | 0 (0.0%) |
| 90 or more Minutes | 0 (0.0%) | 0 (0.0%) |
Time of Departure to Work by Sex in Eau Claire
The most frequent times of departure to work in Eau Claire are 7:00 AM to 7:29 AM (35, 21.7%) for males and 7:00 AM to 7:29 AM (44, 33.1%) for females.
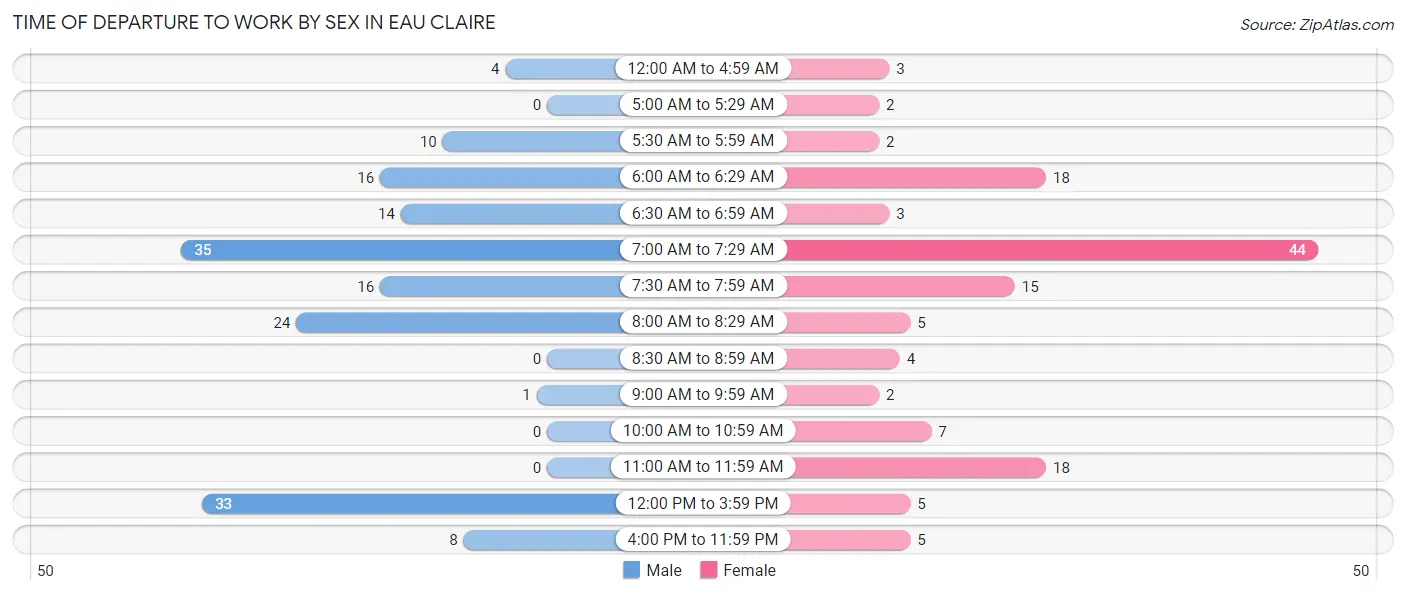
| Time of Departure | Male | Female |
| 12:00 AM to 4:59 AM | 4 (2.5%) | 3 (2.3%) |
| 5:00 AM to 5:29 AM | 0 (0.0%) | 2 (1.5%) |
| 5:30 AM to 5:59 AM | 10 (6.2%) | 2 (1.5%) |
| 6:00 AM to 6:29 AM | 16 (9.9%) | 18 (13.5%) |
| 6:30 AM to 6:59 AM | 14 (8.7%) | 3 (2.3%) |
| 7:00 AM to 7:29 AM | 35 (21.7%) | 44 (33.1%) |
| 7:30 AM to 7:59 AM | 16 (9.9%) | 15 (11.3%) |
| 8:00 AM to 8:29 AM | 24 (14.9%) | 5 (3.8%) |
| 8:30 AM to 8:59 AM | 0 (0.0%) | 4 (3.0%) |
| 9:00 AM to 9:59 AM | 1 (0.6%) | 2 (1.5%) |
| 10:00 AM to 10:59 AM | 0 (0.0%) | 7 (5.3%) |
| 11:00 AM to 11:59 AM | 0 (0.0%) | 18 (13.5%) |
| 12:00 PM to 3:59 PM | 33 (20.5%) | 5 (3.8%) |
| 4:00 PM to 11:59 PM | 8 (5.0%) | 5 (3.8%) |
| Total | 161 (100.0%) | 133 (100.0%) |
Housing Occupancy in Eau Claire
Occupancy by Ownership in Eau Claire
Of the total 216 dwellings in Eau Claire, owner-occupied units account for 172 (79.6%), while renter-occupied units make up 44 (20.4%).
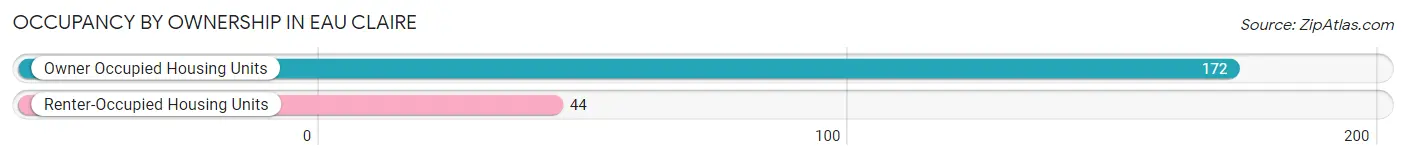
| Occupancy | # Housing Units | % Housing Units |
| Owner Occupied Housing Units | 172 | 79.6% |
| Renter-Occupied Housing Units | 44 | 20.4% |
| Total Occupied Housing Units | 216 | 100.0% |
Occupancy by Household Size in Eau Claire
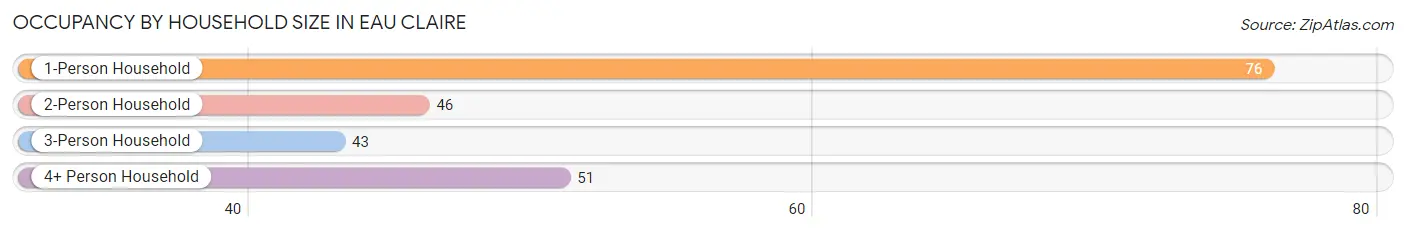
| Household Size | # Housing Units | % Housing Units |
| 1-Person Household | 76 | 35.2% |
| 2-Person Household | 46 | 21.3% |
| 3-Person Household | 43 | 19.9% |
| 4+ Person Household | 51 | 23.6% |
| Total Housing Units | 216 | 100.0% |
Occupancy by Ownership by Household Size in Eau Claire
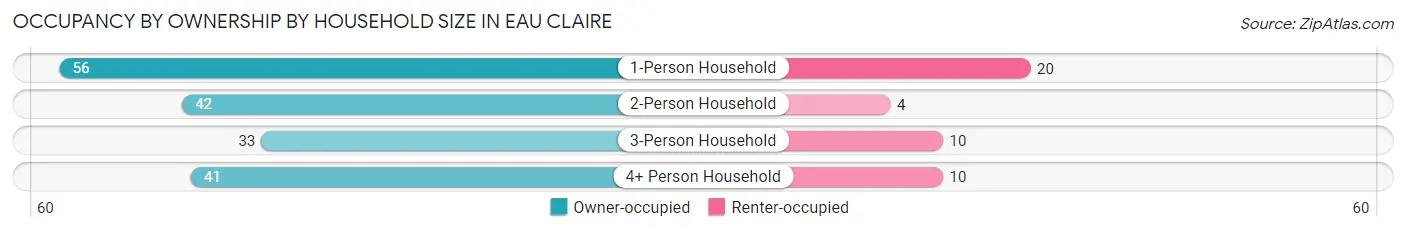
| Household Size | Owner-occupied | Renter-occupied |
| 1-Person Household | 56 (73.7%) | 20 (26.3%) |
| 2-Person Household | 42 (91.3%) | 4 (8.7%) |
| 3-Person Household | 33 (76.7%) | 10 (23.3%) |
| 4+ Person Household | 41 (80.4%) | 10 (19.6%) |
| Total Housing Units | 172 (79.6%) | 44 (20.4%) |
Occupancy by Educational Attainment in Eau Claire
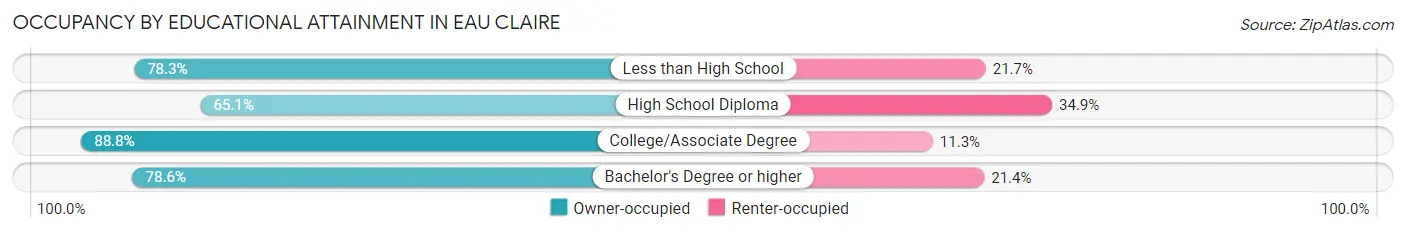
| Household Size | Owner-occupied | Renter-occupied |
| Less than High School | 18 (78.3%) | 5 (21.7%) |
| High School Diploma | 28 (65.1%) | 15 (34.9%) |
| College/Associate Degree | 71 (88.7%) | 9 (11.3%) |
| Bachelor's Degree or higher | 55 (78.6%) | 15 (21.4%) |
Occupancy by Age of Householder in Eau Claire
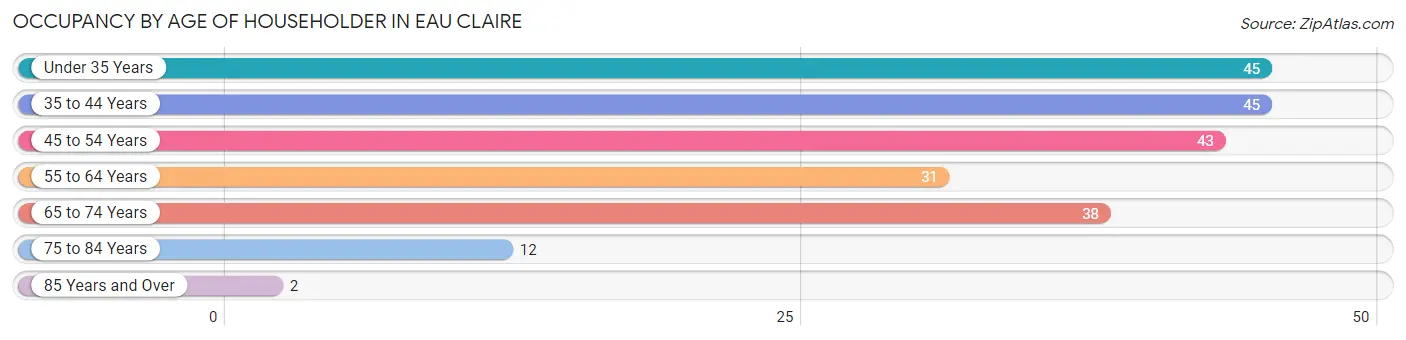
| Age Bracket | # Households | % Households |
| Under 35 Years | 45 | 20.8% |
| 35 to 44 Years | 45 | 20.8% |
| 45 to 54 Years | 43 | 19.9% |
| 55 to 64 Years | 31 | 14.3% |
| 65 to 74 Years | 38 | 17.6% |
| 75 to 84 Years | 12 | 5.6% |
| 85 Years and Over | 2 | 0.9% |
| Total | 216 | 100.0% |
Housing Finances in Eau Claire
Median Income by Occupancy in Eau Claire
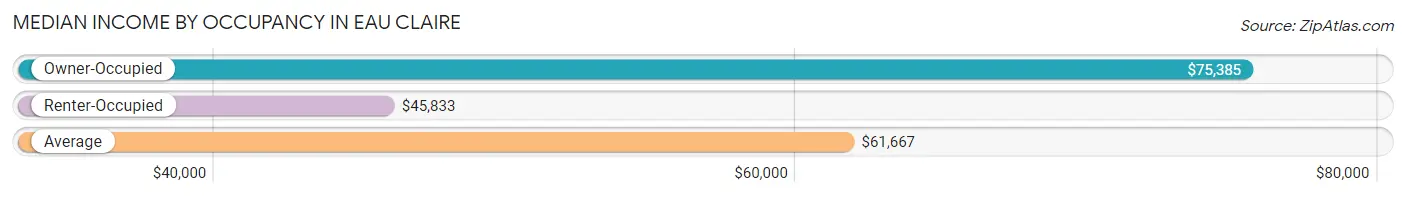
| Occupancy Type | # Households | Median Income |
| Owner-Occupied | 172 (79.6%) | $75,385 |
| Renter-Occupied | 44 (20.4%) | $45,833 |
| Average | 216 (100.0%) | $61,667 |
Occupancy by Householder Income Bracket in Eau Claire
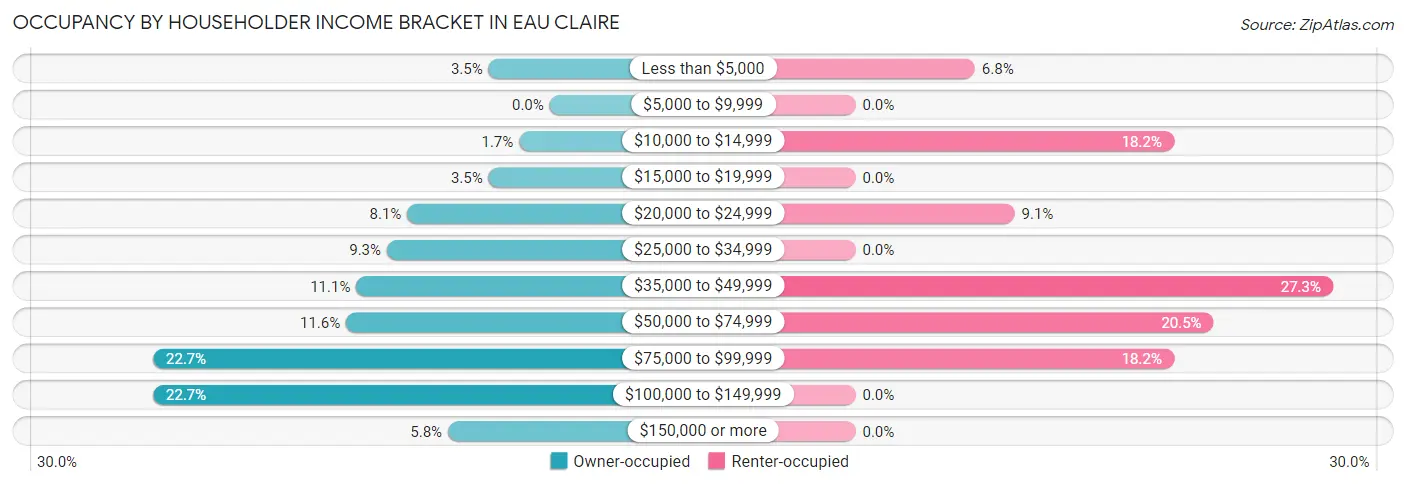
| Income Bracket | Owner-occupied | Renter-occupied |
| Less than $5,000 | 6 (3.5%) | 3 (6.8%) |
| $5,000 to $9,999 | 0 (0.0%) | 0 (0.0%) |
| $10,000 to $14,999 | 3 (1.7%) | 8 (18.2%) |
| $15,000 to $19,999 | 6 (3.5%) | 0 (0.0%) |
| $20,000 to $24,999 | 14 (8.1%) | 4 (9.1%) |
| $25,000 to $34,999 | 16 (9.3%) | 0 (0.0%) |
| $35,000 to $49,999 | 19 (11.1%) | 12 (27.3%) |
| $50,000 to $74,999 | 20 (11.6%) | 9 (20.4%) |
| $75,000 to $99,999 | 39 (22.7%) | 8 (18.2%) |
| $100,000 to $149,999 | 39 (22.7%) | 0 (0.0%) |
| $150,000 or more | 10 (5.8%) | 0 (0.0%) |
| Total | 172 (100.0%) | 44 (100.0%) |
Monthly Housing Cost Tiers in Eau Claire
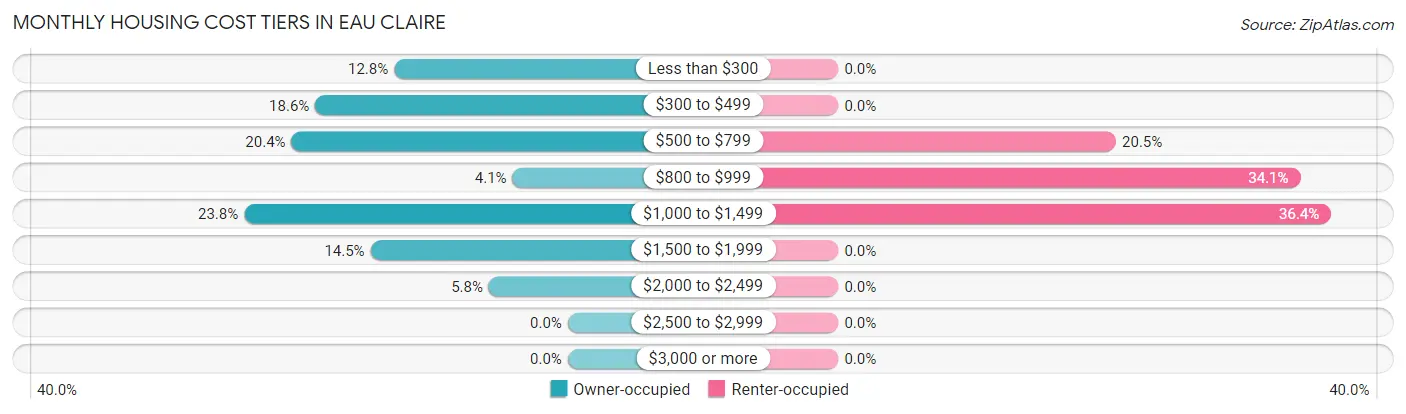
| Monthly Cost | Owner-occupied | Renter-occupied |
| Less than $300 | 22 (12.8%) | 0 (0.0%) |
| $300 to $499 | 32 (18.6%) | 0 (0.0%) |
| $500 to $799 | 35 (20.3%) | 9 (20.4%) |
| $800 to $999 | 7 (4.1%) | 15 (34.1%) |
| $1,000 to $1,499 | 41 (23.8%) | 16 (36.4%) |
| $1,500 to $1,999 | 25 (14.5%) | 0 (0.0%) |
| $2,000 to $2,499 | 10 (5.8%) | 0 (0.0%) |
| $2,500 to $2,999 | 0 (0.0%) | 0 (0.0%) |
| $3,000 or more | 0 (0.0%) | 0 (0.0%) |
| Total | 172 (100.0%) | 44 (100.0%) |
Physical Housing Characteristics in Eau Claire
Housing Structures in Eau Claire
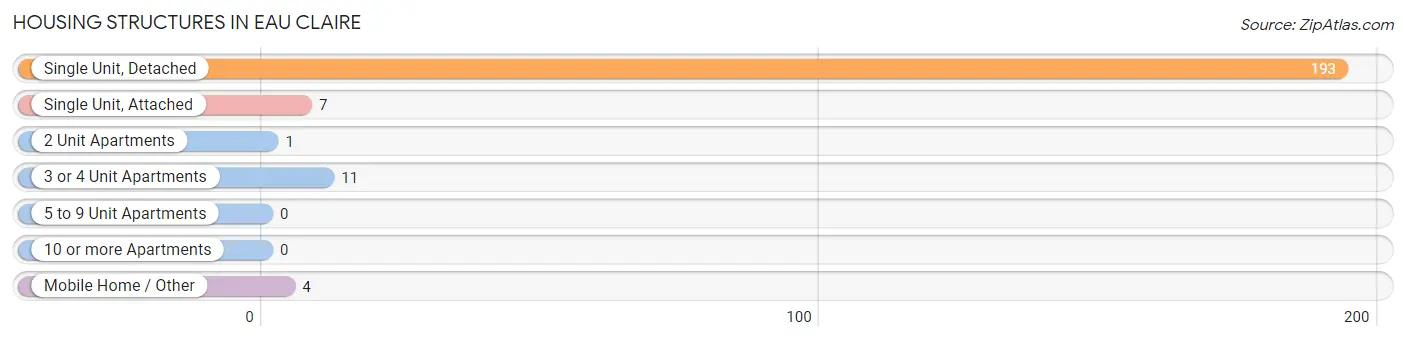
| Structure Type | # Housing Units | % Housing Units |
| Single Unit, Detached | 193 | 89.3% |
| Single Unit, Attached | 7 | 3.2% |
| 2 Unit Apartments | 1 | 0.5% |
| 3 or 4 Unit Apartments | 11 | 5.1% |
| 5 to 9 Unit Apartments | 0 | 0.0% |
| 10 or more Apartments | 0 | 0.0% |
| Mobile Home / Other | 4 | 1.8% |
| Total | 216 | 100.0% |
Housing Structures by Occupancy in Eau Claire
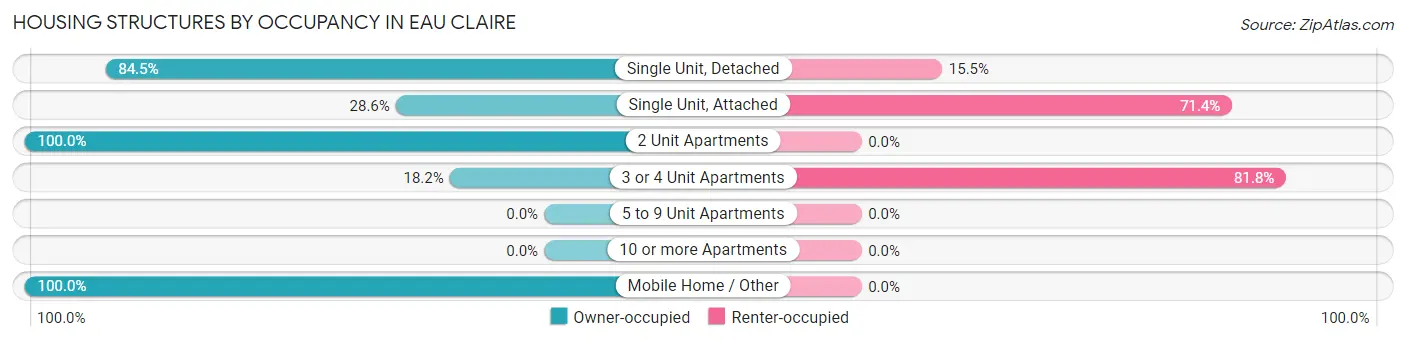
| Structure Type | Owner-occupied | Renter-occupied |
| Single Unit, Detached | 163 (84.5%) | 30 (15.5%) |
| Single Unit, Attached | 2 (28.6%) | 5 (71.4%) |
| 2 Unit Apartments | 1 (100.0%) | 0 (0.0%) |
| 3 or 4 Unit Apartments | 2 (18.2%) | 9 (81.8%) |
| 5 to 9 Unit Apartments | 0 (0.0%) | 0 (0.0%) |
| 10 or more Apartments | 0 (0.0%) | 0 (0.0%) |
| Mobile Home / Other | 4 (100.0%) | 0 (0.0%) |
| Total | 172 (79.6%) | 44 (20.4%) |
Housing Structures by Number of Rooms in Eau Claire
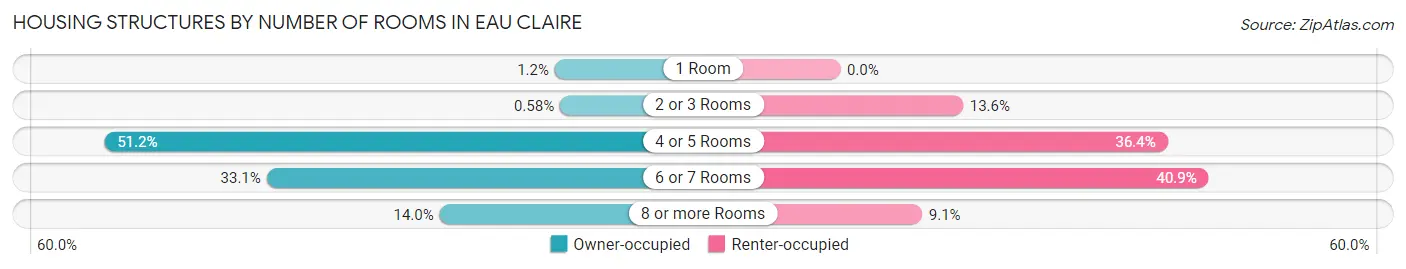
| Number of Rooms | Owner-occupied | Renter-occupied |
| 1 Room | 2 (1.2%) | 0 (0.0%) |
| 2 or 3 Rooms | 1 (0.6%) | 6 (13.6%) |
| 4 or 5 Rooms | 88 (51.2%) | 16 (36.4%) |
| 6 or 7 Rooms | 57 (33.1%) | 18 (40.9%) |
| 8 or more Rooms | 24 (14.0%) | 4 (9.1%) |
| Total | 172 (100.0%) | 44 (100.0%) |
Housing Structure by Heating Type in Eau Claire
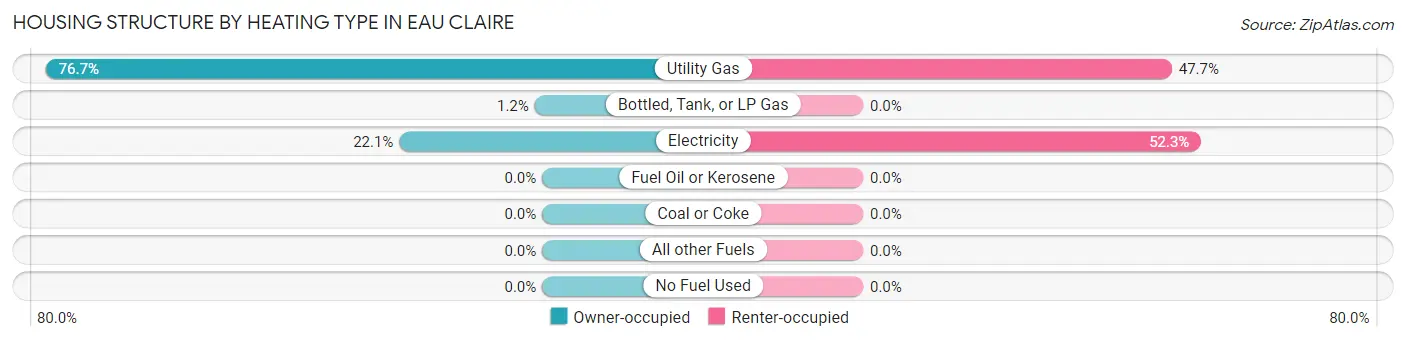
| Heating Type | Owner-occupied | Renter-occupied |
| Utility Gas | 132 (76.7%) | 21 (47.7%) |
| Bottled, Tank, or LP Gas | 2 (1.2%) | 0 (0.0%) |
| Electricity | 38 (22.1%) | 23 (52.3%) |
| Fuel Oil or Kerosene | 0 (0.0%) | 0 (0.0%) |
| Coal or Coke | 0 (0.0%) | 0 (0.0%) |
| All other Fuels | 0 (0.0%) | 0 (0.0%) |
| No Fuel Used | 0 (0.0%) | 0 (0.0%) |
| Total | 172 (100.0%) | 44 (100.0%) |
Household Vehicle Usage in Eau Claire
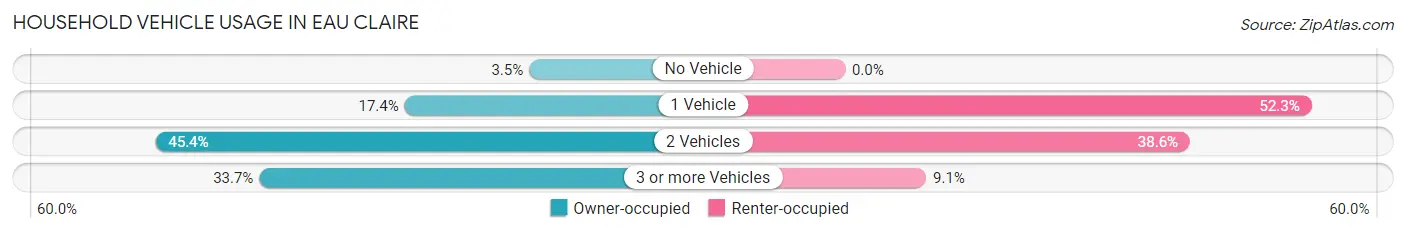
| Vehicles per Household | Owner-occupied | Renter-occupied |
| No Vehicle | 6 (3.5%) | 0 (0.0%) |
| 1 Vehicle | 30 (17.4%) | 23 (52.3%) |
| 2 Vehicles | 78 (45.4%) | 17 (38.6%) |
| 3 or more Vehicles | 58 (33.7%) | 4 (9.1%) |
| Total | 172 (100.0%) | 44 (100.0%) |
Real Estate & Mortgages in Eau Claire
Real Estate and Mortgage Overview in Eau Claire
| Characteristic | Without Mortgage | With Mortgage |
| Housing Units | 81 | 91 |
| Median Property Value | $110,600 | $139,800 |
| Median Household Income | $39,375 | $7 |
| Monthly Housing Costs | $419 | $0 |
| Real Estate Taxes | $1,360 | $1 |
Property Value by Mortgage Status in Eau Claire
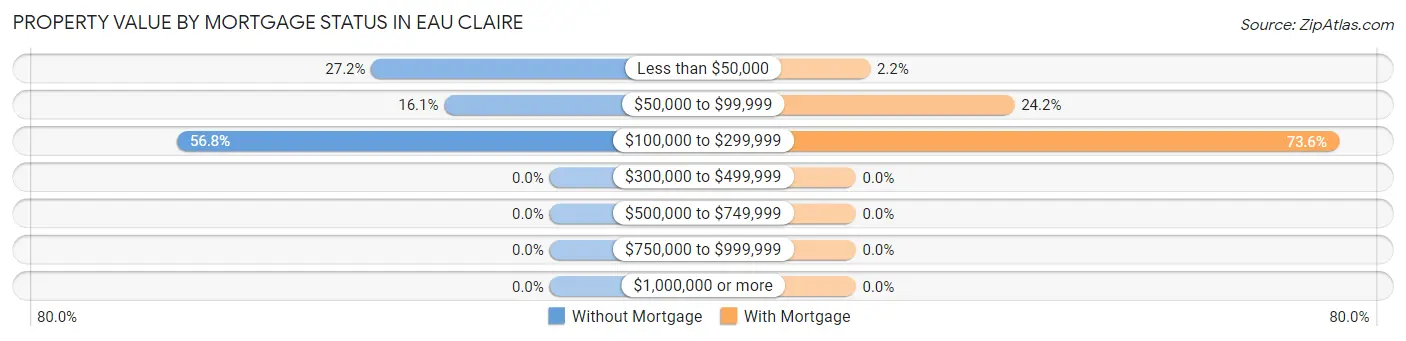
| Property Value | Without Mortgage | With Mortgage |
| Less than $50,000 | 22 (27.2%) | 2 (2.2%) |
| $50,000 to $99,999 | 13 (16.1%) | 22 (24.2%) |
| $100,000 to $299,999 | 46 (56.8%) | 67 (73.6%) |
| $300,000 to $499,999 | 0 (0.0%) | 0 (0.0%) |
| $500,000 to $749,999 | 0 (0.0%) | 0 (0.0%) |
| $750,000 to $999,999 | 0 (0.0%) | 0 (0.0%) |
| $1,000,000 or more | 0 (0.0%) | 0 (0.0%) |
| Total | 81 (100.0%) | 91 (100.0%) |
Household Income by Mortgage Status in Eau Claire
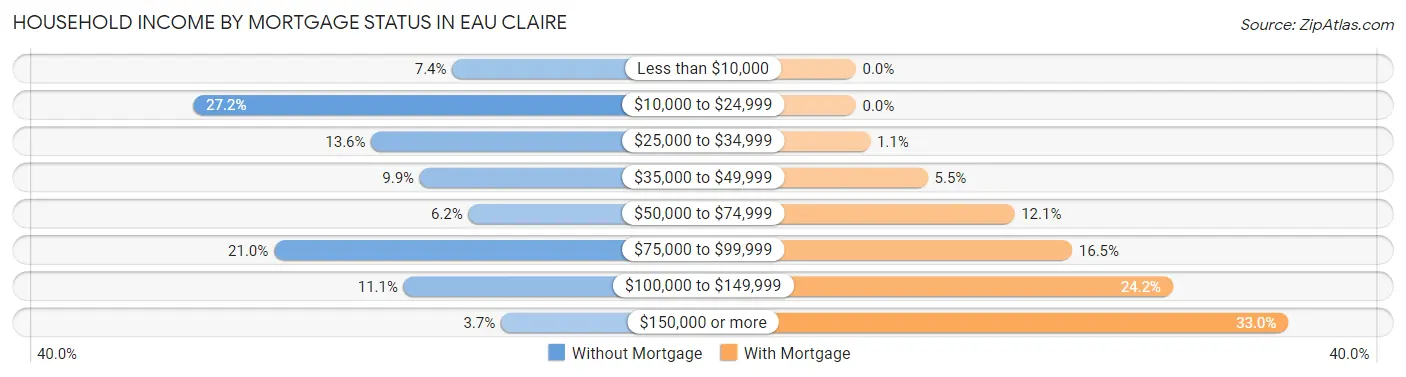
| Household Income | Without Mortgage | With Mortgage |
| Less than $10,000 | 6 (7.4%) | 0 (0.0%) |
| $10,000 to $24,999 | 22 (27.2%) | 0 (0.0%) |
| $25,000 to $34,999 | 11 (13.6%) | 1 (1.1%) |
| $35,000 to $49,999 | 8 (9.9%) | 5 (5.5%) |
| $50,000 to $74,999 | 5 (6.2%) | 11 (12.1%) |
| $75,000 to $99,999 | 17 (21.0%) | 15 (16.5%) |
| $100,000 to $149,999 | 9 (11.1%) | 22 (24.2%) |
| $150,000 or more | 3 (3.7%) | 30 (33.0%) |
| Total | 81 (100.0%) | 91 (100.0%) |
Property Value to Household Income Ratio in Eau Claire
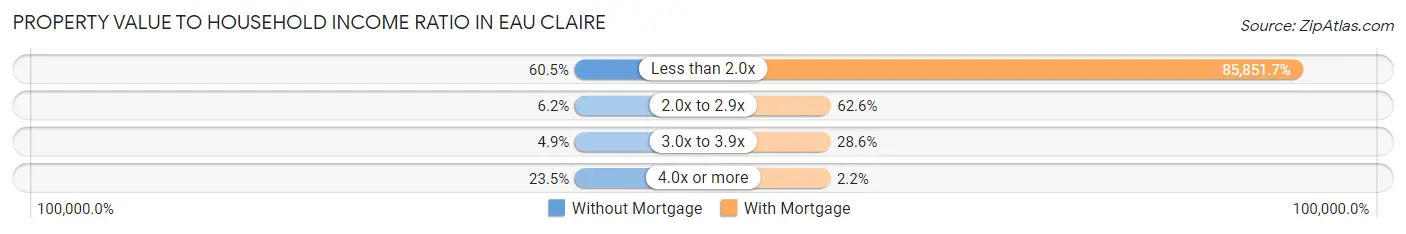
| Value-to-Income Ratio | Without Mortgage | With Mortgage |
| Less than 2.0x | 49 (60.5%) | 78,125 (85,851.6%) |
| 2.0x to 2.9x | 5 (6.2%) | 57 (62.6%) |
| 3.0x to 3.9x | 4 (4.9%) | 26 (28.6%) |
| 4.0x or more | 19 (23.5%) | 2 (2.2%) |
| Total | 81 (100.0%) | 91 (100.0%) |
Real Estate Taxes by Mortgage Status in Eau Claire
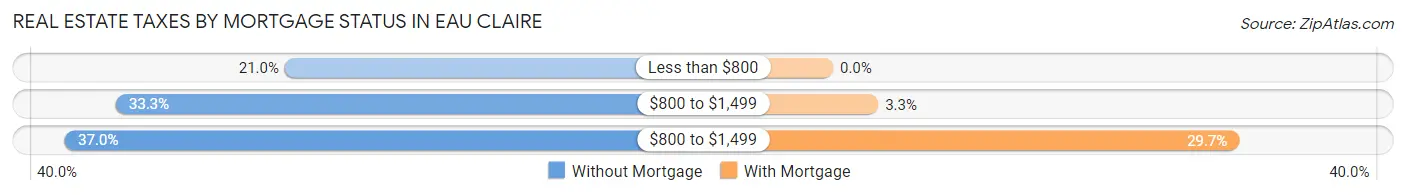
| Property Taxes | Without Mortgage | With Mortgage |
| Less than $800 | 17 (21.0%) | 0 (0.0%) |
| $800 to $1,499 | 27 (33.3%) | 3 (3.3%) |
| $800 to $1,499 | 30 (37.0%) | 27 (29.7%) |
| Total | 81 (100.0%) | 91 (100.0%) |
Health & Disability in Eau Claire
Health Insurance Coverage by Age in Eau Claire
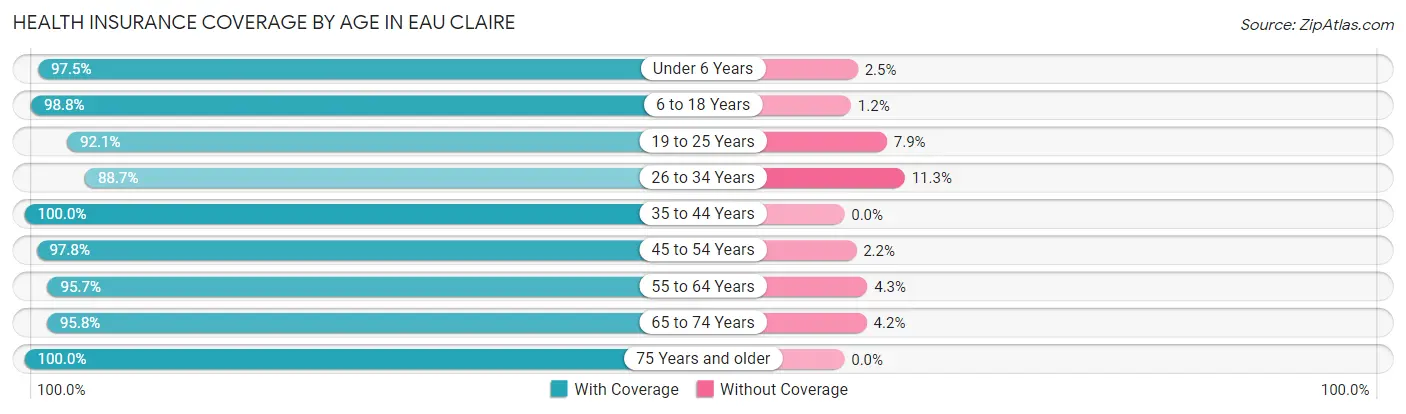
| Age Bracket | With Coverage | Without Coverage |
| Under 6 Years | 78 (97.5%) | 2 (2.5%) |
| 6 to 18 Years | 80 (98.8%) | 1 (1.2%) |
| 19 to 25 Years | 58 (92.1%) | 5 (7.9%) |
| 26 to 34 Years | 63 (88.7%) | 8 (11.3%) |
| 35 to 44 Years | 71 (100.0%) | 0 (0.0%) |
| 45 to 54 Years | 88 (97.8%) | 2 (2.2%) |
| 55 to 64 Years | 67 (95.7%) | 3 (4.3%) |
| 65 to 74 Years | 46 (95.8%) | 2 (4.2%) |
| 75 Years and older | 30 (100.0%) | 0 (0.0%) |
| Total | 581 (96.2%) | 23 (3.8%) |
Health Insurance Coverage by Citizenship Status in Eau Claire
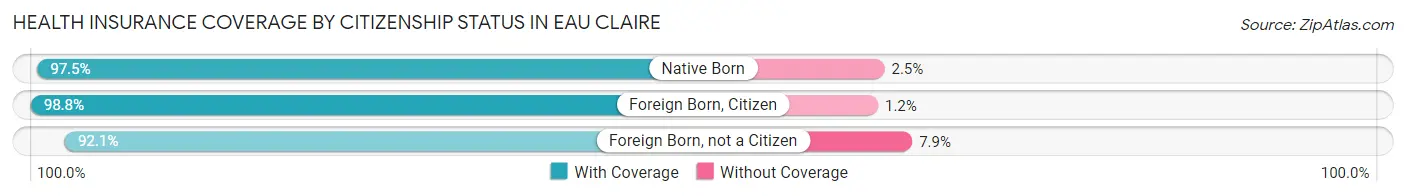
| Citizenship Status | With Coverage | Without Coverage |
| Native Born | 78 (97.5%) | 2 (2.5%) |
| Foreign Born, Citizen | 80 (98.8%) | 1 (1.2%) |
| Foreign Born, not a Citizen | 58 (92.1%) | 5 (7.9%) |
Health Insurance Coverage by Household Income in Eau Claire
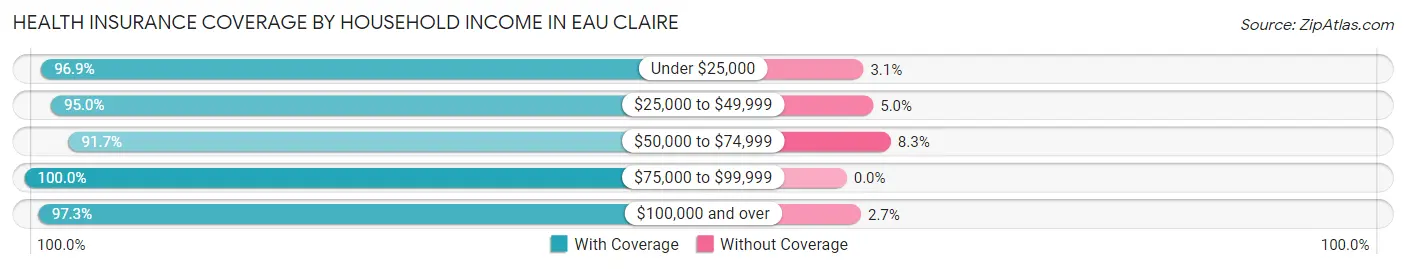
| Household Income | With Coverage | Without Coverage |
| Under $25,000 | 62 (96.9%) | 2 (3.1%) |
| $25,000 to $49,999 | 134 (95.0%) | 7 (5.0%) |
| $50,000 to $74,999 | 100 (91.7%) | 9 (8.3%) |
| $75,000 to $99,999 | 103 (100.0%) | 0 (0.0%) |
| $100,000 and over | 182 (97.3%) | 5 (2.7%) |
Public vs Private Health Insurance Coverage by Age in Eau Claire
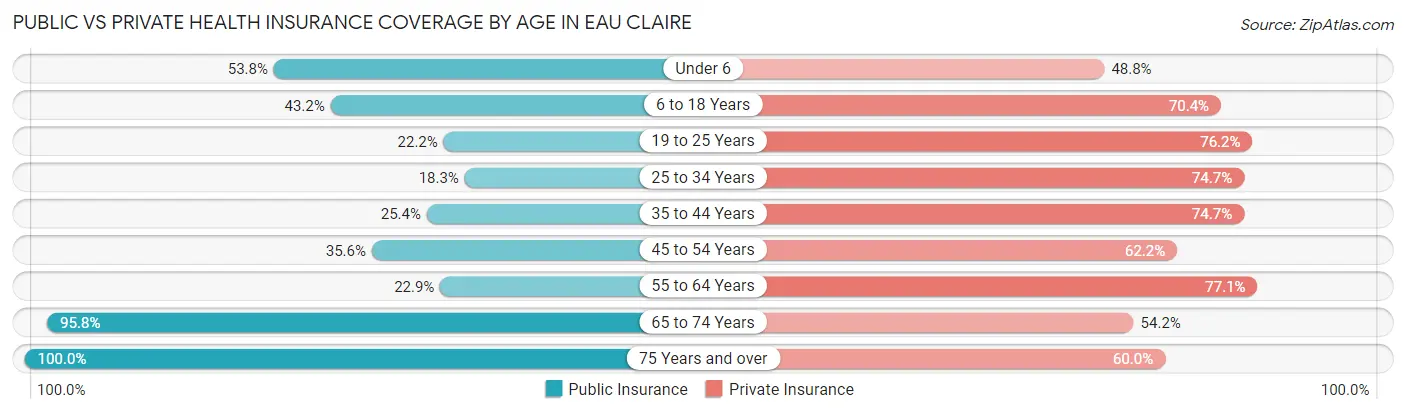
| Age Bracket | Public Insurance | Private Insurance |
| Under 6 | 43 (53.7%) | 39 (48.7%) |
| 6 to 18 Years | 35 (43.2%) | 57 (70.4%) |
| 19 to 25 Years | 14 (22.2%) | 48 (76.2%) |
| 25 to 34 Years | 13 (18.3%) | 53 (74.7%) |
| 35 to 44 Years | 18 (25.4%) | 53 (74.7%) |
| 45 to 54 Years | 32 (35.6%) | 56 (62.2%) |
| 55 to 64 Years | 16 (22.9%) | 54 (77.1%) |
| 65 to 74 Years | 46 (95.8%) | 26 (54.2%) |
| 75 Years and over | 30 (100.0%) | 18 (60.0%) |
| Total | 247 (40.9%) | 404 (66.9%) |
Disability Status by Sex by Age in Eau Claire
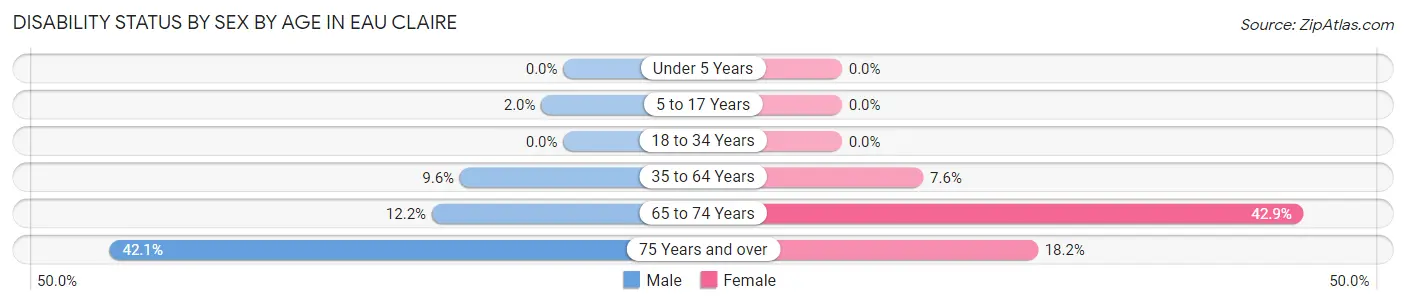
| Age Bracket | Male | Female |
| Under 5 Years | 0 (0.0%) | 0 (0.0%) |
| 5 to 17 Years | 1 (2.0%) | 0 (0.0%) |
| 18 to 34 Years | 0 (0.0%) | 0 (0.0%) |
| 35 to 64 Years | 12 (9.6%) | 8 (7.5%) |
| 65 to 74 Years | 5 (12.2%) | 3 (42.9%) |
| 75 Years and over | 8 (42.1%) | 2 (18.2%) |
Disability Class by Sex by Age in Eau Claire
Disability Class: Hearing Difficulty
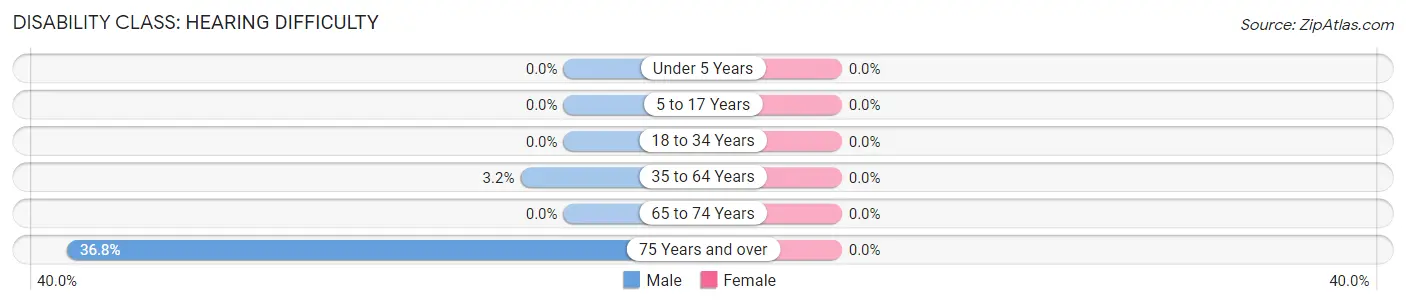
| Age Bracket | Male | Female |
| Under 5 Years | 0 (0.0%) | 0 (0.0%) |
| 5 to 17 Years | 0 (0.0%) | 0 (0.0%) |
| 18 to 34 Years | 0 (0.0%) | 0 (0.0%) |
| 35 to 64 Years | 4 (3.2%) | 0 (0.0%) |
| 65 to 74 Years | 0 (0.0%) | 0 (0.0%) |
| 75 Years and over | 7 (36.8%) | 0 (0.0%) |
Disability Class: Vision Difficulty
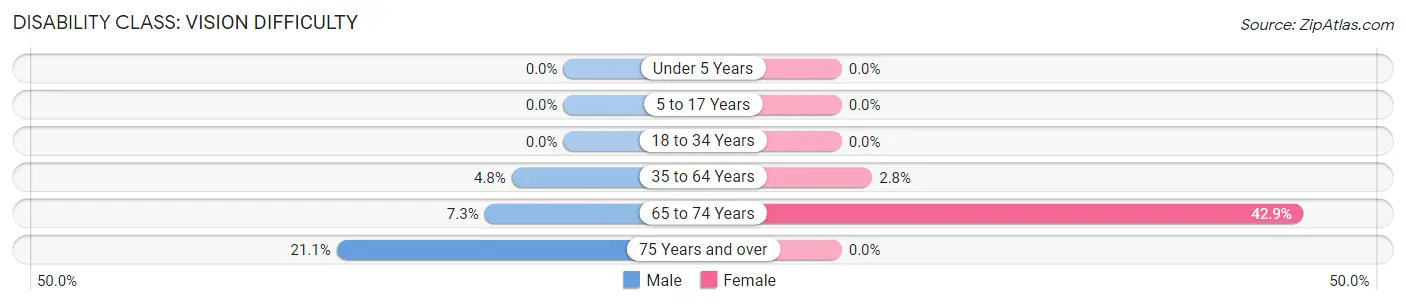
| Age Bracket | Male | Female |
| Under 5 Years | 0 (0.0%) | 0 (0.0%) |
| 5 to 17 Years | 0 (0.0%) | 0 (0.0%) |
| 18 to 34 Years | 0 (0.0%) | 0 (0.0%) |
| 35 to 64 Years | 6 (4.8%) | 3 (2.8%) |
| 65 to 74 Years | 3 (7.3%) | 3 (42.9%) |
| 75 Years and over | 4 (21.0%) | 0 (0.0%) |
Disability Class: Cognitive Difficulty
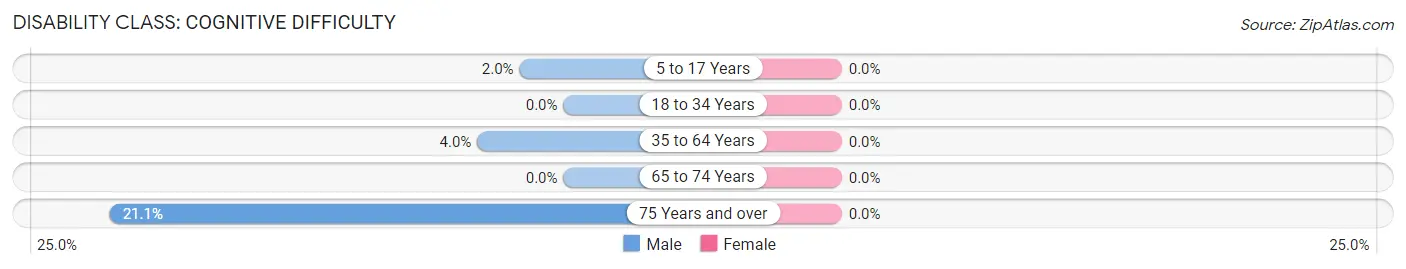
| Age Bracket | Male | Female |
| 5 to 17 Years | 1 (2.0%) | 0 (0.0%) |
| 18 to 34 Years | 0 (0.0%) | 0 (0.0%) |
| 35 to 64 Years | 5 (4.0%) | 0 (0.0%) |
| 65 to 74 Years | 0 (0.0%) | 0 (0.0%) |
| 75 Years and over | 4 (21.0%) | 0 (0.0%) |
Disability Class: Ambulatory Difficulty
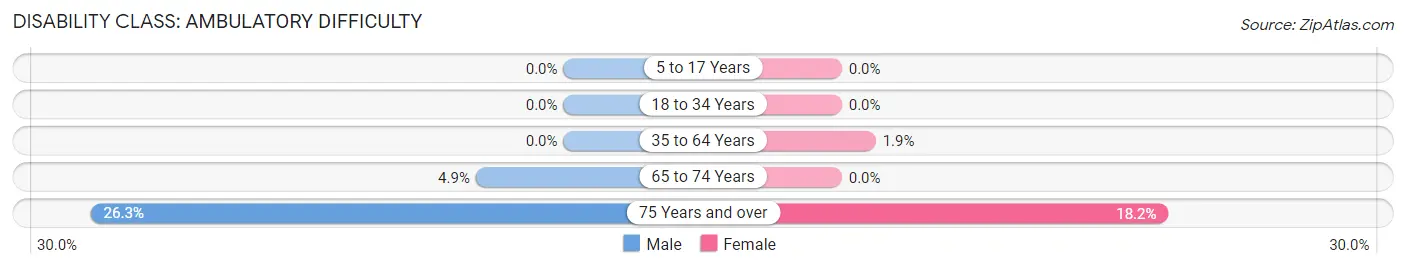
| Age Bracket | Male | Female |
| 5 to 17 Years | 0 (0.0%) | 0 (0.0%) |
| 18 to 34 Years | 0 (0.0%) | 0 (0.0%) |
| 35 to 64 Years | 0 (0.0%) | 2 (1.9%) |
| 65 to 74 Years | 2 (4.9%) | 0 (0.0%) |
| 75 Years and over | 5 (26.3%) | 2 (18.2%) |
Disability Class: Self-Care Difficulty
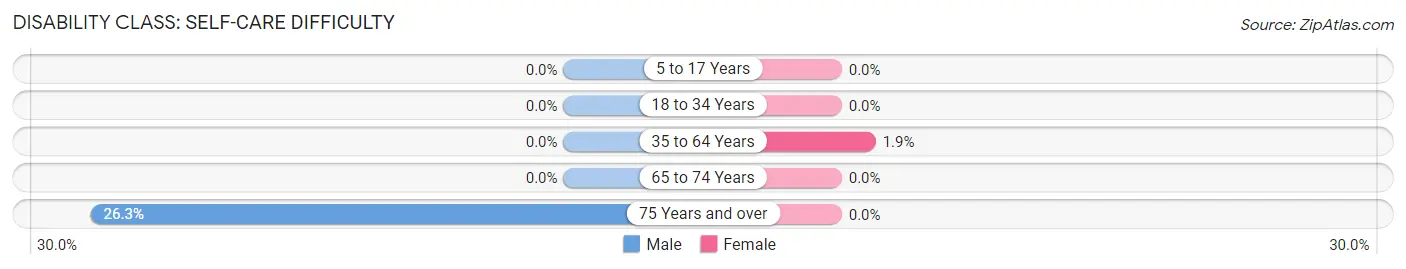
| Age Bracket | Male | Female |
| 5 to 17 Years | 0 (0.0%) | 0 (0.0%) |
| 18 to 34 Years | 0 (0.0%) | 0 (0.0%) |
| 35 to 64 Years | 0 (0.0%) | 2 (1.9%) |
| 65 to 74 Years | 0 (0.0%) | 0 (0.0%) |
| 75 Years and over | 5 (26.3%) | 0 (0.0%) |
Technology Access in Eau Claire
Computing Device Access in Eau Claire
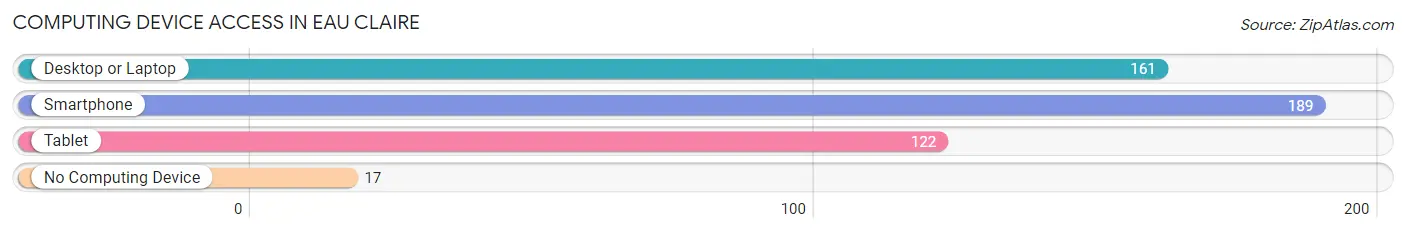
| Device Type | # Households | % Households |
| Desktop or Laptop | 161 | 74.5% |
| Smartphone | 189 | 87.5% |
| Tablet | 122 | 56.5% |
| No Computing Device | 17 | 7.9% |
| Total | 216 | 100.0% |
Internet Access in Eau Claire
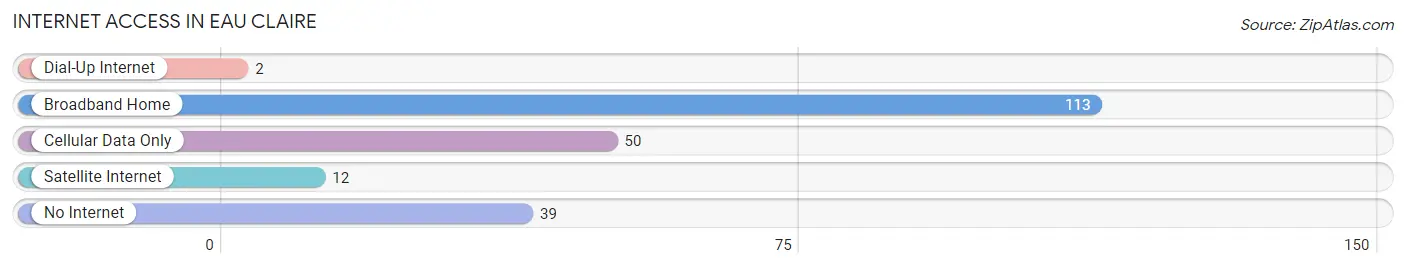
| Internet Type | # Households | % Households |
| Dial-Up Internet | 2 | 0.9% |
| Broadband Home | 113 | 52.3% |
| Cellular Data Only | 50 | 23.2% |
| Satellite Internet | 12 | 5.6% |
| No Internet | 39 | 18.1% |
| Total | 216 | 100.0% |
Eau Claire Summary
Eau Claire, Michigan is a small town located in the Upper Peninsula of Michigan. It is situated in the northern part of the state, near the border of Wisconsin. The town is located on the banks of the Eau Claire River, which is a tributary of the Menominee River. The population of Eau Claire was 1,845 as of the 2010 census.
Geography
Eau Claire is located in the Upper Peninsula of Michigan, near the border of Wisconsin. The town is situated on the banks of the Eau Claire River, which is a tributary of the Menominee River. The town is surrounded by forests and lakes, and is located in the heart of the Upper Peninsula. The town is located in the Central Time Zone, and is about two hours away from the nearest major city, Green Bay, Wisconsin.
History
Eau Claire was first settled in the late 1800s by French-Canadian immigrants. The town was originally called “Eau Claire”, which means “clear water” in French. The town was officially incorporated in 1891. In the early 1900s, the town was a major logging center, and the lumber industry was the main source of income for the town. The town also had a thriving fishing industry, and was home to several fish canneries.
In the 1950s, the town began to decline as the lumber industry began to decline. The town’s population decreased, and many of the businesses closed. In the late 1970s, the town began to experience a resurgence as tourism began to increase. The town is now a popular destination for outdoor recreation, and is home to several resorts and campgrounds.
Economy
The economy of Eau Claire is largely based on tourism. The town is a popular destination for outdoor recreation, and is home to several resorts and campgrounds. The town is also home to several small businesses, including restaurants, shops, and galleries. The town is also home to a small manufacturing industry, which produces a variety of products, including furniture and clothing.
Demographics
As of the 2010 census, the population of Eau Claire was 1,845. The town has a median age of 44.7 years, and the median household income is $37,917. The town is predominantly white, with 95.3% of the population identifying as white. The town also has a small Hispanic population, with 4.7% of the population identifying as Hispanic or Latino. The town also has a small Native American population, with 0.3% of the population identifying as Native American.
Conclusion
Eau Claire, Michigan is a small town located in the Upper Peninsula of Michigan. The town is situated on the banks of the Eau Claire River, and is surrounded by forests and lakes. The town has a long history, and was once a major logging center. The town’s economy is now largely based on tourism, and the town is a popular destination for outdoor recreation. The population of Eau Claire is predominantly white, with a small Hispanic and Native American population.
Common Questions
What is Per Capita Income in Eau Claire?
Per Capita income in Eau Claire is $28,380.
What is the Median Family Income in Eau Claire?
Median Family Income in Eau Claire is $72,500.
What is the Median Household income in Eau Claire?
Median Household Income in Eau Claire is $61,667.
What is Income or Wage Gap in Eau Claire?
Income or Wage Gap in Eau Claire is 22.2%.
Women in Eau Claire earn 77.8 cents for every dollar earned by a man.
What is Inequality or Gini Index in Eau Claire?
Inequality or Gini Index in Eau Claire is 0.39.
What is the Total Population of Eau Claire?
Total Population of Eau Claire is 604.
What is the Total Male Population of Eau Claire?
Total Male Population of Eau Claire is 355.
What is the Total Female Population of Eau Claire?
Total Female Population of Eau Claire is 249.
What is the Ratio of Males per 100 Females in Eau Claire?
There are 142.57 Males per 100 Females in Eau Claire.
What is the Ratio of Females per 100 Males in Eau Claire?
There are 70.14 Females per 100 Males in Eau Claire.
What is the Median Population Age in Eau Claire?
Median Population Age in Eau Claire is 35.6 Years.
What is the Average Family Size in Eau Claire
Average Family Size in Eau Claire is 3.8 People.
What is the Average Household Size in Eau Claire
Average Household Size in Eau Claire is 2.8 People.
How Large is the Labor Force in Eau Claire?
There are 319 People in the Labor Forcein in Eau Claire.
What is the Percentage of People in the Labor Force in Eau Claire?
70.1% of People are in the Labor Force in Eau Claire.
What is the Unemployment Rate in Eau Claire?
Unemployment Rate in Eau Claire is 2.8%.