Zip Codes with the Highest Percentage of Population with a Degree in Liberal Arts and History in Gretna, LA
RELATED REPORTS & OPTIONS
Liberal Arts and History
Gretna
Compare Zip Codes
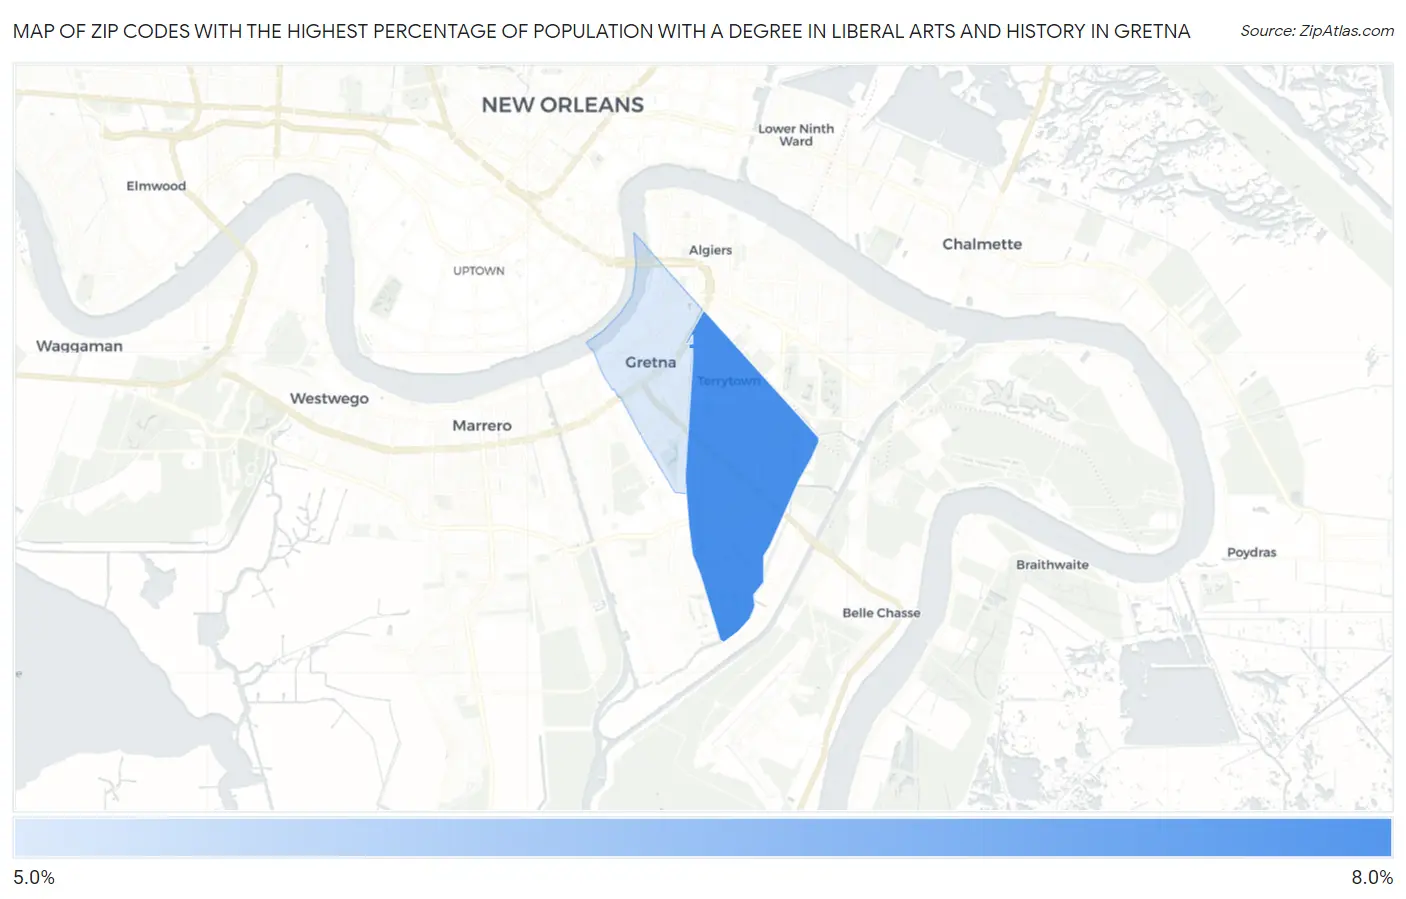
Map of Zip Codes with the Highest Percentage of Population with a Degree in Liberal Arts and History in Gretna
5.6%
6.2%
Zip Codes with the Highest Percentage of Population with a Degree in Liberal Arts and History in Gretna, LA
| Zip Code | % Graduates | vs State | vs National | |
| 1. | 70056 | 6.2% | 7.4%(-1.22)#225 | 4.9%(+1.36)#7,952 |
| 2. | 70053 | 5.6% | 7.4%(-1.86)#254 | 4.9%(+0.713)#9,606 |
1
Common Questions
What are the Top Zip Codes with the Highest Percentage of Population with a Degree in Liberal Arts and History in Gretna, LA?
Top Zip Codes with the Highest Percentage of Population with a Degree in Liberal Arts and History in Gretna, LA are:
What zip code has the Highest Percentage of Population with a Degree in Liberal Arts and History in Gretna, LA?
70056 has the Highest Percentage of Population with a Degree in Liberal Arts and History in Gretna, LA with 6.2%.
What is the Percentage of Population with a Degree in Liberal Arts and History in Gretna, LA?
Percentage of Population with a Degree in Liberal Arts and History in Gretna is 5.0%.
What is the Percentage of Population with a Degree in Liberal Arts and History in Louisiana?
Percentage of Population with a Degree in Liberal Arts and History in Louisiana is 7.4%.
What is the Percentage of Population with a Degree in Liberal Arts and History in the United States?
Percentage of Population with a Degree in Liberal Arts and History in the United States is 4.9%.