Zip Codes with the Highest Percentage of Population with a Degree in Science and Engineering in Gretna, LA
RELATED REPORTS & OPTIONS
Science and Engineering
Gretna
Compare Zip Codes
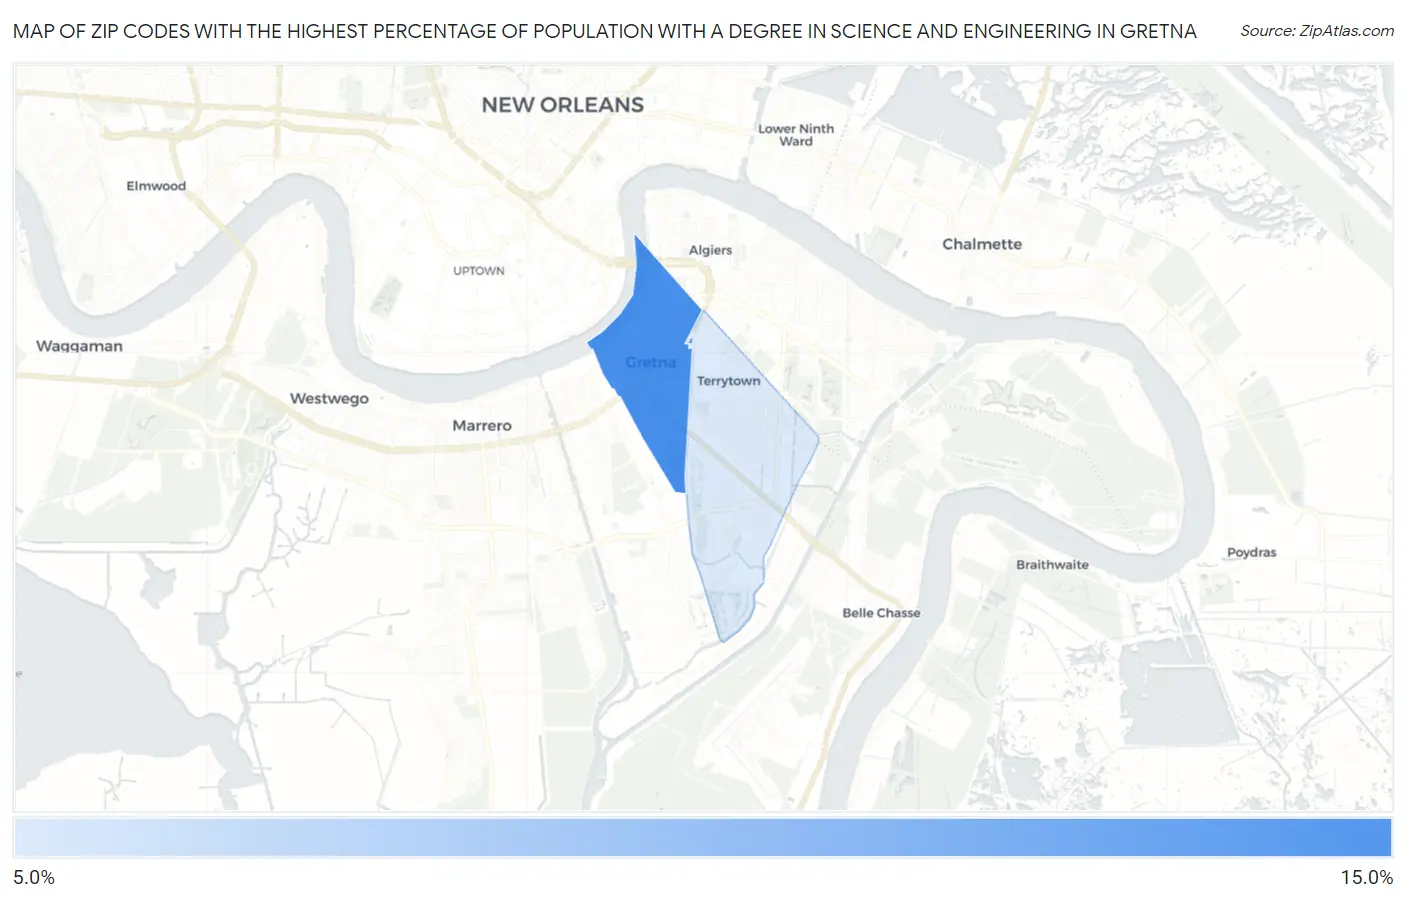
Map of Zip Codes with the Highest Percentage of Population with a Degree in Science and Engineering in Gretna
9.2%
11.0%
Zip Codes with the Highest Percentage of Population with a Degree in Science and Engineering in Gretna, LA
| Zip Code | % Graduates | vs State | vs National | |
| 1. | 70053 | 11.0% | 12.6%(-1.56)#254 | 9.8%(+1.25)#12,821 |
| 2. | 70056 | 9.2% | 12.6%(-3.41)#305 | 9.8%(-0.611)#16,929 |
1
Common Questions
What are the Top Zip Codes with the Highest Percentage of Population with a Degree in Science and Engineering in Gretna, LA?
Top Zip Codes with the Highest Percentage of Population with a Degree in Science and Engineering in Gretna, LA are:
What zip code has the Highest Percentage of Population with a Degree in Science and Engineering in Gretna, LA?
70053 has the Highest Percentage of Population with a Degree in Science and Engineering in Gretna, LA with 11.0%.
What is the Percentage of Population with a Degree in Science and Engineering in Gretna, LA?
Percentage of Population with a Degree in Science and Engineering in Gretna is 11.0%.
What is the Percentage of Population with a Degree in Science and Engineering in Louisiana?
Percentage of Population with a Degree in Science and Engineering in Louisiana is 12.6%.
What is the Percentage of Population with a Degree in Science and Engineering in the United States?
Percentage of Population with a Degree in Science and Engineering in the United States is 9.8%.