Zip Codes with the Highest Percentage of Self-Employed / Not Incorporated in Gretna, LA
RELATED REPORTS & OPTIONS
Self-Employed / Not Incorporated
Gretna
Compare Zip Codes
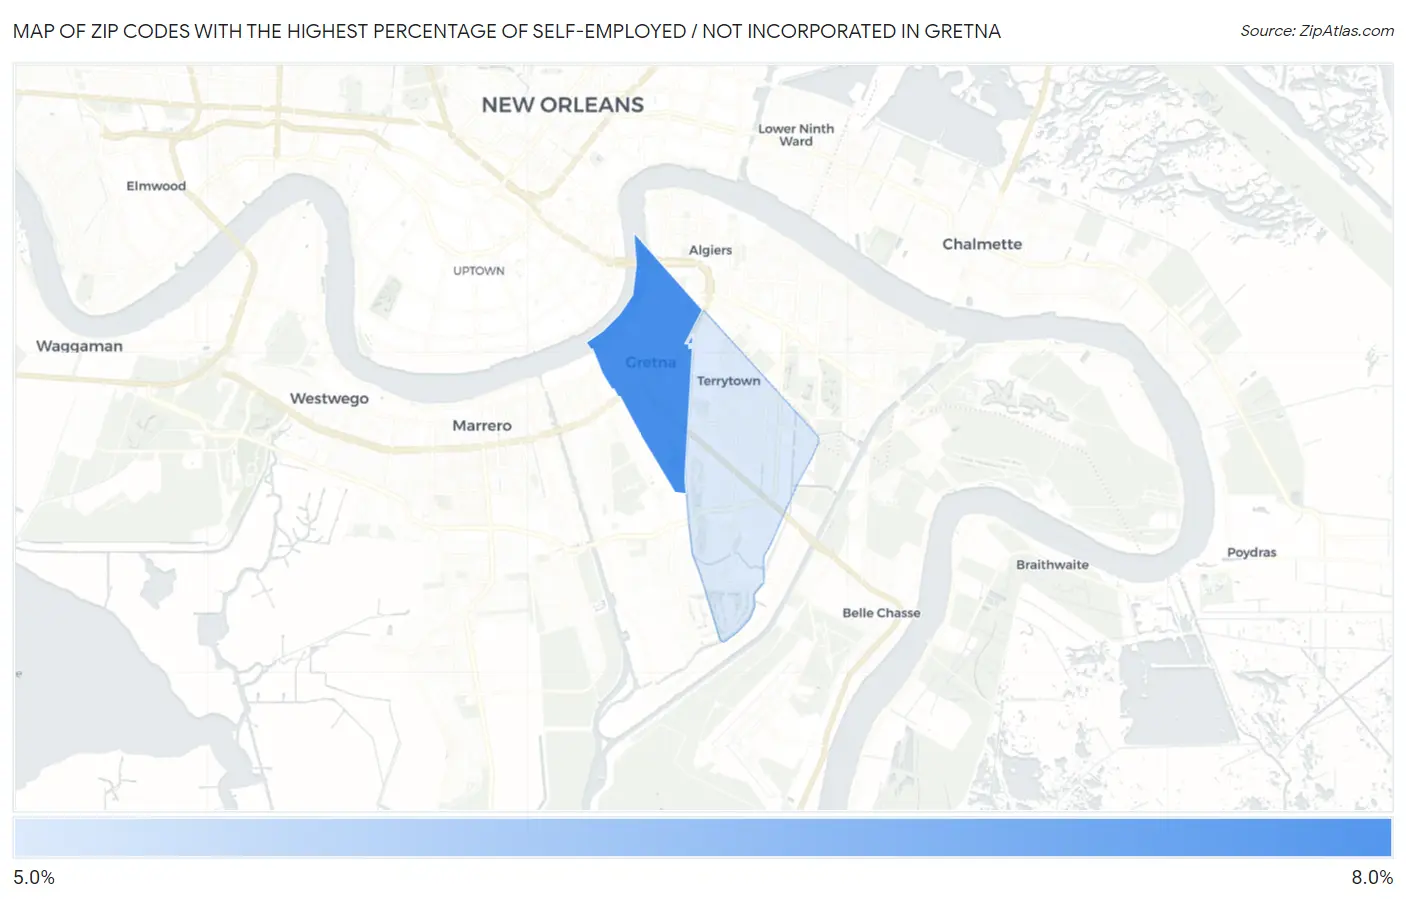
Map of Zip Codes with the Highest Percentage of Self-Employed / Not Incorporated in Gretna
0.0%
8.0%
Zip Codes with the Highest Percentage of Self-Employed / Not Incorporated in Gretna, LA
| Zip Code | % Self-Employed / Not Incorporated | vs State | vs National | |
| 1. | 70053 | 6.8% | 6.3%(+0.482)#190 | 5.8%(+0.959)#13,657 |
| 2. | 70056 | 5.2% | 6.3%(-1.05)#268 | 5.8%(-0.573)#18,742 |
1
Common Questions
What are the Top Zip Codes with the Highest Percentage of Self-Employed / Not Incorporated in Gretna, LA?
Top Zip Codes with the Highest Percentage of Self-Employed / Not Incorporated in Gretna, LA are:
What zip code has the Highest Percentage of Self-Employed / Not Incorporated in Gretna, LA?
70053 has the Highest Percentage of Self-Employed / Not Incorporated in Gretna, LA with 6.8%.
What is the Percentage of Self-Employed / Not Incorporated in Gretna, LA?
Percentage of Self-Employed / Not Incorporated in Gretna is 7.1%.
What is the Percentage of Self-Employed / Not Incorporated in Louisiana?
Percentage of Self-Employed / Not Incorporated in Louisiana is 6.3%.
What is the Percentage of Self-Employed / Not Incorporated in the United States?
Percentage of Self-Employed / Not Incorporated in the United States is 5.8%.